Hybrid Selection and Agronomic Management to Lessen the Continuous Corn Yield Penalty


Department of Crop Sciences, University of Illinois, Urbana, IL 61801, USA
*
Author to whom correspondence should be addressed.
Agronomy 2018, 8(10), 228; https://0-doi-org.brum.beds.ac.uk/10.3390/agronomy8100228
Submission received: 11 September 2018
/
Revised: 9 October 2018
/
Accepted: 12 October 2018
/
Published: 16 October 2018
(This article belongs to the Special Issue Environmental and Management Factor Contributions to Maize Yield)
Abstract
:Yield reductions occur when corn (Zea mays L.) is continuously grown compared to when it is rotated with soybean [Glycine max (L.) Merr.]; primarily due to soil nitrogen availability, corn residue accumulation, and the weather. This study was conducted to determine if a combination of agronomic practices could help overcome these causative factors of the continuous corn yield penalty (CCYP) to obtain increased corn yields. Field experiments conducted during 2014 and 2015 at Champaign, IL, U.S.A. assessed the yield penalty associated with continuous corn verses long-term corn following soybean. Agronomic management was assessed at a standard level receiving only a base rate of nitrogen fertilizer, and compared to an intensive level, which consisted of additional N, P, K, S, Zn, and B fertility at planting, sidedressed nitrogen fertilizer, and a foliar fungicide application. Two levels of plant population (79,000 verses 111,000 plants ha−1) and eight different commercially-available hybrids were evaluated each year. Across all treatments, the CCYP was 1.53 and 2.72 Mg ha−1 in 2014 and 2015, respectively. Intensive agronomic management improved grain yield across rotations (2.17 Mg ha−1 in 2014 and 2.28 Mg ha−1 in 2015), and there was a 40 to 60% greater yield response to intensive management in continuous corn verses the corn-soybean rotation, suggesting intensified management as a method to mitigate the CCYP. With select hybrids, intensive management reduced the CCYP by 30 to 80%. Agronomic management and hybrid selection helped alleviate the CCYP demonstrating continuous corn can be managed for better productivity.
1. Introduction
Crop rotation is a decision that can affect the productivity and profitability of agriculture production systems. Global trade tentions and crop demand can alter commodity prices that can allow grain price to offset typical lost productivity of corn monocropping. The grain yield reduction when corn is grown continuously (corn grown after previous-crop corn, i.e., continuous corn) compared to when it is rotated with soybean has been widely reported [1,2,3,4,5,6,7,8,9,10]. Factors primarily contributing to the continuous corn yield penalty (CCYP) are soil nitrogen availability or immobilization, residue accumulation, and the weather [9]. The consequence of adverse environmental effects are more determential on continuous corn grain yield than corn grown in rotation with soybean [9,11,12]. Environments with minimal rainfall have been documented to increase the magnitude of the CCYP [1,3,13,14], along with cooler than average spring temperatures [12], and excessive warmth during the summer [9,12]. Although weather cannot be controlled, there are many crop inputs that increase yields, and may mitigate the CCYP, including hybrid selection, plant population, fertilizer, and foliar fungicides.
Yield potential is greater with modern corn hybrids as a result of improved tolerance to the stresses, such as those associated with increased plant population, reduced soil nitrogen, and low soil moisture [15,16,17,18,19,20]. Hybrids vary in their growth and yield response to different management factors, including crop rotation [2,21]. Yet, the greatest yield potential cannot be achieved with newer corn genetics unless grown at higher plant populations than older corn genetics [18,22]. Nitrogen (N) and phosphorus (P) use efficiency [23,24], water-use efficiency [25], and the value of fungicide and insecticide applications, have been shown to improve with increased planting population. Future improvement of corn yield will focus on increased tolerance to even higher plant populations, due to corn’s inadequate input use at lower plant populations [17]. However, increased plant population results in a more stressful environment, which could exacerbate the yield-reducing effects of continuously-grown corn.
Nitrogen is the nutrient required in the greatest quantities for corn [26] and is the most frequently limited nutrient for corn production [27]. After N, the second highest quantity of mineral nutrient acquired by corn during the growing season is potassium (K) [26]. Additionally, phosphorus (P) is the least mobile macronutrient and least available in the soil [28]; however, P has the highest nutrient removal rate from the field at harvest with corn grain [26]. Other nutrients found to limit U.S. Corn Belt yields are sulfur (S), zinc (Zn), and boron (B) [29,30,31,32,33,34].
A more recent tool for increasing grain yields is through foliar fungicide applications [35,36]. Strobilurin fungicides are effective against fungal pathogens that induce foliar fungal diseases in susceptible corn germplasm [37]. Corn residue on the soil surface from previous crops can serve as an overwintering inoculum for several important foliar diseases, such as grey leaf spot (Cercospora zeae-maydis) and northern leaf blight (Exserohilum turcicum) [38]. Residue accumulation can increase through continuous corn rotations [2,9], no- or reduced-tillage [39], higher plant density [40], and greater grain yields [41]. Furthermore, foliar protection by a strobilurin fungicide has also been documented to increase grain yield even when fungal disease is not present [35].
Intelligent intensification of agronomic management, including hybrid selection, and additional plant population, fertilizer, and fungicide application, may offset the negative causative effects of continuously grown corn [5,42] and promote greater yields [43]. The objectives of this research were to (i) demonstrate the CCYP and quantify the impact of different crop management practices on the reduction of the CCYP, (ii) determine the effect of these management factors on in-season biomass accumulation and plant health, and (iii) assess the effect of these practices on yield components to ascertain when these yield responses are occurring. To achieve these objectives, multiple corn hybrids were grown under two crop rotations (previous crop corn verses soybean), at two population densities and crop management levels (standard verses intensive). In this trial, intensive management (i.e., high input) encompassed additional nitrogen fertilizer, broadcast (i.e., K and B source) and banded (i.e., P, S, Zn and N source) fertility, and a foliar fungicide.
2. Materials and Methods
2.1. Agronomic Practices
Field experiments were conducted in 2014 and 2015 at Champaign, IL, U.S.A. using a long-term site dedicated to crop rotation. Due to the rotation treatment in this study, two comparable field sites of approximately 2 ha each were established within 4.5 km of each other and predominantly (>75%) consisted of a Flanagan silt loam (a fine, smectitic, mesic Aquic Argiudoll) with 0 to 2% slope. The sites were tile drained and unirrigated. The preplanting soil properties at the 0- to 15-cm depth for 2014 and 2015 included, respectively, 39 and 41 g kg−1 organic matter, pH 6.1 and 5.5, 19 and 37.1 mg kg−1 P, and 101 and 126 mg kg−1 K. The minerals P and K were extracted using Mehlich III solution. The study alternated between the two field sites each year, generating for this study 11th (2014) or 13th (2015) year continuous corn vs. long-term corn following soybean rotation. The 11th and 13th year continuous corn were considered as similar treatments in line with other rotational experiments [3,14]. The setup site (the site not used for the current year) established the replicated blocks of corn and soybean that served as the previous crop for the following year’s experiment. The corn and soybean blocks in the setup site were maintained with minimal crop management inputs through maturity, harvested, and tilled in preparation for the upcoming year’s study. Individual experimental plots consisted of four rows, 5.3-m in length with 76-cm spacing, and planted with a precision ALMACO SeedPro 360 research plot planter (Nevada, IA, USA). Treatments were arranged in a split-split plot in a randomized complete block design with four replications; crop rotation was the main plot and the subplot was hybrid with a factorial arrangement input level and population at the sub-sub plot level.
The hybrids evaluated represented a range of maturities (106- to 113-day relative maturity; RM), as well as two seed brands, that represented varying genetic backgrounds and potential tolerance to continuous corn. In 2014, the hybrids grown included DKC58-87SSRIB (108 RM), DKC60-67RIB (110 RM), DKC62-08 RIB (112 RM), DKC64-87RIB (114 RM), DKC63-33RIB (113 RM), 209-53STXRIB (109 RM), 212-86STXRIB (112 RM), and DKC63-55RIB (113 RM) [Bayer, Leverkusen, Germany]; hybrids grown in 2015 included 5415SS (106 RM), 5887VT3P (108 RM), 5975VT3P (109 RM), 6110SS (110 RM), 6065SS (111 RM), 6265SS (112 RM), 6594SS (113 RM), and 6640VT3P (113 RM) [WinField United, LLC., Arden Hills, MN, USA].
Tillage included a chisel plow in fall with field cultivations in spring for entire seedbed preparation. Plots were planted on 27 April 2014 and 24 April 2015 to achieve an approximate final stand of 79,000 or 111,000 plants ha−1, denoted as standard and high density, respectively. All plots received an in-furrow application of tefluthrin ((1S,3S)-2,3,5,6-tetrafluoro-4-methylbenzyl 3-((Z)-2-chloro-3,3,3-trifluoroprop-1-en-1-yl)-2,2-dimethylcyclopropanecarboxylate) at a rate of 0.11 kg a.i. ha−1 for additional control of seedling insect pests. Weed control consisted of a pre-emergence application of S-metolachlor (2-chloro-N-(2-ethyl-6-methylphenyl)-N-(2-methoxy-1-methylethyl)acetamide), atrazine (6-chloro-N-ethyl-N′-(1-methylethyl)-1,3,5-triazine-2,4-diamine), and mesotrione ([2-[4-(methylsulfonyl)-2-nitrobenzoyl]-1,3-cyclohexanedione), and a post-emergence application of glyphosate [N-(phosphonomethyl)glycine].
One week before planting, 202 kg N ha−1 as urea ammonium nitrate was applied to all plots and incorporated by shallow cultivation. The standard management treatment only received this N fertilizer. The additional products utilized in the intensive management system included additional fertilizer (containing N, P, K, S, Zn, and B) and a foliar fungicide application. Immediately prior to planting the intensive management plots, 112 kg P2O5 ha−1 was banded (10–15 cm beneath the row) by a toolbar fitted with Dawn Equipment 6000 Series Universal Fertilizer Applicators (Dawn Equipment, Sycamore, IL, USA) as MESZ [MicroEssentials SZ; 12-40-0-10S-1Zn] (The Mosaic Company, Plymouth, MN, USA) supplying an additional 34 kg N ha−1, 28 kg S ha−1, and 2.8 kg Zn ha−1. Additionally at planting, 84 kg K2O ha−1 was broadcast applied (Aspire, 0-0-58-0.5B, The Mosaic Company, Plymouth, MN, USA) supplying an additional 0.4 kg B ha−1. At the V6 growth stage (six fully formed leaves), a side-dress application of 67 kg N ha−1 was applied to these plots as urea with urease inhibitors [CO(NH2)2 + n-(n-butyl) thiophosphoric triamide; Agrotain urea; 46-0-0] (Koch Agronomic Services, LLC, Wichita, KS, USA) on 6 June 2014 and 4 June 2015. When plants were approximately between the VT to R1 growth stages (tasseling to silk emergence) (6 June 2014 and 13 July 2015), intensive management plots received an application of Headline AMP (BASF, Florham Park, NJ, USA), a product containing pyraclostrobin (carbamic acid, [2-[[[1-(4-chlorophenyl)-1H-pyrazol-3-yl]oxy]methyl]phenyl]methoxy-, methyl ester) and metconazole (5-[(4-chlorophenyl)methyl]-2,2-dimethyl-1-(1H-1,2,4-triazol-1-ylmethyl)cyclopentanol), at the labeled rates of 0.15 and 0.06 kg a.i. ha−1, respectively. The fungicide was applied using a CO2-pressurized backpack sprayer via an aqueous suspension at 140 L H2O ha−1 and mixed with the surfactant MasterLock (WinField Solutions, LLC, St. Paul, MN, USA) at 0.45 kg ha−1.
2.2. Plant Biomass Samplings, Health Assessment, and Harvest
To evaluate seasonal aboveground biomass, plants were sampled at two growth stages: V6 (six leaves with collars visible) and R6 (physiological maturity) [44]. Corn tissue sampling was conducted on 2 June 2014 (V6), 3 June 2015 (V6), 9 September 2014 (R6), and 31 August 2015 (R6). Sampling consisted of manually excising plants from the outer two rows at V6 (10 plants per plot), and from the center two rows of each plot at R6 (6 plants per plot) to determine biomass. Plants at the V6 growth stage were dried to 0% moisture and weighed. The plants at R6 were partitioned into grain and stover (including husk) components, and biomass was determined by weighing the total fresh stover then processing it through a wood chipper (BC600XL, Vermeer Corporation, Pella, IA, USA) to obtain representative stover subsamples. The stover subsamples were immediately weighed to determine aliquot fresh weight, and then weighed again after drying to 0% moisture in a forced air oven at 75 °C, to determine subsample aliquot dry weight and calculate dry biomass. Corn ears were dried and then weighed to obtain grain and cob weight. The grain was removed using a corn sheller (AEC Group, St. Charles, IA, USA) and analyzed for moisture content using a moisture reader (Dickey John, GSF, Ankeny, IA, USA). Cob weight was obtained by difference, and dry stover and cob weights were summed to calculate the overall R6 stover biomass. All biomass and grain weight measurements are presented on a 0 g kg−1 moisture concentration basis.
To assess treatment effects on plant health, leaf greenness was measured at the R2 growth stage (kernel blister) (29 July 2014 and 20 July 2015) using a Minolta SPAD-502 chlorophyll meter (Spectrum Technologies, East-Plainfield, IL, USA), on the lamina at the midleaf region of five ear leaves (with no lesions) per plot. SPAD values were used to estimate differences in leaf N concentration among treatments, given that N is a main element in chlorophyll molecules, and therefore related to leaf greenness [45].
Plant stand counts were tallied to confirm plant populations at the R6 plant growth stage. The center two rows of each plot were mechanically harvested for determination of grain yield at physiological maturity, and yield values are presented at 0% moisture. Grain subsamples from each plot were collected from the plot combine at harvest and 300 randomly selected kernels were weighed to estimate average individual kernel weight, also expressed at 0% moisture. Kernel number was estimated by dividing grain yield by the average individual kernel weight of each plot.
2.3. Statistical Analysis
Biomass accumulation, leaf greenness, grain yield, and yield Fcomponents (kernel number and kernel weight) were analyzed using the PROC MIXED procedure [46]. All units are expressed on a 0 g kg−1 moisture concentration basis. Rotation, hybrid, agronomic management, and population were included as fixed effects and replication as a random effect. Due to differences in years of continuous corn and hybrid, years were analyzed separately. Least square means were separated using the PDIFF option of LSMEANS in SAS PROC MIXED. Unless indicated, fixed effects were considered significant in all statistical calculations if p ≤ 0.05. Pearson’s correlation coefficient was used to evaluate the linear association between grain yield and measured parameters across all treatments and within each rotation, using the CORR procedure of SAS.
3. Results and Discussion
3.1. Temperature and Precipitation
The weather conditions of 2014 and 2015 in Champaign, IL resulted in varied temperatures and levels of precipitation (Table 1). In 2014, temperatures were below-average with above-average precipitation, particularly in June and July. Temperatures were at or below normal in July, August, and September of 2014. Illinois experienced a warm April and May in 2015, with a cooler than average June, July, and August. Rainfall in May 2015 was slightly above average in Champaign, but in June, the whole state of Illinois experienced rainfall amounts breaking records that date back to 1886. Champaign received 122.7 mm of rainfall above the 30-year average. Pollination and grain-filling conditions were good with a drier July and August. Overall, the 2014 and 2015 production years experienced very little weather-induced heat or moisture stress. As a result, conditions were generally conducive to favorable grain yields.
3.2. Plant Biomass Accumulation and Plant Health Assessment
Agronomic input level significantly impacted early season (V6 growth stage) biomass accumulation (Table 2). Compared to standard input, intensive management led to 42 to 56% greater aboveground biomass accumulation when averaged across both planting densities and rotations (Table 3). A significant increase in corn early season biomass accumulation with increased fertilizer inputs is well known [27,47]. Since this sampling was completed immediately prior to the additional sidedressed N, management responses were primarily from the broadcasted K and B and banded P, N, S, and Zn supplied at planting.
When assessed at V6, accumulation of biomass was comparable, but tended to be greater in the continuous corn rotation relative to the corn-soybean rotation, similar to previous reports [48]. Regardless of rotation, the 40% greater planting population of the high population treatment increased the early season biomass accumulation per area by 19 to 20% in both years. Hybrid selection influenced early season biomass accumulation; there was a difference of 108 kg ha−1 and 127 kg ha−1 in 2014 and 2015, respectively, between the smallest and largest hybrids at V6.
At the R2 growth stage, the corn-soybean rotation led to enhanced ear leaf greenness compared to continuous corn (Table 4). In 2014 and 2015, leaf greenness was 59.1 vs. 52.9 and 62.5 vs. 57.9 SPAD relative units from corn-soybean rotation vs. continuous corn, respectively (Table 4). Intensive management increased leaf greenness in continuous corn, but not of those plants grown in the corn-soybean rotation. Increased population reduced the leaf greenness levels. When averaged across the hybrids, the least leaf greenness was measured in continuous corn cultivated with standard agronomic management and the higher planting density.
Hybrid selection also impacted these R2 measurements, thirteen of the sixteen hybrids had significantly reduced ear leaf greenness when grown following corn rather than after soybean, while the other hybrids exhibited that tendency. Greater leaf chlorophyll concentrations and boosted levels of plant N have also been found when corn was rotated with soybean compared to grown continuously, which have been attributed to the greater N availability observed in non-continuous corn systems [49]. Leaf chlorophyll concentration, photosynthetic potential of the plant, and leaf N nutrient status are closely related [50,51,52]. These treatment-induced differences in leaf chlorophyll resulting from cropping system and management level changes suggest that N uptake and N availability play a key role in the continuous corn yield penalty and indicate potential ways to mitigate it.
Stover biomass accumulation at the R6 growth stage was 11% and 17% greater from the intensive management when compared to the standard input level, in 2014 and 2015 respectively (Table 4). On an individual plant basis, the intensive input level led to an additional 17 g plant−1 of dry weight in 2014 and 18 g plant−1 of dry weight in 2015 (data not shown). The increased population treatment provided an additional 32,000 plants ha−1 and resulted in increased overall biomass production per area (Table 4). Conversely, individual plants’ R6 stover accumulation at the two populations were 139 and 125 g plant−1 when grown at 79,000 plants ha−1 compared to 110 and 100 g plant−1 when grown at 111,000 plants ha−1 in 2014 and 2015, respectively (data not shown). Previous crop minimally (p = 0.15 and p = 0.17), or slightly increased final stover biomass with alternating rotation. It has been previously reported that 75% of the time, corn grown after soybean produced greater dry matter than when grown following corn [53]. Combined with the data presented here, these results indicate that corn stover grown with crop rotation will often produce at least similar, if not greater, stover biomass, than when grown continuously.
3.3. Grain Yield and Yield Components
Rotation, hybrid, management, and population treatments significantly influenced grain yield (Table 2). When averaged across all treatment combinations, the CCYP associated with continuous corn compared to first year corn following soybean was 1.53 Mg ha−1 (−13%; p < 0.0001) in 2014 and 2.72 Mg ha−1 (−22%; p = 0.0018) in 2015 (Table 5). Although increased planting densities decreased yield by an average of 0.19 and 0.36 Mg ha−1 in 2014 and 2015, respectively, the continuous corn rotation did not magnify this response as originally predicted. Unexpectedly, the yield reduction associated with increased planting densities tended to be greater in the corn-soybean rotation vs. continuous corn. The increased inter-plant competition of higher planting densities tended to reduce corn yield more when grown under standard management (−0.22 Mg ha−1 in 2014 and −0.65 Mg ha−1 in 2015) compared to when grown under the high input management (−0.16 Mg ha−1 in 2014 and −0.06 Mg ha−1 in 2015, non-significant) when averaged across rotations. The lowest yield was observed when corn was grown after corn with standard agronomic management and the higher plant density.
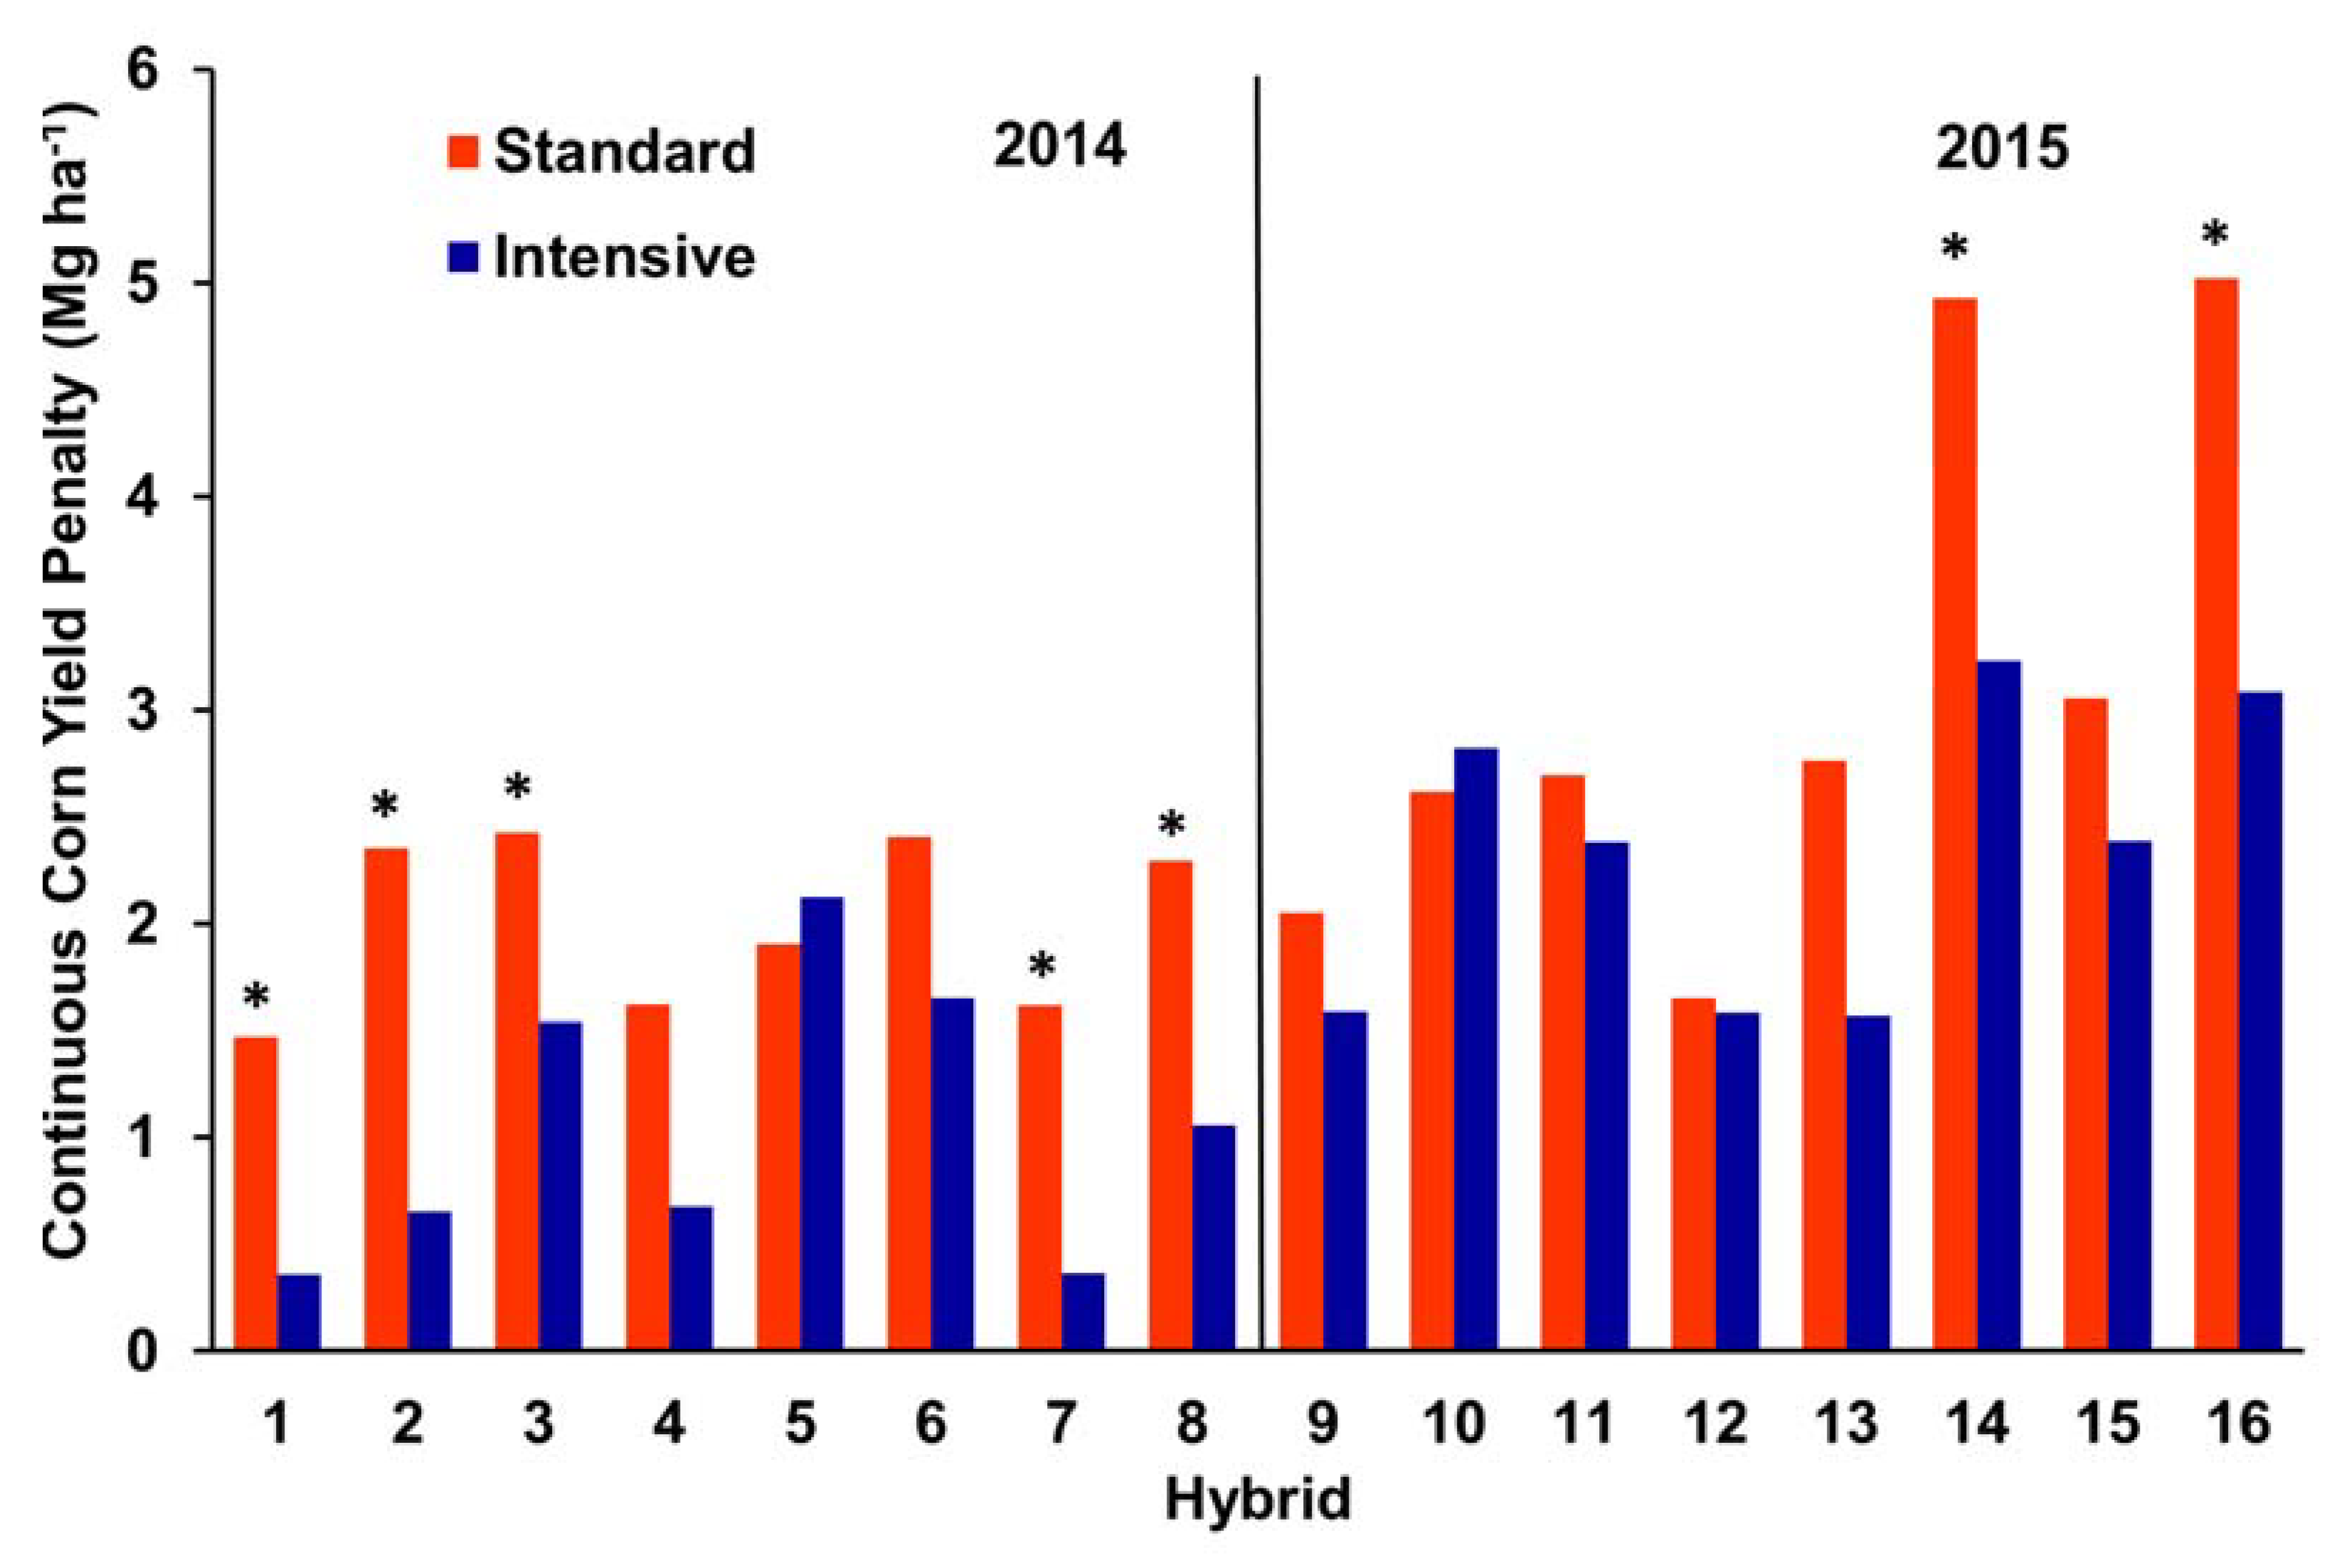
Intensive agronomic management significantly improved grain yield when averaged across crop rotations (2.17 and 2.28 Mg ha−1 in 2014 and 2015, respectively), but the effect was 40–60% greater in continuous corn vs. the corn-soybean rotation (2.65 vs. 1.69 Mg ha−1 in 2014 and 2.67 vs. 1.90 Mg ha−1 in 2015) (Table 5). These findings are consistent with other studies that found additional fertilizer inputs are needed to achieve continuous corn yields that approach or are similar to rotated corn yields [1,27,54]. These data indicate that the continuous corn yield penalty can be ameliorated with agronomic management. Although the highest yields were consistently achieved in the corn-soybean rotation using intensive management and low planting densities, individual hybrids were found to respond differently to management. Select hybrids, for example, were able to nearly overcome the CCYP when grown with intensive management (Figure 1). The CCYP was reduced by 0.89 to 1.93 Mg ha−1 with intensive management for seven hybrids: 6265SS (34%), DKC58-87 (37%), 6640VT3P (38%), DKC64-87 (54%), 212-86STX (72%), 209-53STX (75%), and DKC63-55 (77%).
Grain yield is derived from yield components (i.e., kernel number and individual kernel weight) that may be altered by changes in fertility, planting population, and germplasm [23,55,56]. The improved grain yields as a result of intensified agronomic management increased both kernel number and kernel weight (Table 6). Similarly, the consistently greater yields resulting from the corn-soybean rotation compared to the continuously grown corn yields were derived from a combination of increased kernel number and kernel weight.
When combined, the 40–60% greater yield response in continuous corn vs. corn-soybean rotation when grown with high input management was linked to a greater production in the amount and weight of those kernels. When plants in continuous corn were cultivated with intensive management, kernel weight was equivalent to that of the corn rotated with soybean managed with standard input levels. It has been previously documented that corn in rotation with soybean, regardless of if they were nodulated or non-nondulated, resulted in both larger and more numerous kernels compared to when grown continuously [57]. These results indicate that throughout much of the growing season corn in rotation was more successful at setting and maintaining yield potential than corn following corn. As early as the V5 (five leaf) growth stage, the number of kernel rows is determined, followed by spikelet pairs that produce kernels at V6, with the number of ovules (potential kernels) and the size of the ear set at V12 (12 leaves) [44]. Kernel number can be altered by the quality of pollination or through kernel abortion in response to any stress from environmental conditions or plant competition [58]. Later in the season, the size of the individual kernels is set (R2) followed by the expansion and filling of those kernels with starch [44]. Rotation of corn with soybean increased the grain-filling period or rate of grain-filling that resulted in heavier kernels. Part of this response can be attributed to the additional N availability in rotated corn compared to corn on corn [9,49], which influences both the production and size of kernels [59].
Increased planting populations resulted in minimal yield reductions regardless of the previous crop (Table 5). Under high input management, the yield penalty from the continuous corn rotation was not magnified with the higher planting density. Regardless of rotation, the increased kernel numbers produced per area from higher planting densities was offset by lesser kernel weights (Table 6). These compensatory patterns resulted in no overall yield advantage from the increased planting population. Kernel number produced per area was greater at the plant population that resulted in more grain yield. While individual kernel number per plant has been found to be reduced as plant population was increased, there was, however, a greater kernel number per unit area produced as a result of more harvestable ears at the higher plant population [60].
3.4. Correlations between Crop Growth and Final Grain Yield
Early season plant growth assessments at the V6 growth stage, had a stronger positive correlation to final grain yield in the corn-soybean rotation than in continuous corn (Table 7). Leaf greenness at the R2 growth stage was strongly positively correlated to final grain yield in continuous corn. Similar to previous findings, leaf greenness had this stronger correlation to grain yield when assessed in continuous corn compared to corn in rotation with soybean [61]. Kernel number had a strong to very strong positive correlation to grain yield in the continuous corn plots. Setting the highest potential kernels and decreasing kernel abortion is essential in maintaining and improving grain yield [43]. When corn was rotated with soybean, kernel weight was moderately correlated to grain yield and the correlation was strong when grown continuously. Harvest index, the ratio of grain to total aboveground biomass, was strongly correlated to grain yield in continuous corn. Overall, these correlations show the importance of interactions within the crop throughout the growing season to maintain grain yield potential; with kernel number being determined earlier in the growing season and kernel weight later in crop development.
4. Conclusions
In central Illinois, cropping rotation, hybrid selection, agronomic management, and plant population all significantly influenced the measured parameters in corn, with numerous interactions. The highest yields of this study were achieved in the corn-soybean rotation grown with intensive management and at the standard planting density. The data presented here suggest that the CCYP can be mitigated with intensified management. Without enhanced fertility (i.e., standard management) continuous corn production yielded significantly less grain than corn grown following soybean. Intensive agronomic management increased grain yield by enhancing both kernel number and kernel weight. Through growth responses both pre-and post-pollination, there was a 40–60% greater yield response to intensive management in continuous corn compared to the corn-soybean rotation. As a result of certain genetic predispositions, corn germplasm varied in growth and yield response and magnitude of responses to rotation, input level, and population, emphasizing the importance of hybrid selection in continuous corn acres. When population was increased, continuous corn grain yields were maintained when treated with the high input level. Improvement in crop health (i.e., leaf greenness and biomass accumulation) and productivity was made using both crop rotation and intensive management. Enhanced fertility and leaf protection (i.e., intensive management level) in combination with select hybrids resulted in a multifaceted approach to reduce the CCYP and increase yields.
Author Contributions
Performed experiment, A.M.V.; formal analysis, A.M.V.; writing—original draft, A.M.V.; writing—review and editing, F.E.B.; project administration, F.E.B.
Funding
This research was made possible with partial funding from the National Institute of Food and Agriculture project NC1200 “Regulation of Photosynthetic Processes” and the Illinois AES project 802-908. We also greatly appreciate the support from Crop Sciences, a division of Bayer, Winfield United, and the Mosaic Company.
Acknowledgments
We would like to thank the Crop Physiology Lab personnel for field and data collection, and especially Juliann Seebauer for manuscript preparation.
Conflicts of Interest
The authors declare no conflict of interest.
References
- Peterson, T.A.; Varvel, G.E. Crop yield as affected by rotation and nitrogen rate. III. Corn. Agron. J. 1989, 81, 735–738. [Google Scholar] [CrossRef]
- Meese, B.G.; Carter, P.R.; Oplinger, E.S.; Pendleton, J.W. Corn/soybean rotation effect as influenced by tillage, nitrogen, and hybrid/cultivar. J. Prod. Agric. 1991, 4, 74–80. [Google Scholar] [CrossRef]
- Porter, P.M.; Lauer, J.G.; Lueschen, W.E.; Ford, J.H.; Hoverstad, T.R.; Oplinger, E.S.; Crookston, R.K. Environment affects the corn and soybean rotation effects. Agron. J. 1997, 89, 442–448. [Google Scholar] [CrossRef]
- Howard, D.D.; Chambers, A.Y.; Lessman, G.M. Rotation and fertilization effects on corn and soybean yields and soybean cyst nematode populations in a no-tillage system. Agron. J. 1998, 90, 518–522. [Google Scholar] [CrossRef]
- Katsvairo, T.W.; Cox, W.J. Tillage x rotation x management interactions in corn. Agron. J. 2000, 92, 493–500. [Google Scholar] [CrossRef]
- Pedersen, P.; Lauer, J.G. Corn and soybean response to rotation sequence, row spacing, and tillage system. Agron. J. 2003, 95, 965–971. [Google Scholar] [CrossRef]
- Pikul, J.L., Jr.; Hammack, L.; Riedell, W.E. Corn yield, N use and corn rootworm infestation of rotations in the northern Corn Belt. Agron. J. 2005, 97, 854–863. [Google Scholar] [CrossRef]
- Stanger, T.F.; Lauer, J.; Chavas, J. Long-term cropping systems: The profitability and risk of cropping systems featuring different rotations and nitrogen rates. Agron. J. 2008, 100, 105–113. [Google Scholar] [CrossRef]
- Gentry, L.F.; Ruffo, M.L.; Below, F.E. Identifying factors controlling the continuous corn yield penalty. Agron. J. 2013, 105, 295–303. [Google Scholar] [CrossRef]
- Al-Kaisi, M.M.; Archontoulis, S.V.; Kwaw-Mensah, D.; Miguez, F. Tillage and crop rotation effects on corn agronomic response and economic return at seven Iowa locations. Agron. J. 2015, 107, 1411–1424. [Google Scholar] [CrossRef]
- Varvel, G.E. Monoculture and rotation system effects on precipitation use efficiency in corn. Agron. J. 1994, 86, 204–208. [Google Scholar] [CrossRef]
- Wilhelm, W.W.; Wortmann, C.S. Tillage and rotation interactions for corn and soybean grain yield as aff ected by precipitation and air temperature. Agron. J. 2004, 96, 425–432. [Google Scholar] [CrossRef]
- Raimbault, B.A.; Vyn, T.J. Crop rotation and tillage effects on corn growth and soil structural stability. Agron. J. 1991, 83, 979–985. [Google Scholar] [CrossRef]
- Seifert, C.A.; Roberts, M.J.; Lobell, D.B. Continuous corn and soybean yield penalties across hundreds of thousands of fields. Agron. J. 2017, 109, 541–548. [Google Scholar] [CrossRef]
- Carlone, M.R.; Russell, W.A. Response to plant densities and nitrogen levels for four maize cultivars from different eras of breeding. Crop Sci. 1987, 27, 465–470. [Google Scholar] [CrossRef]
- Sangoi, L.; Gracietti, M.A.; Rampazzo, C.; Bianchetti, P. Response of Brazilian maize hybrids from different eras to changes in plant population. Field Crops Res. 2002, 79, 39–51. [Google Scholar] [CrossRef]
- Tollenaar, M.; Lee, E.A. Yield potential, yield stability and stress tolerance in maize. Field Crops Res. 2002, 75, 161–169. [Google Scholar] [CrossRef]
- Tokatlidis, I.S.; Koutroubas, S.D. A review of maize hybrids’ dependence on high plant populations and its implications for crop yield stability. Field Crops Res. 2004, 88, 103–114. [Google Scholar] [CrossRef]
- Duvick, D.N. The contribution of breeding to yield advances in maize (Zea mays L.). Adv. Agron. 2005, 86, 83–145. [Google Scholar]
- Hammer, G.L.; Dong, Z.; McLean, G.; Doherty, A.; Messina, C.; Schussler, J.; Zinselmeier, C.; Paszkiewicz, S.; Cooper, M. Can changes in canopy and/or root system architecture explain historical maize yield trends in the U.S. Corn Belt? Crop Sci. 2009, 49, 299–312. [Google Scholar] [CrossRef]
- Mastrodomenico, A.T.; Haegele, J.W.; Seebauer, J.R.; Below, F.E. Yield stability differs in commercial maize hybrids in response to changes in plant density, nitrogen fertility, and environment. Crop Sci. 2018, 58, 230–241. [Google Scholar] [CrossRef]
- Tollenaar, M. Physiological basis of genetic improvement of maize hybrids in Ontario from 1959 to 1988. Crop Sci. 1991, 31, 119–124. [Google Scholar] [CrossRef]
- Boomsma, C.R.; Santini, J.B.; Tollenaar, M.; Vyn, T.J. Maize morphological responses to intense crowding and low nitrogen availability: An analysis and review. Agron. J. 2009, 101, 1426–1452. [Google Scholar] [CrossRef]
- Clay, S.A.; Clay, D.E.; Horvath, D.P.; Pullis, J.; Carlson, C.G.; Hansen, S.; Reicks, G. Corn response to competition: Growth alteration vs. yield limiting factors. Agron. J. 2009, 101, 1522–1529. [Google Scholar] [CrossRef]
- Kuchenbuch, R.O.; Gerke, H.H.; Buczko, U. Spatial distribution of maize roots by complete 3D soil monolith sampling. Plant Soil 2009, 315, 297–314. [Google Scholar] [CrossRef]
- Bender, R.R.; Haegele, J.W.; Ruffo, M.L.; Below, F.E. Nutrient uptake, partitioning, and remobilization in modern, transgenic insect-protected maize hybrids. Agron. J. 2013, 105, 161–170. [Google Scholar] [CrossRef]
- Ciampitti, I.A.; Vyn, T.J. Physiological perspectives of changes over time in maize yield dependency on nitrogen uptake and associated nitrogen efficiencies: A review. Field Crops Res. 2012, 133, 48–67. [Google Scholar] [CrossRef]
- Kovar, L.K.; Claasen, N. Soil–root interactions and phosphorus nutrition of plants. In Phosphorus: Agriculture and the Environment; Sims, J.T., Sharpley, A.N., Eds.; Agronomy Monograph Series No. 46; ASA, CSSA, SSSA: Madison, WI, USA, 2005; pp. 379–414. [Google Scholar]
- David, M.B.; Gentry, L.E.; Mitchell, C.A. Riverine response of sulfate to declining atmospheric sulfur deposition in agricultural watersheds. J. Environ. Qual. 2016, 45, 1313–1319. [Google Scholar] [CrossRef] [PubMed]
- Camberato, J.; Casteel, S. Sulfur Deficiency. Purdue Univ. Dep. of Agronomy, Soil Fertility Update. 2017. Available online: http://www.agry.purdue.edu/ext/corn/news/timeless/sulfurdeficiency.pdf (accessed on 16 July 2018).
- Bell, R.W.; Dell, B. Micronutrients in Sustainable Food, Feed, Fibre and Bioenergy Production; International Fertilizer Industry Association: Paris, France, 2008; ISBN 978-2-9523139-3-3. [Google Scholar]
- Alloway, B.J. Soil factors associated with zinc deficiency in crops and humans. Environ. Geochem. Health 2009, 31, 537–548. [Google Scholar] [CrossRef] [PubMed]
- Karlen, D.L.; Flannery, R.L.; Sadler, E.J. Aerial accumulation and partitioning of nutrients by corn. Agron. J. 1988, 80, 232–242. [Google Scholar] [CrossRef]
- Berger, K.C.; Heikkinen, T.; Zube, E. Boron deficiency, a cause of blank stalks and barren ears in corn. Soil Sci. Soc. Am. J. 1957, 21, 629–632. [Google Scholar] [CrossRef]
- Jeschke, M.; Doerge, T. Management of foliar diseases in corn with fungicides. Crop Insights 2010, 18, 1–4. [Google Scholar]
- Bartlett, D.W.; Clough, J.M.; Godwin, J.R.; Hall, A.A.; Hamer, M.; Parr-Dobrzanski, B. The strobilurin fungicides. Pest Manag. Sci. 2002, 58, 649–662. [Google Scholar] [CrossRef] [PubMed]
- Grossmann, K.; Retzlaff, G. Bioregulatory effects of the fungicidal strobilurin kresoxim-methyl in wheat (Triticum aestivum). Pestic. Sci. 1997, 50, 11–20. [Google Scholar] [CrossRef]
- Wise, K.; Mueller, D. Are fungicides no longer just for fungi? An analysis of foliar fungicide use in corn. Am. Phytopathol. Soc. 2011. [Google Scholar] [CrossRef]
- Bockus, W.W.; Shroyer, J.P. The impact of reduced tillage on soilborne plant pathogens. Annu. Rev. Phytopathol. 1998, 36, 485–500. [Google Scholar] [CrossRef] [PubMed]
- Shapiro, C.A.; Wortmann, C.S. Corn response to nitrogen rate, row spacing, and plant density in eastern Nebraska. Agron. J. 2006, 98, 529–535. [Google Scholar] [CrossRef]
- Graham, R.L.; Nelson, R.; Sheehan, J.; Perlack, R.D.; Wright, L.L. Current and potential U.S. corn stover supplies. Agron. J. 2007, 99, 1–11. [Google Scholar] [CrossRef]
- Riedell, W.E.; Schumacher, T.E.; Clay, S.A.; Ellsbury, M.M.; Pravecek, M.; Evenson, P.D. Corn and soil fertility responses to crop rotation with low, medium, or high inputs. Crop Sci. 1998, 38, 427–433. [Google Scholar] [CrossRef]
- Ruffo, M.L.; Gentry, L.F.; Henninger, A.S.; Seebauer, J.R.; Below, F.E. Evaluating management factor contributions to reduce corn yield gaps. Agron. J. 2015, 107, 495–505. [Google Scholar] [CrossRef]
- Abendroth, L.J.; Elmore, R.W.; Boyer, M.J.; Marlay, S.K. Corn Growth and Development; PMR 1009; Iowa State University: Ames, IA, USA, 2011. [Google Scholar]
- Daughtry, C.S.; Walthall, C.L.; Kim, M.S.; De Colstoun, E.B.; McMurtrey, J.E., III. Estimating corn leaf chlorophyll concentration from leaf and canopy reflectance. Remote Sens. Environ. 2000, 74, 229–239. [Google Scholar] [CrossRef]
- Statistical Analysis System (SAS) Version SAS/STAT 9.4; SAS Institute Inc.: Cary, NC, USA, 2012.
- Riedell, W.E.; Pikul, J.L.; Jaradat, A.A.; Schumacher, T.E. Crop rotation and nitrogen input effects on soil fertility, maize mineral nutrition, yield, and seed composition. Agron. J. 2009, 101, 870–879. [Google Scholar] [CrossRef]
- Crookston, R.K.; Kurle, J.E.; Copeland, P.J.; Ford, J.H.; Jueschen, W.E. Rotational cropping sequence affects yield of corn and soybean. Agron. J. 1991, 83, 108–113. [Google Scholar] [CrossRef]
- Ennin, S.A.; Clegg, M.D. Effect of soybean plant population in a soybean and maize rotation. Agron. J. 2001, 93, 396–403. [Google Scholar] [CrossRef]
- Filella, I.; Serrano, L.; Serra, J.; Penuelas, J. Evaluating wheat nitrogen status with canopy reflectance indices and discriminant analysis. Crop Sci. 1995, 35, 1400–1405. [Google Scholar] [CrossRef]
- Moran, J.A.; Mitchell, A.K.; Goodmanson, G.; Stockburger, K.A. Differentiation among effects of nitrogen fertilization treatments on conifer seedlings by foliar reflectance: A comparison of methods. Tree Physiol. 2000, 20, 1113–1120. [Google Scholar] [CrossRef] [PubMed]
- Hatfield, J.L.; Gitelson, A.A.; Schepers, J.S.; Walthall, C.L. Application of spectral remote sensing for agronomic decisions. Agron. J. 2008, 100, S117–S131. [Google Scholar] [CrossRef]
- Sindelar, A.J.; Schmer, M.R.; Jin, V.L.; Wienhold, B.J.; Varvel, G.E. Long-term corn and soybean response to crop rotation and tillage. Agron. J. 2015, 107, 2241–2252. [Google Scholar] [CrossRef]
- Varvel, G.E.; Wilhelm, W.W. Soybean nitrogen contribution to corn and sorghum in western Corn Belt rotations. Agron. J. 2003, 95, 1220–1225. [Google Scholar] [CrossRef]
- D’Andrea, K.E.; Otegui, M.E.; Cirilo, A.G. Kernel number determination differs among maize hybrids in response to nitrogen. Field Crops Res. 2008, 105, 228–239. [Google Scholar] [CrossRef]
- Cox, W.J. Whole-plant physiological and yield responses of maize to plant density. Agron. J. 1996, 88, 489–496. [Google Scholar] [CrossRef]
- Bergerou, J.A.; Gentry, L.E.; David, M.B.; Below, F.E. Role of N 2 fixation in the soybean N credit in maize production. Plant Soil 2004, 262, 383–394. [Google Scholar] [CrossRef]
- Ritchie, S.W.; Hanway, J.J.; Benson, G.O. How a Corn Plant Develops; Special Report No. 48; Iowa State Univ.: Ames, IA, USA, 1986. [Google Scholar]
- Pearson, C.J.; Jacobs, B.C. Yield components and nitrogen partitioning of maize in response to nitrogen before and after anthesis. Aust. J. Agric. Res. 1987, 38, 1001–1009. [Google Scholar] [CrossRef]
- Hashemi-Dezfouli, A.; Herbert, S.J. Intensifying plant density response of corn with artificial shade. Agron. J. 1992, 84, 547–551. [Google Scholar] [CrossRef]
- Attia, A.; Shapiro, C.; Kranz, W.; Mamo, M.; Mainz, M. Improved yield and nitrogen use efficiency of corn following soybean in irrigated sandy loams. Soil Sci. Soc. Am. J. 2015, 79, 1693–1703. [Google Scholar] [CrossRef]
Figure 1.
The yield penalty (yield difference between corn-soybean and continuous corn rotation) as influenced by two levels of management (standard vs. intensive) at Champaign, IL during 2014 (hybrids 1–8) and 2015 (hybrids 9–16). Hybrids 1–16 follow the order hybrids were presented in Table 3, Table 4, Table 5 and Table 6. Values represent the average of two planting populations. * CCYP (continuous corn yield penalty) significantly different at p ≤ 0.05, due to crop management for each hybrid.


Table 1.
Monthly weather data for Champaign, IL, USA during the production seasons of 2014 and 2015. Temperature is the average daily air temperature and precipitation is the average monthly accumulated rainfall. Values were obtained from the U.S. National Oceanic and Atmospheric Administration and values in parentheses are the deviations from the 30-year average (1981–2010).
| Year | Month | |||||
|---|---|---|---|---|---|---|
| April | May | June | July | Aug. | Sept. | |
| 2014 | ||||||
| Temperature, °C | 11.5 (0.4) | 17.7 (0.8) | 22.8 (0.4) | 21.0 (−2.8) | 23.0 (0.0) | 18.1 (−0.9) |
| Precipitation, mm | 100.1 (6.6) | 111.3 (−13) | 208.5 (98.3) | 221.2 (101.9) | 38.6 (−61.2) | 87.4 (7.9) |
| 2015 | ||||||
| Temperature, °C | 12.0 (1.1) | 18.6 (1.7) | 22.2 (−0.1) | 23.0 (−0.8) | 22.1 (−0.9) | 21.0 (2.0) |
| Precipitation, mm | 91.9 (−1.5) | 154.2 (30.0) | 232.9 (122.7) | 107.2 (−12.2) | 80.3 (−19.6) | 163.6 (84.1) |
Table 2.
Tests of fixed sources of variation on early and late season biomass accumulation, in-season leaf greenness, final grain yield, and yield components for the continuous corn trial conducted at Champaign, IL during 2014 and 2015. Rotation (R), hybrid (H), management (M), and population (P) served as fixed effects.
| Year/Fixed Effect | V6 Biomass | R2 SPAD | R6 Stover | Grain Yield | Kernel Number | Kernel Weight |
|---|---|---|---|---|---|---|
| p > F | ||||||
| 2014 | ||||||
| Rotation (R) | 0.3407 | 0.0004 | 0.1487 | <0.0001 | 0.0670 | 0.0121 |
| Hybrid (H) | 0.0015 | 0.0186 | 0.0827 | <0.0001 | <0.0001 | <0.0001 |
| R × H | 0.0270 | 0.4260 | 0.1861 | 0.0057 | 0.0205 | 0.1536 |
| Management (M) | <0.0001 | <0.0001 | <0.0001 | <0.0001 | <0.0001 | <0.0001 |
| R × M | 0.4083 | <0.0001 | 0.6366 | <0.0001 | 0.0003 | 0.1309 |
| H × M | 0.1088 | 0.5741 | 0.4072 | 0.0971 | 0.4142 | 0.3174 |
| R × H × M | 0.0302 | 0.1897 | 0.7955 | 0.0665 | 0.1201 | 0.4127 |
| Population (P) | <0.0001 | <0.0001 | 0.0053 | 0.0093 | 0.0104 | <0.0001 |
| R × P | 0.4215 | 0.0133 | 0.8181 | 0.2644 | <0.0001 | <0.0001 |
| H × P | 0.2080 | 0.7575 | 0.6459 | 0.0998 | 0.0635 | 0.5584 |
| R × H × P | 0.8140 | 0.7686 | 0.6102 | 0.8172 | 0.0474 | 0.0786 |
| M × P | 0.1084 | 0.2811 | 0.0919 | 0.6485 | 0.2868 | 0.4939 |
| R × M × P | 0.2410 | 0.0795 | 0.1966 | 0.6369 | 0.9993 | 0.7101 |
| H × M × P | 0.5074 | 0.5361 | 0.9915 | 0.6744 | 0.8588 | 0.9917 |
| R × H × M × P | 0.0442 | 0.6956 | 0.9135 | 0.1519 | 0.3386 | 0.6266 |
| 2015 | ||||||
| Rotation (R) | 0.0469 | 0.0099 | 0.1655 | 0.0018 | 0.0016 | 0.0022 |
| Hybrid (H) | 0.0150 | 0.1512 | 0.0278 | 0.0453 | <0.0001 | <0.0001 |
| R × H | 0.5081 | 0.6912 | 0.7316 | 0.1713 | 0.0587 | 0.1215 |
| Management (M) | <0.0001 | <0.0001 | <0.0001 | <0.0001 | <0.0001 | <0.0001 |
| R × M | 0.1449 | <0.0001 | 0.2669 | 0.0015 | 0.0013 | 0.0228 |
| H × M | 0.0223 | 0.0154 | 0.6895 | 0.4599 | 0.1188 | 0.0017 |
| R v H × M | 0.1975 | 0.3037 | 0.1246 | 0.2247 | 0.0265 | 0.6136 |
| Population (P) | <0.0001 | <0.0001 | <0.0001 | 0.0026 | <0.0001 | <0.0001 |
| R × P | 0.4649 | 0.3326 | 0.5698 | 0.7829 | 0.9614 | 0.0960 |
| H × P | 0.5189 | 0.3828 | 0.5145 | 0.0997 | 0.1563 | <0.0001 |
| R × H × P | 0.8911 | 0.2649 | 0.3833 | 0.0915 | 0.3801 | 0.2294 |
| M × P | 0.7745 | 0.5340 | 0.2152 | 0.0140 | 0.0025 | 0.6258 |
| R × M × P | 0.9055 | 0.6813 | 0.9914 | 0.2584 | 0.5078 | 0.3064 |
| H × M × P | 0.5882 | 0.3390 | 0.5763 | 0.9153 | 0.7468 | 0.7456 |
| R × H × M × P | 0.7129 | 0.1925 | 0.9442 | 0.1882 | 0.0234 | 0.3173 |
Table 3.
Aboveground biomass accumulation as influenced by crop rotation, hybrid, agronomic input level, and population at Champaign, IL in 2014 and 2015. All values are reported at 0 g kg−1 moisture concentration.
Table 3.
Aboveground biomass accumulation as influenced by crop rotation, hybrid, agronomic input level, and population at Champaign, IL in 2014 and 2015. All values are reported at 0 g kg−1 moisture concentration.
| V6 Shoot Biomass | R6 Stover Biomass | ||||||||
|---|---|---|---|---|---|---|---|---|---|
| Input Level § | |||||||||
| Standard | Intensive | Standard | Intensive | ||||||
| Year/ | Planting Density (× 1000 plants ha−1) ¶ | ||||||||
| Rotation † | Hybrid ‡ | 79 | 111 | 79 | 111 | 79 | 111 | 79 | 111 |
| ------------------------------------------------------- kg ha−1 ------------------------------------------------------- | |||||||||
| Cont. Corn | 2014 | ||||||||
| 209-53STX | 382 | 513 | 557 | 789 | 9561 | 11,180 | 12,710 | 12,118 | |
| 212-86STX | 332 | 516 | 651 | 855 | 11,224 | 12,942 | 12,750 | 12,650 | |
| DKC58-87 | 366 | 452 | 565 | 754 | 10,552 | 12,009 | 12,176 | 11,483 | |
| DKC60-67 | 316 | 548 | 653 | 683 | 9276 | 10,774 | 11,711 | 12,037 | |
| DKC62-08 | 391 | 570 | 852 | 864 | 12,038 | 11,061 | 12,357 | 10,543 | |
| DKC63-33 | 407 | 417 | 741 | 874 | 9144 | 10,334 | 11,638 | 11,321 | |
| DKC63-55 | 362 | 480 | 657 | 763 | 10,337 | 12,096 | 12,150 | 12,923 | |
| DKC64-87 | 423 | 525 | 630 | 836 | 9170 | 11,226 | 11,331 | 13,034 | |
| 2014 Means | 372 | 503 | 663 | 802 | 10,163 | 11,453 | 12,103 | 12,014 | |
| 2015 | |||||||||
| 5415SS | 279 | 332 | 661 | 931 | 8073 | 9337 | 9973 | 11,581 | |
| 5887VT3P | 315 | 372 | 614 | 890 | 7728 | 8655 | 8743 | 9034 | |
| 5975VT3P | 290 | 372 | 793 | 827 | 8500 | 8523 | 9303 | 10,623 | |
| 6065SS | 310 | 379 | 719 | 986 | 9400 | 9705 | 11,717 | 11,205 | |
| 6110SS | 333 | 400 | 843 | 1025 | 8628 | 7933 | 9640 | 10,652 | |
| 6265SS | 421 | 587 | 963 | 1017 | 8799 | 8813 | 10,327 | 11,404 | |
| 6594SS | 485 | 565 | 680 | 1036 | 7648 | 9130 | 9570 | 10,853 | |
| 6640VT3P | 332 | 474 | 789 | 940 | 6849 | 7684 | 10,070 | 11,100 | |
| 2015 Means | 346 | 435 | 758 | 957 | 8203 | 8722 | 9918 | 10,806 | |
| Corn-Soybean | 2014 | ||||||||
| 209-53STX | 357 | 473 | 630 | 817 | 9082 | 9416 | 11,814 | 12,731 | |
| 212-86STX | 321 | 402 | 671 | 809 | 10,769 | 11,096 | 11,438 | 12,962 | |
| DKC58-87 | 322 | 407 | 559 | 684 | 10,771 | 11,601 | 11,637 | 12,728 | |
| DKC60-67 | 315 | 370 | 598 | 751 | 9745 | 11,940 | 10,921 | 12,088 | |
| DKC62-08 | 361 | 413 | 569 | 712 | 10,943 | 12,799 | 13,470 | 12,799 | |
| DKC63-33 | 395 | 486 | 712 | 751 | 10,206 | 10,363 | 12,890 | 12,599 | |
| DKC63-55 | 295 | 431 | 618 | 819 | 10,761 | 11,618 | 11,901 | 13,019 | |
| DKC64-87 | 423 | 541 | 706 | 887 | 11,523 | 11,356 | 12,211 | 12,268 | |
| 2014 Means | 349 | 440 | 633 | 779 | 10,475 | 11,274 | 12,035 | 12,649 | |
| 2015 | |||||||||
| 5415SS | 327 | 376 | 812 | 785 | 9210 | 9814 | 10,489 | 10,709 | |
| 5887VT3P | 217 | 316 | 658 | 958 | 8525 | 8262 | 10,581 | 10,324 | |
| 5975VT3P | 287 | 317 | 747 | 880 | 8264 | 8435 | 9160 | 11,466 | |
| 6065SS | 269 | 376 | 651 | 829 | 9512 | 9942 | 11,232 | 11,547 | |
| 6110SS | 336 | 361 | 747 | 921 | 8323 | 8907 | 8787 | 10,009 | |
| 6265SS | 314 | 361 | 785 | 913 | 9018 | 9484 | 10,535 | 10,544 | |
| 6594SS | 404 | 432 | 673 | 952 | 9054 | 8815 | 11,254 | 11,270 | |
| 6640VT3P | 296 | 412 | 693 | 760 | 8896 | 9977 | 9882 | 11,789 | |
| 2015 Means | 306 | 369 | 721 | 875 | 8850 | 9205 | 10,240 | 10,957 | |
† Rotation V6 LSD (p ≤ 0.05) = nonsignificant (NS) in 2014 and 54 kg ha−1 in 2015; Rotation R6 LSD (p ≤ 0.05) = NS. ‡ Hybrid V6 LSD (p ≤ 0.05) = 48 kg ha−1 in 2014 and 68 kg ha−1 in 2015; Hybrid R6 LSD (p ≤ 0.05) = NS in 2014 and 900 kg ha−1 in 2015. § Input level V6 LSD (p ≤ 0.05) = 19 kg ha−1 in 2014 and 34 kg ha−1 in 2015; Input level R6 LSD (p ≤ 0.05) = 455 kg ha−1 in 2014 and 291 kg ha−1 in 2015. ¶ Plant density V6 LSD (p ≤ 0.05) = 19 kg ha−1 in 2014 and 34 kg ha−1 in 2015; Plant density R6 LSD (p ≤ 0.05) = 455 kg ha−1 in 2014 and 292 kg ha−1 in 2015.
Table 4.
Leaf greenness for hybrids as influenced by crop rotation, agronomic input level, and population at the R2 growth stage of the ear leaf. Hybrids were grown in continuous corn and following soybean rotations at Champaign, IL in 2014 and 2015.
Table 4.
Leaf greenness for hybrids as influenced by crop rotation, agronomic input level, and population at the R2 growth stage of the ear leaf. Hybrids were grown in continuous corn and following soybean rotations at Champaign, IL in 2014 and 2015.
| Crop Rotation ‡ | ||||||||
|---|---|---|---|---|---|---|---|---|
| Continuous Corn | Corn-Soybean | |||||||
| Input Level § | ||||||||
| Standard | Intensive | Standard | Intensive | |||||
| Year/ | Plant Density (plant ha−1) ¶ | |||||||
| Hybrid † | 79,000 | 111,000 | 79,000 | 111,000 | 79,000 | 111,000 | 79,000 | 111,000 |
| --------------------------------- SPAD relative unit --------------------------------- | ||||||||
| 2014 | ||||||||
| 209-53STX | 58.1 | 50.1 | 60.6 | 56.2 | 61.9 | 59.4 | 63.0 | 59.4 |
| 212-86STX | 56.1 | 47.1 | 60.0 | 57.1 | 62.4 | 57.9 | 63.0 | 59.4 |
| DKC58-87 | 50.5 | 46.4 | 59.1 | 54.1 | 59.5 | 57.8 | 58.6 | 57.2 |
| DKC60-67 | 54.1 | 50.5 | 57.6 | 55.1 | 59.6 | 55.9 | 60.0 | 57.5 |
| DKC62-08 | 51.4 | 44.2 | 51.3 | 50.3 | 60.6 | 58.2 | 60.8 | 57.4 |
| DKC63-33 | 51.5 | 43.8 | 57.3 | 55.0 | 59.7 | 59.0 | 59.5 | 57.7 |
| DKC63-55 | 48.7 | 44.5 | 57.1 | 51.1 | 58.1 | 57.5 | 59.3 | 56.2 |
| DKC64-87 | 52.9 | 49.6 | 58.0 | 52.4 | 60.8 | 55.9 | 61.6 | 56.0 |
| 2014 Means | 52.9 | 47.0 | 57.6 | 53.9 | 60.3 | 57.7 | 60.7 | 57.6 |
| 2015 | ||||||||
| 5415SS | 59.3 | 55.6 | 65.3 | 60.4 | 64.7 | 62.8 | 65.6 | 64.1 |
| 5887VT3P | 57.3 | 53.5 | 62.4 | 55.3 | 64.7 | 62.5 | 64.3 | 62.4 |
| 5975VT3P | 54.6 | 50.1 | 62.0 | 57.7 | 63.0 | 58.1 | 62.2 | 60.4 |
| 6065SS | 61.4 | 55.8 | 62.1 | 60.7 | 63.6 | 63.2 | 64.3 | 60.6 |
| 6110SS | 60.7 | 57.9 | 60.0 | 58.9 | 65.0 | 60.7 | 62.4 | 61.1 |
| 6265SS | 54.0 | 53.8 | 60.7 | 58.3 | 64.0 | 60.5 | 62.8 | 60.1 |
| 6594SS | 55.7 | 57.2 | 61.1 | 58.5 | 62.5 | 59.8 | 63.5 | 60.8 |
| 6640VT3P | 56.9 | 49.2 | 59.2 | 57.2 | 65.4 | 61.1 | 64.2 | 61.0 |
| 2015 Means | 57.5 | 54.1 | 61.6 | 58.4 | 64.1 | 61.1 | 63.7 | 61.3 |
† Hybrid LSD (p ≤ 0.05) = 2.7 SPAD unit in 2014 and nonsignificant (NS) in 2015. ‡ Rotation LSD (p ≤ 0.05) = 0.7 SPAD unit in 2014 and 2.5 SPAD unit in 2015. § Input level LSD (p ≤ 0.05) = 0.8 SPAD unit in 2014 and 0.6 SPAD unit in 2015. ¶ Plant density LSD (p ≤ 0.05) = 0.8 SPAD unit in 2014 and 0.6 SPAD unit in 2015.
Table 5.
Corn grain yield for hybrids as influenced by crop rotation, agronomic input level, and population. Hybrids were grown in continuous corn and following soybean rotations at Champaign, IL in 2014 and 2015. All values are reported at 0 g kg−1 moisture concentration.
Table 5.
Corn grain yield for hybrids as influenced by crop rotation, agronomic input level, and population. Hybrids were grown in continuous corn and following soybean rotations at Champaign, IL in 2014 and 2015. All values are reported at 0 g kg−1 moisture concentration.
| Crop Rotation ‡ | ||||||||
|---|---|---|---|---|---|---|---|---|
| Continuous Corn | Corn-Soybean | |||||||
| Input Level § | ||||||||
| Standard | Intensive | Standard | Intensive | |||||
| Year/ | Plant Density (plant ha−1) ¶ | |||||||
| Hybrid † | 79,000 | 111,000 | 79,000 | 111,000 | 79,000 | 111,000 | 79,000 | 111,000 |
| -------------------------------- Mg ha−1 -------------------------------- | ||||||||
| 2014 | ||||||||
| 209-53STX | 9.65 | 9.81 | 12.60 | 12.62 | 11.59 | 10.82 | 12.93 | 13.02 |
| 212-86STX | 8.71 | 8.52 | 11.67 | 12.13 | 10.69 | 11.27 | 12.99 | 12.11 |
| DKC58-87 | 8.44 | 8.60 | 11.20 | 11.23 | 10.75 | 11.16 | 12.38 | 13.13 |
| DKC60-67 | 9.46 | 9.00 | 11.76 | 12.11 | 11.10 | 10.61 | 12.58 | 12.63 |
| DKC62-08 | 8.00 | 8.10 | 9.84 | 9.27 | 10.32 | 9.59 | 11.86 | 11.50 |
| DKC63-33 | 9.04 | 8.80 | 11.59 | 11.23 | 11.56 | 11.10 | 13.23 | 12.89 |
| DKC63-55 | 8.75 | 8.55 | 11.53 | 11.04 | 10.48 | 10.05 | 11.90 | 11.39 |
| DKC64-87 | 9.25 | 9.07 | 12.37 | 12.04 | 11.88 | 11.05 | 13.48 | 13.05 |
| 2014 Means | 8.92 | 8.81 | 11.57 | 11.46 | 11.04 | 10.71 | 12.67 | 12.47 |
| 2015 | ||||||||
| 5415SS | 9.46 | 8.05 | 11.42 | 11.40 | 10.74 | 10.88 | 13.03 | 12.97 |
| 5887VT3P | 9.15 | 7.08 | 10.57 | 9.66 | 11.63 | 9.83 | 13.07 | 12.80 |
| 5975VT3P | 8.24 | 7.97 | 11.23 | 10.44 | 11.44 | 10.16 | 13.49 | 12.94 |
| 6065SS | 9.82 | 9.62 | 11.24 | 12.27 | 11.68 | 11.06 | 13.37 | 13.30 |
| 6110SS | 10.01 | 9.09 | 11.68 | 12.19 | 12.05 | 12.58 | 13.47 | 13.53 |
| 6265SS | 7.73 | 6.75 | 10.71 | 10.01 | 12.02 | 12.31 | 13.46 | 13.72 |
| 6594SS | 7.85 | 8.58 | 11.10 | 11.69 | 12.08 | 10.48 | 13.84 | 13.74 |
| 6640VT3P | 6.91 | 5.99 | 9.14 | 10.21 | 11.51 | 11.43 | 13.33 | 12.20 |
| 2015 Means | 8.65 | 7.89 | 10.89 | 10.98 | 11.64 | 11.09 | 13.38 | 13.15 |
† Hybrid LSD (p ≤ 0.05) = 0.35 Mg ha−1 in 2014 and 1.05 Mg ha−1 in 2015. ‡ Rotation LSD (p ≤ 0.05) = 0.06 Mg ha−1 in 2014 and 0.81 Mg ha−1 in 2015. § Input level LSD (p ≤ 0.05) = 0.14 Mg ha−1 in 2014 and 0.23 Mg ha−1 in 2015. ¶ Plant density LSD (p ≤ 0.05) = 0.14 Mg ha−1 in 2014 and 0.23 Mg ha−1 in 2015.
Table 6.
Grain yield components as influenced by crop rotation, hybrid, agronomic input level, and population at Champaign, IL in 2014 and 2015. All values are reported at 0 g kg−1 moisture concentration.
Table 6.
Grain yield components as influenced by crop rotation, hybrid, agronomic input level, and population at Champaign, IL in 2014 and 2015. All values are reported at 0 g kg−1 moisture concentration.
| Kernel Number | Kernel Weight | ||||||||
|---|---|---|---|---|---|---|---|---|---|
| Input Level § | |||||||||
| Standard | Intensive | Standard | Intensive | ||||||
| Year/ | Planting Density (× 1000 plants ha−1) ¶ | ||||||||
| Rotation † | Hybrid ‡ | 79 | 111 | 79 | 111 | 79 | 111 | 79 | 111 |
| ------------- m−2 ------------- | --------- mg kernel−1 --------- | ||||||||
| Cont. Corn | 2014 | ||||||||
| 209-53STX | 4394 | 4736 | 4779 | 5346 | 219 | 207 | 264 | 236 | |
| 212-86STX | 3984 | 4169 | 4618 | 5200 | 218 | 204 | 253 | 233 | |
| DKC58-87 | 4047 | 4307 | 4632 | 5032 | 208 | 199 | 241 | 223 | |
| DKC60-67 | 4146 | 4455 | 4533 | 5031 | 228 | 202 | 259 | 241 | |
| DKC62-08 | 3398 | 3852 | 3629 | 3866 | 235 | 210 | 271 | 240 | |
| DKC63-33 | 4155 | 4800 | 4897 | 5512 | 219 | 183 | 237 | 204 | |
| DKC63-55 | 4341 | 4433 | 4986 | 5331 | 201 | 193 | 231 | 207 | |
| DKC64-87 | 4597 | 4704 | 5374 | 5388 | 201 | 192 | 230 | 226 | |
| 2014 Means | 4133 | 4432 | 4681 | 5088 | 216 | 199 | 248 | 226 | |
| 2015 | |||||||||
| 5415SS | 4749 | 5102 | 4962 | 5485 | 199 | 171 | 230 | 207 | |
| 5887VT3P | 4441 | 4522 | 4584 | 5015 | 206 | 177 | 230 | 209 | |
| 5975VT3P | 4129 | 4670 | 4978 | 5252 | 199 | 169 | 226 | 198 | |
| 6065SS | 4307 | 4741 | 4555 | 5378 | 228 | 202 | 247 | 228 | |
| 6110SS | 4320 | 4649 | 4782 | 5603 | 230 | 195 | 244 | 217 | |
| 6265SS | 3352 | 3197 | 4129 | 4120 | 230 | 209 | 258 | 241 | |
| 6594SS | 4335 | 4750 | 5117 | 5923 | 184 | 180 | 217 | 196 | |
| 6640VT3P | 3424 | 3226 | 4095 | 5203 | 199 | 183 | 220 | 195 | |
| 2015 Means | 4132 | 4357 | 4650 | 5247 | 209 | 186 | 234 | 212 | |
| Corn-Soybean | 2014 | ||||||||
| 209-53STX | 5282 | 4844 | 5101 | 5027 | 220 | 227 | 253 | 263 | |
| 212-86STX | 4390 | 4612 | 4923 | 4460 | 243 | 246 | 264 | 273 | |
| DKC58-87 | 4280 | 5022 | 4873 | 5549 | 251 | 222 | 254 | 237 | |
| DKC60-67 | 4442 | 4375 | 4355 | 4583 | 250 | 244 | 289 | 277 | |
| DKC62-08 | 4025 | 3752 | 4526 | 4203 | 257 | 259 | 263 | 274 | |
| DKC63-33 | 5375 | 4784 | 5084 | 4936 | 215 | 234 | 260 | 261 | |
| DKC63-55 | 4512 | 4514 | 4958 | 4731 | 232 | 222 | 240 | 241 | |
| DKC64-87 | 5690 | 4912 | 5585 | 5598 | 209 | 227 | 244 | 234 | |
| 2014 Means | 4750 | 4602 | 4926 | 4886 | 235 | 235 | 258 | 257 | |
| 2015 | |||||||||
| 5415SS | 5009 | 5410 | 5189 | 5738 | 214 | 201 | 251 | 227 | |
| 5887VT3P | 4779 | 4567 | 4865 | 5566 | 243 | 215 | 269 | 230 | |
| 5975VT3P | 4861 | 5078 | 4936 | 5851 | 236 | 199 | 273 | 221 | |
| 6065SS | 4636 | 4721 | 4988 | 5499 | 252 | 234 | 268 | 242 | |
| 6110SS | 4797 | 5858 | 5084 | 5729 | 251 | 213 | 265 | 236 | |
| 6265SS | 4224 | 4558 | 4507 | 4799 | 284 | 270 | 298 | 286 | |
| 6594SS | 5488 | 5316 | 5786 | 6251 | 220 | 197 | 239 | 220 | |
| 6640VT3P | 4646 | 5222 | 5143 | 5275 | 247 | 219 | 258 | 230 | |
| 2015 Means | 4805 | 5091 | 5062 | 5589 | 243 | 218 | 265 | 236 | |
† Rotation kernel number LSD (p ≤ 0.05) = nonsignificant (NS) in 2014 and 161 m−2 in 2015; Rotation kernel weight LSD (p ≤ 0.05) = 9.0 mg kernel−1 in 2014 and 10.2 mg kernel−1 in 2015. ‡ Hybrid kernel number LSD (p ≤ 0.05) = 198 m−2 in 2014 and 297 m−2 in 2015; Hybrid kernel weight LSD (p ≤ 0.05) = 8.7 mg kernel−1 in 2014 and 11.2 mg kernel−1 in 2015. § Input level kernel number LSD (p ≤ 0.05) = 98 m−2 in both 2014 and 2015; Input level kernel weight LSD (p ≤ 0.05) = 4.4 mg kernel−1 in 2014 and 2.3 mg kernel−1 in 2015. ¶ Plant density kernel number LSD (p ≤ 0.05) = 99 m−2 in both 2014 and 2015; Plant density kernel weight LSD (p ≤ 0.05) = 4.4 mg kernel−1 in 2014 and 2.3 mg kernel−1 in 2015.
Table 7.
Pearson correlation coefficients and associated significance level for final grain yield between selected corn growth parameters as influenced by crop rotation and averaged across all other treatments.
Table 7.
Pearson correlation coefficients and associated significance level for final grain yield between selected corn growth parameters as influenced by crop rotation and averaged across all other treatments.
| Corn Parameter | 2014 | 2015 | ||
|---|---|---|---|---|
| CC † | CS | CC | CS | |
| V6 Biomass | 0.69 *** | 0.76 *** | 0.42 *** | 0.57 *** |
| R2 SPAD | 0.70 *** | 0.12 | 0.72 *** | 0.09 |
| Harvest Index | 0.64 *** | 0.46 *** | 0.65 *** | 0.36 *** |
| Kernel Number | 0.76 *** | 0.59 *** | 0.84 *** | 0.49 *** |
| Kernel Weight | 0.55 *** | 0.24 * | 0.62 *** | 0.56 *** |
*** Significant at the 0.001 probability level. * Significant at the 0.05 probability level. † CC, Continuous Corn; CS, Corn-Soybean Rotation.
© 2018 by the authors. Licensee MDPI, Basel, Switzerland. This article is an open access article distributed under the terms and conditions of the Creative Commons Attribution (CC BY) license (http://creativecommons.org/licenses/by/4.0/).
Share and Cite
MDPI and ACS Style
Vogel, A.M.; Below, F.E. Hybrid Selection and Agronomic Management to Lessen the Continuous Corn Yield Penalty. Agronomy 2018, 8, 228. https://0-doi-org.brum.beds.ac.uk/10.3390/agronomy8100228
AMA Style
Vogel AM, Below FE. Hybrid Selection and Agronomic Management to Lessen the Continuous Corn Yield Penalty. Agronomy. 2018; 8(10):228. https://0-doi-org.brum.beds.ac.uk/10.3390/agronomy8100228
Chicago/Turabian StyleVogel, Alison M., and Frederick E. Below. 2018. "Hybrid Selection and Agronomic Management to Lessen the Continuous Corn Yield Penalty" Agronomy 8, no. 10: 228. https://0-doi-org.brum.beds.ac.uk/10.3390/agronomy8100228
Note that from the first issue of 2016, this journal uses article numbers instead of page numbers. See further details here.