Article

Variation of Fine Roots Distribution in Apple (Malus pumila M.)–Crop Intercropping Systems on the Loess Plateau of China

1
College of Water and Soil Conservation, Beijing Forestry University, Beijing 100083, China
2
Ji County Station, Chinese National Ecosystem Research Network (CNERN), Beijing 100083, China
3
Beijing Collaborative Innovation Center for Eco-Environmental Improvement with Forestry and Fruit Trees, Beijing 102206, China
4
Key Laboratory of State Forestry Administration on Soil and Water Conservation, Beijing Forestry University, Beijing 100083, China
5
Beijing Engineering Research Center of Soil and Water Conservation, Beijing Forestry University, Beijing 100083, China
6
Engineering Research Center of Forestry Ecological Engineering, Ministry of Education, Beijing Forestry University, Beijing 100083, China
7
College of Resources and Environmental Sciences, China Agricultural University, Beijing 100094, China
*
Author to whom correspondence should be addressed.
Submission received: 19 October 2018 / Revised: 18 November 2018 / Accepted: 25 November 2018 / Published: 27 November 2018
(This article belongs to the Special Issue Root-Soil Interactions)

Abstract

:
In arid and semi-arid areas, interspecific below-ground competition is prominent in agroforestry systems. To provide theoretical and technical guidance for the scientific management of apple–crop intercropping systems, a field study was conducted in the Loess Plateau of China to examine the variation of fine roots distribution in apple–crop intercropping systems. The fine roots of apple trees and crops (soybean (Glycine max (L.) Merr) or peanuts (Arachis hypogaea Linn.)) were sampled to 100 cm depth at ten distances from the tree row using the stratified excavation method. The results showed that the vertical distribution of fine roots between intercropped apple trees and intercropped crops were skewed and overlapped. Apple–crop intercropping inhibited the fine roots of apple trees in the 0–60 cm soil depth, but promoted their growth in the 60–100 cm soil depth. However, apple–crop intercropping inhibited the fine roots of intercropped crops in the 0–100 cm soil depth. For the fine roots of each component of the apple–crop intercropping systems, variation in the vertical distribution was much greater than variation in the horizontal distribution. Compared with monocropped systems, apple–crop intercropping caused the fine roots of intercropped apple trees to move to deeper soil, and those of intercropped crops to move to shallower soil. Additionally, apple–crop intercropping slightly inhibited the horizontal extension of the fine-root horizontal barycentre (FRHB) of intercropped apple trees and caused the FRHB of intercropped crops to be slightly biased towards the north of the apple tree row. Variation of the fine roots distribution of each component of the apple–soybean intercropping system was greater than that of the apple–peanut intercropping system. Thus, the interspecific below-ground competition of the apple–peanut intercropping system was weaker than that of the apple–soybean intercropping system. Intense competition occurred in the apple–peanut intercropping system and the apple–soybean intercropping system was in sections whose distance ranged from 0.5–1.3 and 0.5–1.7 m from the tree row, respectively. The interspecific below-ground competition was fiercer on the south side of the apple tree row than on the north side.

1. Introduction

The agroforestry system is an efficient land use pattern. It breaks single-plantation structures through a horizontal mosaic, stereoscopic collocation and time combination of species, resulting in a new interaction relationship between different species in the distribution and utilization of light, water and nutrients. However, with respect to the distribution of resources, species can be both competitive and complementary [1]. Therefore, the key to the operation and management of agroforestry systems is to minimize resource competition between trees and crops and maximize the synergistic use of resources of the agroforestry system as a whole [2,3,4]. There are two interaction interfaces in agroforestry systems: one is the above-ground interface, where species compete for light, heat, and water, and the other is the below-ground interface, where interspecific roots compete with soil, water, and nutrients [5,6]. In agroforestry systems, interspecific competition occurs predominately below-ground [1,7,8]. In arid and semi-arid areas, interspecific below-ground root competition of agroforestry is especially prominent [9,10,11].
In recent years, root research has become an important part of agroforestry experiments, and the root system of agroforestry systems plays an important role in the competition for below-ground resources [12,13]. Plant root growth patterns are guided by genetic factors and environmental factors such as soil moisture and nutrients [14]. When the roots of two species in an intercropping system cross, the soil nutrients or soil moisture become heterogeneous [15,16], and the spatial distribution of roots responds differently to differences in soil nutrients, soil moisture, etc. [17,18]. Specifically, the spatial structure of fine roots, which supply moisture and nutrients needed for plant growth, determines not only the utilization effect and potential of the root system to access below-ground resources [19] but also the individual competitive ability of a plant to access those resources [11,20]. However, the responses in terms of variation of fine-root distribution to resource availability and/or plant competition constitute the main mechanism used by plant roots to avoid competition [21,22]. Reasonable root interaction mechanisms are keys to the sustainable development of agroforestry systems [23]. Therefore, it is important to understand the spatial distribution of the root system of each component in an agroforestry system to measure the degree of resource competition or the degree of complementarity among components [24,25]. In this context, it is important to study the effects of interspecific below-ground competition on the variation in the spatial distribution of fine roots of each component in an agroforestry system.
Many reports exist concerning root characteristics in agroforestry systems. Studies have reported that intercropping reduces the quantity of fine roots of trees [26] and crops [11,26,27]. Conversely, other studies reported that intercropping increases the quantity of fine roots of trees [28] and crops [29]. Moreover, there was no spatial separation of fine roots of trees and crops in the Grevillea robusta–maize (Zea mays L.) intercropping system [11] and walnut (Juglans regia L.)–soybean intercropping system [30]. However, tree–crop intercropping may reduce the degree of niche overlap between the fine roots of intercropped trees and intercropped crops by changing the distribution of their fine roots. In response to interspecific below-ground competition for soil resources, the fine roots of the intercropped trees move to deeper soil [26,31,32,33], while the fine roots of the intercropped crops move to shallower soil [27,34]. Studies have also found that intercropping inhibits the horizontal reach of tree roots [35]. Variation of fine roots distribution and spatial distribution of fine roots are keys to adapting to competition and maximizing the absorption of both soil moisture and nutrients in agroforestry systems [36], These factors determine the degree of niche overlap of fine roots in agroforestry systems, ultimately affecting the status of the below-ground competition of these systems. The variation in the spatial distribution of the root system of the whole intercropping system has not been completely studied. Moreover, some studies were based on the hypothesis that the fine roots of intercropped trees and intercropped crops were equally distributed in the north and south direction of the tree row [27,30,37,38]. However, whether the variation of fine roots distribution of intercropped trees and intercropped crops is consistent on both north and south sides of the tree row have not been reported yet. Therefore, in the present study, the variation in the spatial distribution of fine roots of each component in an agroforestry system and fully and systematically studied. The adaptive strategies of the fine roots of each component in the agroforestry system were explored with respect to interspecific below-ground competition between species, and the niche overlap of fine roots in agroforestry systems was further analyzed. The results of this study are important for understanding interspecific below-ground competition.
Apple–crop intercropping systems constitute one of the most widely applied agroforestry systems on the Loess Plateau. These systems play an important role in solving problems related to overpopulation and insufficient land resources. However, only a few studies have focused on the fine roots in this type of intercropping system in this region with respect to exploring the strategy of modifying the competition environment of each component in the intercropping system and proposing effective management measures. In this study, a stratified excavation method was used to sample the fine roots of an apple–peanut intercropping system and an apple–soybean intercropping system as well as their corresponding monocropped systems on the Loess Plateau. The spatial distribution and variation of the fine roots of each component in the intercropping systems was further studied. The purposes of this study were (1) to analyze the adaptation strategies of the fine roots of each component in the apple–crop systems to interspecific below-ground competition between species, (2) to select the type of apple–crop intercropping system best suited for local resource conditions, and (3) to propose agronomic measures to alleviate interspecific below-ground competition in apple–crop intercropping systems.

2. Materials and Methods

2.1. Experimental Site

The experimental field was located at the Red Flag Forest Farm in Jixian County, Shanxi Province, China (36°01′ N, 110°46′ E). Ji County constitutes a typical hill and gully region on the Loess Plateau. This region has a temperate continental monsoon climate; the mean annual rainfall is 571 mm, the mean annual evaporation is 1729 mm, and the mean annual temperature is 9.9 °C. The hours of daylight are 2563.8 h, and there are 172 frost-free days. The parent material of the soil is loess, the soil is uniform, and the soil properties within the 0–100 cm soil layer are as follows: pH = 7.97, 1.32 g·cm−3 bulk density, 13.5 g·kg−1 organic C, 0.81 g·kg−1 total N, 19.7 g·kg−1 available P, and 235.7 mg·kg−1 available K. The major intercropped tree species include apple, walnut, and apricot (Prunus armeniaca Lam.). The major intercropped crop species include soybean, peanut, and maize.

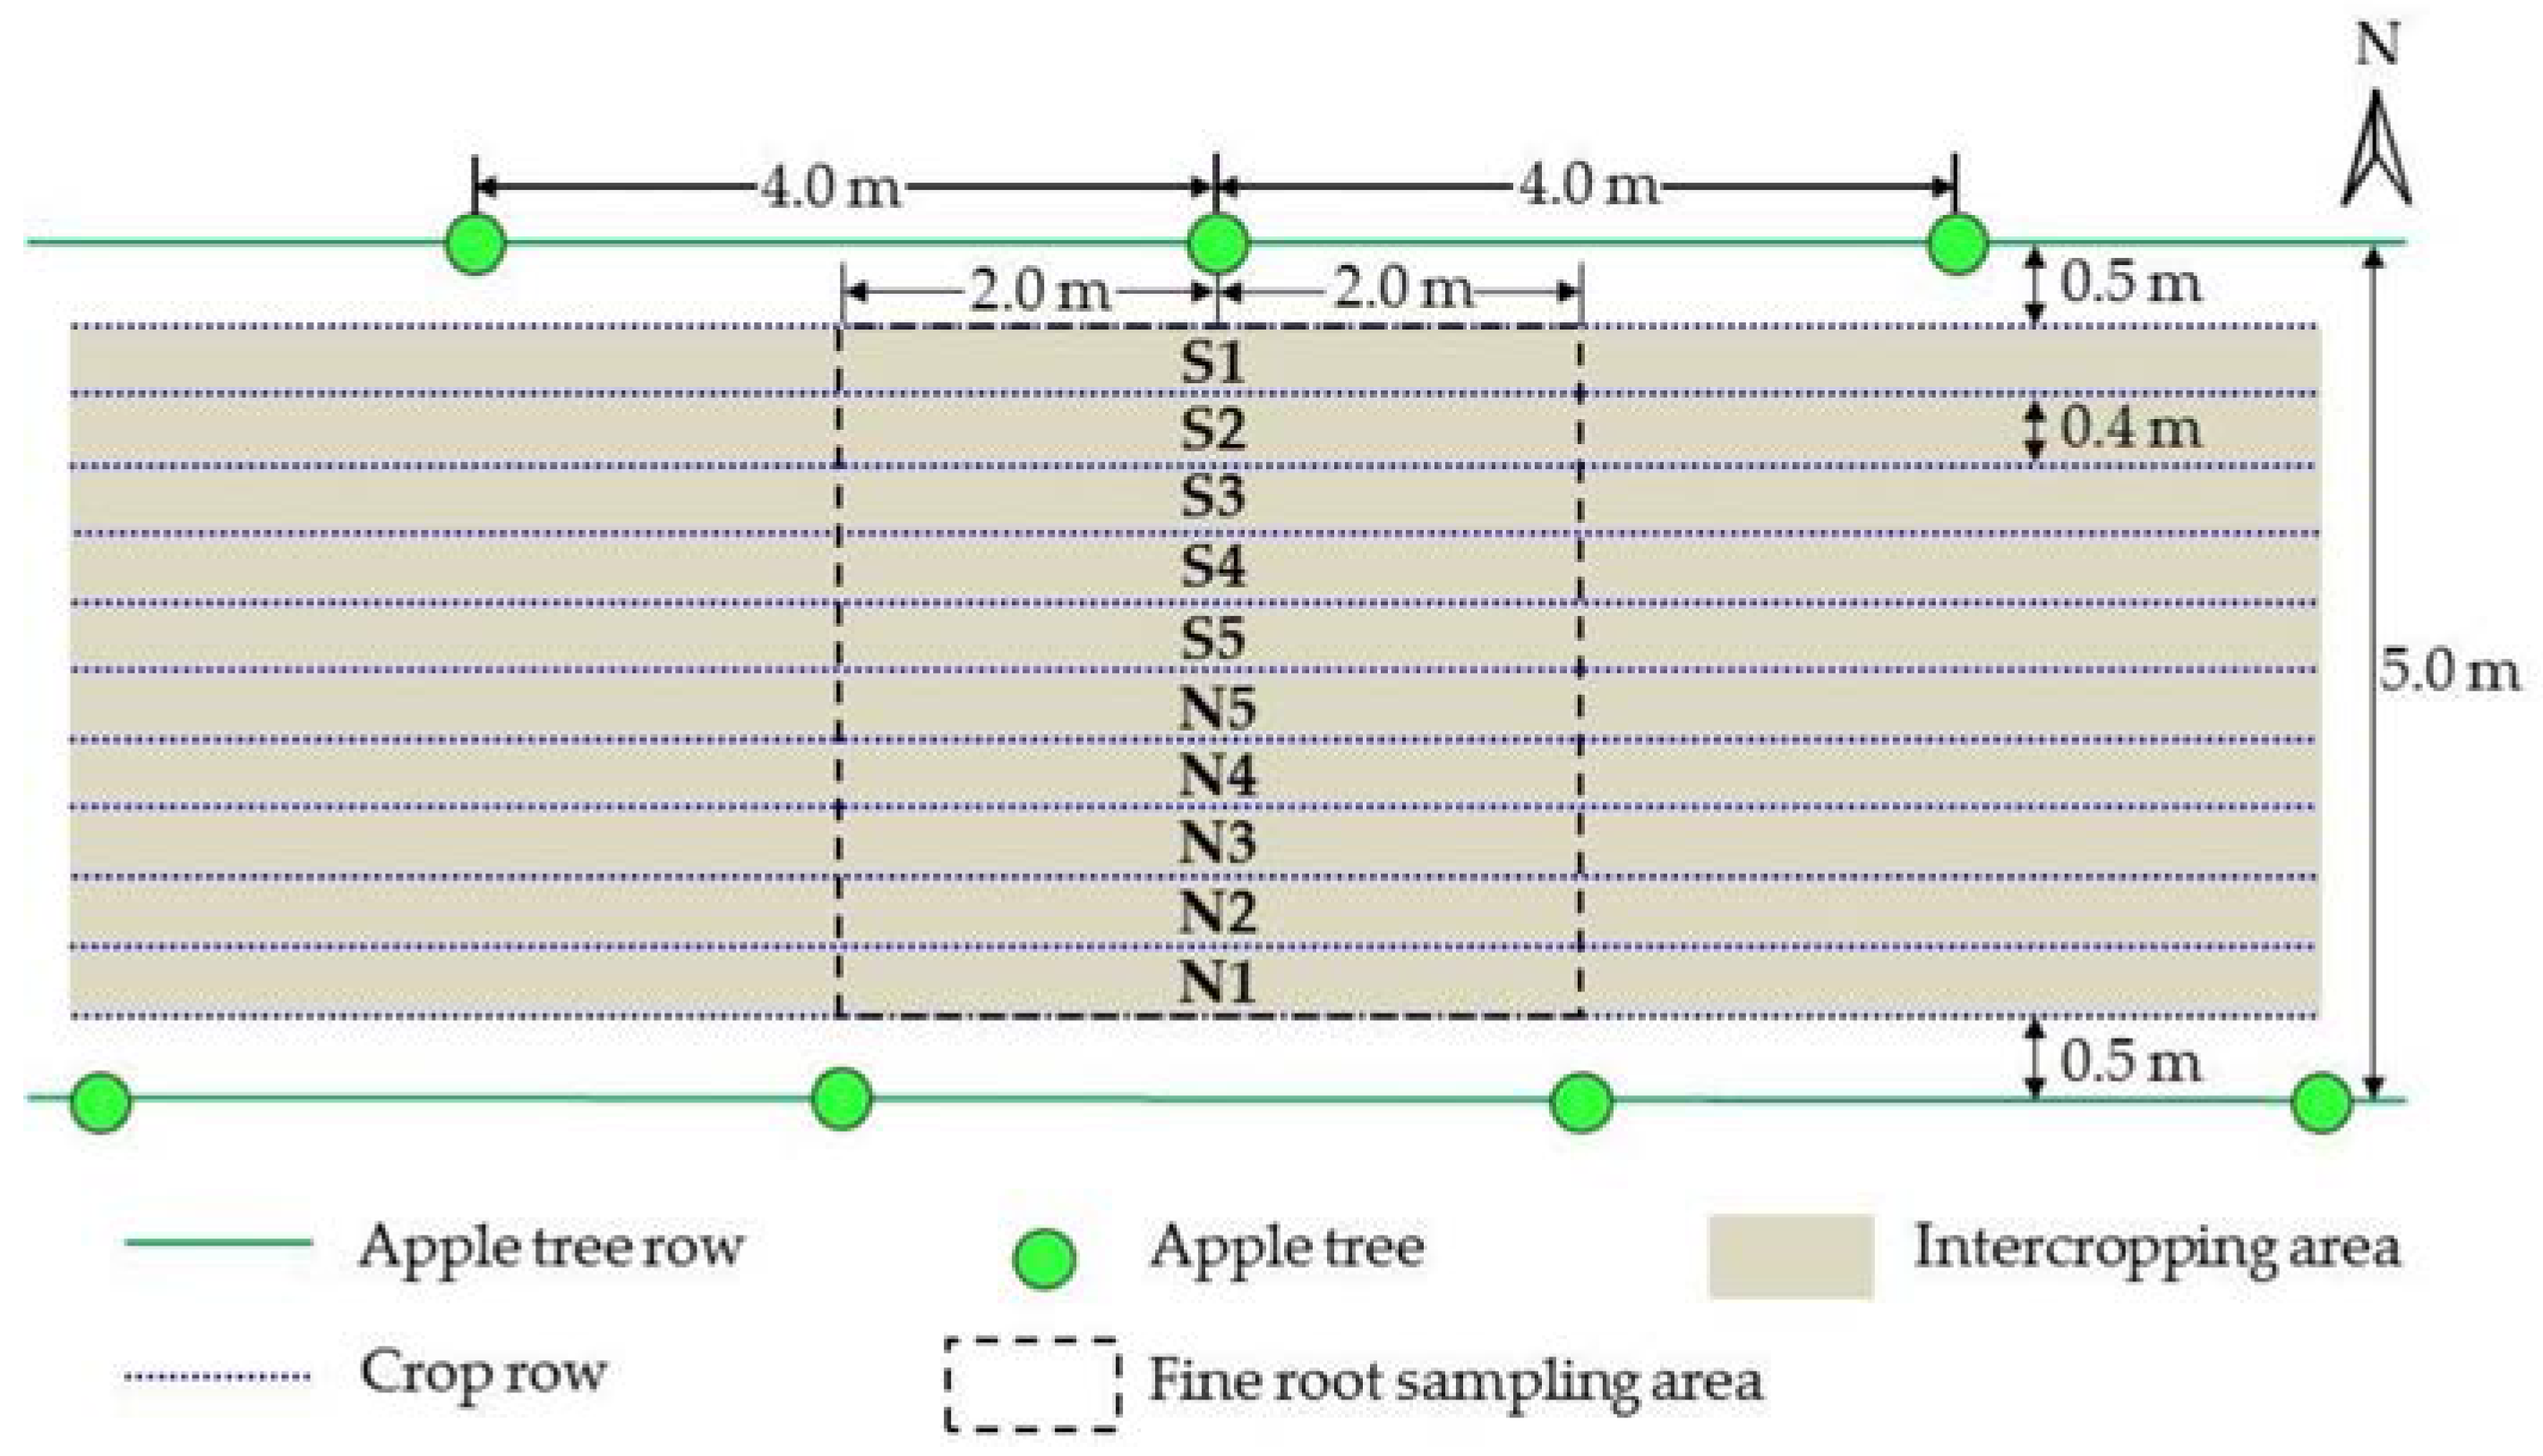
2.2. Materials and Experimental Design

The experiment was conducted in August 2017. An apple–peanut intercropping system and an apple–soybean intercropping system as well as their corresponding monocropped systems were selected as experimental subjects. The apple trees were planted at a spacing of 4.0 × 5.0 m in an east–west direction in 2012. The average tree crown width and average tree height were 1.6 m and 3.6 m, respectively, in August 2017. Peanut and soybean were cultivated at a spacing of 0.3 × 0.4 m and at a distance of 0.5 m from the apple tree row. Monocropped soybean plants and monocropped peanut plants were also cultivated at a spacing of 0.3 × 0.4 m.
The experimental design included three replications for each treatment. The treatments were as follows: (1) apple–peanut intercropping systems (AP), which included intercropped apple trees (AP–A) and intercropped peanut plants (AP–P); (2) monocropped peanut plants (MP); (3) apple–soybean intercropping systems (AS), which included intercropped apple trees (AS–A) and intercropped soybean plants (AS–S); (4) monocropped soybean plants (MS); and (5) monocropped apple trees (MA). Each intercropping systems replicate (AP and AS) was a 12.0 × 15.0 m plot that consisted of fourteen apple trees and intercropped crops. Each treatment replicate of monocropped apple trees (MA) was the same size (12.0 × 15.0 m) but consisted of only fourteen apple trees, and each treatment replicate of monocropped peanut plants (MP) and monocropped soybean plants (MS) was the same size (12.0 × 15.0 m). The same agricultural management practices (weeding, pest control, etc.) were used in all treatments, and all plots received no irrigation during the year.

2.3. Collection and Measurement of Root Samples

A stratified excavation method was used to collect root samples. The area perpendicular to the apple tree row and within a distance of 0.5 m from the apple tree row was used for the fine-root sampling area (4.0 m perpendicular to the apple tree row; 4.0 m parallel to the apple tree row) in the apple–crop intercropping systems (AP and AS) and monocropped apple trees (MA) (Figure 1). We divided each fine-root sampling area into ten equally sized sections, which were denoted as S1, S2, S3, S4, S5, N5, N4, N3, N2, and N1; among them, S1, S2, S3, S4, and S5 were at a distance of 0.5–0.9, 0.9–1.3, 1.3–1.7, 1.7–2.1, and 2.1–2.5 m, respectively, south of the apple tree row, and N1, N2, N3, N4, and N5 were at a distance of 0.5–0.9, 0.9–1.3, 1.3–1.7, 1.7–2.1, and 2.1–2.5 m, respectively, north of the apple tree row (Figure 1). Three sections (4.0 m in length and 0.4 m in width) were randomly selected in the monocropped soybean plants (MS) and monocropped peanut plants (MP). In each section, we divided the vertical soil profile into five soil layers (0–20, 20–40, 40–60, 60–80, and 80–100 cm) to excavate and collect the roots of apple trees, peanut plants and soybean plants.
Root samples were collected and placed into net bags (0.15 mm pores). The root samples were then soaked in water for 24 h, and then they were carefully cleaned with tap water to remove any adhered soil particles. An electronic Vernier caliper was used to measure the diameter of each root to distinguish between the fine roots (≤2.00 mm) and thick roots (>2.00 mm) of the apple tree, peanut plant, and soybean plant samples. With respect to the apple trees, peanut plants, and soybean plants, only fine roots were included in this study. Dark roots, partially decomposed roots, brittle roots, and other extraneous materials were removed; the fine roots of apple trees, peanut plants and soybean plants were included. All root samples were weighed immediately after drying at 70 °C for 48 h. The root sample data were expressed as the fine-root dry weight.

2.4. Fine-Root Biomass Density

Data were expressed as the fine-root biomass density (FRBD, g·m−3). The FRBD was calculated as the ratio of the fine-root dry weight (Wdry, g) to the soil volume (Vsoil, m3), and the equation was as follows:
FRBD = W d r y / V s o i l ,

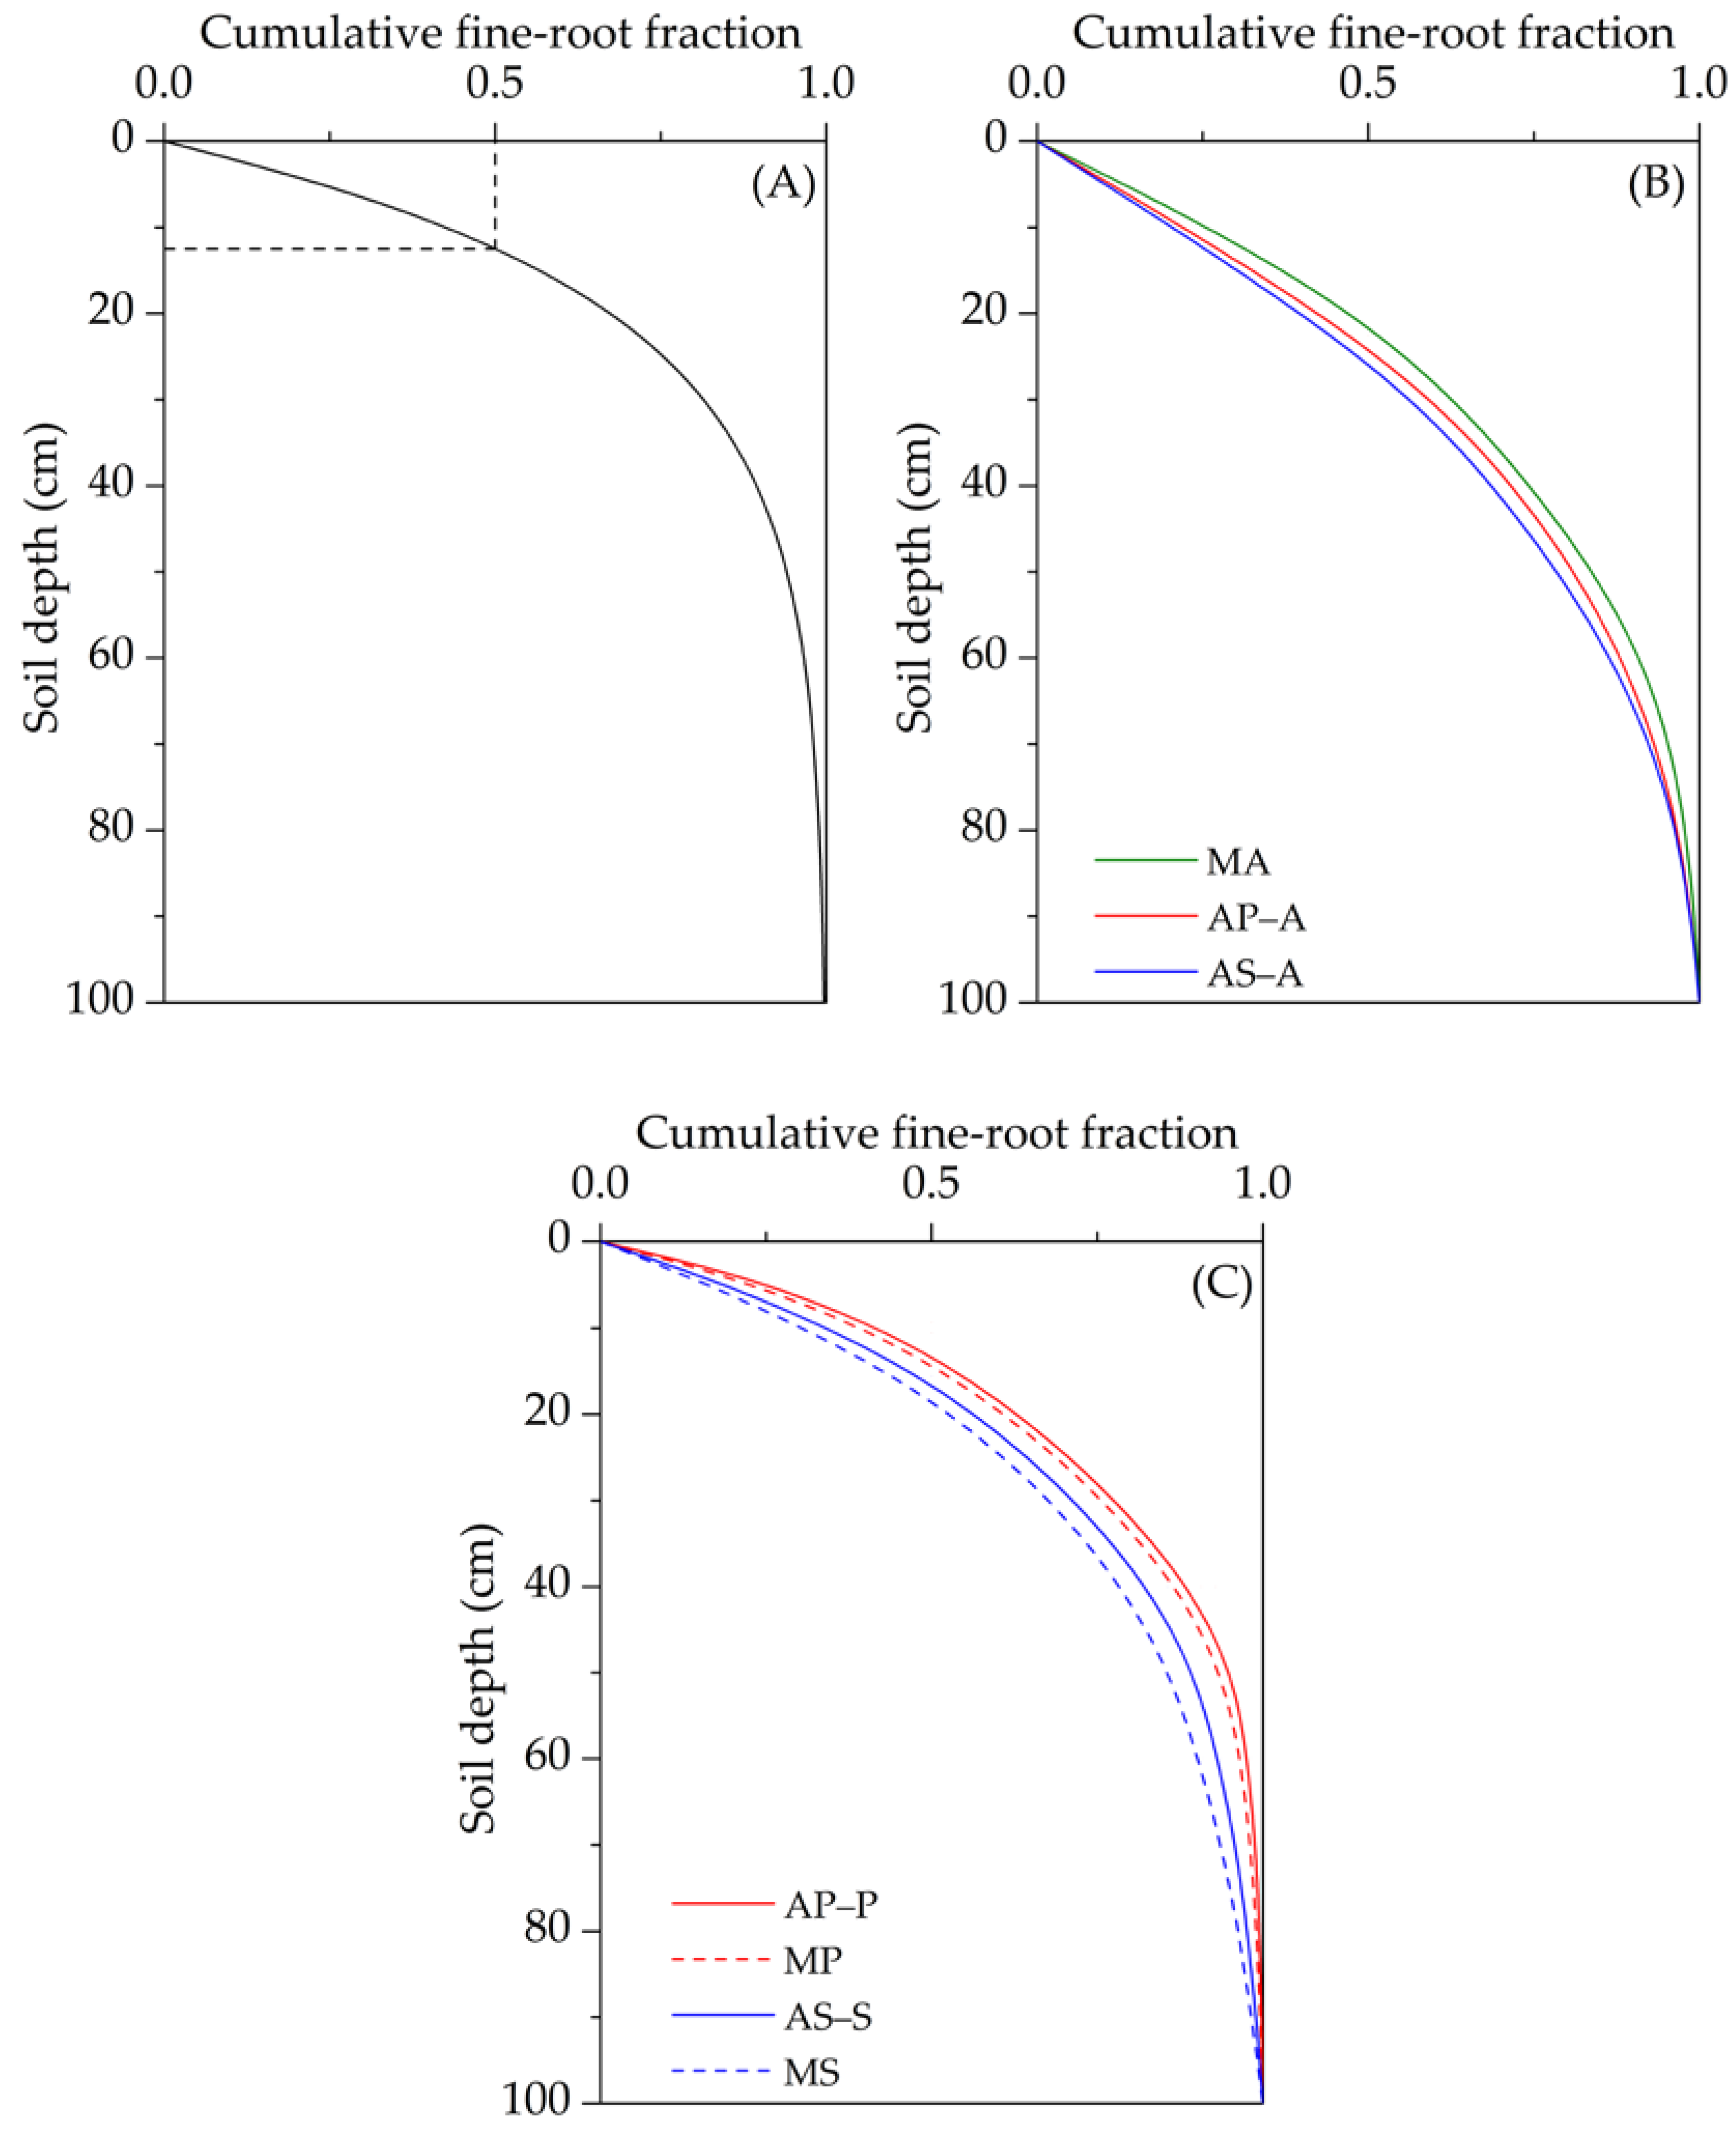
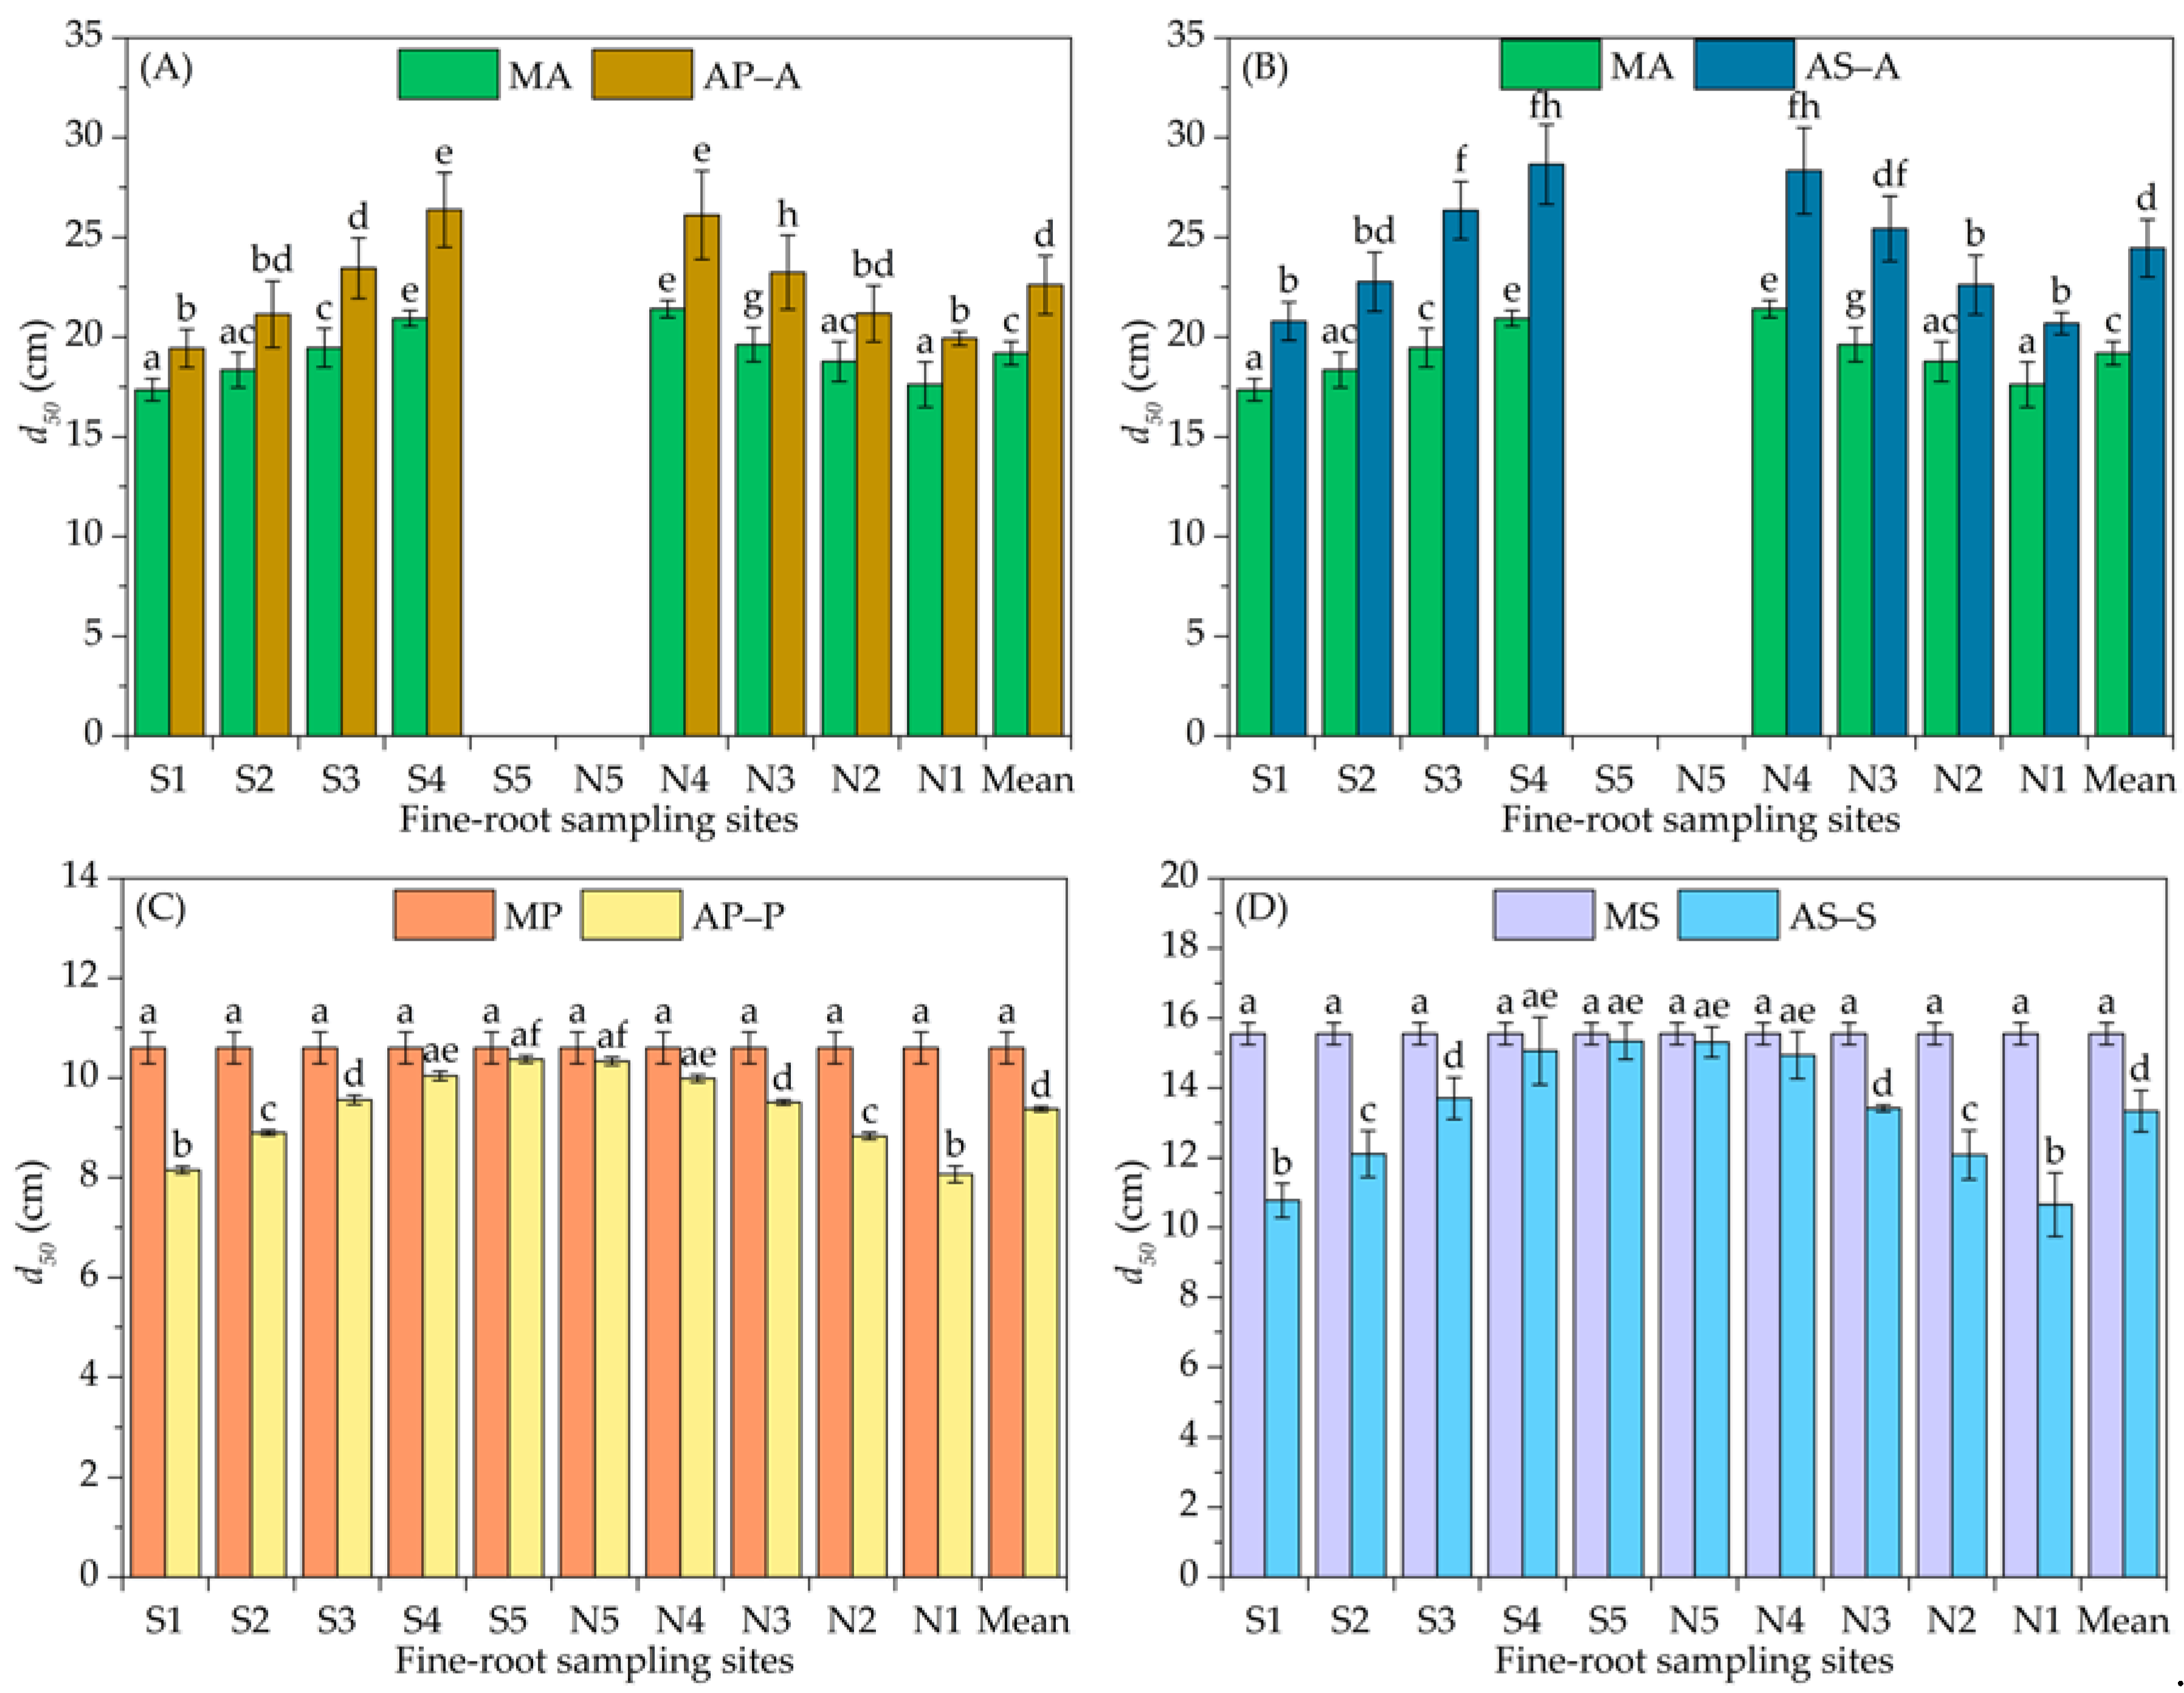
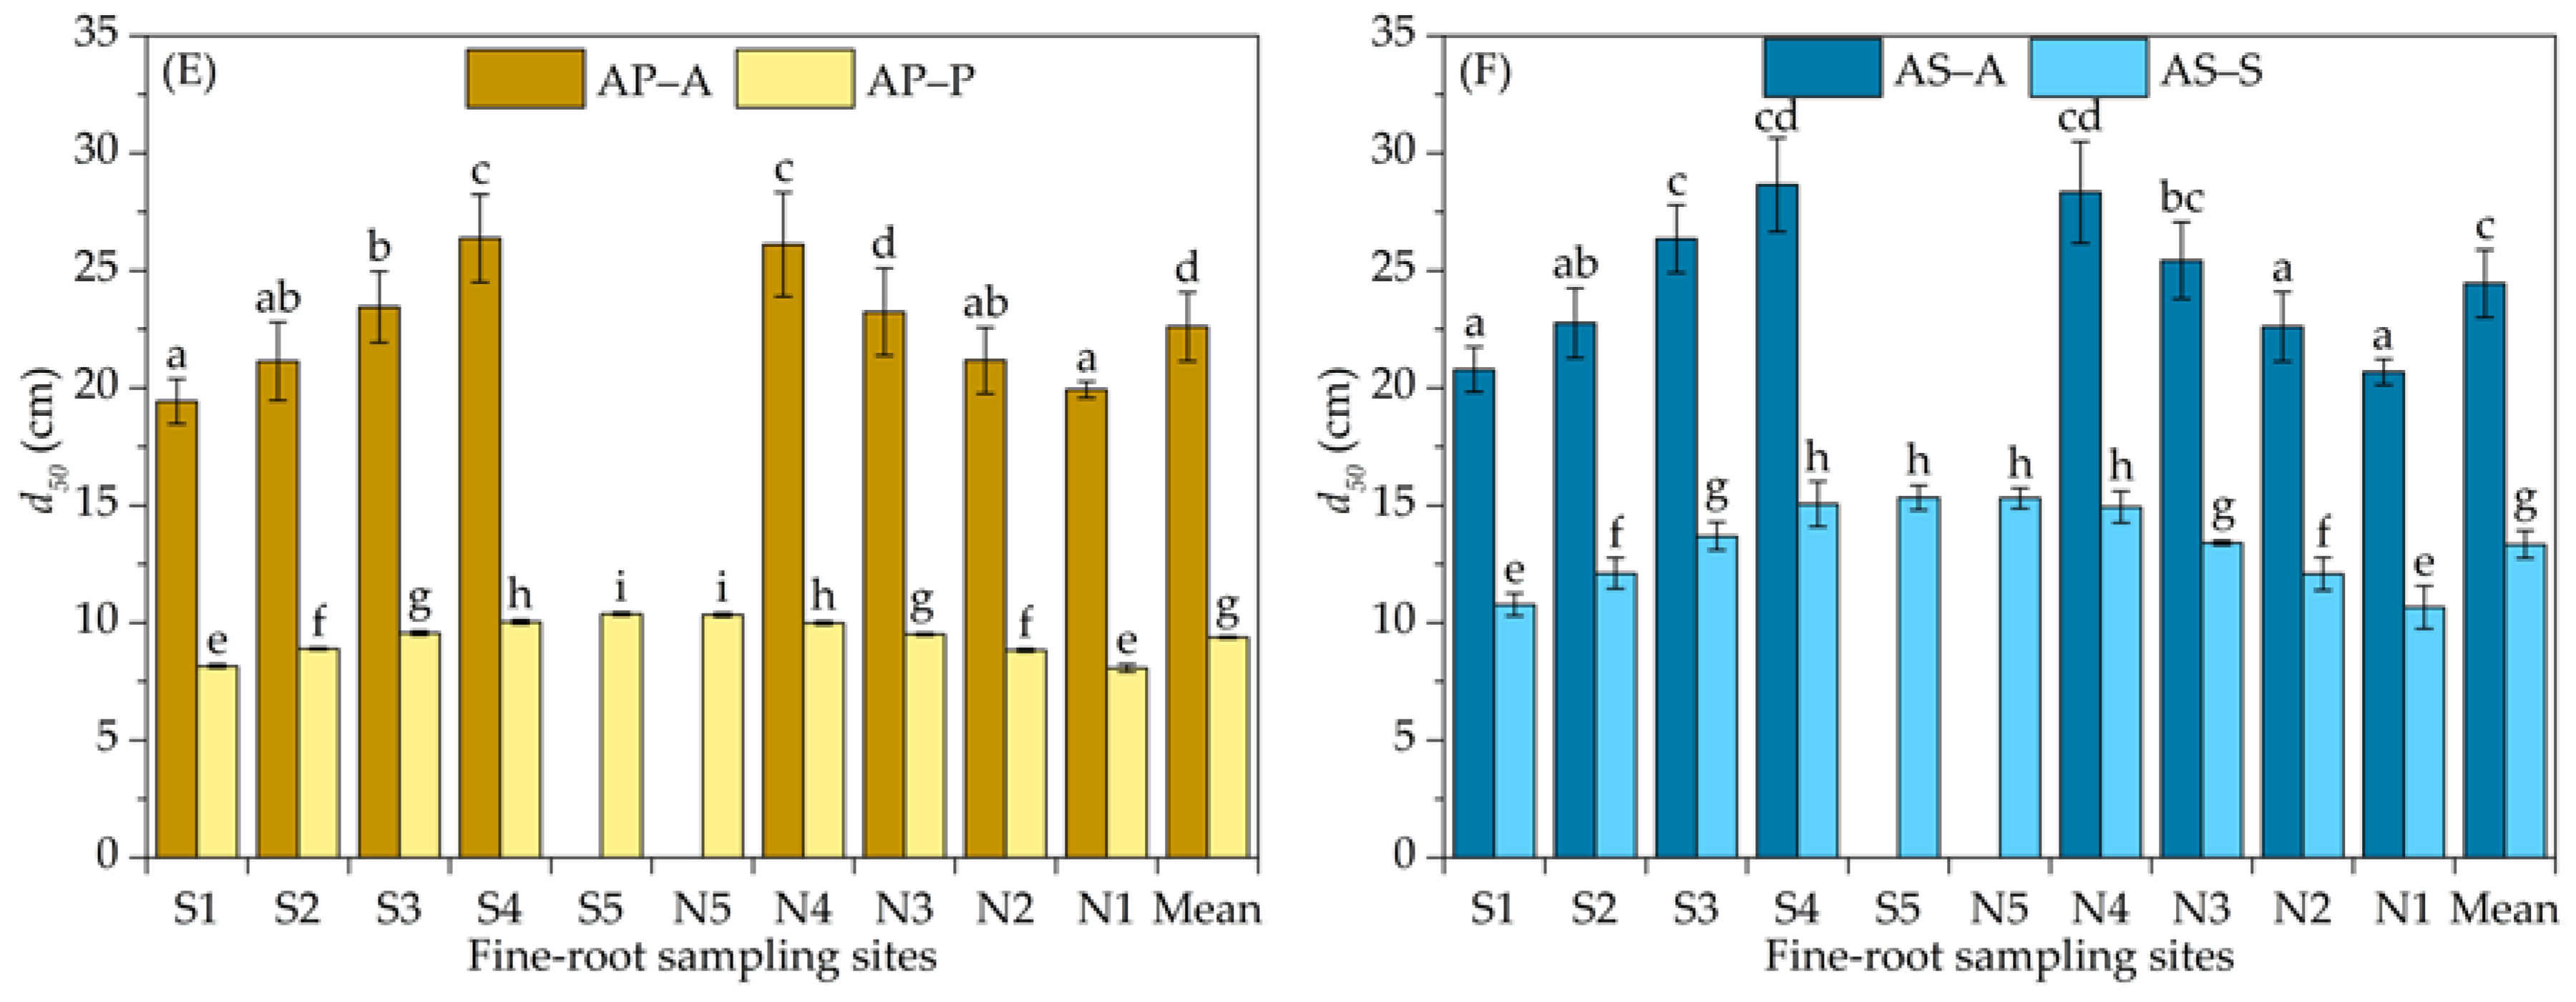
2.5. Fine-Root Vertical Distribution

To compare the variation in the vertical distribution of the fine roots between different treatments, the soil depth that contained 50% of the cumulative FRBD (d50, cm) was used for each section. Non-linear regression [39] was used to fit the following function:
Y = 1 β d ,
With respect to the profile of the cumulative fine-root fraction (Y) downwards from the soil surface, for each section, d is the soil depth (cm) and β is the regression coefficient. The d50 values for each section can be calculated using the following formula:
d 50 = ln ( 0.5 ) ln ( β ) ,

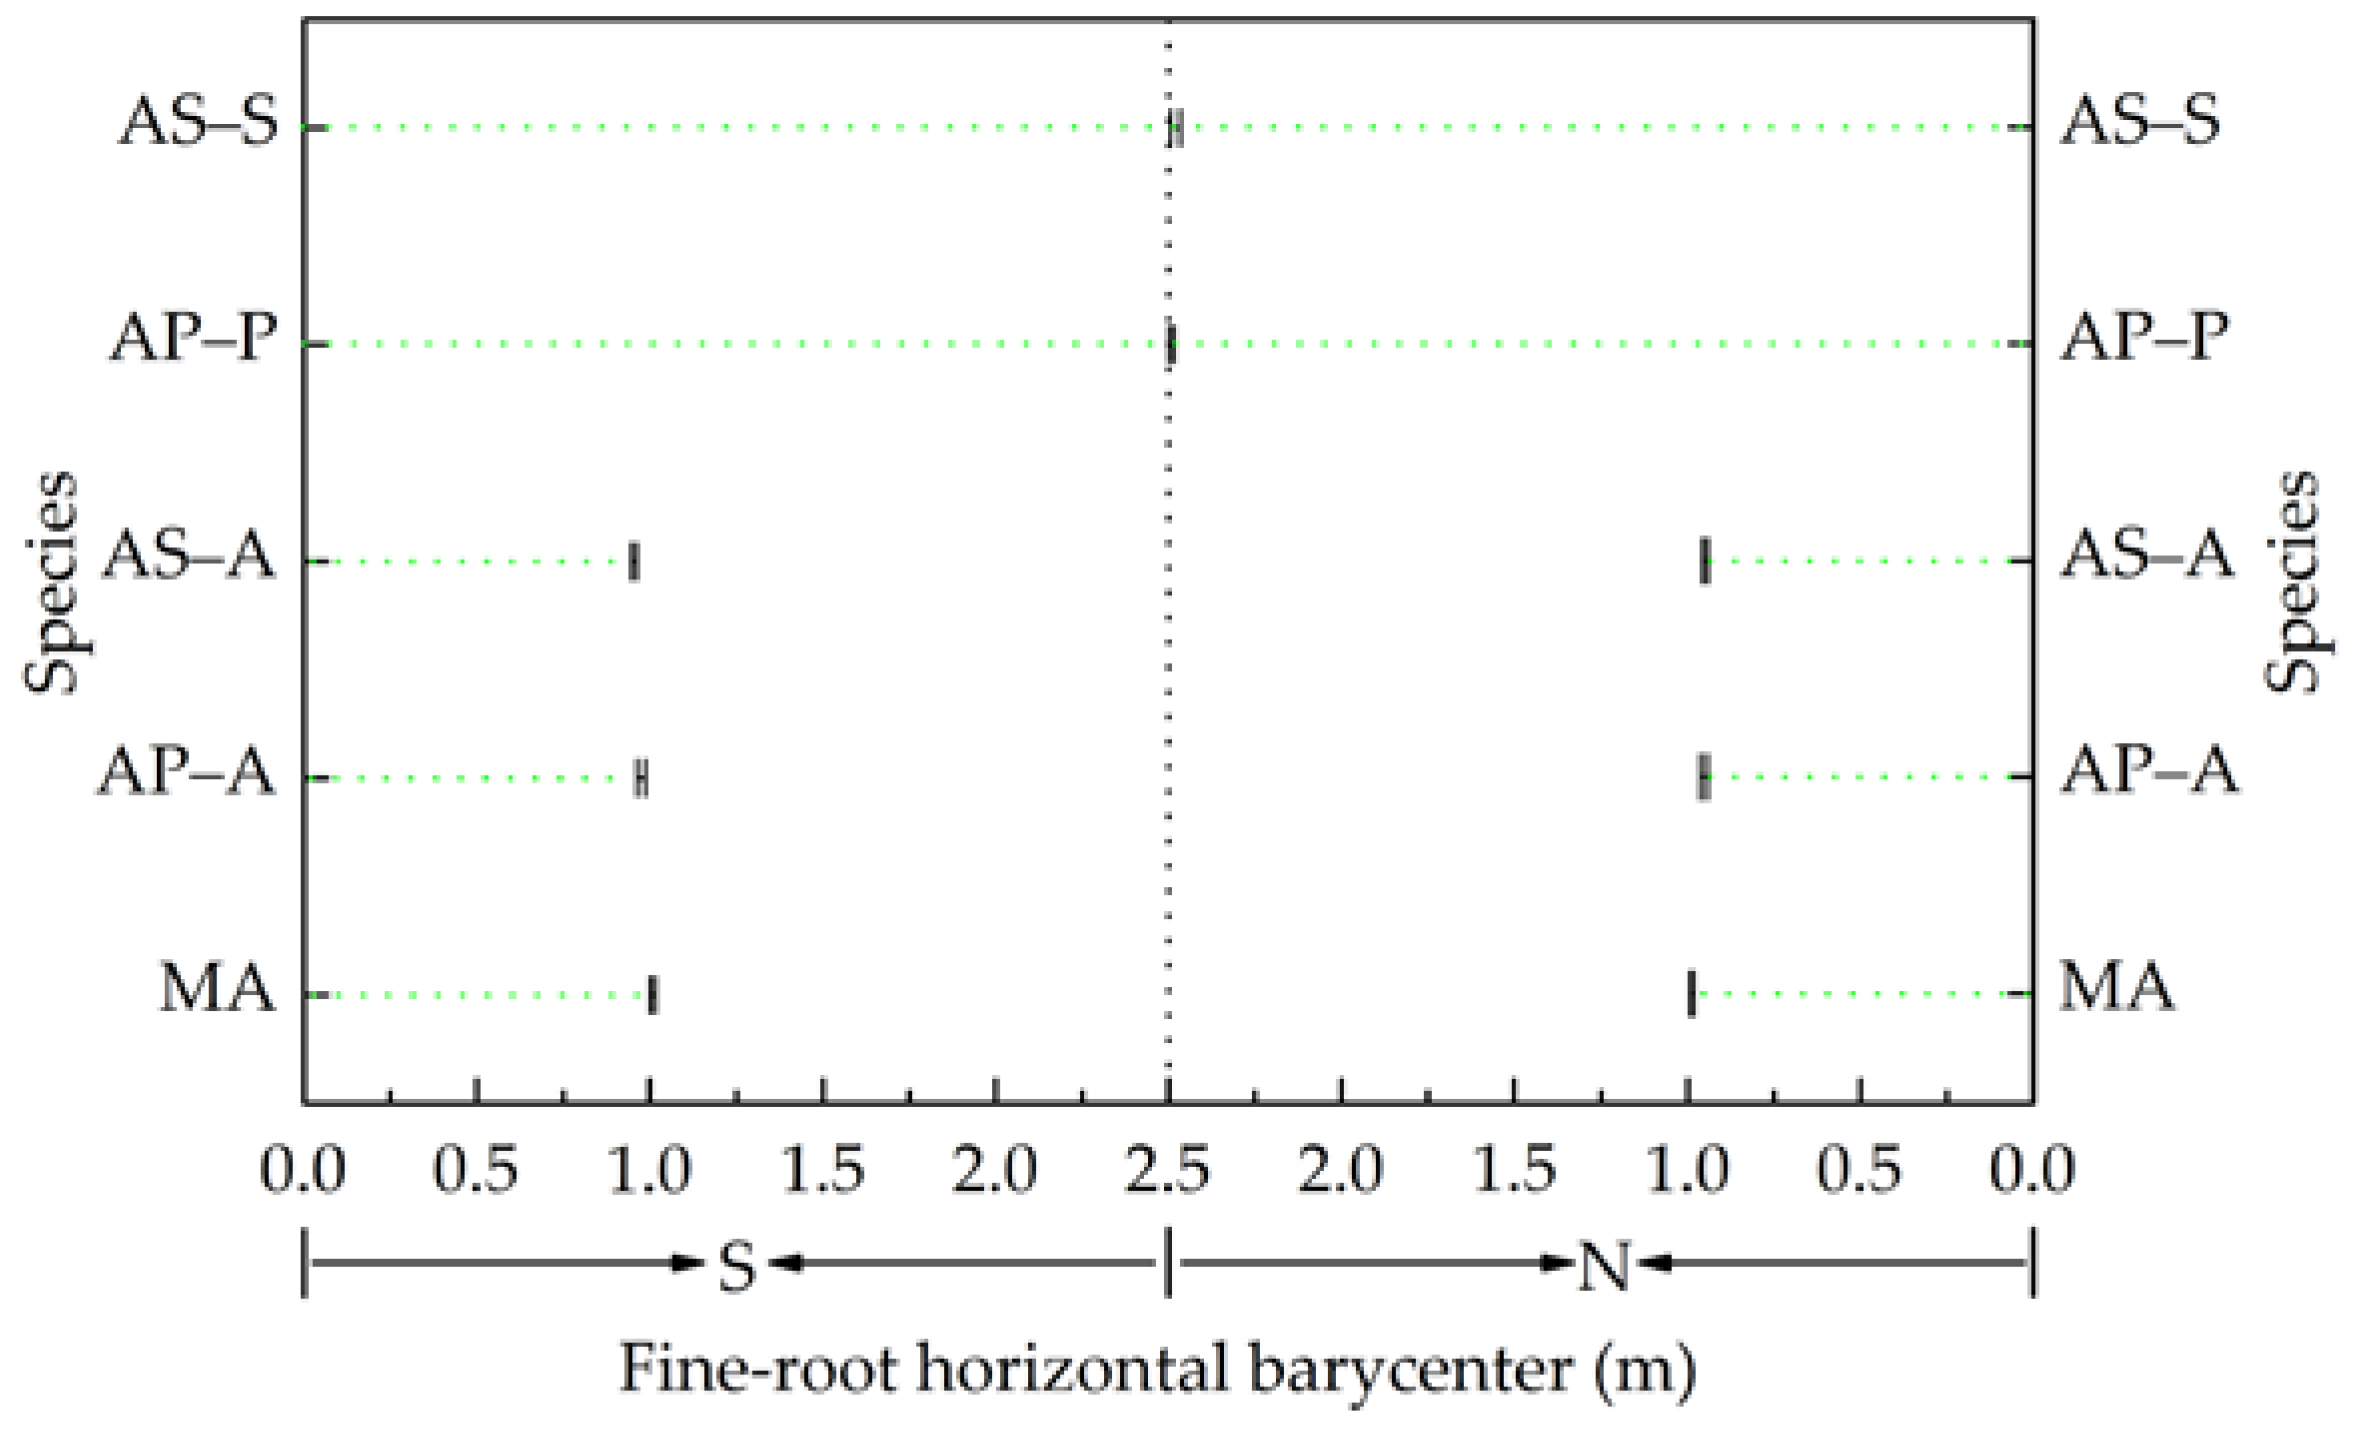
2.6. Fine-Root Horizontal Distribution

A root spatial distribution barycenter formula [27,30] was used to compare the fine-root horizontal barycenter (FRHB) changes between treatments and to analyze the variation in the horizontal distribution of fine roots in each treatment. The formula is as follows:
FRHB = i = 1 n D i P i ,
In the formula, FRHB represents the distance of the horizontal barycenter of FRBD (m); i (i ≤ 10) represents the section; Di is the distance from the center of the section to the apple tree row (m), in which the Di of S1, S2, S3, S4, and S5 is a distance of 0.7, 1.1, 1.5, 1.9, and 2.3 m, respectively, south of the apple tree row and in which the Di of N1, N2, N3, N4, and N5 is a distance of 0.7, 1.1, 1.5, 1.9, and 2.3 m, respectively, north of the apple tree row; and Pi represents the proportion of FRBD in each section accounting for the total FRBD of all sections.

2.7. Statistical Analyses

Analysis of variance (ANOVA) was performed using SPSS 22.0 (IBM Inc., Armonk, NY, USA). The FRBD of each depth was the mean value of FRBD of the depth of all sections (S1, S2, S3, S4, S5, N5, N4, N3, N2, and N1). The FRBD of each section was the mean value of FRBD of the 0–100 cm depth. All parameters (FRBD, d50, and FRHB) for each treatment were described in terms of mean values (n = 3) followed by their standard deviations. Differences between different distances or depths for apple trees (MA, AP–A or AS–A) or crop species (MP, AP–P, MS or AS–S) were determined via one-way ANOVA, and significant differences between their mean values were compared using the least significant difference test (LSD). Paired-sample t-tests were used to examine differences in FRBD and d50 between the apple trees and crops or between the monocropping systems and intercropping systems. The statistical results with error bars and significance level (p) are shown, and differences were considered statistically significant at p ≤ 0.05.

3. Results

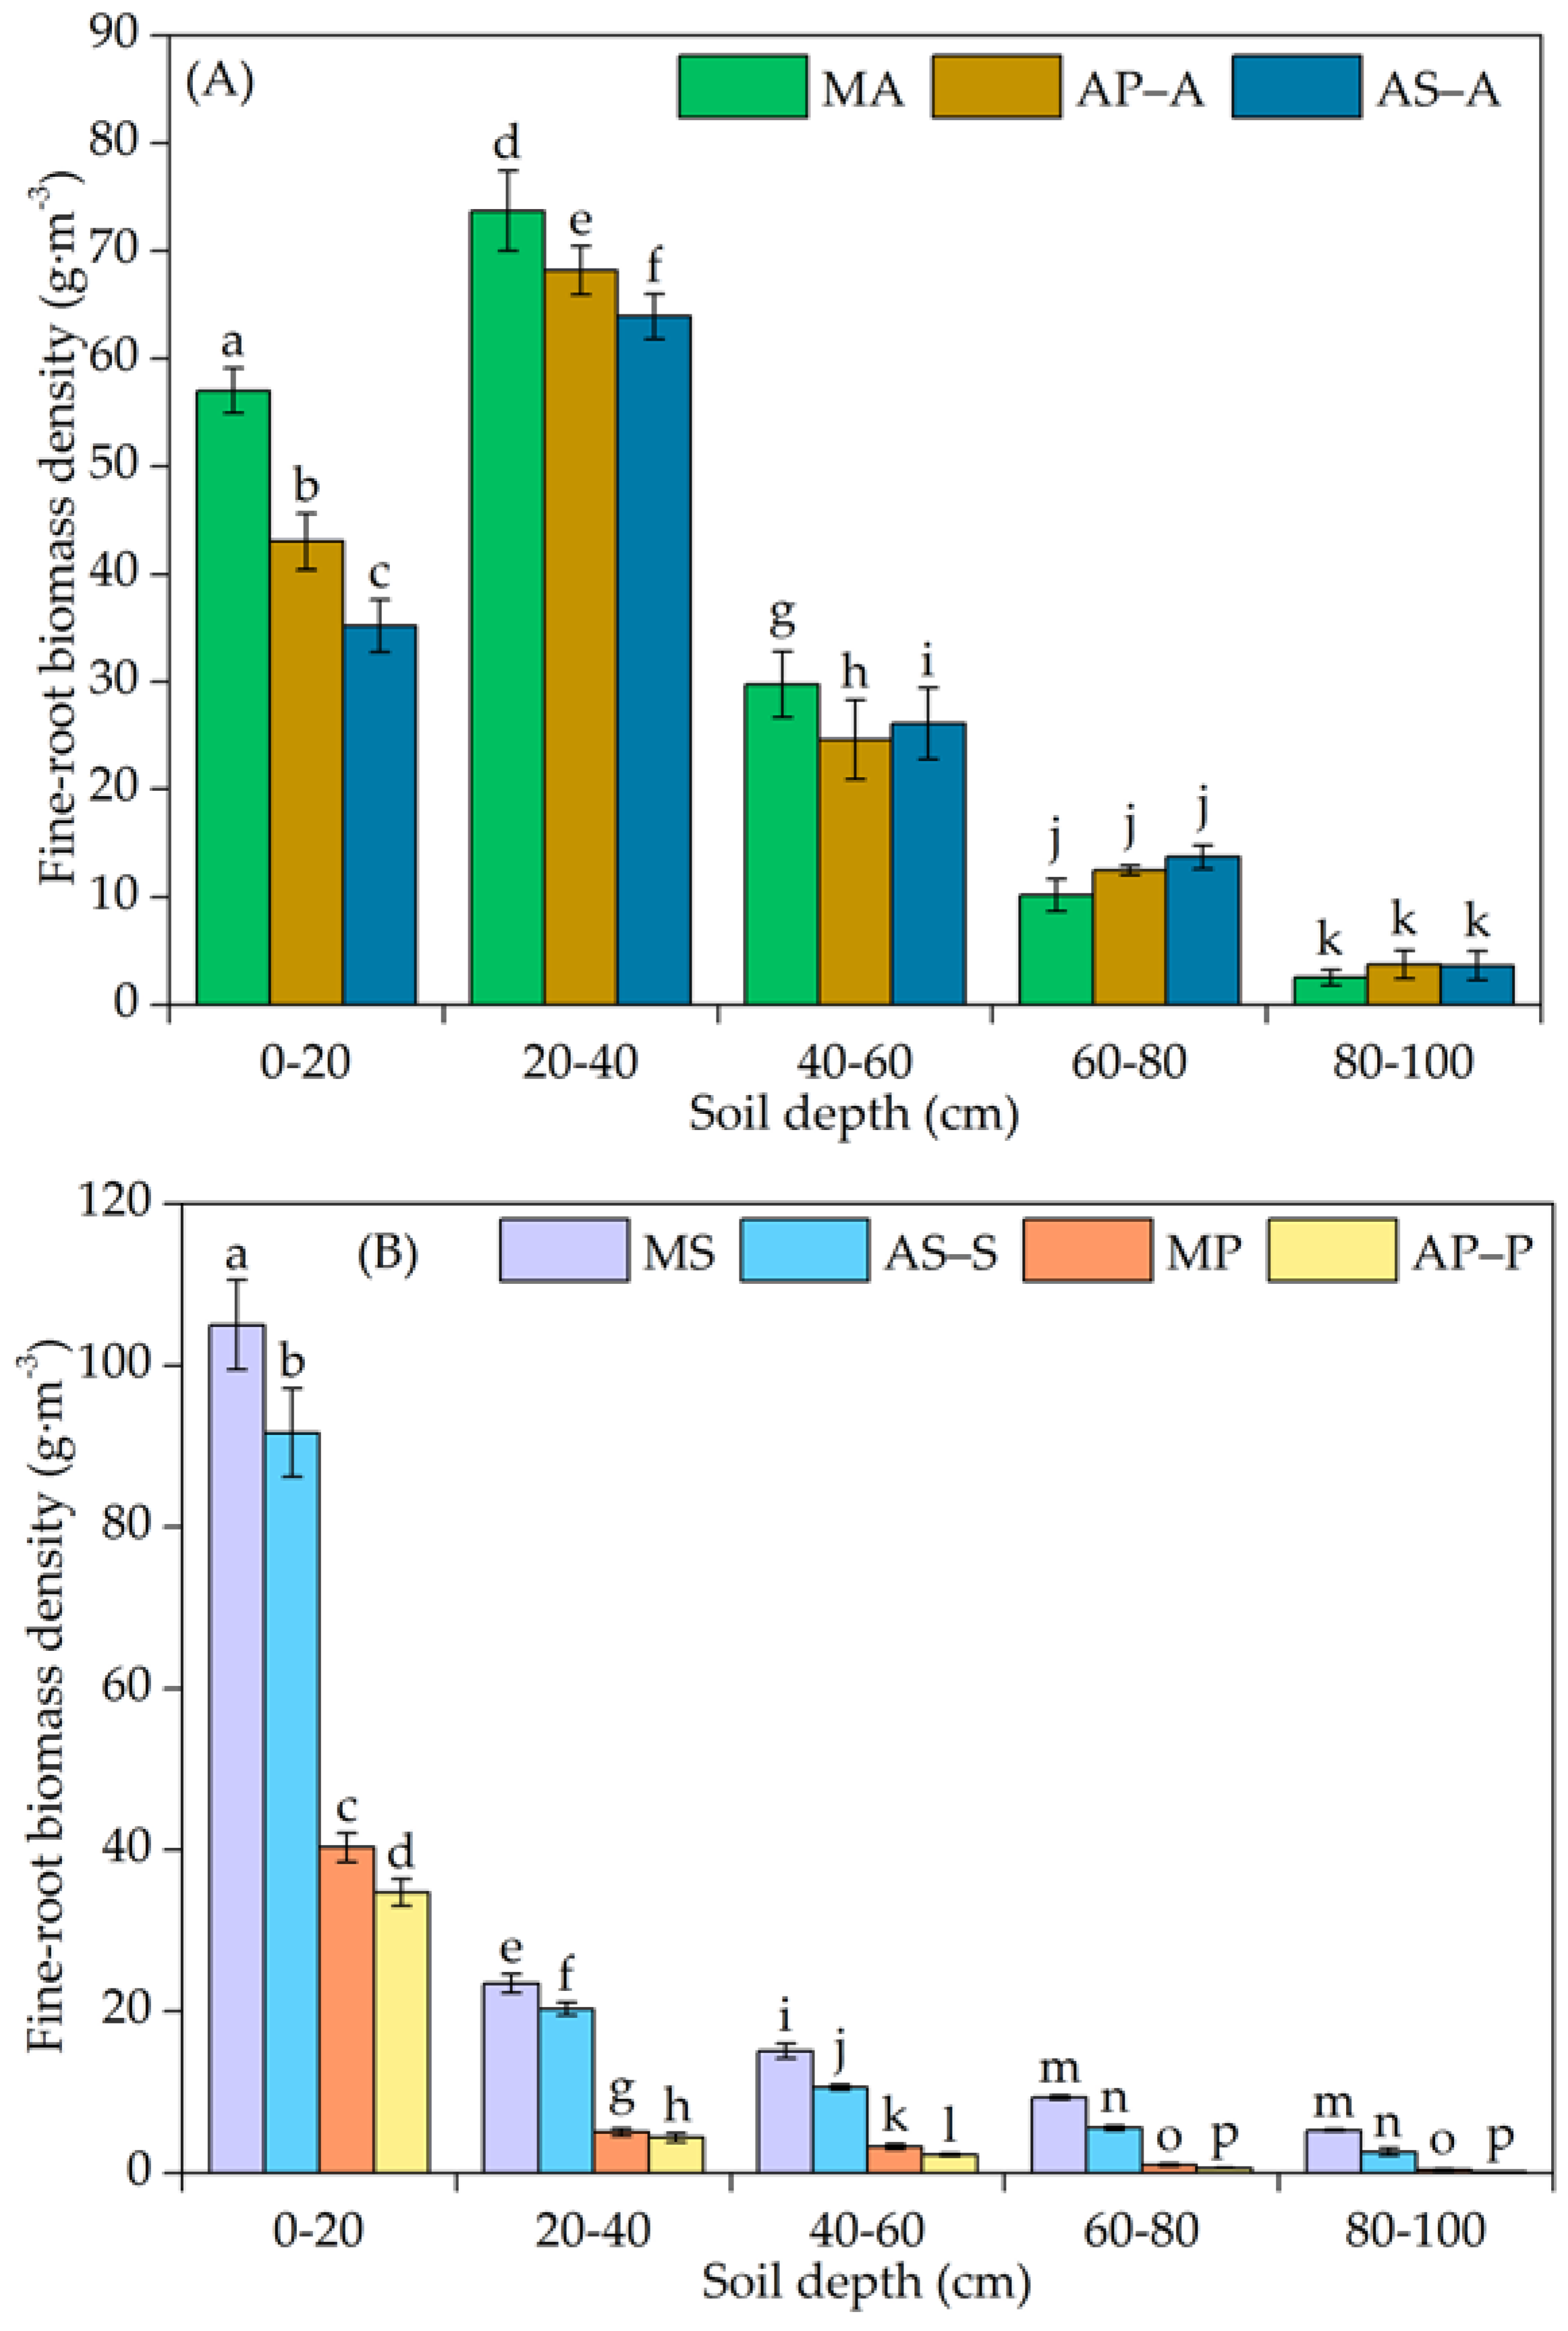
3.1. Vertical Distribution of the Fine-Root Biomass Density

The vertical distribution of the FRBD (mean value of FRBD of the depth of all sections) of apple trees initially increased but then decreased as the soil depth increased (Figure 2A). In addition, the FRBDs of apple trees were concentrated within the 20–40 cm soil depth, where the FRBD of AP–A, AS–A and MA accounted for 44.84%, 44.85%, and 42.54% of the total FRBD (0–100 cm), respectively. Moreover, the FRBD values of apple trees were concentrated mostly within the 0–60 cm soil depth, where the AP–A, AS–A, and MA accounted for 89.31%, 87.82%, and 92.63% of the total FRBD, respectively. Overall, compared with MA, the FRBD of AP–A and AS–A decreased by 12.21% and 17.71%, respectively. Furthermore, compared with MA, the FRBD of AP–A and AS–A significantly decreased (P < 0.05) within the 0–60 cm soil depth, while the FRBD of AP–A and AS–A decreased by 24.66 and 35.28 g·m−3, respectively. However, compared with MA, the FRBD of AP–A and AS–A indistinctively (P > 0.05) increased within a soil depth of 60–100 cm, and the FRBD of AP–A and AS–A increased by 3.50 and 4.60 g·m−3, respectively.
The vertical distribution of the FRBD (mean value of FRBD of the depth of all sections) of peanut plants and soybean plants decreased as the soil depth increased (Figure 2B). The FRBD concentrated within the 0–20 cm soil depth of MP, AP–P, MS, and AS–S accounted for 80.60%, 82.42%, 66.40%, and 70.09% of the total FRBD (0–100 cm), respectively. The FRBD of MP and AP–P was concentrated mostly within the 0–40 cm soil depth, accounting for 90.70% and 92.87% of the total FRBD, respectively. The FRBD of MS and AS–S was concentrated mostly within the 0–60 cm soil depth, accounting for 90.75% and 93.74% of the total FRBD, respectively. Overall, the FRBD values of AP–P and AS–S were significantly (P < 0.05) less than the corresponding values in MP and MS within the 0–100 cm soil depth, and the FRBD values of AP–P and AS–S were reduced by 7.86 and 27.39 g·m−3, respectively. Compared with the corresponding monocropped crops, the proportion of FRBD that was reduced in intercropped crops increased as the soil depth increased.

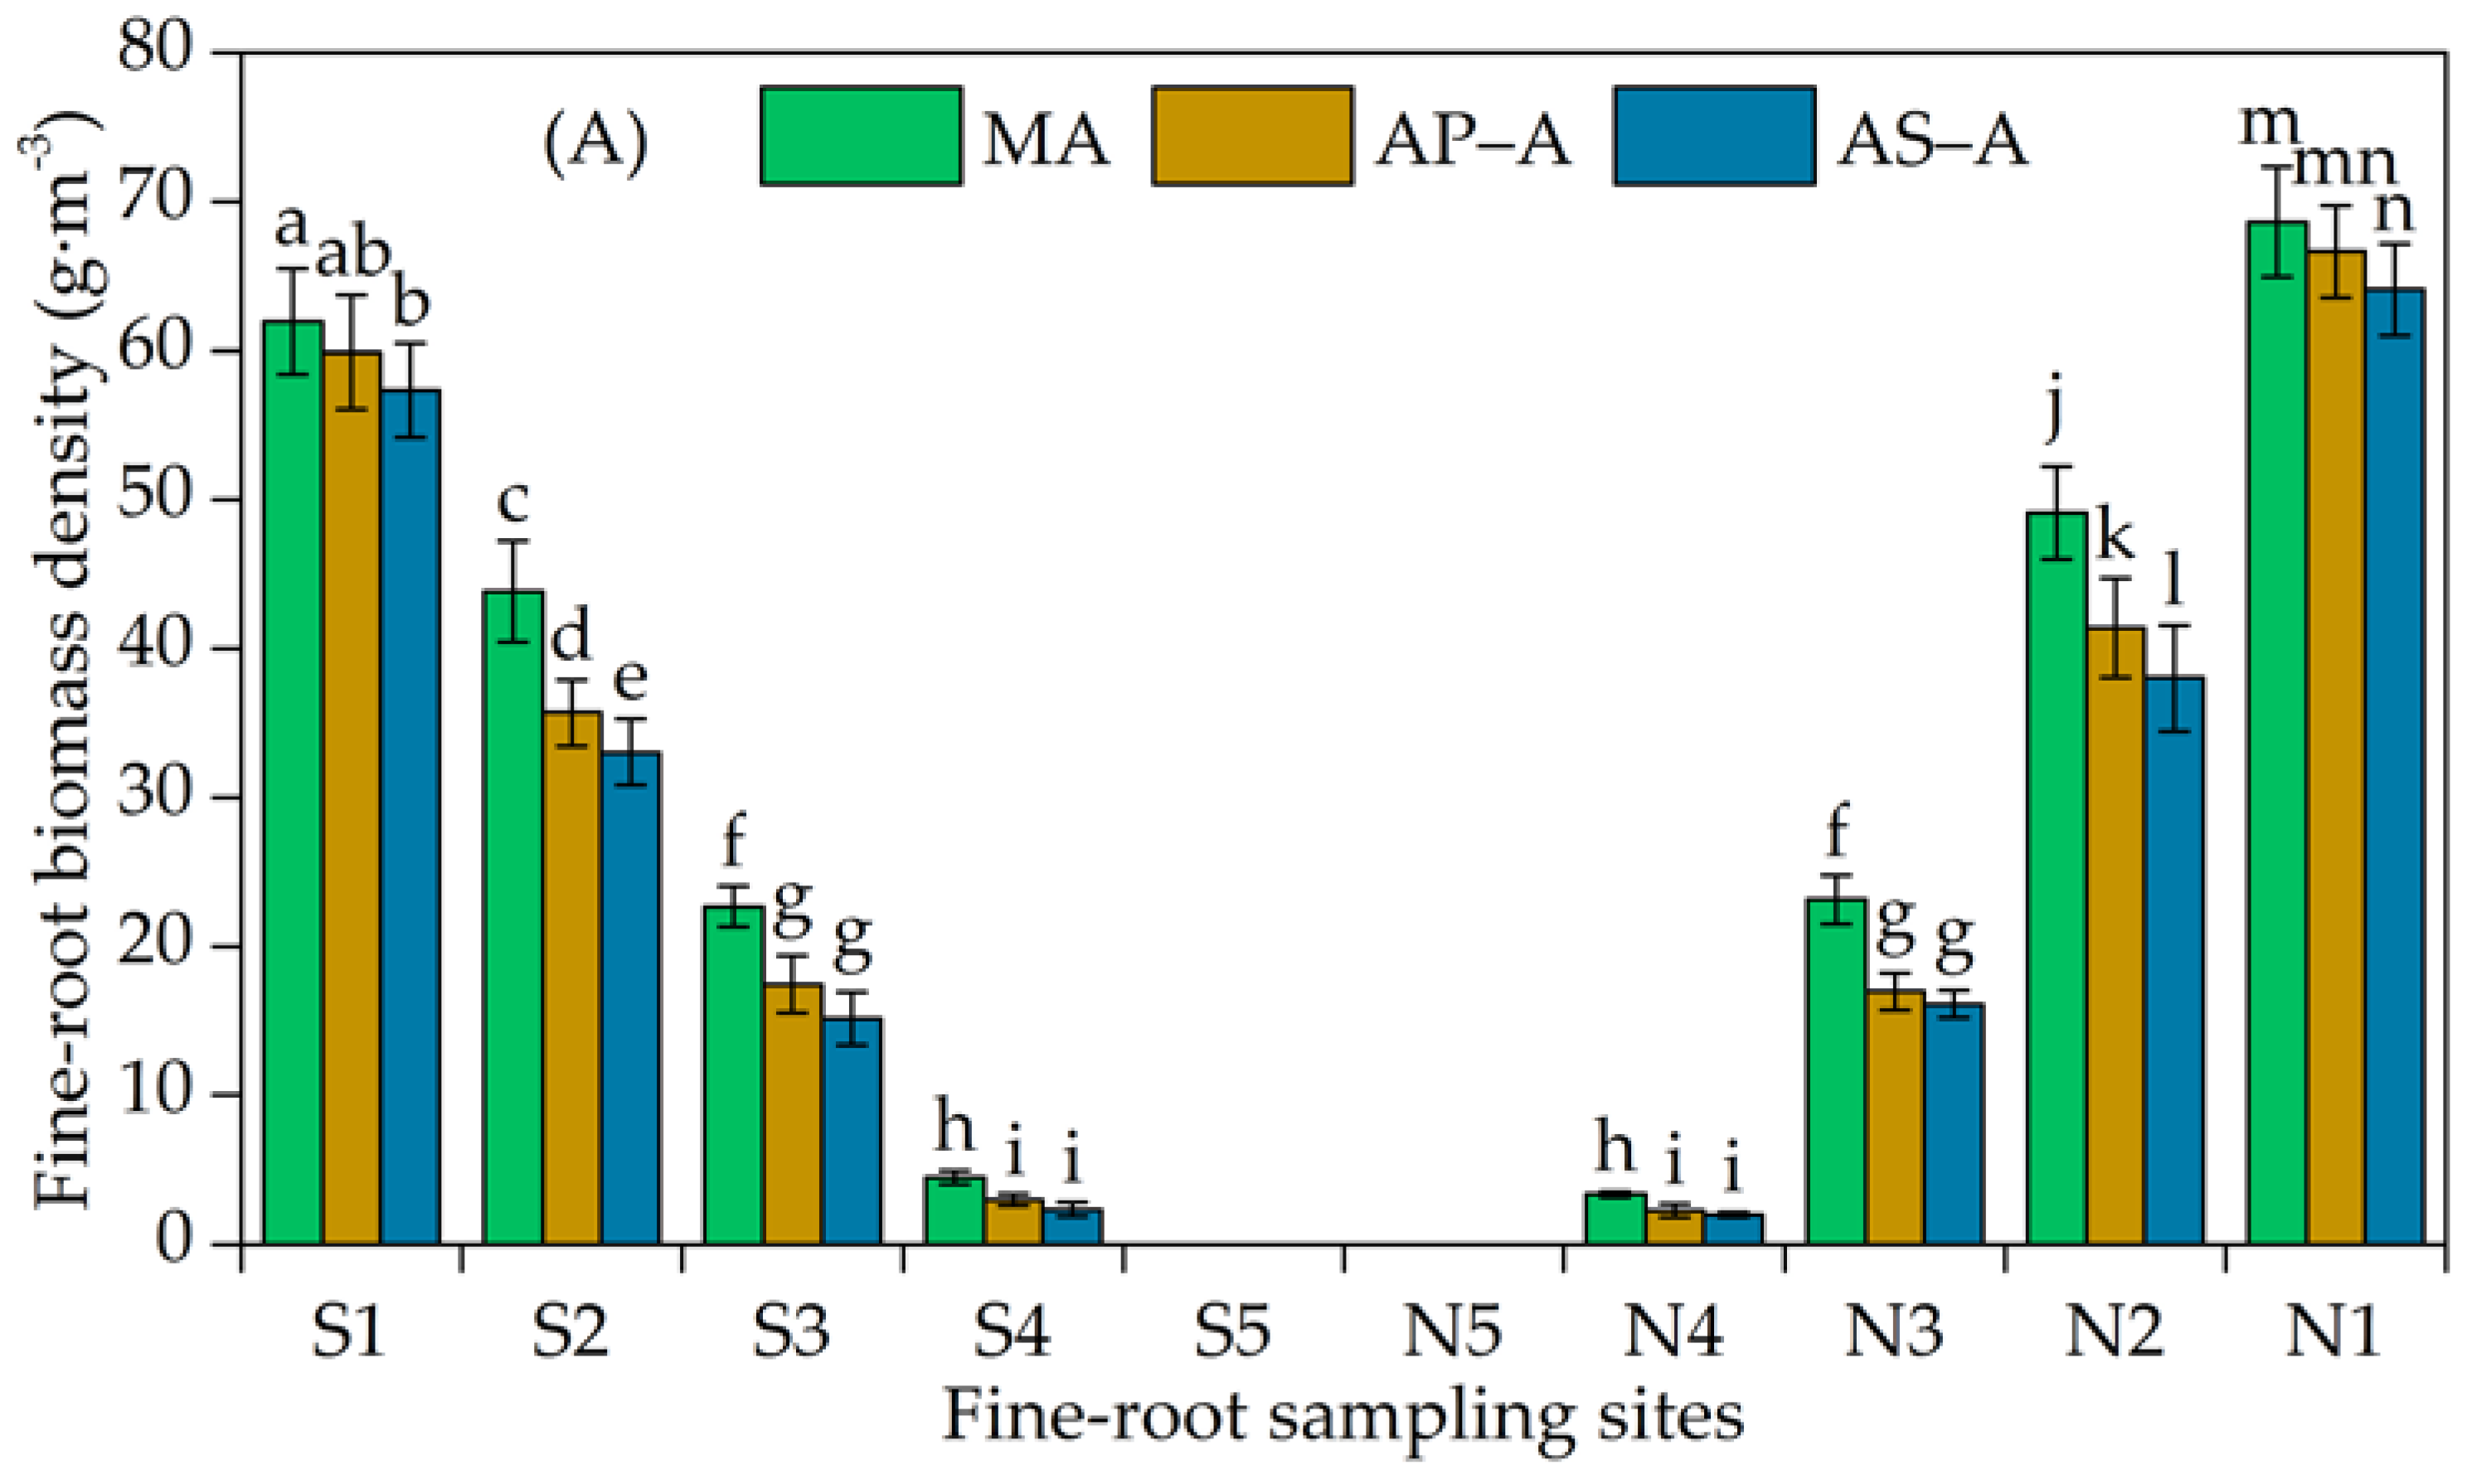
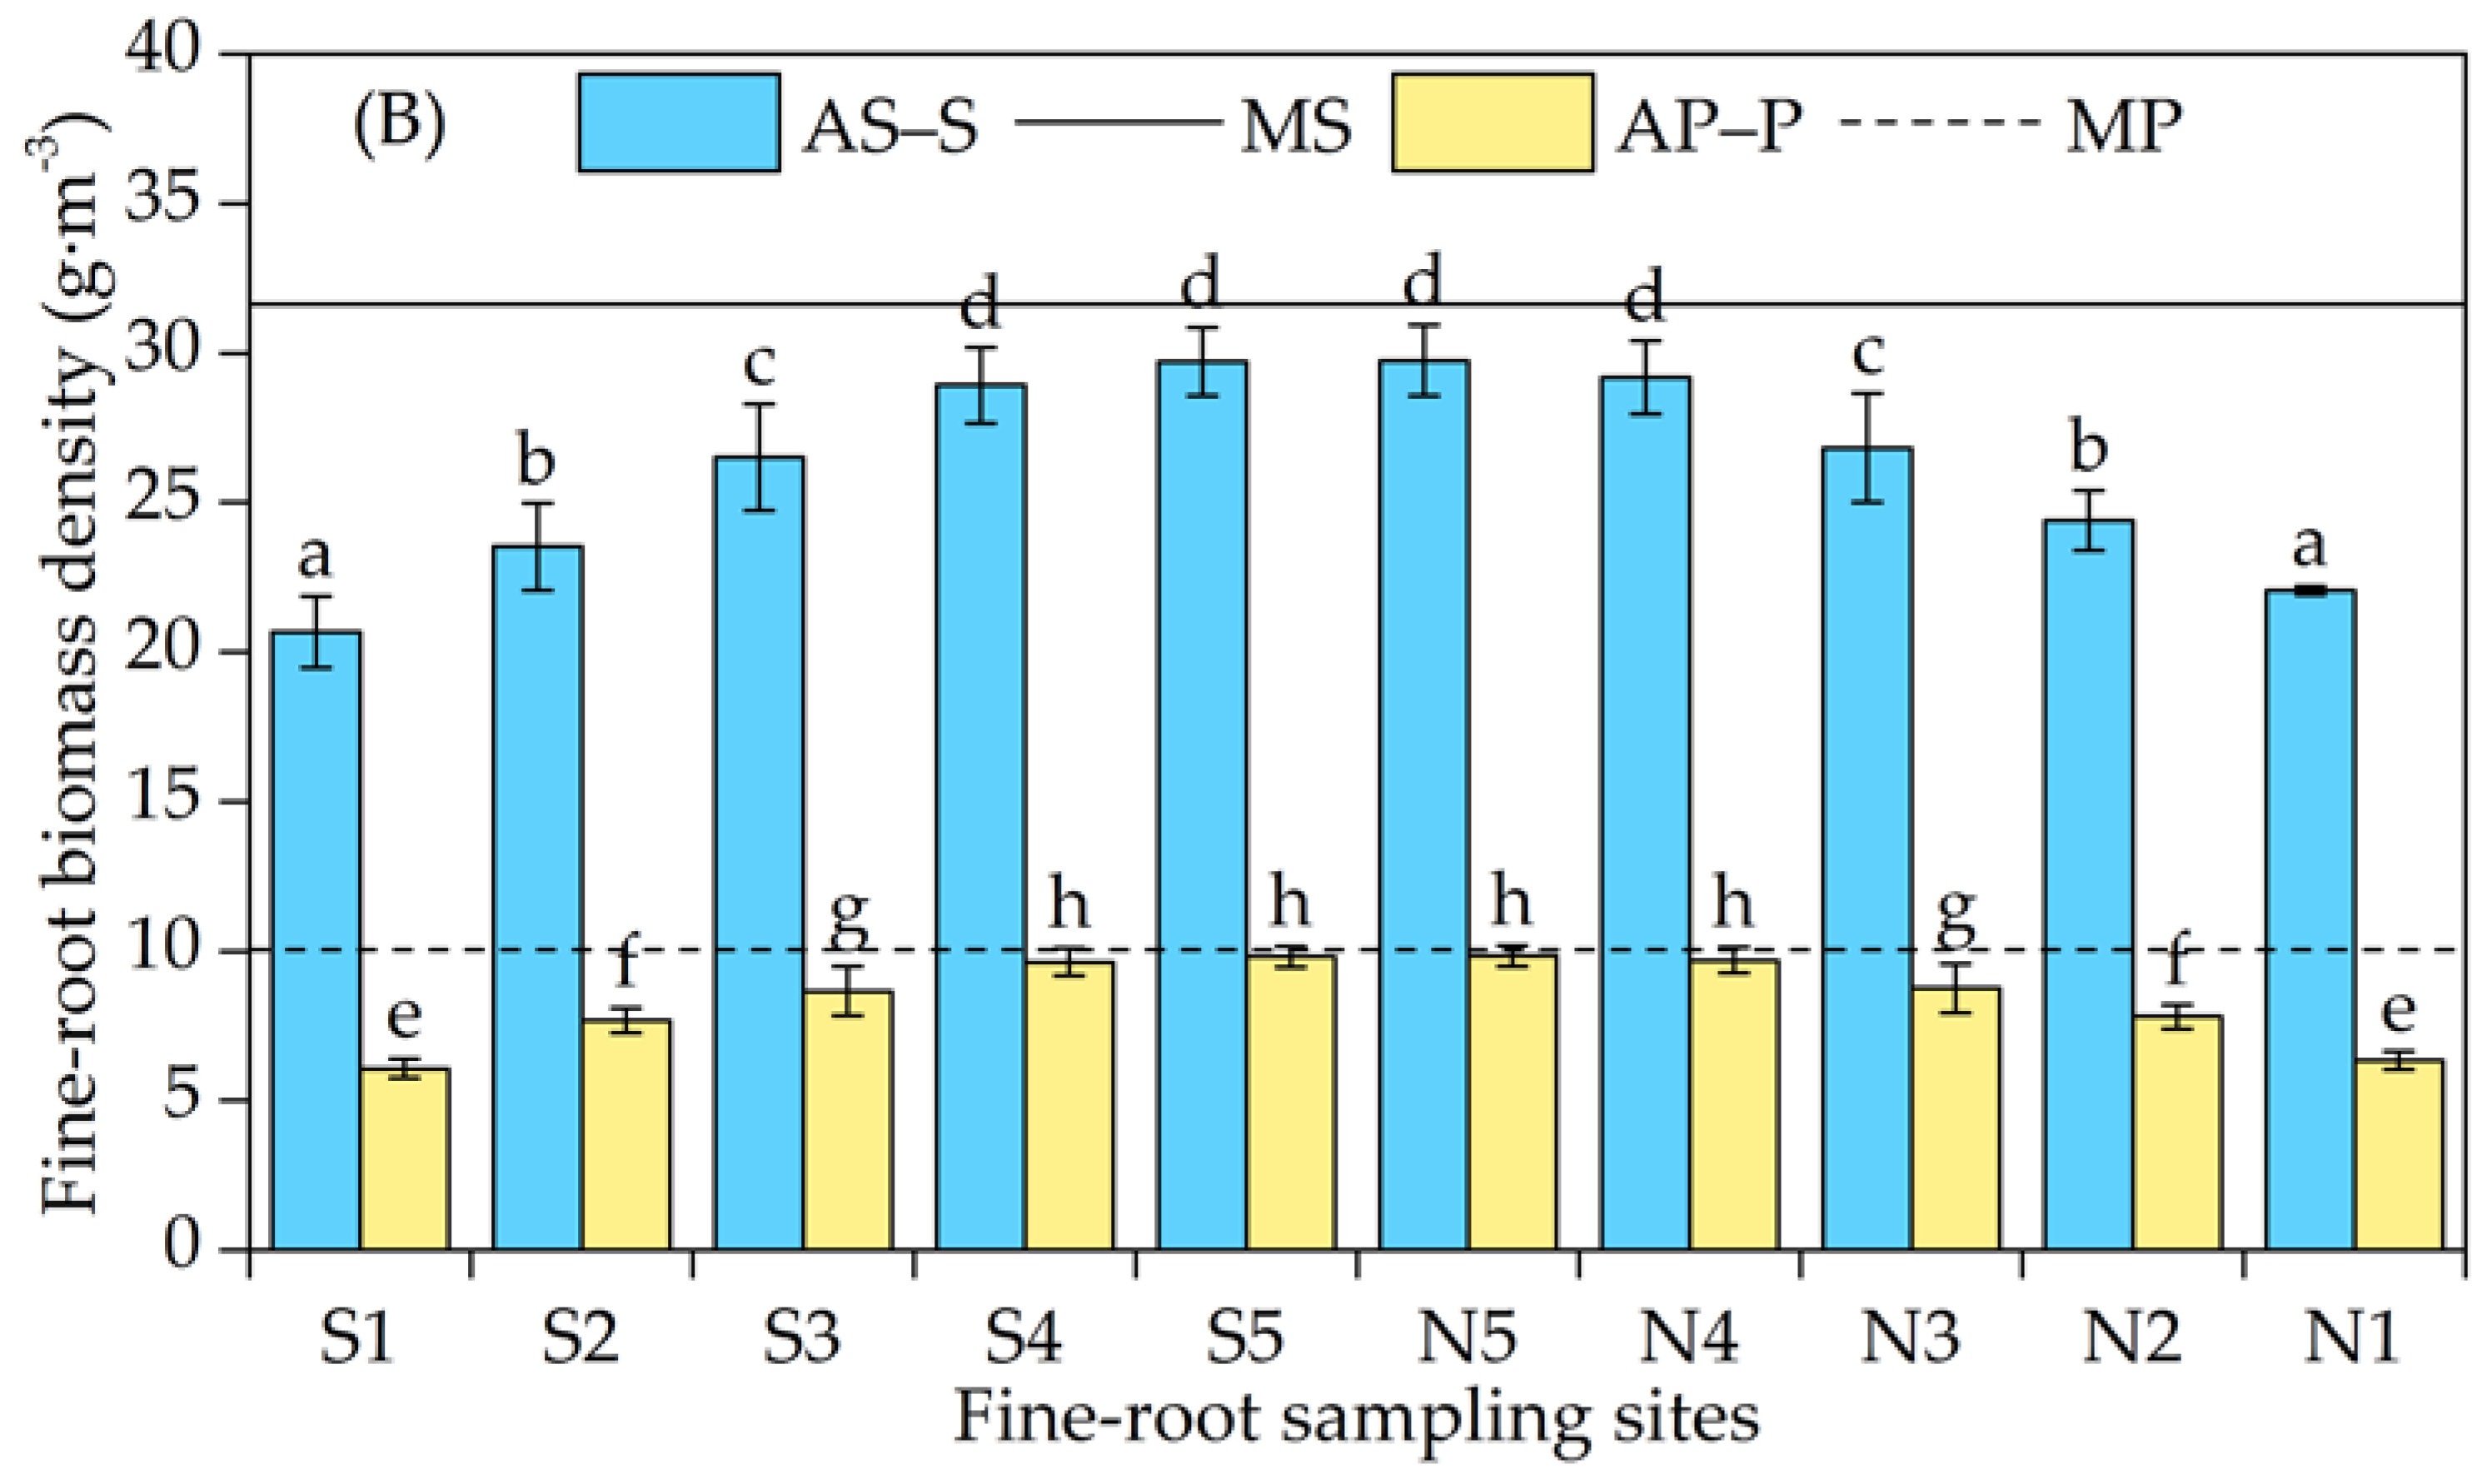
3.2. Horizontal Distribution of the Fine-Root Biomass Density

The fine roots of apple trees were distributed within a distance of only 2.1 m from the apple tree row (Figure 3A). As the distance to the apple tree row decreased, the FRBD (mean value of FRBD of the 0–100 cm depth) increased. The FRBD was slightly larger north (mean value of FRBD of sections N1–N4) of the apple tree row than south (mean value of FRBD of sections S1–S4) of the row in MA, AP–A and AS–A; the values were 8.49%, 9.70%, and 11.46% greater on the north side than on the south side, respectively. The majority of the FRBD of MA, AP–A, and AS–A was concentrated in the 0.5–1.3 m sections and accounted for 80.60%, 83.62%, and 84.40% of the total FRBD, respectively. In addition, compared with MA, the proportion of FRBD that was reduced of AP–A and AS–A increased as the distance from the apple tree row increased.
The FRBD of AP–P and AS–S north (mean value of FRBD of sections N1–N5) of apple tree row was 1.41% and 2.23% larger than that south (mean value of FRBD of sections S1–S5) of the apple tree row, respectively (Figure 3B). The shorter the distance to the tree row, the lower was the value of FRBD (mean value of FRBD of the 0–100 cm depth) of AP–P and AS–S within a distance ranging from 0.5–2.5 m from apple tree row. The FRBD values of AP–P and AS–S were significantly (p < 0.05) lower than the corresponding values of MP and MS within a distance ranging from 0.5–1.7 m from the apple tree row.

3.3. Vertical Distribution of Fine Roots

To compare the fine-root distributions between treatments, d50 depths (Figure 4A) were determined by fitting Equation (3) to the data from each treatment. Curves fitted to the data from each apple treatment showed that MA had the shallowest fine-root distribution and that AS–A had the deepest distribution; additionally, the depth of the fine-root distribution in AP–A was between that of MA and AS–A (Figure 4B). Curves fitted to the data from each crop treatment showed that AP–P and AS–S had shallower fine-root distributions than those of the corresponding MP and MS; additionally, the distributions of AP–P and MP were both closer to the soil surface than the distributions of AS–S and MS (Figure 4C).
The horizontal distribution regularities of d50 on the south and north sides were nearly identical (Figure 5A,B). The values of d50 of AP–A, AS–A, and MA tended to be deeper as the distance from the apple tree row increased. The values of d50 of AP–A (Figure 5A) and AS–A (Figure 5B) were both larger than that of MA in each section. Overall, the values of d50 of AP–A and AS–A were significantly (p < 0.01) greater than that of MA, with a difference of 3.41 and 5.26 cm deeper, respectively. The relative distance (the values of d50 in MA minus that of in AP–A/AS–A) of the d50 between intercropped apple trees (AP–A and AS–A) and MA gradually increased as the distance from the apple tree row increased.
The d50 horizontal distributions in AP–P and AS–S were essentially identical on both the south and north sides (Figure 5C,D). The values of d50 of AP–P and AS–S tended to deepen as the distance from the apple tree row increased. Generally, values of d50 of AP–P and AS–S were significantly (p < 0.05) shallower than those of the corresponding MP and MS with a difference of 1.23 and 2.21 cm, respectively. The relative distance (the values of d50 in MP/MS minus that of in AP–P/AS–S) of the d50 between intercropped crops (AP–P and AS–S) and their corresponding monocropped crops (MP and MS) gradually decreased as the distance from the apple tree row increased.
The values of d50 in AP–A and AS–A were both greater than that of AP–P (Figure 5E) and AS–S (Figure 5E,F). Overall, the relative distance of the d50 in each component in the apple–peanut intercropping system (the value of mean d50 in AP–A minus that of in AP–P) was 1.87 cm greater than that in the apple–soybean intercropping system (the value of mean d50 in AS–A minus that of in AS–S) within a distance ranging from 0.5–2.1 m from apple tree row. There were significant (p < 0.05) differences between intercropped apple (AP–A and AS–A) and the corresponding intercropped crops (AP–P and AS–S) in the sections whose distance ranged from 0.5–2.1 m from the tree row, and their relative distance (the values of d50 in AP–A/AS–A minus that of in AP–P/AS–S) increased as the distance from the tree row increased. The relative distance of the apple–peanut intercropping system and apple–soybean intercropping system north (mean value of d50 of sections N1–N4 in AP–A/AS–A minus that of in AP–P/AS–S) of the apple tree row was 0.08 and 0.24 cm larger than that south (mean value of d50 of sections S1–S4 in AP–A/AS–A minus that of in AP–P/AS–S) of the apple tree row, respectively. The relative distance (the values of d50 in AP–A minus that of in AP–P) between AP–A and AP–P in the sections whose distance ranged from 0.5–1.3 m from the apple tree row was less definitive than that in the sections whose distance ranged from 1.3–2.1 m. The relative distance (the values of d50 in AS–A minus that of in AS–S) of AS–A and AS–S in the sections whose distance ranged from 0.5–1.7 m from the apple tree row was less definitive than that in the sections whose distance ranged from 1.7–2.1 m.

3.4. Horizontal Distribution of Fine Roots

The FRHB values in MA, AP–A, and AS–A were essentially symmetrical on the north and south sides of the apple tree row (Figure 6). The FRHB values in both AP–A and AS–A were lower than that of MA; AP–A, and AS–A approaching 0.03 m and 0.04 m (the average of the south and north sides), respectively, from the apple tree row. The fine roots of MP and MS were evenly distributed. In the 4.0 × 5.0 m monoculture sample plot, the FRHB values in MP and MS were within 2.5 m from the center of the plot. Thus, compared with MP and MS, the FRHB values in AP–P and AS–S approached the northern tree row by 0.01 and 0.02 m, respectively.

4. Discussion

4.1. Variation in the Vertical Distribution of Fine Roots

The fine roots of intercropped apple trees were distributed mostly within the 20–40 cm soil depth (see Figure 2A), as was also concluded by Bi et al. (2011) [23]. The fine roots of intercropped peanut plants and soybean plants were distributed mostly within the 0–20 cm soil depth (see Figure 2B), which was the same conclusion reached by Xu et al. (2013, 2014) [27,30]. These results indicated that the vertical distribution of fine roots in the apple–crop intercropping systems is skewed. The intercropped crops mainly use shallow soil resources, while the intercropped apple plants can use the relatively deep soil resources, of which the intercropped crops use less. This root distribution pattern is beneficial for reducing below-ground competition among species and for improving the utilization efficiency of deep soil resources in apple–crop intercropping systems [40]. The fine roots of intercropped walnut trees were concentrated within the 0–20 cm soil depth [30], while the fine roots of intercropped apple trees were within the 20–40 cm soil depth (see Figure 2A). Therefore, compared with walnut–soybean intercropping systems [30], the fine-root distribution in apple–crop intercropping systems has a better spatial structure and reduces the competition between apple–crop intercropping system components for surface soil resources. In the arid and semi-arid regions of the Loess Plateau, water is the primary limiting factor for plant growth, and soil nutrients on farmland are insufficient [41]. The FRBD value in intercropped apple trees (AP–A and AS–A), AP–P and AS–S was concentrated mostly within the soil depths of 0–60 cm (see Figure 2A), 0–40 cm and 0–60 cm (see Figure 2B), respectively. These results indicated that both the competition for soil moisture and nutrients caused by insufficient resources and spatial overlap of fine roots inevitably occur within the 0–40 cm soil depth in apple–peanut intercropping systems and within the 0–60 cm soil depth in apple–soybean intercropping systems. Generally, perennials have greater longevity and a larger root system than those of annuals. Interspecific roots inevitably compete for below-ground resources when perennials and annuals grow together [34]. The study results confirmed that apple–crop intercropping inhibited the growth of fine roots of apple trees (see Figure 2A), and the fine roots of AS–A were more suppressed than those of AP–A (see Figure 2A). In addition, the FRBD values of AP–A and AS–A were inhibited by AP–P and AS–S within the 0–60 cm soil depth. However, apple–crop intercropping could promote the growth of the fine roots of apple trees within the 60–100 cm soil depth (see Figure 2A), which is direct evidence of the variation in the fine-root distribution in apple–crop intercropping systems. When competition is inevitable, plants promote greater root development in the deeper layers of the soil to capture greater amounts of moisture and nutrients [25,42]. This root development is also a response to the weakened deep soil competitiveness of intercropped crops. Compared with AP–A, the fine-root growth of AS–A was seemingly more promoted by apple–crop intercropping (see Figure 2A), as the fine roots were much more abundant in AS–S than in AP–P (see Figure 2B) and were more competitive with respect to soil moisture and nutrients [38]; this increased competitiveness led to an increase in fine roots in AS–A deep in the soil to meet the absorption of soil moisture and nutrients in that system. This phenomenon constitutes an adaptive strategy for the interspecific below-ground competition of intercropped apple trees adapted to different intercropping crops. The inhibitory effect of intercropped apple on the fine roots in both AP–P and AS–S was mainly concentrated within the 0–100 cm soil depth (see Figure 2B). In addition, AS–S was more suppressed than AP–P (see Figure 2B), which might have occurred because more fine roots were present in AS–S than in AP–P.
To adapt to the spatial heterogeneity of soil moisture and nutrients in apple–crop intercropping systems, the distribution characteristics of the fine roots of intercropped apple trees and intercropped crops changed, which reflected the response of the variation of fine-root distribution to environmental conditions [30,43]. The present study confirmed that the fine roots of intercropped apple trees move towards deep soil (see Figure 4B and Figure 5A,B) and the fine roots of intercropped crops move towards the soil surface (see Figure 4C and Figure 5C,D). Many researchers studying tree–crop intercropping systems have reached the same conclusion [27,28,29,30,32,33,34,35,36,44]. This phenomenon may help the fine roots of intercropped apple trees to enlarge the absorption area of soil moisture and nutrients, and reduces the degree of the fine-root niche overlap between the intercropped apple trees and intercropped crops, thus improving the utilization efficiency of soil resources. Apple–peanut intercropping systems have a better niche separation status than that of apple–soybean intercropping systems (see Figure 5E,F), and the productivity of the apple–peanut intercropping system was higher than that of the apple–soybean intercropping system [6]; therefore, apple–peanut intercropping systems were better than apple–soybean intercropping systems. According to theoretical ecology, competition occurs under conditions in which the supply of shared resources is insufficient and the niches overlap [45,46]. Our previous studies found that the apple–peanut intercropping system has better soil moisture and soil nutrients than the apple–soybean intercropping system [23]. Therefore, the interspecific below-ground competition of the apple–peanut intercropping system is weaker than that of apple–soybean intercropping system. The degree of fine-root niche overlap of apple–crop intercropping systems south of the apple tree row was slightly larger than that north of the row (see Figure 5E,F), and soil moisture was better on the north of the apple tree row than on the south [47]; therefore, the interspecific below-ground competition was fiercer on the south side of the apple tree row than on the north side. In the apple–crop intercropping systems, soil moisture and nutrients increased as the distance from the tree row increased [23], and the degree of fine-root niche overlap decreased as the distance from the tree row increased (see Figure 5E,F); therefore, interspecific competition for soil moisture and nutrients decreased as the distance from the tree row increased. Moreover, intense competition occurred in the apple–peanut intercropping system and apple–soybean intercropping system in the sections whose distance ranged from 0.5–1.3 and 0.5–1.7 m from the tree row, respectively (see Figure 5E,F).

4.2. Variation in the Horizontal Distribution of Fine Roots

The fine roots of 5-year-old apple trees were distributed within a distance of 2.1 m from the apple tree row and mostly within 1.3 m from the tree row (see Figure 3A); these results were similar to the conclusion of Meng et al. [29]. The fine roots of AP–P and AS–S grew vigorously as the distance from the apple tree row increased (see Figure 3B); this vigorous growth may increase the competitive advantage of the roots with respect to soil moisture and nutrient uptake [48] and is a positive response to the reduced competitiveness of intercropped apple trees [23]. This study found that the FRBD on the north side of the apple tree row in both intercropped apple trees and intercropped crops was greater than that on the south side of the apple tree row (see Figure 3A,B), which might be affected by the shading of the crown, while the soil moisture status on the north side of the apple tree row was better than that on the south side [47]. The FRBD values of intercropped apple trees and intercropped crops in each section were lower than those of the monocropped systems (see Figure 3A,B), possibly because the interspecific below-ground competition of the apple–crop intercropping systems led to amounts of soil moisture and nutrients that were lower than those in monocropped systems [6]. With respect to root system competition in agroforestry systems, plants whose root systems were developed had a greater ability to obtain soil nutrients and exhibited a stronger adaptability to changes in the soil environment [49]. Therefore, these kinds of plants had a greater competitive advantage. The intercropped apple trees have a greater competitive advantage in apple–crop intercropping systems.
The apple–crop intercropping suppressed the horizontal expansion of the fine roots of intercropped apple trees (see Figure 6). Similarly, the walnut–Scutellaria baicalensis (Scutellaria baicalensis Georgi) intercropping suppressed the horizontal expansion of fine roots of walnut trees [35]. In the apple–crop intercropping system, the FRHB values in AP–P and AS–S were slightly closer to that of the north of apple tree row (see Figure 6), probably due to soil moisture conditions that were better on the north side of the apple tree row than on the south side [47]. However, compared with the variation in the vertical distribution of fine roots of apple trees/peanut plants/soybean plants, the variation in the horizontal distribution is very low.

5. Conclusions

In conclusion, apple–crop intercropping caused variations in the FRBD and fine-root distribution of apple trees, peanut plants, and soybean plants. Compared with monocropped systems, the fine roots of each component of the apple–crop intercropping systems were inhibited, and the components of the apple–soybean intercropping system were more inhibited. Moreover, the effect of interspecific below-ground competition on variation in the vertical distribution of fine roots of apple trees/peanut plants/soybean plants was much greater than that on variation in the horizontal distribution. The interspecific below-ground competition caused the fine roots of intercropped apple trees to move to deeper soil and that of intercropped peanut plants and soybean plants to move to shallower soil. This effect reduced the degree of the fine-root niche overlap of the apple–crop intercropping systems. Ultimately, the interspecific below-ground competition of the apple–peanut intercropping system is weaker than that of the apple–soybean intercropping system. The intense competition in the apple–peanut intercropping system and apple–soybean intercropping system occurred in the sections whose distance ranged from 0.5–1.3 and 0.5–1.7 m from the tree row, respectively. The interspecific below-ground competition was fiercer on the south side of the apple tree row than on the north side. To effectively alleviate the competition for soil moisture and nutrients between intercropped apple trees and intercropped crops and to obtain increased yields, farmers should select apple–peanut intercropping systems as highest-priority. Furthermore, peanut plants/soybean plants can be planted at a distance of 1.3/1.7 m away from the apple tree row to avoid excessive interspecific below-ground competition. Farmers can also increase the inputs of moisture and fertilizer within the 0–40 cm soil depth of the intercropping area. The irrigation and fertilization should be appropriately increased as the distance to the apple tree decreases, and the irrigation and fertilization south of the apple tree row should be slightly greater than that north of the row. Further quantitative assessment of the degree of competition for light, water, and nutrients of components of the apple–crop intercropping systems is needed.

Author Contributions

Y.S. and H.B. conceived and designed the experiments; Y.S., H.D., R.P., and J.W. performed the experiments and the measurements; Y.S. analyzed the data; Y.S. wrote the paper; Y.S., H.B., and H.X. revised the paper.

Funding

This work was financially supported by the National Key Technology R & D Program of the Ministry of Science and Technology of China (No. 2015BAD07B0502), the National Natural Science Foundation of China (No. 31470638), the National key R & D Program of china (No. 2016YFC0501704) and the Beijing Municipal Education Commission (CEFF-PXM2018_014207_000024).

Acknowledgments

Many thanks are given to the anonymous reviewers and the editors for their helpful comments.

Conflicts of Interest

The authors declare no conflict of interest.

References

  1. Meng, P.; Zhang, J.S.; Fan, W. Research on Agroforestry in China; Chinese Forestry Press: Beijing, China, 2003; pp. 1–4. ISBN 7503835842. [Google Scholar]
  2. Rao, M.R.; Nair, P.K.R.; Ong, C.K. Biophysical interactions in tropical agroforestry systems. Agrofor. Syst. 1998, 38, 3–50. [Google Scholar] [CrossRef]
  3. Cai, C.F.; Wang, F.; Ding, S.W.; Huang, L.; Shi, Z.H. Nutrients competition and its action mechanism between component parts in inter-cropping systems and agroforestry. Res. Soil Water Conserv. 2000, 7, 219–221. [Google Scholar]
  4. Thevathasan, N.V.; Gordon, A.M. Ecology of tree intercropping systems in the North temperate region: Experiences from southern Ontario, Canada. Agrofor. Syst. 2004, 61, 257–268. [Google Scholar] [CrossRef]
  5. Wu, G.; Li, J.; Deng, H.B. Primary research on interface ecology in agroforestrial ecosystems. Chin. J. Appl. Ecol. 2000, 11, 459–460. [Google Scholar]
  6. Gao, L.; Xu, H.; Bi, H.; Xi, W.; Bao, B.; Wang, X.; Bi, C.; Chang, Y. Intercropping competition between apple trees and crops in agroforestry systems on the Loess Plateau of China. PLoS ONE 2013, 8, e70739. [Google Scholar] [CrossRef] [PubMed]
  7. Monteith, J.L.; Ong, C.K.; Corlett, J.E. Microclimatic interactions in agroforestry systems. For. Ecol. Manag. 1991, 45, 31–44. [Google Scholar] [CrossRef]
  8. Ong, C.K.; Corlett, J.E.; Singh, R.P. Above and below ground interaction in agroforestry systems. For. Ecol. Manag. 1991, 45, 45–57. [Google Scholar] [CrossRef]
  9. Kowalchuk, T.E.; de Jong, E. Shelterbelts and their effect on crop yield. Can. J. Soil Sci. 1995, 75, 543–550. [Google Scholar] [Green Version]
  10. McIntyre, B.D.; Riha, S.J.; Ong, C.K. Competition for water in a hedge-intercrop system. Field Crop. Res. 1997, 52, 151–160. [Google Scholar] [CrossRef]
  11. Smith, D.M.; Jackson, N.A.; Roberts, J.M.; Ong, C.K. Root distributions in a Grevillea robusta-maize agroforestry system in semi-arid Kenya. Plant Soil 1999, 211, 191–205. [Google Scholar] [CrossRef]
  12. Jose, S.; Gillespie, A.R.; Pallardy, S.G. Interspecific interactions in temperate agroforestry. Agrofor. Syst. 2004, 61, 237–255. [Google Scholar] [CrossRef]
  13. Jose, S.; Williams, R.A.; Zamora, D.S. Belowground ecological interactions in mixed-species forest plantations. For Ecol. Manag. 2006, 233, 231–239. [Google Scholar] [CrossRef]
  14. Smucker, A.J.M.; Aiken, R.M. Dynamic Root Responses to Water Deficits. Soil Sci. 1992, 154, 281–289. [Google Scholar] [CrossRef]
  15. De Kroon, H.; Mommer, L.; Nishiwaki, A. Root competition: Towards a mechanistic understanding. In Root Ecology; de Kroon, H., Visser, E.J.W., Eds.; Springer: Berlin, Germany, 2003; pp. 215–234. ISBN 9783642055201. [Google Scholar]
  16. Day, K.J.; John, E.A.; Hutchings, M.J. The effects of spatially heterogeneous nutrient supply on yield, intensity of competition and root placement patterns in Briza media and Festuca ovina. Funct. Ecol. 2003, 17, 454–463. [Google Scholar] [CrossRef]
  17. Tufekcioglu, A.; Raich, J.W.; Isenhart, T.M.; Schultz, R.C. Fine root dynamics, coarse root biomass, root distribution, and soil respiration in a multispecies riparian buffer in Central Iowa, USA. Agrofor. Syst. 1999, 44, 163–174. [Google Scholar] [CrossRef]
  18. Schenk, H.J.; Jackson, R.B. The global biogeography of roots. Ecol. Monogr. 2002, 72, 311–328. [Google Scholar] [CrossRef]
  19. Zhang, Y.Q.; Zhu, Q.K.; Qi, S.; Zhang, Y.; Wang, D.M. Root system distribution characteristics of plants on the terrace banks and their impact on soil moisture. Acta Ecol. Sin. 2005, 25, 500–506. [Google Scholar]
  20. Kumar, S.S.; Kumar, B.M.; Wahid, P.A.; Kamalam, N.V.; Fisher, R.F. Root competition for phosphorus between coconut, multipurpose trees and kacholam (Kaempferia galanga L.) in Kerala, India. Agrofor. Syst. 1999, 46, 131–146. [Google Scholar] [CrossRef]
  21. Hinsinger, P.; Bengough, A.G.; Vetterlein, D.; Young, I.M. Rhizosphere: Biophysics, biogeochemistry and ecological relevance. Plant Soil 2009, 321, 117–152. [Google Scholar] [CrossRef]
  22. Cahill, J.F.; McNickle, G.G.; Haag, J.J.; Lamb, E.G.; Nyanumba, S.M.; Clair, C.C.S. Plants integrate information about nutrients and neighbors. Science 2010, 328, 1657–1666. [Google Scholar] [CrossRef] [PubMed]
  23. Bi, H.X.; Yun, L.; Zhu, Q.K. Study on the Interspecific Relationships of Agroforestry Systems in the Loess Area of Western Shanxi Province; Science Press: Beijing, China, 2011; pp. 20–109. ISBN 9787030313669. [Google Scholar]
  24. Gregory, P.J. Approaches to modeling the uptake of water and nutrients in agroforestry systems. Agrofor. Syst. 1996, 34, 51–65. [Google Scholar] [CrossRef]
  25. Van Noordwijk, M.; Purnomosidhi, P. Root architecture in relation to tree-soil-crop interactions and shoot pruning in agroforestry. Agrofor. Syst. 1995, 30, 161–173. [Google Scholar] [CrossRef]
  26. Livesley, S.J.; Gregory, P.J.; Buresh, R.J. Competition in tree row agroforestry systems. 1. Distribution and dynamics of fine roots length and biomass. Plant Soil 2000, 227, 149–161. [Google Scholar] [CrossRef]
  27. Xu, H.S.; Bi, H.X.; Xi, W.M.; Powell, R.L.; Gao, L.B.; Yun, L. Root distribution variation of crops under walnut-based intercropping systems in the Loess Plateau of China. Pak. J. Agri. Sci. 2014, 51, 773–778. [Google Scholar]
  28. Fan, W.; Lu, Q.; Gao, X.R. Distribution pattern and growing dynamics of the roots system in apple-wheat intercropping system. Acta Ecol. Sin. 1999, 19, 860–863. [Google Scholar]
  29. Meng, P.; Zhang, J.S.; Yin, C.J.; Ma, X.Q.; Feng, W.D. Experiments on characteristics of wheat roots difference between apple-wheat intercropping system and wheat monoculture system. For. Res. 2002, 15, 369–373. [Google Scholar]
  30. Xu, H.S.; Bi, H.X.; Gao, L.B.; Yun, L.; Chang, Y.F.; Xi, W.M.; Liao, W.C.; Bao, B. Distribution and morphological variation of fine root in a walnut-soybean intercropping system in the Loess plateau of China. Int. J. Agric. Biol. 2013, 15, 998–1002. [Google Scholar]
  31. Huxley, P.A.; Pinney, A.; Akunda, E.; Muraya, P. A tree/crop interface orientation experiment with a Grevillea robusta, hedgerow and maize. Agofor. Syst. 1994, 26, 23–45. [Google Scholar] [CrossRef]
  32. Mulia, R.; Dupraz, C. Unusual fine root distributions of two deciduous tree species in southern France: What consequences for modelling of tree root dynamics? Plant Soil 2006, 281, 71–85. [Google Scholar] [CrossRef]
  33. Cardinael, R.; Mao, Z.; Prieto, I.; Stokes, A.; Dupraz, C.; Kim, J.H.; Jourdan, C. Competition with winter crops induces deeper rooting of walnut trees in a Mediterranean alley cropping agroforestry system. Plant Soil 2015, 391, 219–235. [Google Scholar] [CrossRef]
  34. Zhang, W.; Ahanbieke, P.; Wang, B.J.; Xu, W.L.; Li, L.H.; Christie, P.; Li, L. Root distribution and interactions in jujube tree/wheat agroforestry system. Agrofor. Syst. 2013, 87, 929–939. [Google Scholar] [CrossRef]
  35. Ma, C.M.; Zhai, M.P.; Liu, C.P. Root distribution characteristics of Juglans regia in monoculture and intercropping. J. Beijing For. Univ. 2009, 31, 181–186. [Google Scholar]
  36. Duan, Z.P.; Gan, Y.W.; Wang, B.J.; Hao, X.D.; Xu, W.L.; Zhang, W.; Li, L.H. Interspecific interaction alters root morphology in young walnut/wheat agroforestry systems in northwest China. Agrofor. Syst. 2017, 1–16. [Google Scholar] [CrossRef]
  37. Zhang, J.S.; Meng, P.; Yin, C.J. Spatial distribution characteristics of apple tree roots in the apple-wheat intercropping. Sci. Silvae Sin. 2002, 38, 30–33. [Google Scholar]
  38. Yun, L.; Bi, H.X.; Gao, L.B.; Zhu, Q.K.; Ma, W.J.; Cui, Z.W.; Wilcox, B.P. Soil moisture and soil nutrient content in walnut-crop intercropping systems in the Loess Plateau of China. Arid Land Res. Manag. 2012, 26, 285–296. [Google Scholar] [CrossRef]
  39. Gale, M.R.; Grigal, D.F. Vertical root distributions of northern tree species in relation to successional status. Can. J. For. Res. 1987, 17, 829–834. [Google Scholar] [CrossRef]
  40. Casper, B.B.; Jackson, R.B. Plant competition underground. Annu. Rev. Ecol. Syst. 1997, 28, 545–570. [Google Scholar] [CrossRef]
  41. Zhu, Q.K.; Zhu, J.Z. Sustainable Management Technology for Conversion of Cropland to Forest in Loess Area; Chinese Forestry Press: Beijing, China, 2003; pp. 179–186. ISBN 7503828455. [Google Scholar]
  42. Kasperbauer, M.J.; Busscher, W.J. Genotypic differences in cotton root penetration of a compacted sub-soil layer. Crop Sci. 1991, 31, 1376–1378. [Google Scholar] [CrossRef]
  43. Ren, Y.Z.; Xu, Y.H.; Ding, J.P.; Ma, Y.S.; Pei, D.L.; Li, C.W.; Tong, Y.P. Regulation of abiotic factors on the plasticity of plant root development. Chin. Agric. Bull. 2011, 27, 34–38. [Google Scholar]
  44. Isaac, M.E.; Anglaaere, L.C.N.; Borden, K.; Adu-Bredu, S. Intraspecific root plasticity in agroforestry systems across edaphic conditions. Agric. Ecosyst. Environ. 2014, 185, 16–23. [Google Scholar] [CrossRef]
  45. McIntyre, B.D.; Riha, S.J.; Ong, C.K. Light interception and evapotranspiration in hedgerow agroforestry systems. Agric. For. Meteorol. 1996, 81, 31–40. [Google Scholar] [CrossRef]
  46. May, R.; McLean, A.R. Interspecific competition and multispecies coexistence. In Theoretical Ecology: Principles and Applications, 3rd ed.; McLean, A.R., Ed.; Oxford University Press: New York, NY, USA, 2007; pp. 84–97. ISBN 9780199209996. [Google Scholar]
  47. Yun, L.; Bi, H.X.; Ren, Y.; Wu, J.; Chen, P.P.; Ma, W.J. Research on soil moisture relations among types of agroforestry system in the Loess Region. Bull. Soil Water Conserv. 2008, 28, 110–114. [Google Scholar]
  48. Eastham, J.; Rose, C.W. Tree/pasture interactions at a range of tree densities in an agroforestry experiment. 1. Rooting patterns. Aust. J. Agric. Res. 1990, 41, 683–695. [Google Scholar] [CrossRef]
  49. Schroth, G.; Zech, W. Root length dynamics in agroforestry with Gliricidia sepium as compared to sole cropping in the semi-deciduous rainforest zone of West Africa. Plant Soil 1995, 170, 297–306. [Google Scholar] [CrossRef]
Figure 1. Location of sampling sections in apple–crop intercropping systems. The fine-root sampling area was divided into ten equally size sections, which were denoted as S1, S2, S3, S4, S5, N5, N4, N3, N2, and N1.
Agronomy 08 00280 g001
Figure 2. Vertical distribution of the fine-root biomass density (FRBD) of (A) monocropped apple trees (MA), intercropped apple trees in apple–peanut intercropping systems (AP–A) and intercropped apple trees in apple–soybean intercropping systems (AS–A) and (B) monocropped soybean plants (MS), intercropped soybean plants in apple–soybean intercropping systems (AS–S), monocropped peanut plants (MP) and intercropped peanut plants in apple–peanut intercropping systems (AP–P). The FRBD of each depth was the mean value of FRBD of the depth of all sections (S1, S2, S3, S4, S5, N5, N4, N3, N2, and N1). The error bars indicate standard deviations. The means with different letters within a row or column are significantly different (p < 0.05).
Agronomy 08 00280 g002
Figure 3. Horizontal distribution of the fine-root biomass density (FRBD) of (A) monocropped apple trees (MA), intercropped apple trees in apple–peanut intercropping systems (AP–A), and intercropped apple trees in apple–soybean intercropping systems (AS–A); (B) monocropped soybean plants (MS), intercropped soybean plants in apple–soybean intercropping systems (AS–S), monocropped peanut plants (MP) and intercropped peanut plants in apple–peanut intercropping systems (AP–P). The FRBD of each section was the mean value of FRBD of the 0–100 cm depth. The error bars indicate standard deviations. The means with different letters within a row or column are significantly different (P < 0.05).
Agronomy 08 00280 g003aAgronomy 08 00280 g003b
Figure 4. (A) Fitting of Equation (1) to a profile of the cumulative fractional fine-root biomass density (Y); the dotted lines mark the depth of 50% of the cumulative fine-root biomass density (d50); (B) mean profiles of Y for monocropped apple trees (MA), intercropped apple trees in apple–peanut intercropping systems (AP–A) and intercropped apple trees in apple–soybean intercropping systems (AS–A); (C) mean profiles of Y for monocropped soybean plants (MS), intercropped soybean plants in apple–soybean intercropping systems (AS–S), monocropped peanut plants (MP), and intercropped peanut plants in apple–peanut intercropping systems (AP–P).
Agronomy 08 00280 g004
Figure 5. Values of the depth of 50% of the cumulative fine-root biomass density (d50) for (A) monocropped apple trees (MA) and intercropped apple trees in apple–peanut intercropping systems (AP–A); (B) monocropped apple trees (MA) and intercropped apple trees in apple–soybean intercropping systems (AS–A); (C) monocropped peanut plants (MP) and intercropped peanut plants in apple–peanut intercropping systems (AP–P); (D) monocropped soybean plants (MS) and intercropped soybean plants in apple–soybean intercropping systems (AS–S); (E) intercropped apple trees (AP–A) and intercropped peanut plants in apple–peanut intercropping systems (AP–P); and (F) intercropped apple trees (AS–A) and intercropped soybean plants (AS–S) in apple–soybean intercropping systems. The error bars indicate the standard deviations. The means with different letters within a row or column are significantly different (p < 0.05).
Agronomy 08 00280 g005aAgronomy 08 00280 g005b
Figure 6. The fine-root horizontal barycenter (FRHB) for monocropped apple trees (MA), intercropped apple trees in apple–peanut intercropping systems (AP–A), intercropped apple trees in apple–soybean intercropping systems (AS–A), intercropped peanut plants in apple–peanut intercropping systems (AP–P), and intercropped soybean plants in apple–soybean intercropping systems (AS–S). The error bars indicate the standard deviations. “S” indicates south of the apple tree row; “N” indicates north of the apple tree row.
Agronomy 08 00280 g006

