Article

Responses of Soybean Dry Matter Production, Phosphorus Accumulation, and Seed Yield to Sowing Time under Relay Intercropping with Maize

1
College of Agronomy, Sichuan Agricultural University, Chengdu 611130, Sichuan, China
2
Maize Research Institute, Sichuan Agricultural University, Chengdu 611130, Sichuan, China
3
College of Agriculture, BZU Bahadur Sub Campus, Layyah 31200, Pakistan
*
Authors to whom correspondence should be addressed.
These authors contributed equally to this work.
Submission received: 27 October 2018 / Revised: 15 November 2018 / Accepted: 22 November 2018 / Published: 27 November 2018

Abstract

:
Soybean production under maize–soybean relay-intercropping system (MSICS) is vulnerable to shading. A study was initiated to investigate the effects of three sowing-times: ST1, 90; ST2, 70; and ST3, 50 days of co-growth period and two phosphorus-rates: P0, 0; and P60, 60 kg P ha−1 on soybean under MSICS. Results revealed that ST3 significantly increased the photosynthetically active radiations, leaf area index, and photosynthetic rate by 72% and 58%, and 61% and 38%, and 6% and 8%, respectively, at full-flowering and full-pod stage of soybean than ST1. Treatment ST3, increased the total dry-matter (TDM) and the highest TDM was reached at full-seed (R6) stage. Similarly, ST3 considerably increased the dry-matter partitioning to pods and seeds, relative to ST1, soybean under ST3 at R6 had 35% and 30% higher pod and seed dry-matter, respectively. Moreover, ST3 exhibited the maximum seed-yield (mean 1829.5 kg ha−1) for both years of this study. Soybean under ST3 with P60 accumulated 38% higher P, and increased the P content in pods and seeds by 36% and 33%, respectively at R6 than ST1. These results imply that by selecting the appropriate sowing-time and phosphorus-rate for soybean, we can increase the TDM and seed-yield of soybean under MSICS.

1. Introduction

Relay intercropping is a well-established cropping system in Asia [1], Africa [2], and South America [3]. In relay intercropping systems, cereals, and legumes are the main crop families and are highly important for obtaining higher crop yields and the land equivalent ratio [4]. The relay intercropping of maize (Zea mays L.) and soybean (Glycine max (Linn.) Merr.) decreases the interspecific competition by promoting the facilitation processes, and thus increases the utilization of resources (i.e., land, water, and light) and nutrients (P) which ultimately enhance the crop productivity of an agro-ecosystem [5]. Moreover, the total dry matter and seed yield of intercropped maize and soybean were considerably higher than those of mono maize and soybean under a field experiment [6]. Interspecific facilitation between maize and soybean for P uptake and utilization by intercropped crop species in agricultural production has been confirmed in many previous studies [7]. In recent times, some researchers studied the intercropping systems particularly wheat-maize, wheat-soybean, maize-faba bean, and maize-soybean in terms of phosphorus accumulation [7].
Crop growth and development may be having consequences due to variations in the severity and frequency of extreme weather conditions [8]. Higher annual change in rainfall and temperature are the major climate change components [9]. The effects of climate change are being seen from the last twenty years on agriculture. Genetic and agronomic adjustments are needed to enhance agricultural production [8]. Previously, it has been reported that the soil, climate, and agronomic practices such as sowing times have a substantial influence on seed yield of crops [9]. Heat and drought stresses during the co-growth are responsible for fluctuations in dry matter accumulation as well as seed yield competition within crop species [10]. Phosphorus (P) is a second essential macronutrient after nitrogen for all crops, as agriculture production intensifies the P is of growing concern as it is a non-renewable and limited resource [11], for the sustainability of P fertilizer application in emerging and developed countries. Modern farming in China has increased the crop yields with the greater use of chemical fertilizers especially P [12,13]. In China, P is applied 92 kg ha−1 yr−1, and agronomic output of P is 39 kg ha−1 yr−1 [14]. Whereas, in the United States, total P agronomic output and total P input is 23 and 14 kg ha−1 yr−1, respectively [15]. Importantly, only 15–20% of phosphorus applied in China is accumulated by crop plants during the growing seasons [16]. Sufficient application of P fertilizer has been documented to improve the soybean seed yield and yield related parameters [7]. Phosphorus application increased the availability of other major nutrients N, and K, and enhanced soybean growth under intercropping conditions [17]. Its deficiency negatively affected the crop growth phases, crop maturity, and quality of crops [18].
Soybean is one of the main legumes seeds which provides energy in the form of protein, vitamins, and minerals to most of the people in the whole world. Among legume crops, soybean has the highest protein (30 to 60%) and oil (10 to 30%) contents [19]. In China, soybean is widely sown under a maize–soybean relay intercropping system (MSICS), within the MSICS, described here as the deliberate sowing of soybean crop within the relay-intercropping strip area after 60 days of maize sowing. The maize is usually planted according to a narrow–wide-row sowing pattern at the start of April and harvested at the beginning of August. Soybean is planted in the wide-rows between the maize at the start of June and harvested at the end of October [20]. The vegetative growth period of soybean and the reproductive growth period of maize overlap over a period of approximately nine to ten weeks between the sowing of soybean and the harvesting of maize. Thus, the two different crop species can be grown during one season in production areas where the growing season is too short for double cropping [20]. This system increases the productivity as it takes advantage of the biological N fixation by soybean, thereby reducing the demand for N-containing fertilizers [6]. However, the frequency and amount of rainfall during the co-growth period varies, which results to the change the morphological characteristics of soybean plants at early stages. According to Yang et al., (2014), vegetative and flowering periods are the crucial growth stages where severe environmental conditions and maize shading negatively affected the initial growth of soybean plants [20]. However, these adverse effects could be reduced by selecting the appropriate sowing time. Sowing time of soybean in maize soybean relay intercropping systems affects the growth mostly through its determination of the shading duration during the vegetative stage, since early sown soybean under this system suffers from maize shading for a longer period of time, thereby forcing the soybean plants to coincide with heavy shade and water stress. This water and shade stress leads to a significant effect on soybean seedling parameters, i.e., plant height, stem diameter, and leaf area [21,22]. In past reports, heavy shade on soybean seedlings during the co-growth period resulted in decreased stem diameter, leaf area, stem breaking strength and soluble sugar contents, which in turn increased the lodging and plant height [1,23]. Soybean’s initial growth for higher seed yield is the most critical parameter under MSICS which is significantly affected by the change in sowing time [20]. The shading effect on soybean seedlings could be influenced by changing the sowing time. In addition, sowing time regulates the flowering time and duration which ultimately changed the environmental conditions and shading during the co-growth period of soybean and maize.
The effects of P application and sowing times on biomass accumulation and partitioning towards economic parts in soybean under MSICS has rarely been investigated. Therefore, this study was conducted for understanding the effects of P application and sowing times on biomass accumulation and partitioning in soybean under MSICS to improve the soybean cultivation management and maintain sustainable soybean production in rainfed areas. The objectives of this two-year field experiment were (i) to investigate the effects of sowing time (co-growth period) and P fertilizer rates on the growth and development of soybean under MSICS; (ii) to characterize the total P accumulation and distribution in different plant parts of soybean in MSICS, and (iii) to find out an appropriate sowing time for higher soybean yield under MSICS.

2. Materials and Methods

2.1. Experimental Site

The experiments were conducted during the seasons of 2016 and 2017 at Ya’an Experimental Farm of Sichuan Agricultural University, Sichuan Province, China (29°59′ N, 103°00′ E, 620 m elevation). The climate of the study area was humid and subtropical, and it has an annual mean temperature of 19.4 °C, annual mean rainfall 505.3 mm, annual mean sunshine 1196.6 h, and frost-free period of 312 days. Weather data during the growing seasons from 2016 to 2017 included every month of rainfall and average temperature and are presented in Table 1. The soil at the experiment site consists of a clay loam texture (56% sand, 26% silt, and 18% clay), with total nitrogen 0.39 g kg−1, total phosphorus, 0.51 g kg−1, total potassium 5.58 g kg−1, available nitrogen 51.6 mg kg−1, available phosphorus 15.3 mg kg−1, available potassium 103.1 mg kg−1 and organic matter 27.2 g kg−1, in the top 0–20 cm soil layer and pH 7.2.

2.2. Planting Material and Sowing Times

The maize and soybean cultivars was Chuandan-418 (semi-compact, registration number 2007020 provided by the Maize Institute of Sichuan Agricultural University) and Nandou-12 (shade tolerant, registration number 2008002 main variety in Southwest China, bred by Nanchong Academy of Agricultural Sciences) and were sown in randomized complete block design with a split-plot arrangement and replicated three times under rainfed conditions. Different sowing times were selected in such a manner that the growing soybean plants would likely experience longer, medium, and shorter shading durations. The three sowing times of soybean were: ST1 (15–20 May, 90 days of co-growth period in MSICS); ST2 (5–10 June, 70 days of co-growth period in MSICS); and ST3 (25–30 June, 50 days of co-growth period in MSICS), and two phosphorus fertilizer rates, P0 (0 kg ha−1) and P60 (60 kg ha−1), for intercropped soybean were used in this experiment. Phosphorus fertilizer rates were placed to main plots while sowing times were allocated in the sub-plots. The soybean was grown in 2016 and 2017, and respectively harvested on the 28th and 30th of September, the 22nd and 23rd of October, and the 15th and 19th of November for the three periods of MSICS growth: ST1, ST2, and ST3, respectively.

2.3. Experimental Management

The maize and soybean relay intercropping system (MSICS) “160 cm + 40 cm” maize wide-narrow-row sowing, i.e., the relay intercropping combination of two crop strips with a total width of 200 cm, consisting of two rows of maize and two rows of soybean with a 40-cm row width for maize and soybean, and 60-cm spacing between the adjacent rows of maize and soybean. Every experimental plot size was 36 m2 (6 m × 6 m) in MSICS, including six rows of maize and six rows of soybean. The plant to plant distance of 16.7 cm for maize and 10 cm for soybean was maintained by thinning, which was done after 15 days of germination to maintain a uniform planting density of 60,000 and 100,000 plants ha−1 for maize and soybean, respectively in the MSICS system. The maize and soybean were seeded by hand under different sowing times, and weeds were controlled manually. The experimental land was prepared by using cultivator in both years. All plots were treated with initial fertilizers. Initial N at 75 kg ha−1 as urea, K at 60 kg ha−1 as potassium sulfate, and P at 0 and 60 kg ha−1 to the main plots as per phosphorus levels as calcium superphosphate were initially applied for soybean at the time of soybean sowing. Other measures were used according to the same as those used in field production [24].

2.4. Sampling and Measurements

2.4.1. Photosynthetically Active Radiation (PAR) Transmittance

The measurement of photosynthetically active radiation (PAR) at the top of soybean plants under MSICS in different treatments were conducted to demonstrate the changes in PAR transmittance due to the variations in the co-growth period. To determine the intercepting PAR, first light measuring sensors (LI-191SA quantum sensors, LI-COR Inc., Lincoln, NE, USA) were held on the horizontal arm of the observing scaffold at the top of maize plant then at the top of soybean seedlings at V5 (five trifoliate), R2 (full flowering), and R4 (full pod) stage in all sub-blocks of MSICS. The PAR of each sub-block was determined five times at different points on the maize and soybean canopy from each treatment from 11:00–12:00 on a clear sunny day and then mean was calculated. After that PAR transmittance at soybean canopy was calculated by using the following formula [25]:
P A R   t r a n s m i t t a n c e   ( % ) = I s I m × 100
where Is is the PAR at the top of soybean canopy, and Im is the PAR at the top of maize canopy.

2.4.2. Leaf Area Index

Leaf area index of soybean under MSICS in different treatments was determined at V5 (five trifoliate), R2 (full flowering), R4 (full pod), and R6 (full seed) in both study years. For this purpose, ten soybean plants from the central rows of each sub-block were destructively collected at least one meter away from the last sampling. To determine the leaf area of soybean plants, we measured the maximum leaf length and width with a ruler, then leaf area was calculated by multiplying the leaf length and width with a coefficient factor of 0.75 [26]. The LAI of each sub-block was determined as the ratio of soybean leaf area to ground area.

2.4.3. Photosynthetic Characteristics

As described by Raza et al., (2018b), the net photosynthetic rate (Pn), transpiration rate (Tr), stomatal conductance (Gs), and intercellular CO2 concentration (Ci) of soybean plants under MSICS were investigated by using a Li-6400 portable photosynthesis system (LI-COR Inc., Lincoln, NE, USA) equipped with an LED leaf chamber [27]. In all treatments, five fully expanded trifoliate leaves per plot from soybean plants above the 7th node was selected at V5, R2, and R4 from all treatments to determine the photosynthetic characteristics. All the measurements were conducted from 10:00 to 11:00 on a clear sunny day under a CO2 concentration of 400 µmol mol−1.

2.4.4. Dry Matter and Seed Yield

Each sub-block under MSICS was divided into two equal units. One unit was used to determine the total dry matter (TDM), distribution in vegetative (stem + leaves), and reproductive (pods + seeds) plant organs of soybean. From this unit ten successive soybean plants were destructively collected at V5, R2, R4, and R6, and then collected plants were separated into different plant organs (i.e., vegetative and reproductive) and placed in oven for 1 h at 105 °C to kill the fresh tissues and then dried at 80 °C to attain constant weight before weighing of every sample for TDM and partitioning analysis [4]. For seed yield measurement, forty soybean plants from every treatment of MSICS were manually harvested from the central rows of each sub-block using sickle at ground level when all the three replications of each sowing time mature fully (95% of pods achieved mature pod color). Then all the collected soybean plant samples were air dried for ten days. The dried soybean plants were threshed manually and weighed to determine the intercropped seed yield of every plant and then converted into kg ha−1.

2.4.5. Phosphorus Uptake and Distribution

At V5, R2, R4, and R6, the dried plant samples (ten consecutive soybean plants) were ground after measuring the dry matter from every treatment and the P content of stem, leaf, pod, and seed were determined by using the vanadomolybdate procedure [7] after digesting about 0.5 g sample in H2SO4-H2O2 [28]. The P content in different soybean plant organs was measured by multiplying the total dry matter of each plant organ with the P content and calculated in a kg ha−1. The total phosphorus uptake (TPU) was calculated from the summation of the phosphorus in all plant organs above ground.

2.4.6. Statistical Analysis

All the data recorded for each parameter was processed in Microsoft Excel 2013 and analysis of variance was carried out by Statistix software (version, 8.1). Analysis of variance (ANOVA) technique and least significance difference (LSD) test were employed to assess the effect of sowing times and phosphorus fertilizer rates on PAR transmittance, photosynthetic characteristics, leaf area index, total dry matter, and seed yield, and all the means were compared at the 0.05 probability level. In addition, Microsoft Excel-2013 program was used for the graphical presentation of data using standard error (±SE).

3. Results

3.1. Co-Growth Period Information

The changed sowing times selected for soybean under MSICS in this experiment revealed that soybean plants experienced the different shading duration (co-growth period of maize and soybean under MSICS: ST1; 90 days of co-growth; ST2; 70 days of co-growth; and ST1; 50 days of co-growth), temperature, and precipitation before and during vegetative and flowering stages. In this experiment, the average highest 76%, 100%, and 100% PAR transmittance at V5, R2, and R4, was observed in ST1 and ST3, respectively, while lowest 62%, 58%, and 64% PAR transmittances at V5, R2, and R4, respectively were measured under treatment ST3 and ST1, under P60 and P0, respectively (Table 2). Moreover, the interactive effect of phosphorus fertilizer rates and sowing times for PAR transmittance was found non-significant at V5 and R2 in both years, while at R4 it was found significant and non-significant in 2016 and 2017, respectively (Table 2). The flowering stage of soybean started after 56 and 58, 56 and 59, and 57 and 60 days after sowing (DAS) in 2016 and 2017 under ST1, ST2, and ST3, respectively. The mean temperatures at the flowering stage of soybean in ST1, ST2, and ST3 were 24.5, 25.9, and 24.5 °C, respectively. The mean received precipitations under ST1, ST2, and ST3 were 116.9, 63.7, and 136.6 mm. Overall, ST1, ST2, and ST3 received the total precipitations of 719.8, 741.3, and 777.2 mm, respectively from germination to harvesting. Different sowing times (co-growth duration, and PAR transmittance) and phosphorus levels under MSICS considerably changed the leaf area index (LAI), photosynthetic rate (Pn), total dry matter (TDM), and distribution in vegetative and reproductive organs, phosphorus accumulation and distribution, and seed yield of soybean. There was 10 percent more precipitation in 2017 than 2016. It may be more interesting that the period May-July was wetter in 2016, whilst the period August-September had slightly more precipitation in 2017 see Table 1.

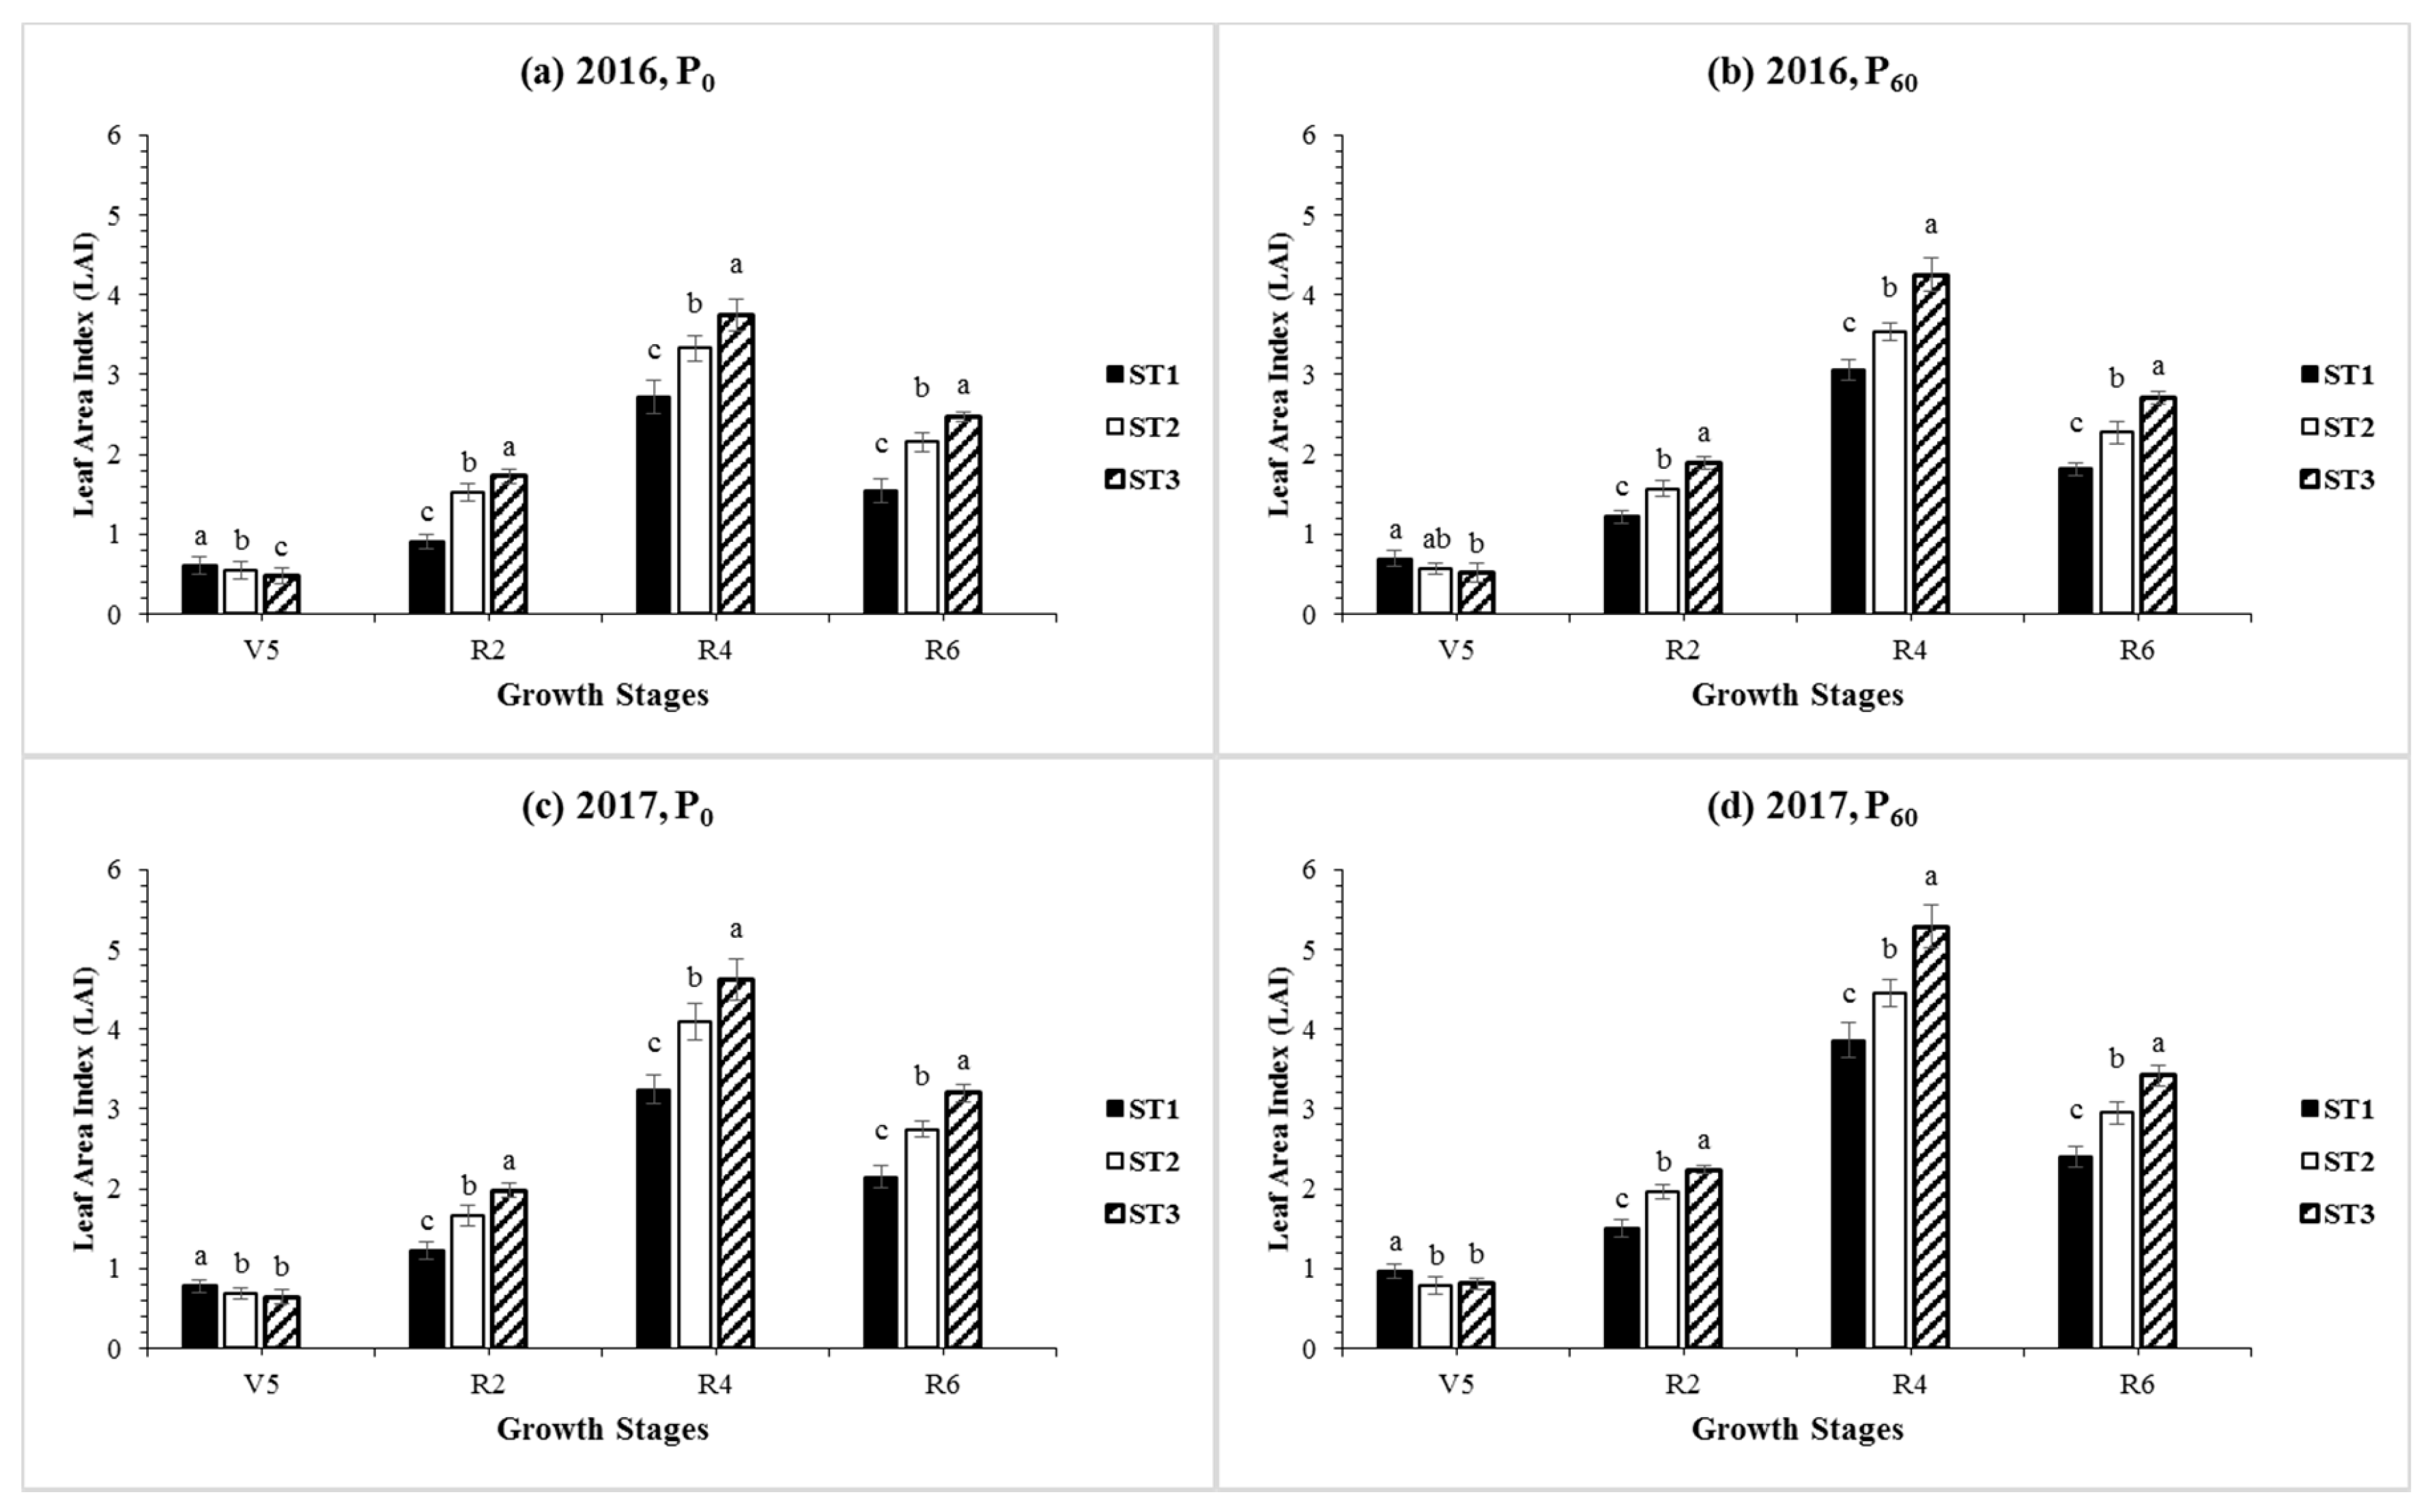
3.2. Leaf Area Index

Leaf area index of soybean in MSICS showed significant (p < 0.05) variations from V5 to R6 stages under different sowing times and phosphorus levels (Figure 1). In both study years, the average highest LAI values of 0.76, and 1.96, 4.47, and 2.95, were measured in ST1 and ST3, while average lowest 0.61, and 1.21, 3.22, and 1.98, LAI values were recorded in ST3 and ST1 treatments at V5, R2, R4, and R6, respectively. The different P levels significantly affected the LAI of soybean plants under MSICS, the mean maximum LAI 0.72, 1.73, 4.07, and 2.59, was noted in P60, while minimum LAI values were noticed in P0 V5, R2, R4, and R6, respectively. The interactive effect of phosphorus fertilizer rates and sowing times for LAI was found non-significant at V5, R4, and R6 in both experimental years, while at R2 it was found significant and non-significant in 2016 and 2017, respectively. Overall, ST3 led to increase in LAI of soybean at R4 by 26.6% in 2016 and 21.7% in 2017 in comparison with ST1, respectively.

3.3. Photosynthetic Characteristics

The application of 60 kg P ha−1 (P60) to soybean significantly increased the Pn, Gs, Tr, and Ci of soybean plants, and reached maximum Pn (21.8 mmol m−2 s−1), Gs (88.5 H2O mol m−2 s−1), Tr (2.63 mmol H2O m−2 s−1), and Ci (339.5 μmol CO2 m−2 s−1) at R4 in both years (Table 3). Similarly, sowing times exhibited the significant differences in Pn, Gs, Tr, and Ci. The average highest Pn 20.0, 20.5, and 21.9 (mmol m−2 s−1), Gs 67.3, 76.7, and 90.8 (mol H2O m−2 s−1), Tr 1.9, 2.3, and 2.8 (mmol H2O m−2 s−1), and Ci 268.2, 303.7, and 353.8 (μmol CO2 m−2 s−1) at V5, R2, and R4 was determined under treatment ST3, respectively, whereas average lowest Pn, Gs, Tr, and Ci at V5, R2, and R4 was measured in ST1, respectively in both years. Interactive effect of phosphorus levels and sowing times at R4 for Pn and Ci was found significant in 2016 and non-significant in 2017, while it was found non-significant for Tr and significant for Gs in both study years (Table 3). Additionally, under MSICS, the Pn of soybean leaves was significantly increased with the decrease in the co-growth period (from ST1 to ST3). On average, ST3 in MSICS increased the Pn at V5, R2, and R4 by 8.7%, 6.3%, and 7.6%, respectively as compared to ST1, indicating that Pn was closely associated with the changes in co-growth period (shading duration and PAR transmittance) and LAI.

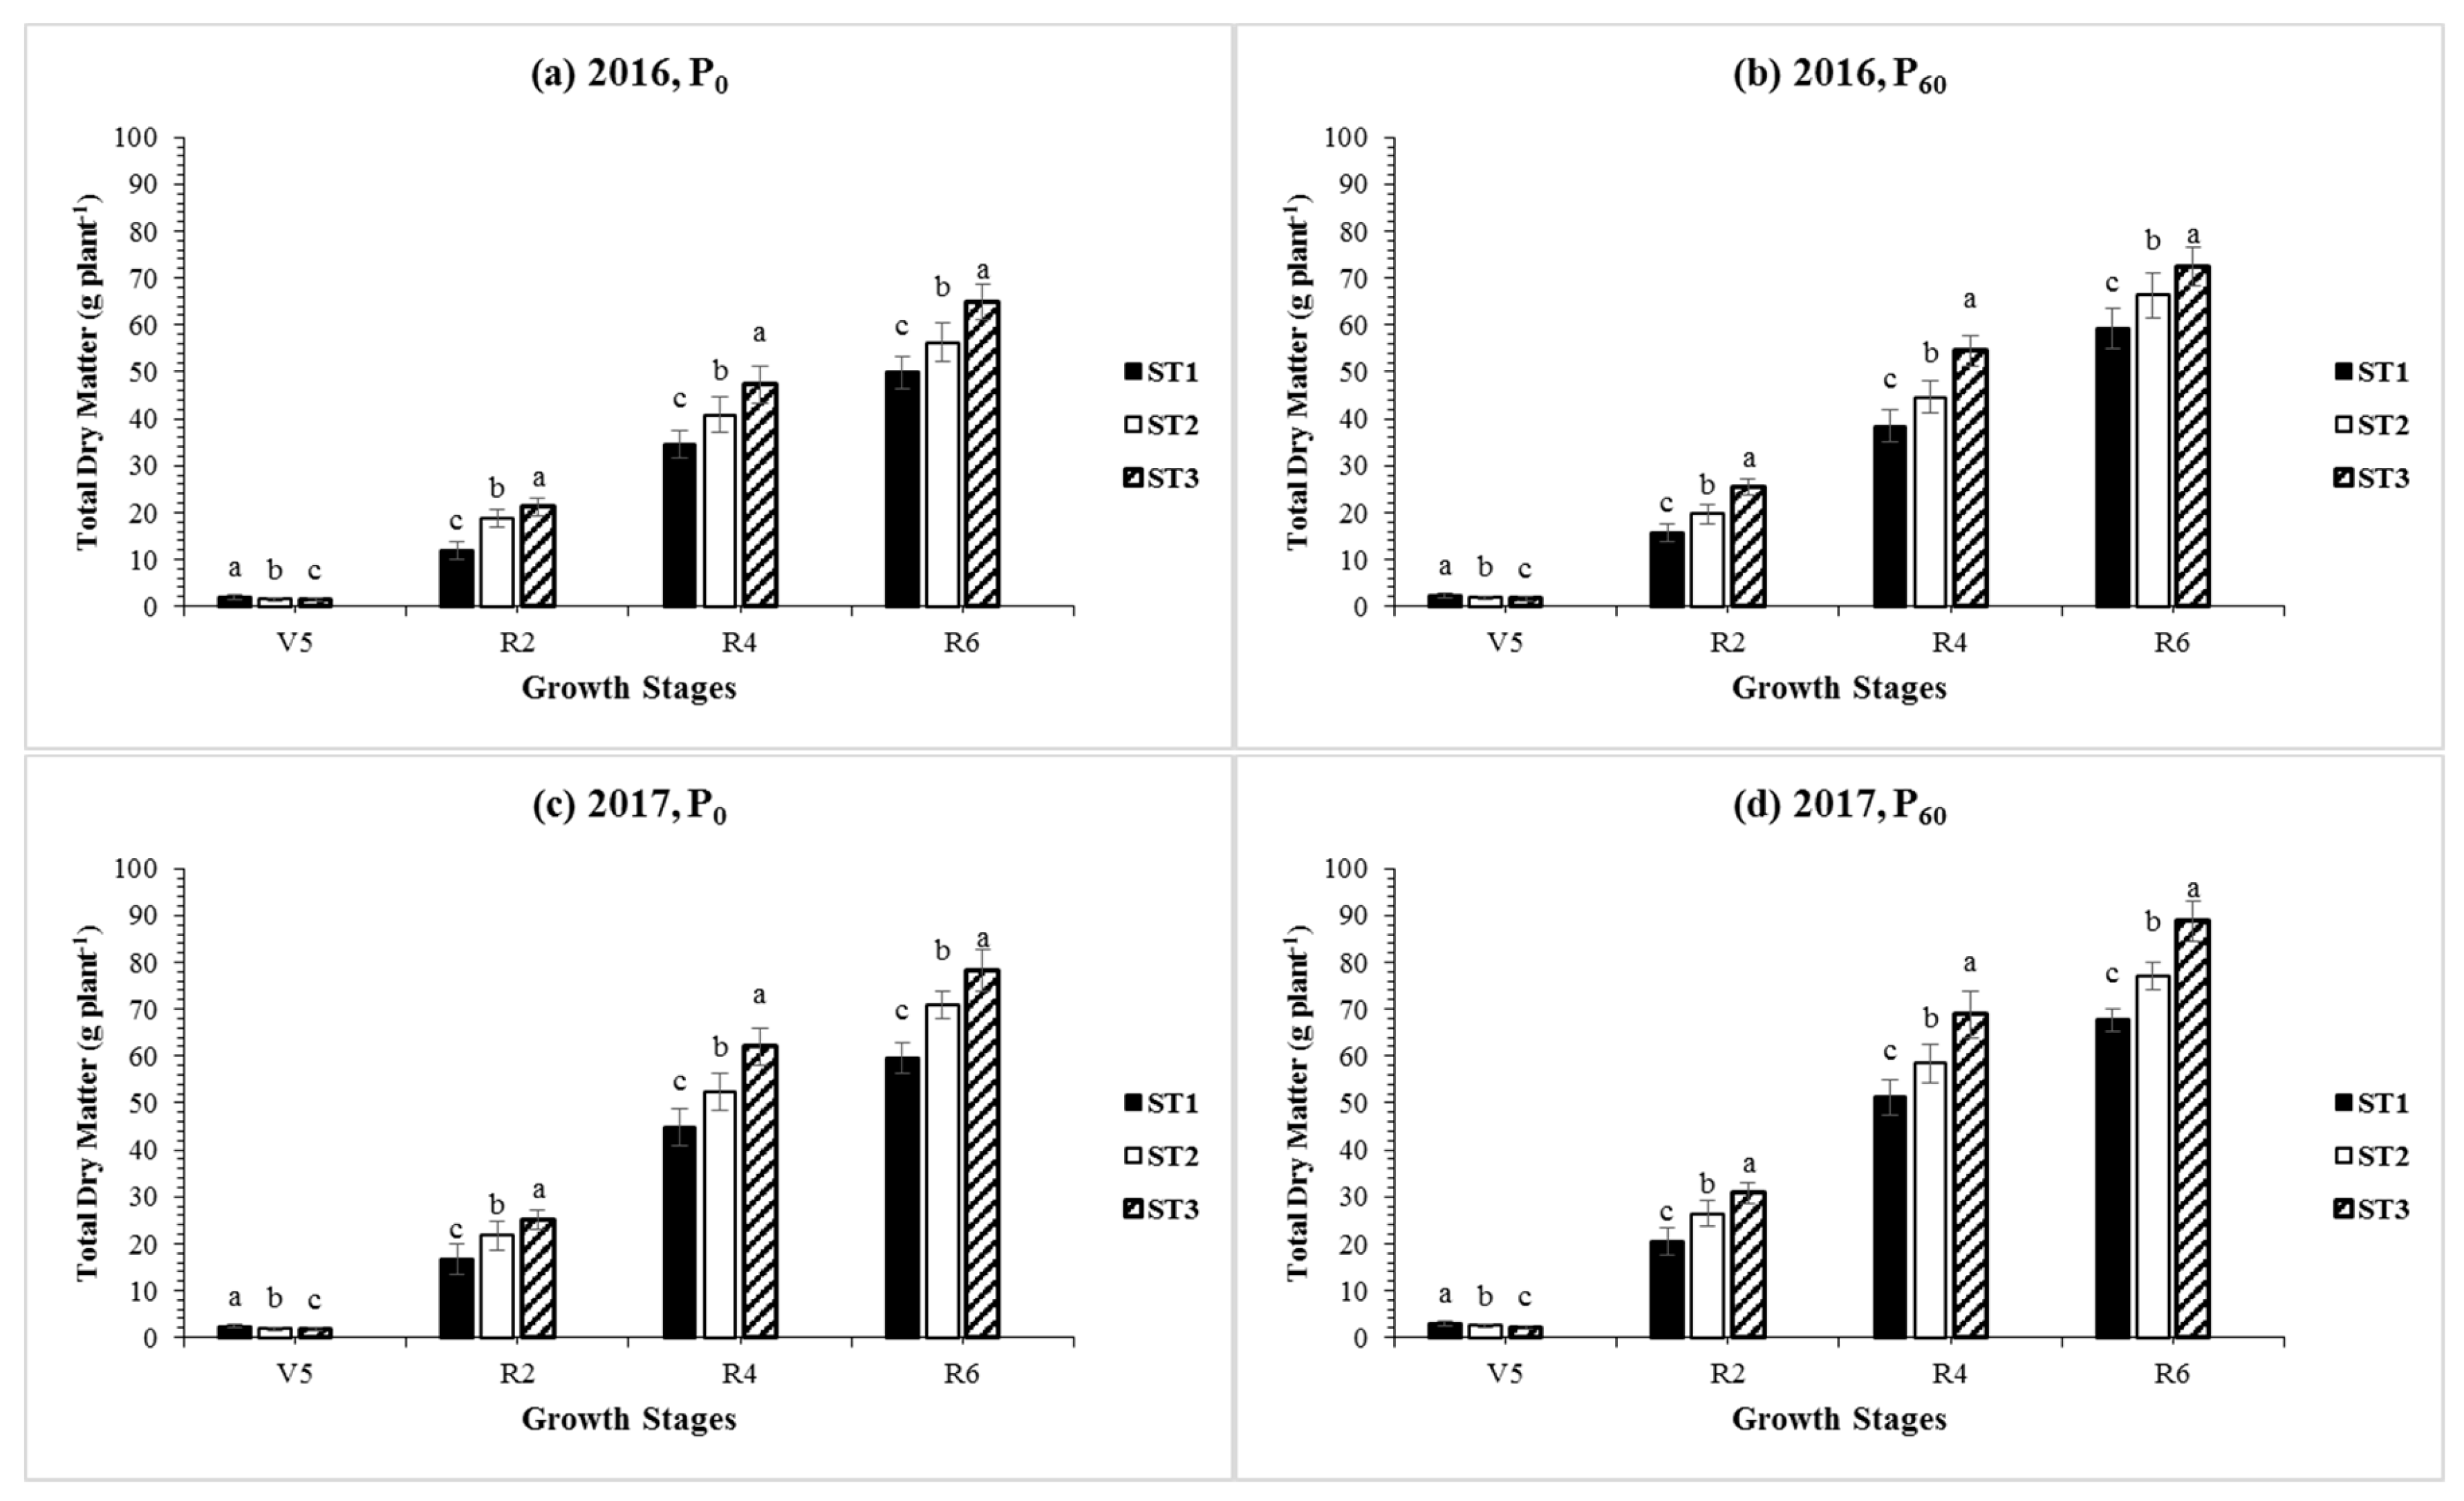
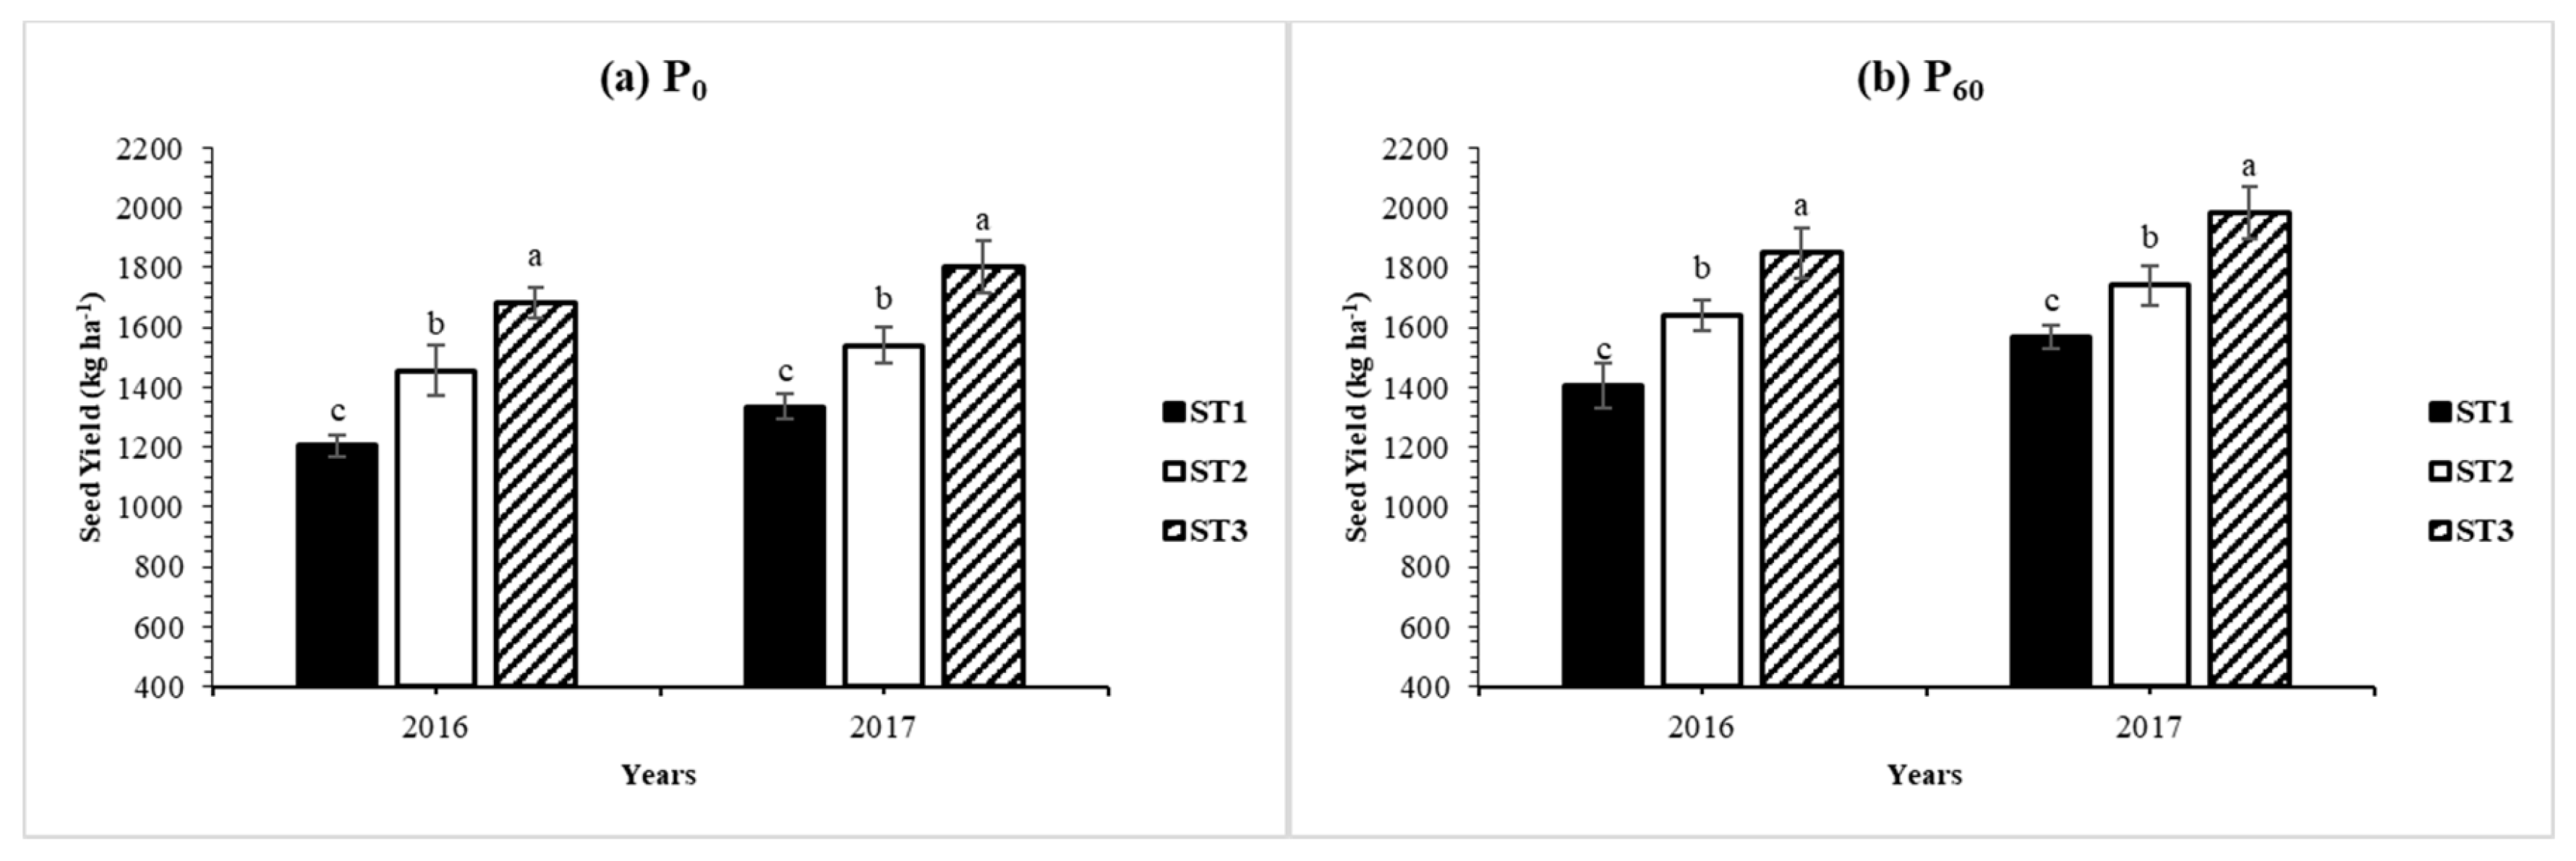
3.4. Dry Matter and Seed Yield

The P application substantially increased the TDM of soybean at all sowing times, applying P at the rate of 60 kg P ha−1 (P60) increased the TDM by 13.5% at R6 stage as compared with P0 (Figure 2). Among sowing times, the first sowing time (ST1) significantly reduced the TDM 59.1 g plant−1, while the third sowing time (ST3) produced the maximum TDM 76.1 g plant−1 at R6 stage. P60 increased TDM at R6 stage by 15.6% in 2016 and 11.8% in 2017, in comparison with P0, respectively (Figure 2). The interactive effect of phosphorus fertilizer rates and sowing times for TDM was found non-significant at V5 in both years, while it was found significant in 2016 and non-significant in 2017 at R2, R4, and R6, respectively.
In this study, the sowing time and P levels changed the allocation pattern of dry matter between vegetative and reproductive parts of soybean under MSICS (Table 4). At all sampling stages (V5, R2, R4, and R6) of soybean, the highest allocation of dry matter was noted in leaves followed by the stem, seeds, and pods. The higher partitioning of dry matter in pods and seeds (reproductive organs) was observed at R4 and R6 stage. The average maximum dry matter allocation in pods (6.9 and 8.5 g plant−1) and seed (9.7 and 16.9 g plant−1) were noticed in ST3 at R4 and R6, respectively. The P levels also increased the dry matter allocation to pods and seed, and the mean highest dry matter partitioning to pods (5.9 and 7.7 g plant−1) and seed (8.4 and 16.1 g plant−1) was found at R4 and R6, respectively, with P60 respectively. Importantly, sowing time had more prominent and significant effect on dry matter accumulation and partitioning to reproductive parts, and ST3 (50 days of co-growth between maize and soybean) with 60 kg P ha−1 in MSICS was the better time of soybean sowing. Overall, at R6, reproductive dry matter (pods + seed) increased by 31.6% in ST3 than ST1. The interactive effect of phosphorus fertilizer rates and sowing times at R6 for stem and seed dry matter was found non-significant, while it was found significant in first year and non-significant in the second year of experiment for leaves and pods (Table 4). In this field experiment, sowing times and P levels significantly affected the soybean seed yield under MSICS (Figure 3), the seed yield under different sowing times revealed that it remained highest for ST3 (1766.0 kg ha−1 in 2016 and 1893.5 kg ha−1 in 2017) followed by ST2 and ST1 for both years. Fertilizer management as P levels exhibited that average seed yield remained highest in P60 1697.5 kg ha−1, while average lowest seed yield was recorded under P0 1503.8 kg ha−1 in both experimental years. Among sowing times, relative to ST1, soybean plants under ST3 treatment produced 35.4% in 2016 and 30.5% in 2017 higher seed yield. Furthermore, the interactive effect of phosphorus fertilizer rates and sowing times for seed yield of soybean plants was found non-significant for both years. These results are suggesting that phosphorus application @ 60 kg P ha−1, improved PAR transmittance and shorter co-growth period have a positive impact on leaf area index and photosynthetic rate which in turn increased the seed yield of soybean, while longer co-growth period under MSICS has adverse effect for seed yield in both years.

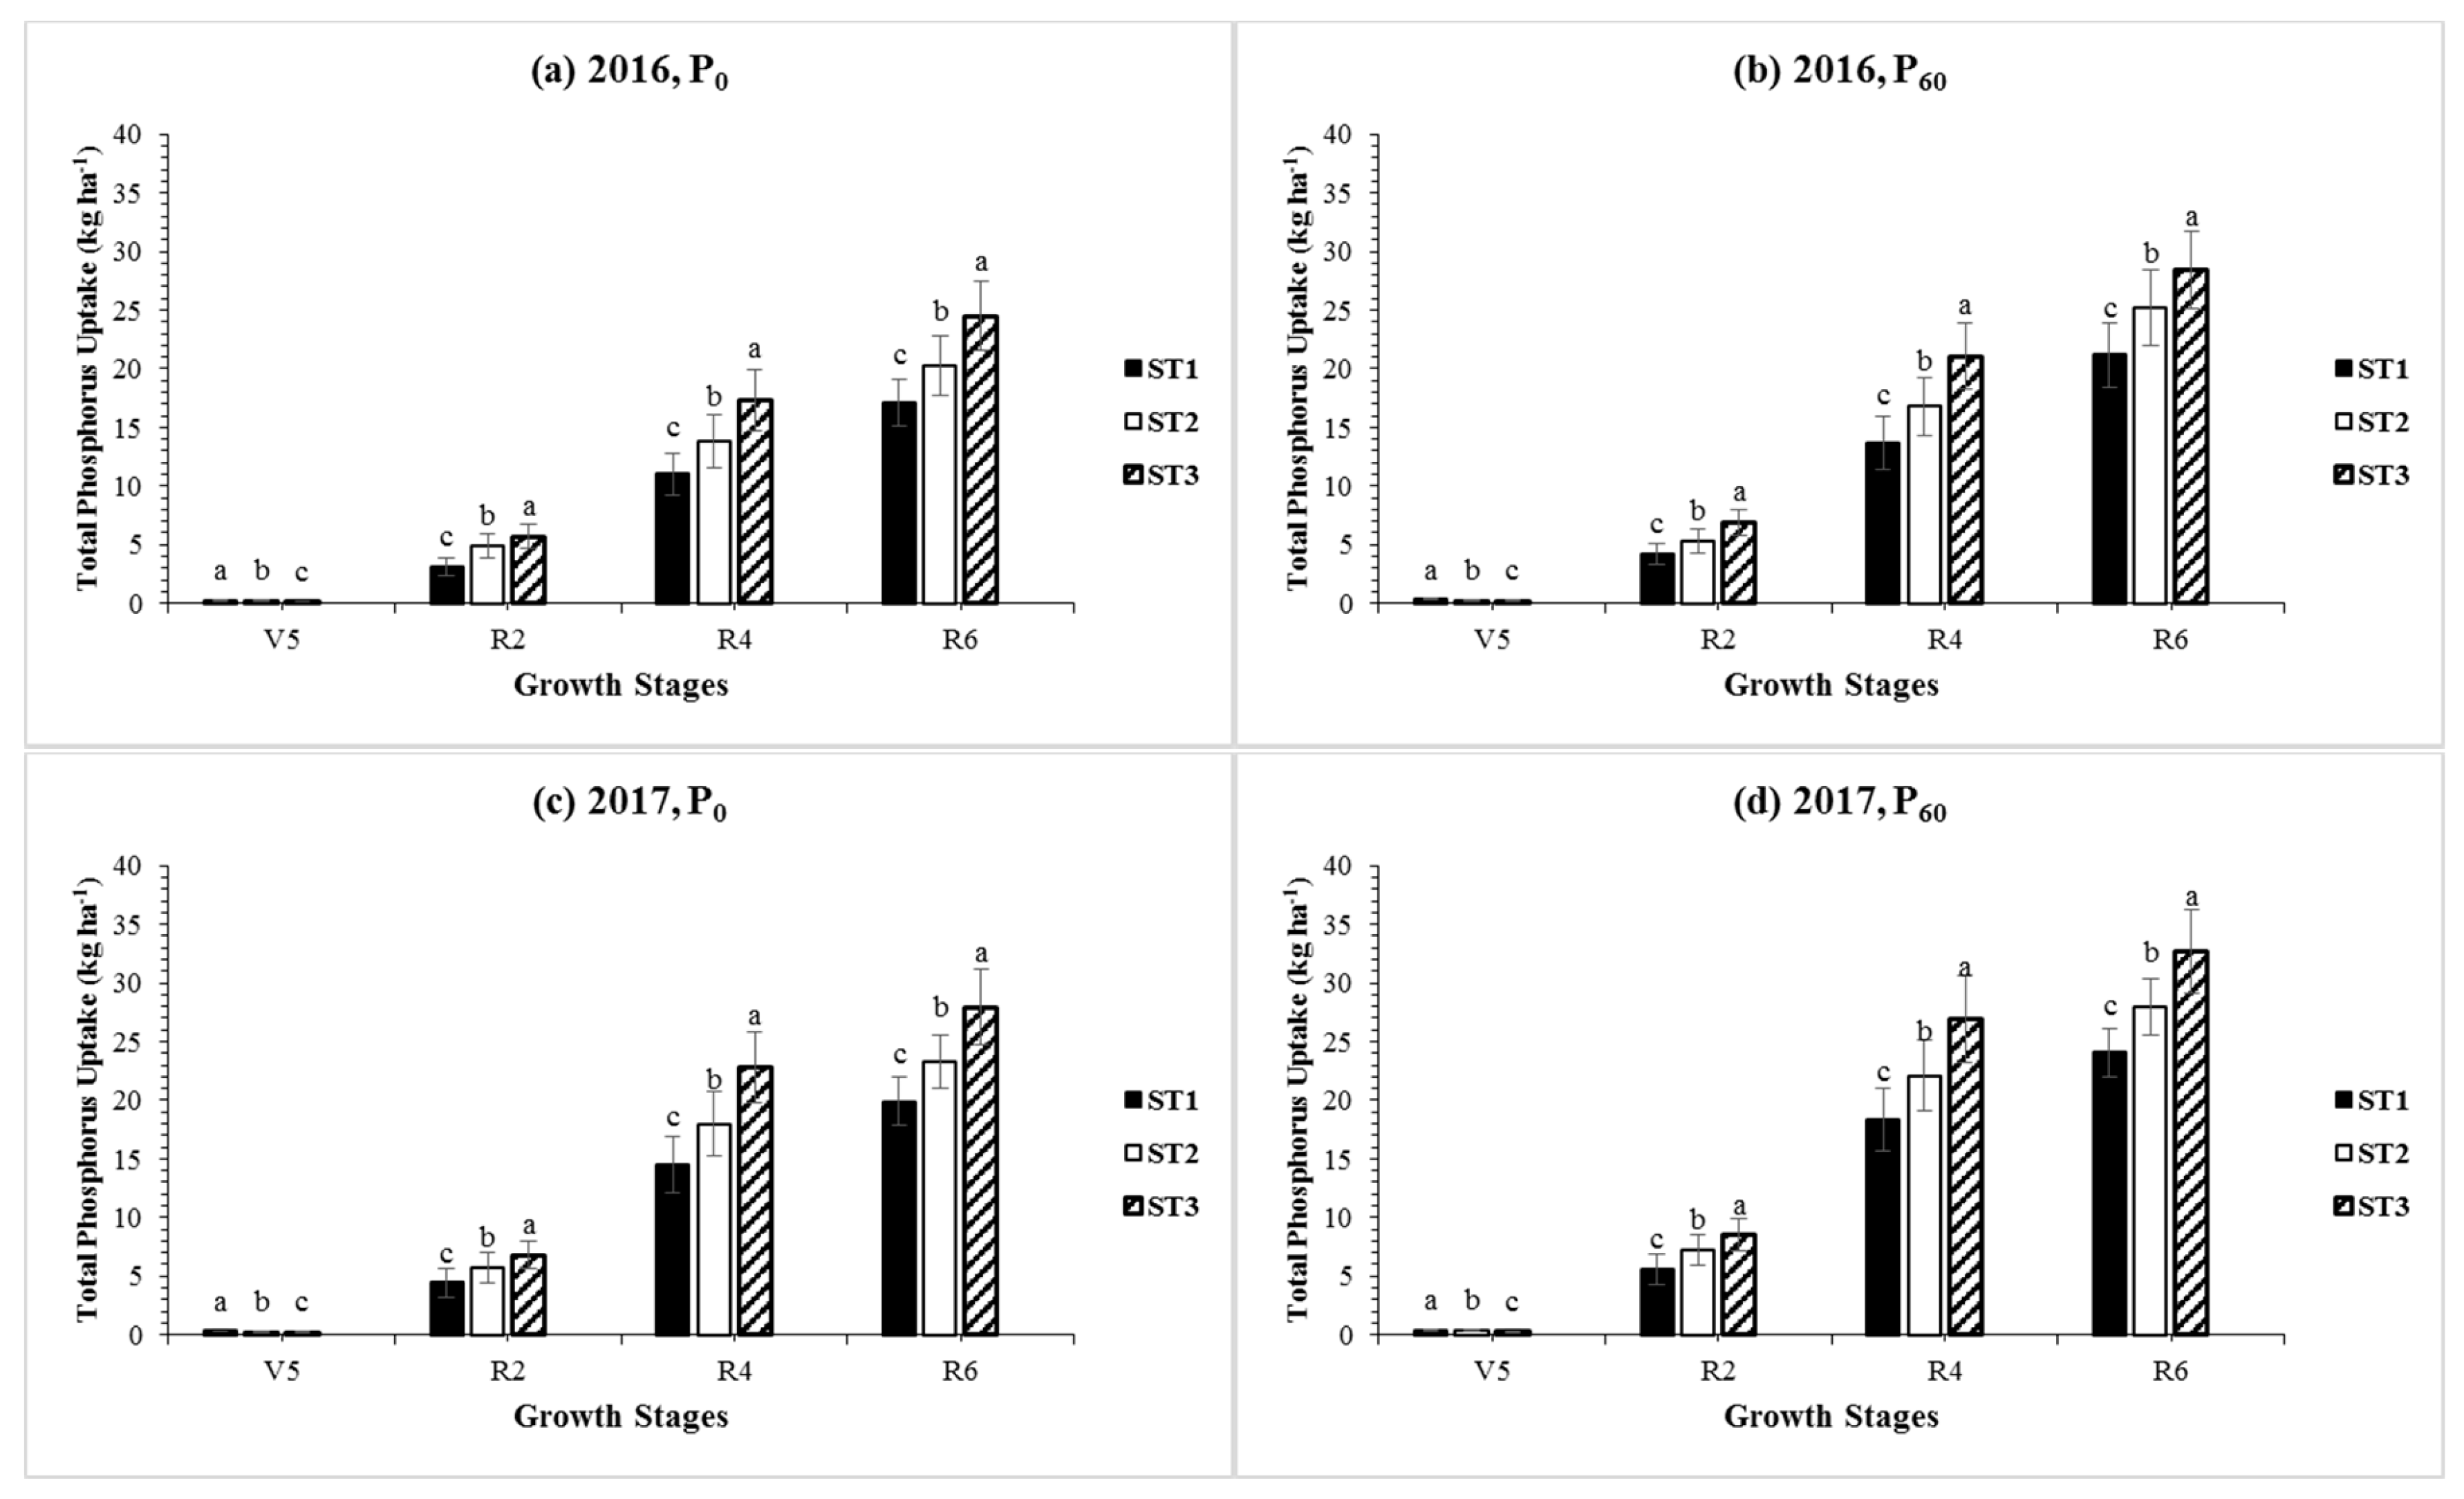
3.5. Phosphorus Uptake and Distribution

The phosphorus application substantially increased the total phosphorus uptake (TPU) and exhibited significant differences among sowing times (Figure 4). The highest TPU was attained at R6 in both years, while average highest TPU 28.4 kg ha−1 at R6 was recorded in ST3. Differences among sowing times revealed that soybean plants at R6 under P60 had accumulated 19.9% more phosphorus than P0. Moreover, the interactive effect of phosphorus fertilizer rates and sowing times for TPU at R6 was found non-significant for both years. Significant variations were also measured for P content in vegetative and reproductive organs at all growth stages (Table 5). At V5 and R2 stages highest P distribution was noted in leaves and stem, while at R4 and R6 stage, decline was measured in P content of leaves and stem while P accumulation increased in reproductive parts among sowing times. The mean highest P content in stem (5.7 and 3.9 kg ha−1), leaves (8.0 and 4.6 kg ha−1), pods (3.4 and 3.9 kg ha−1), and seed (4.9 and 15.9 kg ha−1) was determined at R4 and R6 under ST3. Phosphorus fertilizer rate P60 considerably increased the stem, leaf, pods and seed P content, and the average highest P content in stem (5.2 and 3.7 kg ha−1), leaves (7.5 and 4.3 kg ha−1), pods (2.9 and 3.5 kg ha−1), and seed (4.2 and 15.1 kg ha−1) were measured at R4 and R6, respectively. The interactive effect of phosphorus fertilizer rates and sowing times at R6 for P content in vegetative and reproductive organs was found non-significant in both years (Table 5). Overall, at R6, P60 increased the P content in reproductive parts by 19.7% as compared to P0. In addition, the extra P accumulation in soybean plants under ST3 suggesting that these are the optimum time for soybean sowing to achieve higher dry matter accumulation and seed yield under MSICS.

4. Discussion

4.1. Sowing Time and PAR Transmittance

One of the major differences of soybean growth and development between relay intercropping and sole cropping was that of growing conditions, normally soybean seedlings under MSICS experience shading conditions at initial growth which negatively affect the soybean yield and yield components. This might because of retarded crop growth and less production of photo-assimilates due to shading effect or capturing of reduced sunlight [29]. Received PAR transmittance for soybean crop significantly affected with sowing times, and it decreased, while shade intensity increased with an increase in the co-growth period. This decrease in PAR transmittance might be due to increased shading intensity [20]. In this experiment, soybean plants under ST3 treatment (shorter co-growth period) received maximum PAR transmittance at the start of flowering stage (flowering started from 52 DAS in 2016 to 51 DAS in 2017), whereas plants in longer co-growth period treatment (ST1) obtained minimum PAR transmittance before and during the flowering period. Therefore, in MSICS, under co-growth of 50 DAS, crop attained flowering stage just after harvesting of maize crop which considerably improved the number of flowers (data not shown) in ST3 that might be due to the enhanced PAR transmittance because of no shading effect as well as utilization of soil resources (nutrients and water), which helped in extra production of carbohydrate at flowering stage.

4.2. Sowing Time and Leaf Area Index

Our findings reported that different sowing times exhibited a significant effect on the values of LAI that might be due to higher PAR transmittance and good thermal conditions. This impact was more prominent on soybean plants under ST3 in both years than ST1 and ST2 (Table 2) because the co-growth period in ST3 (50 days) was shorter on comparing ST1 (90 days) and ST2 (70 days). Shading environment inhibits the leaf growth and enlargement by controlling the cell proliferation in soybean [21] and sowing time ST3 considerably reduced the shading period for soybean under MSICS. Furthermore, higher LAI resulted from ST3 treatment in MSICS indicates optimum leaf expansion, which helped in better interception and utilization of sunlight, after that LAI of soybean plants gradually decreased in all treatments (Figure 1). This pattern might be because of the reduction in crop canopy and senescence of older leaves [30]. We noted that soybean plants with phosphorus level P60 attained higher LAI under MSICS as compared to P0 (Figure 1), which might be due to longer duration of green leaf area and delayed leaf senescence [31]. It has been described that leaf expansion decreased in phosphorus stress due to the reduction in cell divisions, which suggest that cell division and development are controlled by a common regulatory factor [32]. Overall, the shift of soybean sowing time from ST1 to ST3, stress conditions (90 days of co-growth period; longer shading duration) to the favorable environment (50 days of co-growth period; longer shading duration), LAI values increased significantly (Figure 1).

4.3. Sowing Time and Photosynthetic Characteristics

Soybean is a C3 plant that features lower photosynthetic activity than C4 crops. Increased photosynthetic rate of soybean plants especially under MSICS was observed in our study which might be due to higher PAR transmittance and increased radiation use efficiency [4]. The photosynthetic rate (Pn) is affected by P application and its deficiency significantly decreases the Pn in soybean plants [32]. In the present field study, sowing time considerably changed the Pn of soybean plants, plants in ST3 under MSICS demonstrated higher Pn at V5, R2, and R4 stages (Table 3). This improvement in Pn of soybean plants might be due to the optimum temperature and precipitation during the critical growth stages of the crop (Table 1). Importantly, sowing time effect on Pn of soybean plants was evident, and maximum Pn was measured in treatment ST3 which was closely linked with the availability of higher PAR transmittance at early growth stages which helped the soybean plants to increase their leaf area and capture more sunlight. This might be due to favorable weather conditions and increased PAR transmittance, higher chlorophyll contents [9], LAI [33], and photosynthetic rate [34] of soybean plants under MSICS. Moreover, phosphorus application at 60 kg ha−1 considerably increased the Pn of soybean plants under MSICS in ST3 (Table 3) because the selection of optimum sowing time (ST3) significantly improved the leaf area index and phosphorus uptake of soybean plants under MSICS. While, decrease in Pn of soybean at 0 kg P ha−1 was attributed to reduced leaf area and phosphorus uptake [32].

4.4. Sowing Time and Dry Matter Accumulation

Our field study provides the important data on TDM (Figure 2). The increased Pn is one of the main factors for TDM production in crops [35]. Our findings showed that at initial application of 60 kg P ha−1 (P60), soybean plants adequately uptake and stored phosphorus for their growth and development and attained highest TDM production. In previous studies, it has been observed that phosphorus deficiency at initial growth stages of soybean inhibited the crop growth and caused considerable reduction in TDM production [36], while phosphorus fertilization significantly increased the soybean dry matter under intercropping [15]. In addition, crop TDM is closely related to the growing period. Temperature and shading effect are the dominant factors influencing soybean growth [4]. The flowering time has a direct impact on pod formation and soybean productivity. In this study, different sowing time treatments significantly affected the TDM production of soybean under MSICS in both years. Treatment ST3 in MSICS accelerated the dry matter accumulation in soybean at V5, R2, R4, and R6 stages, this increase in TDM may be linked with the improved light absorption and reduced shade duration (50 days of co-growth period) as prolonged shading conditions considerably decreased the TDM of soybean under MSICS [20]. We also investigated the dry matter distribution in vegetative and reproductive parts of soybean plants in response to sowing times and P applications (Table 4). The dry matter distribution among different plant parts altered significantly at V5, R2, R4 and R6 stages in soybean plants. At V5 and R2, the highest allocation of dry matter was recorded in leaves followed by the stem. After that, at R4 and R6 stages the pattern of dry matter distribution translocated and a major part of the dry matter allocated to reproductive parts (i.e., pods and seed). Decreased translocation of photosynthates to stem and leaves, while increased dry matter partitioning to seed was observed under ST3 with 60 kg P ha−1, which might be due to increased translocation of assimilates to reproductive organs at maturity. It is possible that optimum weather conditions and higher phosphorus accumulation initiated the photosynthetic activity of pods and accelerated the translocation of assimilates from the stem to seed part for seed growth. Higher temperature and decreased light interception under MSICS, respectively led to earlier crop maturity and reduced TDM production. Overall, the adverse effect of prolonged co-growth period (shading conditions) on dry matter production in the present findings confirms the importance of adjustment of sowing time selection.

4.5. Sowing Time and Seed Yield

In the present experiment, variations in seed yield under ST3 conditions compared to ST1 showed that seed yield was considerably affected by sowing time and P application (Figure 3). Unfavorable growing conditions and intensive shading negatively affected the soybean seed yield under MSICS [6], while appropriate sowing time and nutrient level significantly increased the seed yield of crops [9,27]. The increase in seed yield of soybean under ST3 in MSICS might be attributed to higher LAI (Figure 1), Pn (Table 3), and TDM production (Figure 2). The TPU by soybean plants in MSICS was increased by applying P at the rate of 60 kg ha−1 (P60). It was observed that P accumulation in soybean plants was increased with increased application of P, and soybean crop has shown to accumulate phosphorus up to 40 kg ha−1 under intercropping conditions [7]. The highest TPU noted in this experiment is attributable to both improved light interception and adequate availability of P during the early growth stages of the crop which in turn increased the total biomass production and seed yield of soybean. Therefore, we concluded that in P deficient field areas, application of P can promote the vegetative and reproductive growth of soybean plants under MSICS. The P distribution in different plant organs significantly changed in soybean plants under MSICS. The P content in stems, leaves, pods, and seeds under ST3 as recorded considerably higher than ST1 as a result of higher TDM and partitioning in reproductive parts (Table 4). Results of the present study revealed that it is important to select appropriate sowing time and P level which are ST3 and 60 kg P ha−1 under MSICS to minimize the extreme effects of shading, climate and nutrient deficiency on soybean yield and productivity.

5. Conclusions

The high seed yield of soybean under treatment ST3 in MSICS was a result of higher PAR transmittance at flowering stage. In MSICS, 50 days of co-growth period for growing soybean is the best approach to minimize the shading effect of maize on soybean at critical stage, i.e., flowering stage. Moreover, by the selection of optimum sowing time and nutrient (P) level, we can achieve higher soybean seed yield under relay intercropping systems. To the best of our knowledge, this study is the first experiment to report the effects of different sowing times on PAR transmittance, photosynthesis, dry matter accumulation, and partitioning, phosphorus uptake, and distribution in soybean plants at different growth stages under maize soybean relay intercropping system.

Author Contributions

S.A., M.A.R., and Z.T., carried out the design of the study and wrote this paper. S.H., L.F., A.W., N.I., M.H.B.K., A.A.M., and L.W., conducted the plant cultivation, chemical analysis and statistical analysis of this work. S.A., and M.A.R., participated in experiment management. W.Y., reviewed and edited this research paper.

Funding

This research was funded by the National Key Research and Development Program of China, grant numbers (2016YFD0300602 and 2016YFD0300209).

Acknowledgments

The authors are grateful to Sichuan Agricultural University for providing the scholarship to SA for graduate studies. The SA is grateful to Yang Wenyu for guidance, Muhammad Fazil for their support and guidance.

Conflicts of Interest

The authors have declared no conflict of interest.

References

  1. Liu, W.; Deng, Y.; Hussain, S.; Zou, J.; Yuan, J.; Luo, L.; Yang, C.; Yuan, X.; Yang, W. Relationship between cellulose accumulation and lodging resistance in the stem of relay intercropped soybean [Glycine max (L.) Merr.]. Field Crops Res. 2016, 196, 261–267. [Google Scholar] [CrossRef]
  2. Oseni, T.O. Evaluation of sorghum-cowpea intercrop productivity in savanna agro-ecology using competition indices. J. Agric. Sci. 2010, 2, 229–234. [Google Scholar] [CrossRef]
  3. Echarte, L.; Della Maggiora, A.; Cerrudo, D.; Gonzalez, V.H.; Abbate, P.; Cerrudo, A.; Sadras, V.O.; Calvino, P. Yield response to plant density of maize and sunflower intercropped with soybean. Field Crops Res. 2011, 121, 423–429. [Google Scholar] [CrossRef]
  4. Yang, F.; Liao, D.; Wu, X.; Gao, R.; Fan, Y.; Raza, M.A.; Wang, X.; Yong, T.; Liu, W.; Liu, J. Effect of aboveground and belowground interactions on the intercrop yields in maize-soybean relay intercropping systems. Field Crops Res. 2017, 203, 16–23. [Google Scholar] [CrossRef]
  5. Duchene, O.; Vian, J.F.; Celette, F. Intercropping with legume for agroecological cropping systems: Complementarity and facilitation processes and the importance of soil microorganisms. A review. Agric. Ecosyst. Environ. 2017, 240, 148–161. [Google Scholar] [CrossRef]
  6. Chen, P.; Du, Q.; Liu, X.; Zhou, L.; Hussain, S.; Lei, L.; Song, C.; Wang, X.; Liu, W.; Yang, F. Effects of reduced nitrogen inputs on crop yield and nitrogen use efficiency in a long-term maize-soybean relay strip intercropping system. PLoS ONE 2017, 12, E0184503. [Google Scholar] [CrossRef] [PubMed]
  7. Xia, H.Y.; Wang, Z.G.; Zhao, J.H.; Sun, J.H.; Bao, X.G.; Christie, P.; Zhang, F.-S.; Li, L. Contribution of interspecific interactions and phosphorus application to sustainable and productive intercropping systems. Field Crops Res. 2013, 154, 53–64. [Google Scholar] [CrossRef]
  8. Raza, M.; Feng, L.; Iqbal, N.; Manaf, A.; Khalid, M.; Wasaya, A.; Ansar, M.; Billah, M.; Yang, F.; Yang, W. Effect of sulphur application on photosynthesis and biomass accumulation of sesame varieties under rainfed conditions. Agronomy 2018, 8, 149. [Google Scholar] [CrossRef]
  9. Ahmed, M. Response of spring wheat (Triticum Aestivum, L.) quality traits and yield to sowing date. PLoS ONE 2015, 10, E0126097. [Google Scholar] [CrossRef] [PubMed]
  10. Ciaffi, M.; Tozzi, L.; Borghi, B.; Corbellini, M.; Lafiandra, D. Effect of heat shock during grain filling on the gluten protein composition of bread wheat. J. Cereal Sci. 1996, 24, 91–100. [Google Scholar] [CrossRef]
  11. Gilbert, N. Environment: The disappearing nutrient. Nat. News 2009, 461, 716–718. [Google Scholar] [CrossRef] [PubMed]
  12. Zhu, J.; Werf, W.; van der Vos, J.; Anten, N.P.R.; van der Putten, P.E.L.; Evers, J.B. High productivity of wheat intercropped with maize is associated with plant architectural responses. Ann. Appl. Biol. 2016, 168, 357–372. [Google Scholar] [CrossRef]
  13. Zhou, T.; Du, Y.; Ahmed, S.; Liu, T.; Ren, M.; Liu, W.; Yang, W. Genotypic differences in phosphorus efficiency and the performance of physiological characteristics in response to low phosphorus stress of soybean in southwest of China. Front. Plant Sci. 2016, 7, 1776–1788. [Google Scholar] [CrossRef] [PubMed]
  14. Vitousek, P.M.; Rosamond, N.; Timothy, C.; David, M.B.; Drinkwater, L.E.; Holland, E.; Johnes, P.J.; Katzenberger, J.; Martinelli, L.A.; Matson, P.A. Nutrient Imbalances in Agricultural Development. Science 2009, 324, 1519–1520. [Google Scholar] [CrossRef] [PubMed]
  15. Li, L.; Sun, J.; Zhang, F.; Li, X.; Yang, S.; Rengel, Z. Wheat/maize or wheat/soybean strip intercropping: I. yield advantage and interspecific interactions on nutrients. Field Crops Res. 2001, 71, 123–137. [Google Scholar] [CrossRef]
  16. Zhang, L.; Van der Werf, W.; Bastiaans, L.; Zhang, S.; Li, B.; Spiertz, J.H.J. Light interception and utilization in relay intercrops of wheat and cotton. Field Crops Res. 2008, 107, 29–42. [Google Scholar] [CrossRef]
  17. Chen, Y.; Zhou, T.; Zhang, C.; Wang, K.; Liu, J.; Lu, J.; Xu, K. Rational phosphorus application facilitates the sustainability of the wheat/maize/soybean relay strip intercropping system. PLoS ONE 2015, 10, E0141725. [Google Scholar] [CrossRef] [PubMed]
  18. Usuda, H.; Shimogawara, K. Phosphate deficiency in maize. i. leaf phosphate status, growth, photosynthesis and carbon partitioning. Plant Cell Physiol. 1991, 32, 497–504. [Google Scholar]
  19. Hou, A.; Chen, P.; Alloatti, J.; Li, D.; Mozzoni, L.; Zhang, B.; Shi, A. Genetic variability of seed sugar content in worldwide soybean germplasm collections. Crop Sci. 2009, 49, 903–912. [Google Scholar] [CrossRef]
  20. Yang, F.; Huang, S.; Gao, R.; Liu, W.; Yong, T.; Wang, X.; Wu, X.; Yang, W. Growth of soybean seedlings in relay strip intercropping systems in relation to light quantity and red: Far-red ratio. Field Crops Res. 2014, 155, 245–253. [Google Scholar] [CrossRef]
  21. Wu, Y.; Gong, W.; Yang, W. Shade inhibits leaf size by controlling cell proliferation and enlargement in soybean. Sci. Rep. 2017, 7, 9259–9268. [Google Scholar] [CrossRef] [PubMed]
  22. Wu, Y.S.; Yang, F.; Gong, W.Z.; Shoaib, A.; Fan, Y.F.; Wu, X.L. Shade adaptive response and yield analysis of different soybean genotypes in relay intercropping systems. J. Integr. Agric. 2017, 16, 1331–1340. [Google Scholar] [CrossRef]
  23. Rahman, T.; Liu, X.; Hussain, S.; Ahmed, S.; Chen, G.; Yang, F.; Chen, L.; Du, J.; Liu, W.; Yang, W. Water use efficiency and evapotranspiration in maize-soybean relay strip intercrop systems as affected by planting geometries. PLoS ONE 2017, 12, E0178332. [Google Scholar] [CrossRef] [PubMed]
  24. Du, J.; Han, T.; Gai, J.; Yong, T.; Sun, X.; Wang, X.; Yang, F.; Liu, J.; Shu, K.; Liu, W. Maize-soybean strip intercropping: Achieved a balance between high productivity and sustainability. J. Integr. Agric. 2017, 16, 60345–60347. [Google Scholar] [CrossRef]
  25. Serrano, L.; Gamon, J.A.; Peñuelas, J. Estimation of canopy photosynthetic and nonphotosynthetic components from spectral transmittance. Ecology 2000, 81, 3149–3162. [Google Scholar] [CrossRef]
  26. Gao, Y.; Duan, A.; Qiu, X.; Sun, J.; Zhang, J.; Liu, H.; Wang, H. Distribution and use efficiency of photosynthetically active radiation in strip intercropping of maize and soybean. Agron. J. 2010, 102, 1149–1157. [Google Scholar] [CrossRef]
  27. Raza, M.A.; Feng, L.Y.; Manaf, A.; Wasaya, A.; Ansar, M.; Hussain, A.; Khalid, M.H.B.; Iqbal, N.; Xi, Z.J.; Chen, Y.K. Sulphur application increases seed yield and oil content in sesame seeds under rainfed conditions. Field Crops Res. 2018, 218, 51–58. [Google Scholar] [CrossRef]
  28. Bennett, L.T.; Judd, T.S.; Adams, M.A. Growth and nutrient content of perennial grasslands following burning in semi-arid, sub-tropical Australia. Plant Ecol. 2003, 164, 185–199. [Google Scholar] [CrossRef]
  29. Liu, X.; Rahman, T.; Song, C.; Su, B.; Yang, F.; Yong, T.; Wu, Y.; Zhang, C.; Yang, W. Changes in light environment, morphology, growth and yield of soybean in maize-soybean intercropping systems. Field Crops Res. 2017, 200, 38–46. [Google Scholar] [CrossRef]
  30. Chen, S.; Zhang, X.; Sun, H.; Ren, T.; Wang, Y. Effects of winter wheat row spacing on evapotranpsiration, grain yield and water use efficiency. Agric. Water Manag. 2010, 97, 1126–1132. [Google Scholar] [CrossRef]
  31. Batten, G.D.; Wardlaw, I.F. Senescence of the flag leaf and grain yield following late foliar and root applications of phosphate on plants of differing phosphorus status. J. Plant Nutr. 1987, 10, 735–748. [Google Scholar] [CrossRef]
  32. Chaudhary, M.I.; Joseph, J.A.-G.; Saneoka, H.; Nguyen, N.T.; Suwa, R.; Kanai, S.; El-Shemy, H.A.; Lightfoot, D.A.; Fujita, K. The Effect of phosphorus deficiency on nutrient uptake, nitrogen fixation and photosynthetic rate in mashbean, mungbean and soybean. Acta Physiol. Plant. 2008, 30, 537–544. [Google Scholar] [CrossRef]
  33. Wu, Y.; Gong, W.; Wang, Y.; Yong, T.; Yang, F.; Liu, W.; Wu, X.; Du, J.; Shu, K.; Liu, J. Leaf area and photosynthesis of newly emerged trifoliolate leaves are regulated by mature leaves in soybean. J. Plant Res. 2018, 1–10. [Google Scholar] [CrossRef] [PubMed]
  34. Yang, F.; Feng, L.; Liu, Q.; Wu, X.; Fan, Y.; Raza, M.A.; Cheng, Y.; Chen, J.; Wang, X.; Yong, T. Effect of interactions between light intensity and red-to-far-red ratio on the photosynthesis of soybean leaves under shade condition. Environ. Exp. Bot. 2018, 150, 79–87. [Google Scholar] [CrossRef]
  35. Liu, W.; Zou, J.; Zhang, J.; Yang, F.; Wan, Y.; Yang, W. Evaluation of soybean (Glycine Max) stem vining in maize-soybean relay strip intercropping system. Plant Product. Sci. 2015, 18, 69–75. [Google Scholar] [CrossRef]
  36. Li, A.; Guo, D.; Wang, Z.; Liu, H. Nitrogen and phosphorus allocation in leaves, twigs, and fine roots across 49 temperate, subtropical and tropical tree species: A hierarchical pattern. Funct. Ecol. 2010, 24, 224–232. [Google Scholar] [CrossRef]
Figure 1. Leaf area index of relay intercrop soybean as affected by three different sowing times at two rates of phosphorus fertilizer (P0; A and C, and P60; B and D) during the cropping seasons of 2016 and 2017. ST1, ST2, and ST3 represents the sowing times 15–20 May (90 days of co-growth period in maize soybean relay intercropping system (MSICS)), 5–10 June (70 days of co-growth period in maize soybean relay intercropping system (MSICS)), and 25–30 June, (50 days of co-growth period in maize soybean relay intercropping system (MSICS)), respectively. V5, R2, R4, and R6 refer to five trifoliate, full flowering, full pod, and full seed phenological stages of soybean. The P0 and P60 refer to 0 and 60 kg phosphorus ha−1, respectively. Means are averaged over three replicates. Bars indicate ± standard errors, (n = 3). Between bars in groups, different lowercase letters indicate a significant difference (p < 0.05) between treatments.
Agronomy 08 00282 g001
Figure 2. Total above-ground dry matter of relay intercrop soybean as affected by three different sowing times at two rates of phosphorus fertilizer (P0; A and C, and P60; B and D) during the cropping seasons of 2016 and 2017. ST1, ST2, and ST3 represents the sowing times 15–20 May (90 days of co-growth period in maize soybean relay intercropping system (MSICS)), 5–10 June (70 days of co-growth period in maize soybean relay intercropping system (MSICS)), and 25–30 June, (50 days of co-growth period in maize soybean relay intercropping system (MSICS)), respectively. V5, R2, R4, and R6, refer to five trifoliate, full flowering, full pod, and full seed phenological stages of soybean. The P0 and P60 refer to 0 and 60 kg phosphorus ha−1, respectively. Means are averaged over three replicates. Bars indicate ± standard errors, (n = 3). Between bars in groups, different lowercase letters indicate a significant difference (p < 0.05) between treatments.
Agronomy 08 00282 g002
Figure 3. Seed yield of relay intercrop soybean as affected by three different sowing times at two rates of phosphorus fertilizer (P0; A and P60; B) during the cropping seasons of 2016 and 2017. ST1, ST2, and ST3 represents the sowing times 15–20 May (90 days of co-growth period in maize soybean relay intercropping system (MSICS)), 5–10 June (70 days of co-growth period in maize soybean relay intercropping system (MSICS)), and 25–30 June, (50 days of co-growth period in maize soybean relay intercropping system (MSICS)), respectively. The P0 and P60 refer to 0 and 60 kg phosphorus ha−1, respectively. Means are averaged over three replicates. Bars indicate ± standard errors, (n = 3). Between bars in groups, different lowercase letters indicate a significant difference (p < 0.05) between sowing times in each of the two years and at each of the phosphorus fertilization levels.
Agronomy 08 00282 g003
Figure 4. Total phosphorus uptake of relay intercrop soybean in maize as affected by three different sowing times at two rates of phosphorus fertilizer (P0; A and C, and P60; B and D) during the cropping seasons of 2016 and 2017. ST1, ST2, and ST3 represents the sowing times 15–20 May (90 days of co-growth period in maize soybean relay intercropping system (MSICS)), 5–10 June (70 days of co-growth period in maize soybean relay intercropping system (MSICS)), and 25–30 June, (50 days of co-growth period in maize soybean relay intercropping system (MSICS)), respectively. V5, R2, R4, and R6 refer to five trifoliate, full flowering, full pod, and full seed phenological stages of soybean. The P0 and P60 refer to 0 and 60 kg phosphorus ha−1, respectively. Means are averaged over three replicates. Bars indicate ± standard errors, (n = 3). Between bars in groups, different lowercase letters indicate a significant difference (p < 0.05) between treatments.
Agronomy 08 00282 g004
Table 1. Monthly rainy days, rainfall, minimum temperature, maximum temperature, and mean temperature from 2016 to 2017.
MonthYears
20162017
Rainy DaysRainfall (mm)Minimum T (°C)Maximum T (°C)Mean T (°C)Rainy DaysRainfall (mm)Minimum T (°C)Maximum T (°C)Mean T (°C)
January1740.13.58.16.92021.44.610.16.0
February1019.62.612.48.82027.74.911.97.2
March2073.510.418.314.62565.98.215.311.7
April26107.115.124.117.825115.115.120.518.0
May24120.419.227.421.121103.319.725.321.4
June20164.523.931.524.323103.5121.627.122.5
July26145.425.633.924.92196.524.135.724.5
August23108.225.834.126.128152.623.433.425.7
September2797.120.128.620.823297.217.926.420.8
October2681.517.522.819.622185.211.419.217.1
November1729.99.616.214.62041.97.916.511.6
December2128.46.312.27.21716.11.712.06.8
Table 2. Photosynthetically active radiation (PAR) and PAR transmittance of soybean canopy at three stages of phenological development as affected by two rates of phosphorus fertilizers during the cropping seasons of 2016 and 2017 under maize soybean relay intercropping system.
YearTreatment PAR (µmol m−2 s−1)PAR Transmittance (%)
V5R2R4V5R2R4
2016Phosphorus (P)P0912.7 a1071.8 a1269.0 a69.0 a76.6 a88.2 a
P60875.0 a1077.9 a1282.3 a65.6 a77.1 a87.6 b
LSD (0.05)39.3717.0640.393.711.480.22
Sowing Time (ST)ST11012.2 a812.2 c914.5b77.5 a57.5 c63.8 b
ST2847.3 b989.5 b1445.5 a63.4 b73.0 b100.0 a
ST3821.8 b1422.8 a1467.0 a61.0 c100.0 a100.0 a
LSD (0.05)21.4023.5021.801.743.240.47
Interaction (P × ST)NSNSNSNSNS*
2017Phosphorus (P)P0889.6 a1074.9 a1278.0 a66.6 a75.8 a88.4 a
P60883.7 a1080.4 a1288.8 a65.6 a74.4 b88.0 a
LSD (0.05)34.6116.8120.401.961.151.03
Sowing Time (ST)ST1986.7 a845.2 c934.3 b74.9 a59.5 c64.7 b
ST2837.9 b953.5 b1454.5 a62.1 b65.9 b100.0 a
ST3835.8 b1434.1 a1461.3 a61.4 b100.0 a100.0 a
LSD (0.05)24.8932.7310.011.851.680.93
Interaction (P × ST)NSNSNSNSNSNS
ST1, ST2, and ST3 represents the sowing times 15–20 May (90 days of co-growth period in maize soybean relay intercropping system (MSICS)), 5–10 June (70 days of co-growth period in maize soybean relay intercropping system (MSICS)), and 25–30 June, (50 days of co-growth period in maize soybean relay intercropping system (MSICS)), respectively, and V5, R2, and R4 refer to five trifoliate, full flowering, and full pod phenological stages of soybean, P0 an P60 refers to phosphorus fertilizer rates 0 and 60 kg ha−1, respectively. Means that do not share the same letters in the column differ significantly at p ≤ 0.05; * = Significant, NS = Non-significant.
Table 3. Effect of sowing times and phosphorus fertilizer rates on photosynthetic characteristics of soybean at three stages of phenological development in relay intercropping system with maize during the cropping seasons of 2016 and 2017.
YearTreatment Photosynthetic Rate
(μmol CO2 m−2 s−1)
Stomatal Conductance
(mol H2O m−2 s−1)
Transpiration Rate
(mmol H2O m−2 s−1)
Intercellular CO2 Concentration
(μmol CO2 m−2 s−1)
V5R2R4V5R2R4V5R2R4V5R2R4
2016Phosphorus (P)P017.4 b17.5 b19.6 b57.2 b64.2 b75.5 b1.6 b1.9 b2.2 b233.3 b260.3 b303.7 b
P6018.5 a18.6 a21.2 a63.0 a71.3 a84.9 a1.8 a2.1 a2.5 a247.1 a279.1 a325.7 a
LSD (0.05) 0.550.490.201.632.353.160.030.030.074.841.667.11
Sowing Time (ST)ST117.3 c17.4 c19.4 c55.7 c62.5 c73.5 c1.6 c1.8 c2.1 c222.9 c247.8 c290.5 c
ST218.1 b18.2 b20.5 b59.8 b67.4 b80.0 b1.8 b2.0 b2.3 b239.3 b269.8 b314.2 b
ST318.5 a18.6 a21.3 a64.9 a 73.4 a87.1 a1.9 a2.1 a2.6 a258.4 a291.6 a339.4 a
LSD (0.05) 0.340.340.180.560.680.330.050.050.032.914.180.64
Interaction (P × ST) ****NS*NSNSNSNSNS*
2017Phosphorus (P)P019.8 b21.2 b21.4 b61.9 a70.9 b82.2 b1.8 b2.1 b2.5 b250.9 b281.8 b330.7 b
P6021.3 a22.3 a22.5 a68.4 a77.5 a92.2 a2.0 a2.4 a2.8 a265.4 a303.5 a353.4 a
LSD (0.05) 0.470.610.340.943.705.100.040.060.054.204.327.30
Sowing Time (ST)ST119.5 c21.1 c21.3 c60.4 c68.8 c80.2 c1.7 c2.1 c2.4 c239.9 c270.7 c316.7 c
ST220.7 b21.8 b22.0 b65.1 b73.8 b86.8 b1.9 b2.3 b2.7 b256.6 b291.4 b341.2 b
ST321.5 a22.3 a22.5 a69.8 a80.0 a94.5 a2.1 a2.4 a2.9 a278.0 a315.8 a368.2 a
LSD (0.05) 0.160.411.442.030.870.050.100.042.323.853.852.82
Interaction (P × ST) *NSNSNSNS*NSNSNSNSNSNS
ST1, ST2, and ST3 represents the sowing times 15–20 May (90 days of co-growth period in maize soybean relay intercropping system (MSICS)), 5–10 June (70 days of co-growth period in maize soybean relay intercropping system (MSICS)), and 25–30 June, (50 days of co-growth period in maize soybean relay intercropping system (MSICS)), respectively, and V5, R2, and R4 refer to five trifoliate, full flowering, and full pod phenological stages of soybean, P0 and P60 refers to phosphorus fertilizer rates 0 and 60 kg ha−1, respectively. Means do not share the same letters in the column differ significantly at p ≤ 0.05; * = Significant, NS = Non-significant.
Table 4. Effect of sowing times and phosphorus fertilizer rates on above ground dry matter partitioning of soybean at four stages of phenological development in relay intercropping system with maize during the cropping seasons of 2016 and 2017.
YearTreatments Dry Matter Partitioning (g plant−1)
V5R2R4R6
LeafStemLeafStemLeafStemPodSeedLeafStemPodSeed
2016Phosphorus (P)P00.98 b0.61 b10.35 b6.95 b16.80 b13.61 b4.31 b6.13 b20.14 b17.35 b5.96 b13.59 b
P601.15 a0.74 a11.72 a8.55 a18.28 a15.23 a5.02 a7.29 a23.31 a 20.39 a6.59 a15.64 a
LSD (0.05)0.010.100.330.030.681.120.100.690.701.900.250.53
Sowing Time (ST)ST11.30 a0.80 a8.09 c5.76 c15.38 c12.27 c3.64 c5.15 c19.77 c16.96 c5.34 c12.47 c
ST21.01 b0.63 b11.39 b7.77 b17.44 b14.36 b4.43 b6.50 b21.66 b18.76 b6.00 b14.88 b
ST30.88 c0.60 b13.63 a9.72 a19.80 a16.64 a5.92 a8.49 a23.74 a20.88 a7.49 a16.51 a
LSD (0.05)0.060.050.420.360.530.570.210.430.450.710.280.46
Interaction (P × ST)NSNS**NSNS***NS*NS
2017Phosphorus (P)P01.19 b0.83 b12.26 b8.97 b20.92 b18.19 b5.84 b8.12 b25.15 b22.37 b7.73 b14.36 b
P601.50 a1.08 a14.47 a11.45 a23.07 a20.31 a6.76 a9.41 a27.65 a24.89 a8.81 a16.49 a
LSD (0.05)0.120.060.840.700.941.600.460.850.840.740.240.70
Sowing Time (ST)ST11.58 a1.11 a10.47 c8.14 c19.63 c16.64 c5.05 c6.73 c22.83 c19.95 c7.31 c13.56 c
ST21.29 b0.91 b13.73 b10.35 b21.76 b19.18 b5.95 b8.54 b26.55 b24.15 b7.98 b15.35 b
ST31.16 c0.86 c15.90 a12.13 a24.59 a21.93 a7.90 a11.04 a29.82 a26.79 a9.54 a17.37 a
LSD (0.05)0.070.040.640.730.390.880.490.431.330.790.381.30
Interaction (P × ST)NSNSNSNSNSNSNS*NSNSNSNS
ST1, ST2, and ST3 represents the sowing times 15–20 May (90 days of co-growth period in maize soybean relay intercropping system (MSICS)), 5–10 June (70 days of co-growth period in maize soybean relay intercropping system (MSICS)), and 25–30 June, (50 days of co-growth period in maize soybean relay intercropping system (MSICS)), respectively, and V5, R2, R4, and R6 refer to five trifoliate, full flowering, full pod, and full seed phenological stages of soybean, P0 an P60 refers to phosphorus fertilizer rates 0 and 60 kg ha−1, respectively. Means do not share the same letters in the column differ significantly at p ≤ 0.05; * = Significant, NS = Non-significant.
Table 5. Effect of sowing times and phosphorus fertilizer rates on phosphorus distribution of soybean at four stages of phenological development in relay intercropping system with maize during the cropping seasons of 2016 and 2017.
YearTreatments Phosphorus Distribution (kg ha−1)
V5R2R4R6
StemLeafStemLeafStemLeafPodSeedStemLeafPodSeed
2016Phosphorus (P)P00.07 b0.12 b1.82 b2.75 b3.78 b5.30 b2.08 b2.93 b2.65 b3.20 b2.54 b12.24 b
P600.09 a0.15 a2.30 a3.20 a4.45 a6.57 a2.48 a3.68 a3.28 a3.96 a2.99 a14.69 a
LSD (0.05)0.010.020.210.150.160.500.090.790.700.890.03103
Sowing Time (ST)ST10.10 a0.17 a1.52 c2.15 c3.36 c4.82 c1.73 c2.45 c2.57 c3.10 c2.24 c11.25 c
ST20.08 b0.13 b2.06 b3.05 b4.10 b5.87 b2.17 b3.20 b2.95 b3.56 b2.62 b13.59 b
ST30.07 c0.10 c2.61 a3.72 a4.88 a7.11 a2.94 a4.27 a3.38 a4.08 a3.44 a15.55 a
LSD (0.05)0.010.020.130.190.210.260.190.280.240.260.080.76
Interaction (P × ST)NSNS*NSNSNSNSNSNSNSNSNS
2017Phosphorus (P)P00.10 b0.14 b2.37 b3.29 b5.07 b6.65 b2.82 b3.91 b3.43 b4.00 b3.30 b12.96 b
P600.14 a0.20 a3.10 a4.00 a5.98 a8.36 a3.37 a4.74 a4.04 a4.69 a4.03 a15.47 a
LSD (0.05)0.010.040.300.280.530.900.450.440.120.360.120.70
Sowing Time (ST)ST10.14 a0.21 a2.16 c2.82 c4.59 c6.21 c2.42 c3.22 c3.02 c3.61 c3.12 c12.24 c
ST20.11 b0.17 b2.76 b3.72 b5.52 b7.40 b2.93 b4.19 b3.82 b4.30 b3.49 b14.01 b
ST30.10 c0.14 c3.27 a4.39 a6.47 a8.91 a3.94 a5.55 a4.38 a5.12 a4.39 a16.40 a
LSD (0.05)0.010.010.110.140.340.330.310.330.210.390.131.32
Interaction (P × ST)NSNS*NSNSNSNSNSNSNSNSNS
ST1, ST2, and ST3 represents the sowing times 15–20 May (90 days of co-growth period in maize soybean relay intercropping system (MSICS)), 5–10 June (70 days of co-growth period in maize soybean relay intercropping system (MSICS)), and 25–30 June, (50 days of co-growth period in maize soybean relay intercropping system (MSICS)), respectively, and V5, R2, R4, and R6 refer to five trifoliate, full flowering, full pod, and full seed phenological stages of soybean, P0 an P60 refers to phosphorus fertilizer rates 0 and 60 kg ha−1, respectively. Means do not share the same letters in the column differ significantly at p ≤ 0.05; * = Significant, NS = Non-significant.

