Article

Impact of Nitrogen and Sulfur Supply on the Potential of Acrylamide Formation in Organically and Conventionally Grown Winter Wheat

by
Falko Stockmann
1,*,
Ernst Albrecht Weber
1,
Pat Schreiter
2,
Nikolaus Merkt
1,
Wilhelm Claupein
1 and
Simone Graeff-Hönninger
1
1
Institute of Crop Science, University of Hohenheim, 70599 Stuttgart, Germany
2
Chemisches und Veterinäruntersuchungsamt Stuttgart, Schaflandstraße 3/2, 70736 Fellbach, Germany
*
Author to whom correspondence should be addressed.
Submission received: 21 October 2018 / Revised: 22 November 2018 / Accepted: 23 November 2018 / Published: 27 November 2018

Abstract

:
In a two-year field trial, the effect of nitrogen (N) and sulfur (S) fertilization was investigated on grain yield, grain quality parameters, formation of acrylamide (AA), and the precursor free asparagine (Asn) in organically and conventionally produced winter wheat cultivars. In both production systems, different types, amounts, and temporal distributions of N were tested. The the effect of S fertilizer types and amounts on free Asn was only tested in the conventional farming system. Within both cropping systems, grain yield and baking quality were significantly influenced by N treatment while the effect on free Asn was only minor. Especially within the organic farming system, increasing N fertilization levels did not increase free Asn significantly. A slight trend of increasing free Asn levels with an intensified N supply was observed, especially in the presence of crude protein contents of 14% or higher. However, only N amounts of 180 kg N ha−1 or higher increased the probability of high free Asn contents considerably, while N supply below that amount led to free Asn values similar to the unfertilized controls. The results indicated that good baking quality can be achieved without significantly increasing free Asn levels. In addition, cultivars affected the levels of free Asn significantly. Compared to cv. Bussard and Naturastar, cv. Capo exhibited the lowest AA formation potential at an N supply of 180 kg N ha−1 while simultaneously reaching a crude protein content > 15% (conventional) and > 12% (organic). Thus, it seems that cultivars differ in their ability to store and incorporate free Asn into proteins. Over all trials, a relation of free Asn and AA was shown by R2 = 0.77, while a relation of free Asn and protein was only R2 = 0.36. Thus, lowering free Asn by adjusting N treatments should not necessarily affect baking quality. S fertilization within conventional farming did not change the free Asn amount or crude protein significantly, probably due to the fact that soil was not sulfate-deficient. In summary, it was evident that free Asn amounts in wheat varied widely both within cultivars and between cropping systems. In order to clearly unravel genotypic differences and their interaction with environmental factors and especially N fertilization, further research is needed.

1. Introduction

Food industry and gastronomy are facing a big challenge because current regulation of the European Commission [1] was announced that limits the level of acrylamide (AA) in cereal food products and requires that minimization strategies are applied.
AA—a probable carcinogen to humans—is formed in carbohydrate-rich food (e.g., cereals and potatoes) thermally by means of the Maillard-reaction, where free Asn and reducing sugars react [2,3,4]. Its discovery in 2002 by a Swedish research group [5] gained immediate attention by health authorities worldwide. Intense efforts were undertaken to gather information about the synthesis, toxicology, and formation routes of AA and led to several approaches to minimize the amount of AA in foodstuffs. Studies have successfully shown that the limiting factors for AA formation in potato products are the concentrations of reducing sugars, while for cereal products, the content of free Asn is the limiting factor [6,7,8,9]. Although strongly heated potato products can contain much more AA than cereal-based bakery products, bread and bread rolls contribute to about 25% to 45% of the dietary AA intake in Germany, due to the high daily per capita consumption of almost 240 g [10,11].
In the context of the newly released EU regulation, AA has gained a renewed interest. Currently, the food business is forced to reduce the presence of acrylamide in foodstuffs where raw materials contain its precursors by laying down appropriate mitigation measures.
Initial efforts focused on finding ways to lower AA by modified processing steps alongside the food production chain; including changing heating temperature, heating duration, as well as changing the recipe [6,9,12,13,14]. Moreover, some studies investigated the efficacy of the use of additives and the enzyme asparaginase during processing for lowering AA [13,15,16]. Although modification of processing conditions often led to significant reductions in AA levels, these treatments are also expensive, not feasible for the food industry, or affect taste, texture, color, and aroma compounds, which often impair consumer acceptance. A more practical solution for the food industry is to lower the AA formation potential in cereal-based bakery wares by using raw materials low in precursors of AA. Thus, flours with a low level of free Asn will gain the interest of the food industry. In this context, it is important to implement agronomic measures that will produce raw material low in free Asn, which will consequently minimize AA in the final product.
Up to now, several studies showed that cereal species differ in their Asn levels and consequently in their AA formation potential. Rye usually has higher Asn levels compared to wheat and spelt [7,8,17]. Moreover, cultivars can differ considerably in their precursor content as shown by several studies [7,8,17,18,19]. Taeymans et al. [19], which reported a 5-fold range for different European wheat cultivars and Claus et al. [7] found a variability of Asn contents in nine German winter wheat cultivars of up to a factor of three. Postles et al. [18] compared five rye cultivars and found significant differences concluding that there is a genotype control of free Asn. Thus, selecting suitable cultivars with low Asn contents is considered as a feasible way to minimize AA formation potential. However, it has to be taken into account that site-specific and climatic conditions may alter Asn contents considerably [8,17]. Furthermore, crop management practices, such as fungicide applications promoting leaf area duration and delaying senescence, can also reduce the free Asn content in grains [20].
Fertilization is a key measure in crop production to increase yield and quality affecting Asn levels as well. Studies of Weber et al. [21] and Martinek et al. [20] showed that N amount and the timing of application, as well as N form, can affect Asn contents in wheat considerably. Up to now, information about the impact of N supply under organic farming conditions on the level of free Asn has been scarce. Since organic farming systems can only use organic fertilizers whose N release is slow and availability for plants more uncertain than from mineral N fertilizers, the knowledge gained from mineral N fertilization experiments on Asn cannot be transferred directly to organic farming. Preliminary studies of Stockmann et al. [22] reported a cropping system effect, where wheat cultivars grown under organic conditions showed a significantly lower amount of free Asn when compared to conventionally grown wheat cultivars, presumably due to the lower N availability under organic conditions.
Moreover, several studies showed that S deficiency sometimes dramatically increases Asn contents and thus the AA formation potential [23,24,25,26]. Thus, a sufficient S supply is expected to help reduce Asn levels in grains. However, such results were obtained mostly from greenhouse pot experiments under S deficient conditions. Information from field experiments with no explicit induced S deficiency are rare, and no information on the effect of different S fertilizer forms on free Asn is currently available.
Thus, the present study aimed to comparatively investigate the impact of organic and mineral N fertilization (amount, type, and time of application) on the AA precursor Asn under conventional and organic farming conditions. Additionally, the effect of S supply (amount, type and time of application) under varying N fertilization intensities was investigated under field conditions for its impact on the content of free Asn under conventional farming conditions. The following hypotheses were tested:
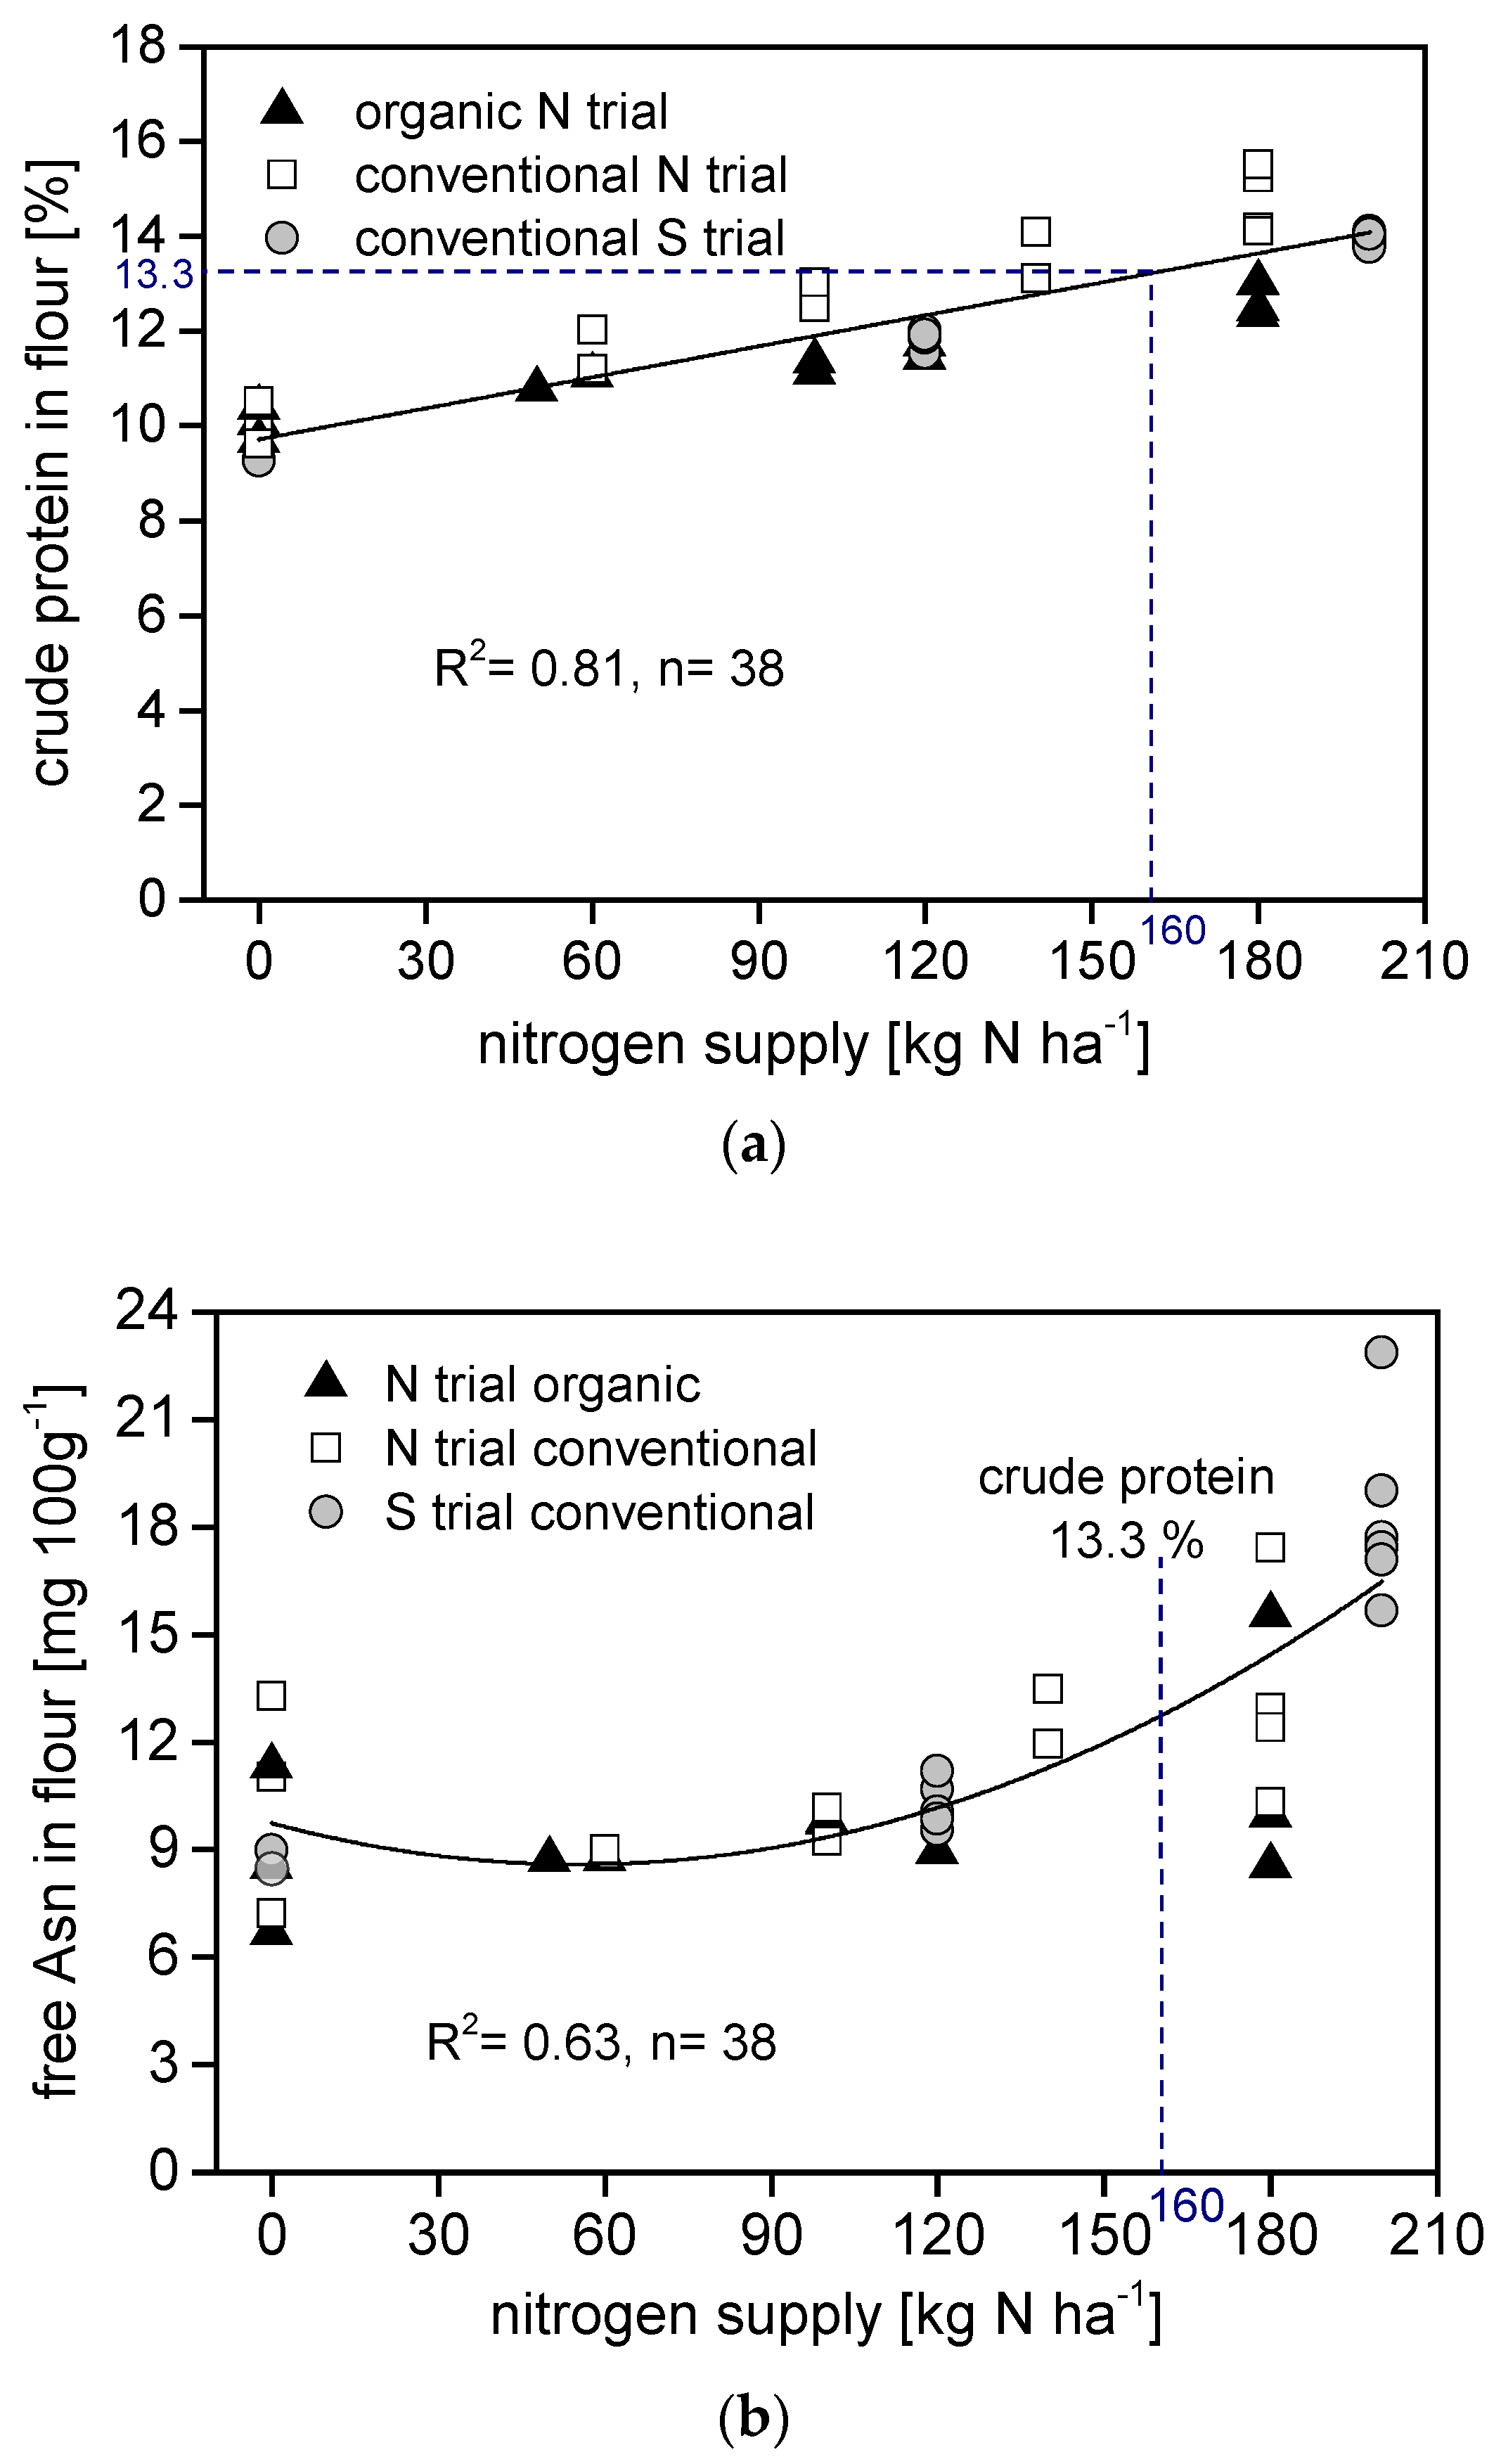
  • The amount and timing of N fertilization affect yield, grain quality, and the content of free Asn in winter wheat, irrespective of its form (organic or mineral).
  • Due to a slower release rate and thus a lower availability of organic N, its effect on grain quality and free Asn is less pronounced compared to the application of mineral N.
  • The type and amount of S fertilizer affect free Asn accumulation in wheat flour, especially under high N amounts.

2. Materials and Methods

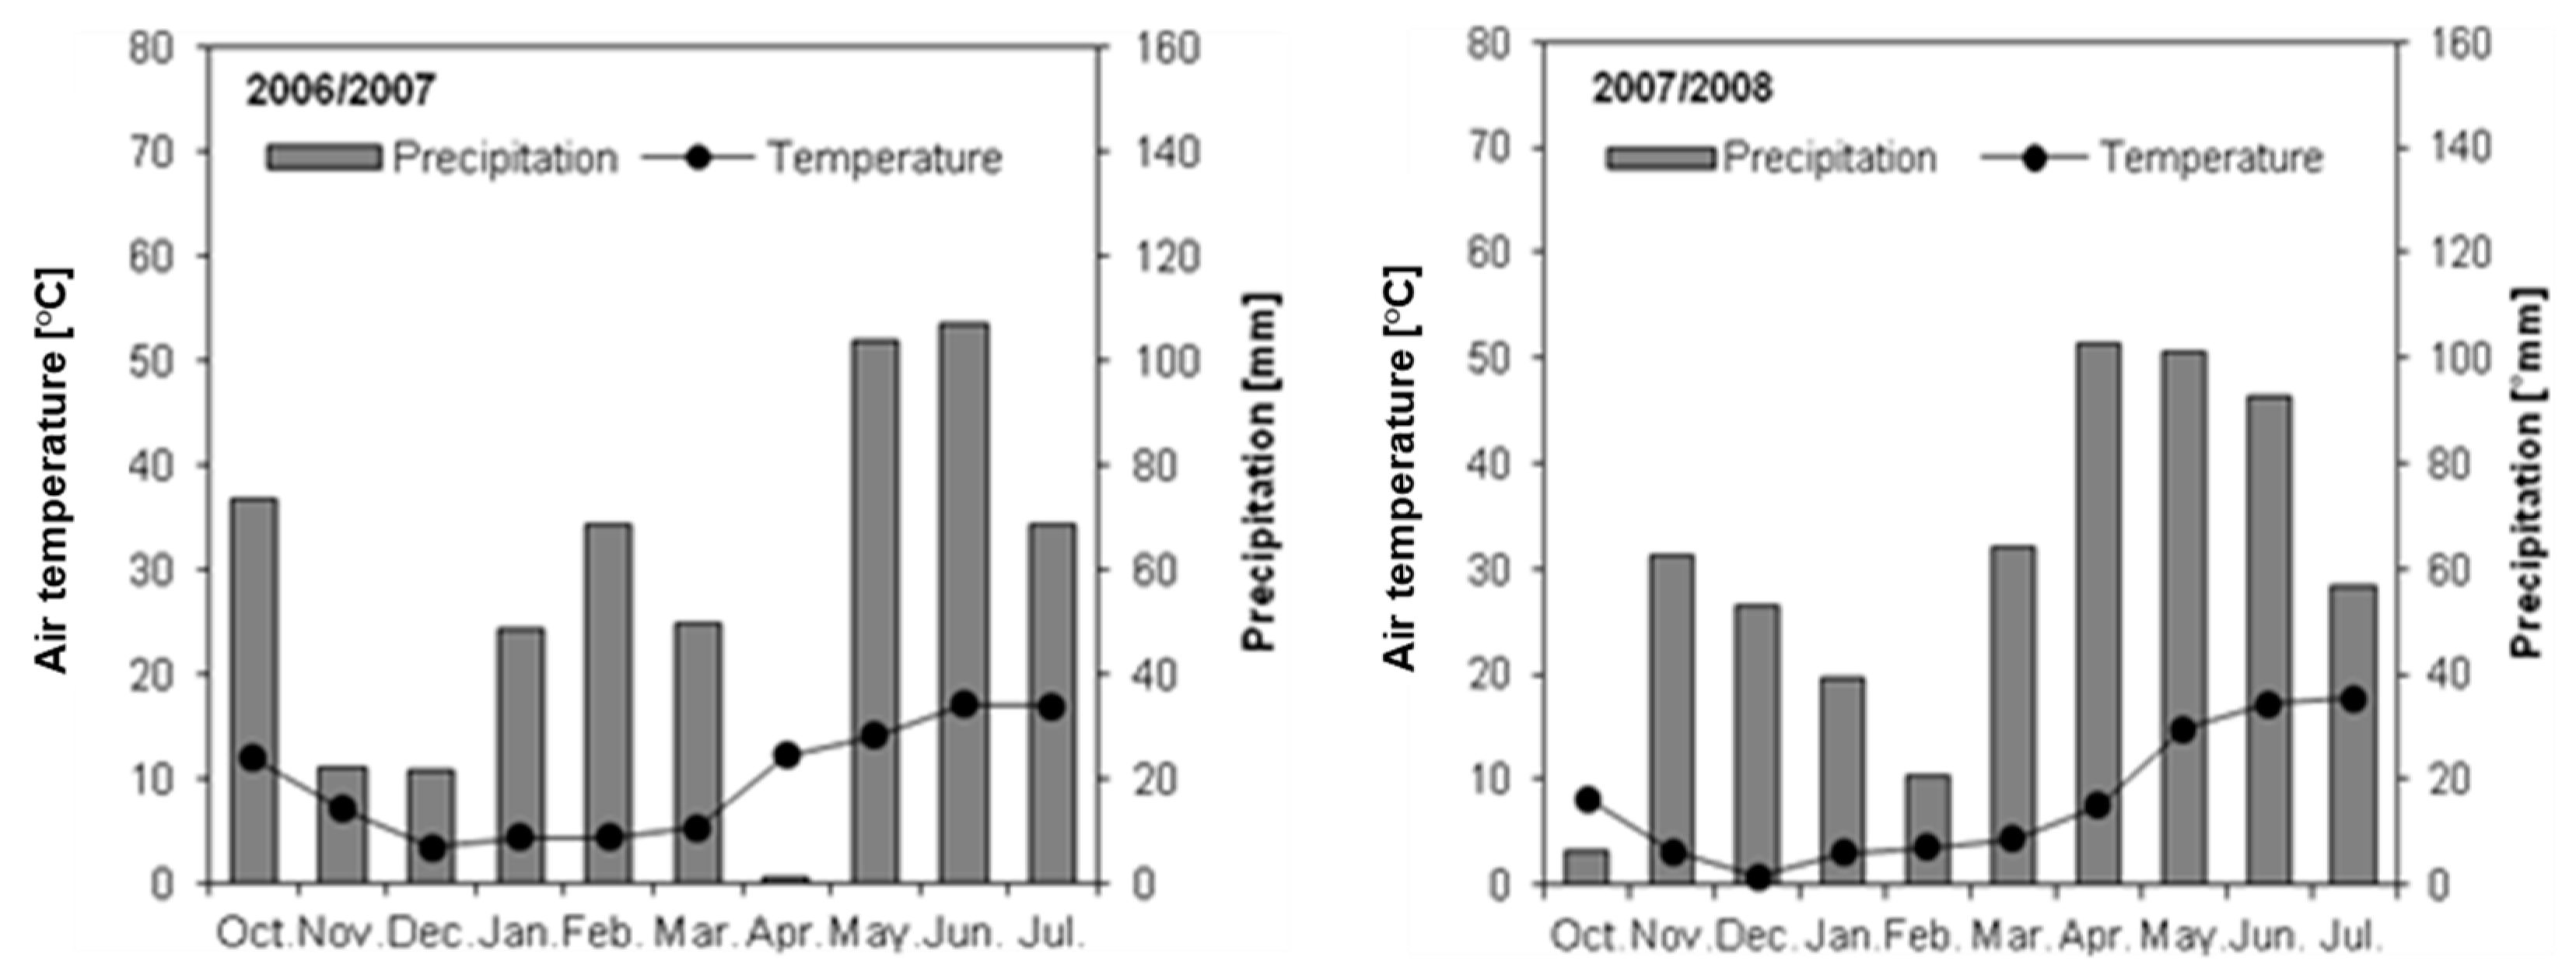
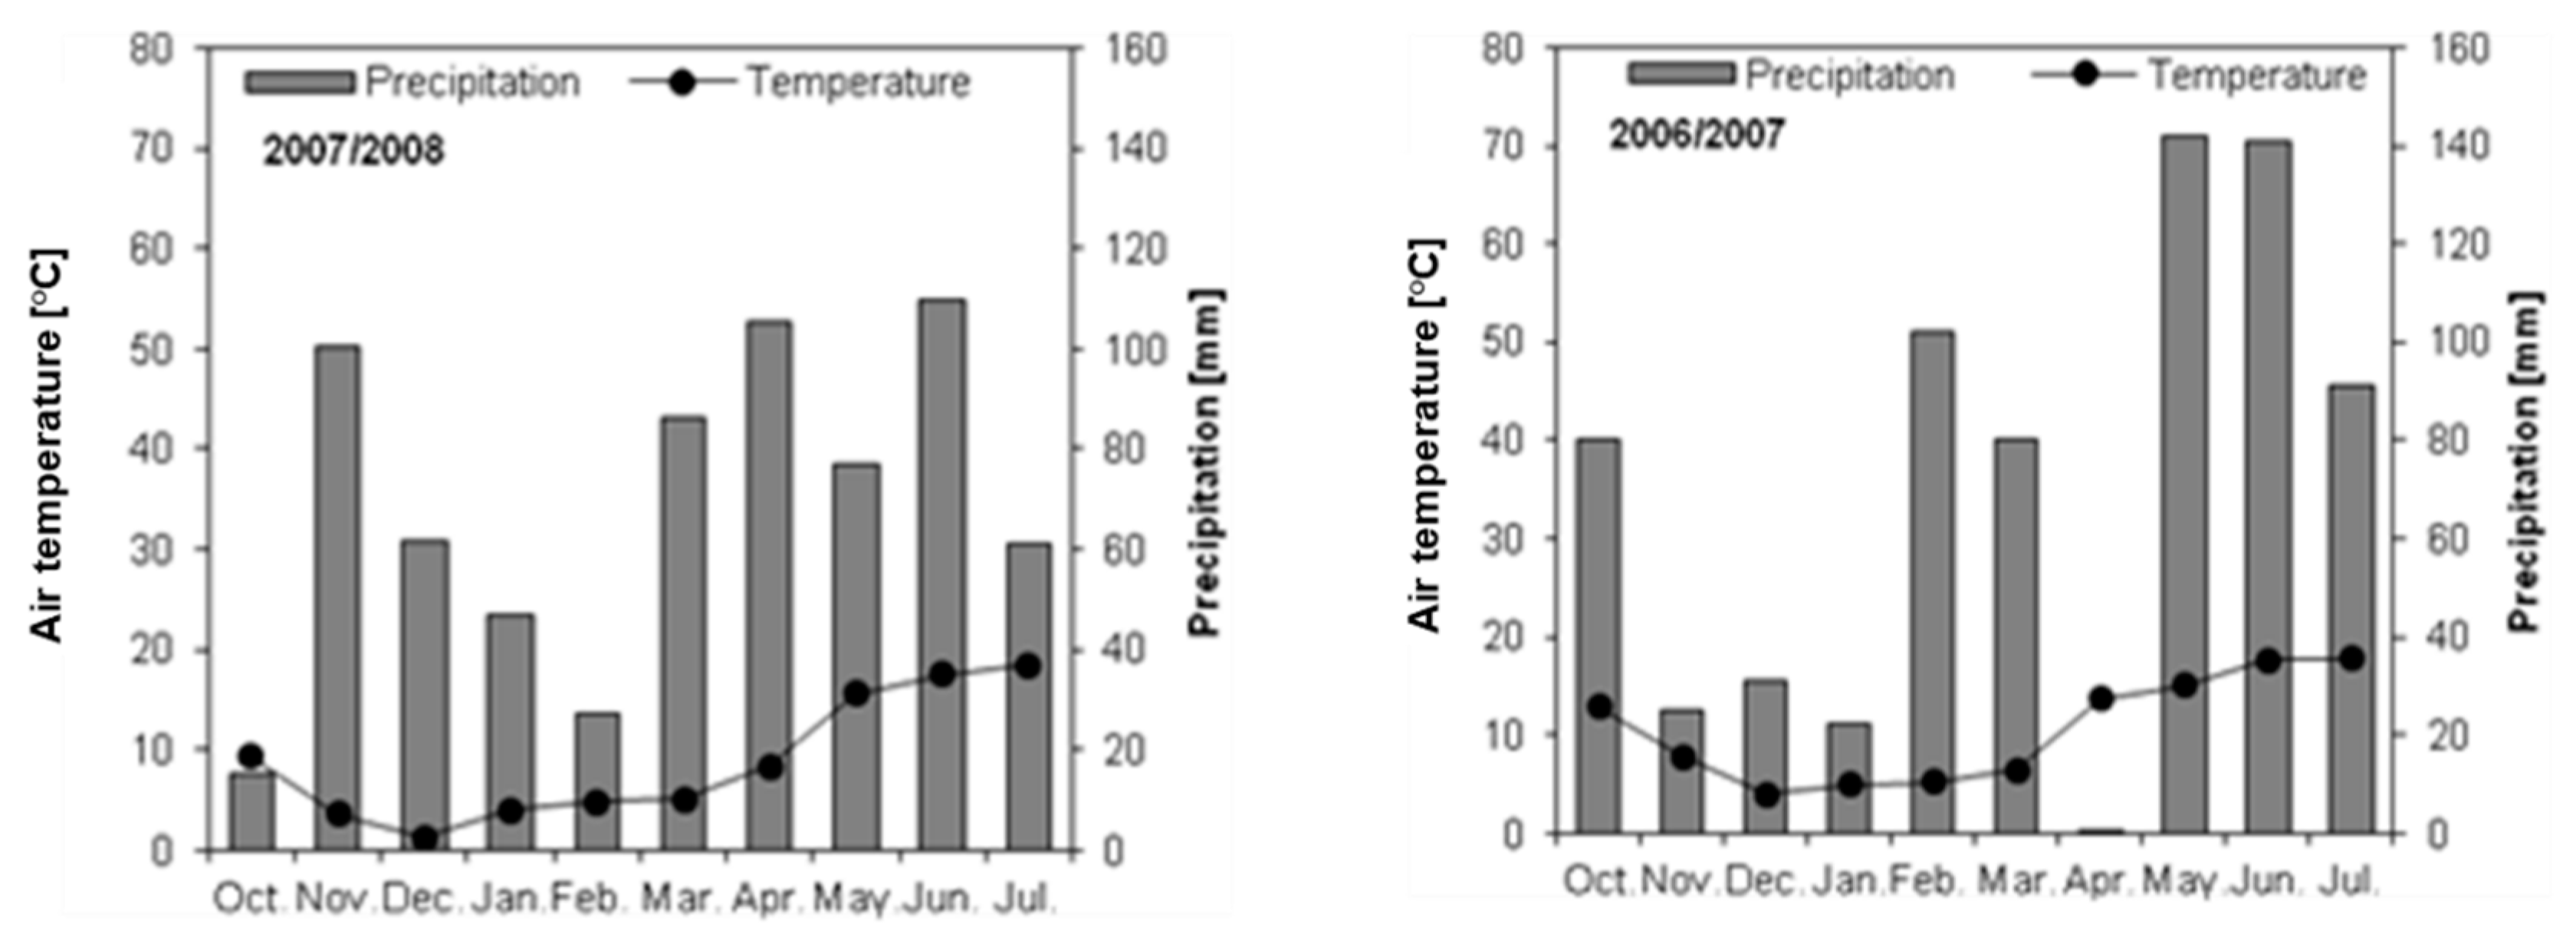
2.1. Site Description

Grain and flour samples were obtained from three field trials during two consecutive growing seasons in 2006/2007 and 2007/2008. All trials were carried out by the Institute of Crop Science, University of Hohenheim. The conventional N and S trials were conducted at Ihinger Hof (conventional farming research station), while the organic N trial was conducted at Kleinhohenheim (organic farming research station).
The conventional research station Ihinger Hof is situated 25 km west of Stuttgart, Germany in the district of Boeblingen (48.74° N, 8.92° E) at an altitude of 450–508 m above sea level. Average air temperature during the growing season from October 1 to July 31 was 9.7 °C in 2006/2007 compared to 8.0 °C in 2007/2008. Total precipitation was 546 mm in 2006/2007 compared to 600 mm in 2007/2008 (Figure 1).
The field trial was carried out on vertic Luvisol (2006–2007) and vertic Cambisol (2007–2008) soils according to the World Reference Base [27]. Those soils provide well drained, highly fertile conditions for wheat production. Soil analyses for mineral N content were taken in spring 2007 and 2008. In 2007, mineral N content was 2.1 kg ha−1 within a soil horizon of 0 to 60 cm compared to 22 kg ha−1 in 2008.
The research station for organic farming, Kleinhohenheim, has 64 ha of farmland, half of which is arable land and the remaining half meadows. It is located 435 m above sea level in the southern peripheral part of Stuttgart, Germany (48.74° N, 9.20° E). The average air temperature from October to July was 10.6 °C in 2006/2007 compared to 8.8 °C in 2007/2008. Precipitation for the growing season of 2006/2007 was 715 mm compared to 691 mm in 2007/2008 (Figure 2).
The soil at the trial site in Kleinhohenheim falls under the Luvisol type. It is characterized by a nearly 2 m thick horizon of loess to loamy clay. Therefore, it features a high water holding capacity and is well suited for agricultural purposes. In spring 2007, mineral N content was 35 kg ha−1 within a soil horizon of 0 to 60 cm compared to 62 kg ha−1 in 2008.

2.2. Experimental Design

Each field trial was set up as a randomized block design with three repetitions. While in the conventional N and S trial, common conventional farming methods, including chemical weed and pest management, were applied, the organic N trial was conducted according to standards of organic farming.

2.2.1. Conventional N Trial

The conventional N trial aimed at determining the impact of both the amount and the temporal distribution of N fertilization on potential AA formation. The total amount of N fertilization given as CAN (calcium ammonium nitrate: 13.5% Nitrate-N, 13.5% Ammonium-N) varied from 0 kg N ha−1 (control plots) to 180 kg N ha−1 and fertilizer was applied on up to five different dates as shown in Table 1. In each treatment, a late N fertilization (Zadoks 49/51, Zadoks 55) application was integrated and marked ‘late’. The same three winter wheat cultivars, as used in the organic trial, were tested. For E-grade cultivar Bussard, eight N treatments plus one untreated control treatment were tested. Cultivar Naturastar (A-grade), as well as Capo (E-grade), were only tested with N 180-late plus 0 kg N ha−1 (control treatment. In this context E-grade and A-grade refers to the German baking quality classification system for wheat cultivars. E- and A-grade wheat cultivars reach the highest baking qualities including high levels of crude protein (12.7% to 13% and higher) and sedimentation values (31–37 units and higher).
In both years, sugar beet was the preceding crop. A few days prior to seeding, plots were tilled with a combination of cultivator and disk harrow (depth of tillage: 15 cm) and the seedbed was prepared with a tine harrow. Seeding was carried out on 12 October in 2006 and on 9 October in 2007 at a seeding density of 350 kernels m−2. Harvest dates were 23 July in 2007 and 28 July in 2008. A plot combine harvester (Hege Maschinen GmbH, Hohebuch, Germany) was used.

2.2.2. Organic N Trial

The organic N trial aimed at determining both the impact of the amount and temporal distribution of N fertilization on potential AA formation. In addition, different types of organic N fertilizer were tested: cattle slurry (1 kg N m−3 total N content, 4% dry matter), horn meal (12% total N content), or a combination of both was used. The total amount of N fertilization varied from 0 kg N ha−1 (control plots) to 180 kg N ha−1. Fertilizer was applied on up to three different dates (see Table 2). Winter wheat cultivars Bussard, Capo, and Naturastar were used. For E-grade cultivar Bussard, seven different N treatments plus one untreated control treatment were tested, whereas in A-grade cultivar Naturastar and E-grade cultivar Capo, one N treatment (180 kg N ha−1) plus the control treatment (0 kg N ha−1) were tested.

2.2.3. Conventional S Trial

Contrary to the aforementioned trials, in the S trial, only the winter wheat cultivar Enorm (E-grade) was tested. The trial aimed at examining the influence of variable amounts, types, and temporal distributions of S fertilization. Total S application varied from 0 kg N ha−1 (control plot) to 60 kg S ha−1. As S fertilizer, kieserite, epsom salt, elemental S, or a combination of kieserite and epsom salt was used. S was applied on four different dates, as detailed in Table 3. N fertilization was also varied in the S trial. Treatments received a total amount of N given as CAN (calcium ammonium nitrate) of either 120 or 200 kg ha−1 while control treatments remained unfertilized.
Plant production was carried out according to common conventional practice. The trial included the same procedures according to plant protection, plant growth regulators, previous crop, soil and seedbed preparation, sowing date, and density as well as harvest procedure and harvest date as described for the conventional N trial.

2.3. Yield

Grain yield of the different trials was determined by weighing the plot yield. Grain samples were dried at 105 °C for 24 h to determine grain moisture. Grain yields given refer to 86% dry matter content.

2.4. Flour

For the determination of grain quality traits, free Asn, and the AA formation potential, grain samples were milled on a laboratory mill (Quadrumat Junior, Brabender, Duisburg, Germany). Ash content of flours was approximately 0.5% of flour DM. Flour moisture was calculated from the weight loss before and after drying approximately 5 g flour at 105 °C for 24 h.

2.5. Crude Protein

Total grain N content was determined by near-infrared spectroscopy (NIRS, NIRS 5000, FOSS GmbH, Rellingen, Germany). Calibration samples were analyzed according to the Dumas Method [29] using a Vario Max CNS analyzer (Elementar, Hanau, Germany). The analyzed final N content was multiplied by a factor of 5.7 to obtain crude protein content.

2.6. Sulfur

Flour samples of the S trial were determined by a CNS elemental analyzer (Vario max CNS, Elementar Analysensysteme GmbH, Hanau, Germany). The values refer to dry mass.

2.7. Zeleny’s Sedimentation Test

Zeleny´s sedimentation test was performed using 3.2 g flour according to ICC standard No. 116. The sedimentation values of the flour were adjusted to 14% moisture basis.

2.8. Free Asparagine

Free amino acids were extracted from 2 g of wheat flour and were mixed with 8 mL of 45% ethanol for 30 min at room temperature. After centrifugation for 10 min at room temperature with 4000 rpm and 10 min at 10 °C and 14000 rpm, the supernatant was filtered through a 0.2 µm syringe filter and poured into vials. Asn analysis was performed using Merck-Hitachi HPLC components. The pre-column derivatization with FMOC [30] was completely automated by means of an injector program. Subsequently, the derivatized Asn was separated on a LiChroCART Superspher RP 8 column (250 × 4 mm, Fa. Merck, Darmstadt) at a constant temperature of 45 °C. The fluorescence intensity of the effluent was measured at the excitation and emission maxima of 263 and 313 nm.

2.9. Acrylamide Formation

The AA formation potential of wheat flour was assessed according to the AA contents of 5 g flour in 250 mL Erlenmeyer flasks after heating in an oven for 10 min at 200 °C. Sample preparation was accomplished according to the test procedure 200L05401 described by Weißhaar [31].
After cooling the samples down to ambient temperature, 100 mL of bidistilled water and 100 µL of D3-Acrylamide were added as an internal standard to the heated flour samples in the Erlenmeyer flasks. In order to completely extract acrylamide from the flour, samples were put in an ultrasonic bath for 10 min at 40 °C. After adding 1 mL of Carrez I and II to each of the samples and shaking the flasks thoroughly, the samples were filtered using folded filter paper to separate the colloids and flour particles from the aqueous solution. Subsequently, samples were cleaned by a solid phase extraction in a vacuum chamber after preconditioning the cartridges with 10 mL of bidistilled water and 10 mL methanol. After sample clean-up, about 1 to 2 mL of the eluate from each sample were filled in autosampler vials and deep frozen (−18 °C) until AA was determined by LC-MS/MS by the CVUA according to the test procedure 201L01301 [32]. The eluates were separated by a graphite or RP18-phase and detected by a tandem-mass spectrometer. Quantification was undertaken by using the isotope-labelled internal standard (D3-Acrylamide).

2.10. Statistical Analyses

For each trait listed in the previous section, analysis of variance (ANOVA) was performed using the procedure PROC MIXED of the statistical software package SAS 9.2 (SAS Institute Inc., Cary, NC, USA). ANOVA was done in two steps: in a first step, the main effects of year, treatment, and interaction were investigated. In a second step, years were analyzed separately for determining potential treatment differences. Thus, letters within the treatment refer to single years. If within the same year treatment was not significant no letters appear. If the treatment was significant, but the interaction and the year were not, years were combined (see Table 4).
In order to ensure normal distribution and equality of variances, the data was transformed where necessary. Means were analyzed for statistically significant differences employing the Tukey range test. As a level of significance, α = 0.05 was chosen.

3. Results and Discussion

3.1. Conventional and Organic N Trials

Grain yield and sedimentation value of conventionally produced cultivar Bussard were significantly influenced by the main effects treatment and year, but the interaction was not significant. Only N treatment affected crude protein content significantly, while free Asn showed significant differences concerning treatment and treatment-year interaction.
Yields were higher in 2007 than in 2008 with an average yield across all N treatments of 6.5 t ha−1 in 2007 and 5.2 t ha−1 in 2008. Yields increased with the applied amount of N and were highest with 6.8 and 7.0 t ha−1 across both years in treatments fertilized with 140 and 180 kg N ha−1, respectively. Nevertheless, the maximum grain yield was reached at an N supply of 140 kg N ha−1: A further increase in N supply did not lead to a further significant increase in grain yield. The treatments with an emphasized late application rate of N showed slightly reduced grain yields compared to their respective counterparts (Table 4). Regarding the influence of total N fertilization independent of their distribution, increases in total N fertilization generally increase grain yield, unless fertilization exceeds a certain maximum [33]. In both trial years, the grain yield results confirmed this assumption. The baking quality increased with increasing N input. The treatment 180 kg N ha−1 with an emphasized late application rate led to the highest crude protein content of 15.2%, which was 5% higher than in the unfertilized control. Similar to the crude protein content, the protein quality assessed by the sedimentation test also increased with increasing N supply and was highest in treatment 180-late with a mean value of 50 mL over both years. The sedimentation values can partially be influenced by the amount and a late N fertilization [34,35]. This was also confirmed in this study, as sedimentation values increased with increasing N contents in the grain. The highest sedimentation values were reached by the highest N supply independent of the cropping system. Free Asn in the flour of cultivar Bussard was less influenced by N supply in 2007 under conventional farming, as the treatments with intensive N application did not show significantly higher Asn values compared to the unfertilized control (about 11.7 mg 100 g−1 flour-DM). However, in 2008, free Asn contents of cultivar Bussard were significantly different when comparing N60-late, N60, and N100-late with N140-late, N180, and N180-late (Table 4). The highest free Asn contents of 17.8 mg 100 g−1 flour-DM were found when N amounts of 180 kg ha−1 were applied in 2008 without a late application rate. Determined values were about 43% higher than the free Asn value of the unfertilized control. Furthermore, the temporal distribution of N fertilization had no significant effect on free Asn levels. Results from Woolfolk et al. [36] stated, that a late foliar application after flowering increased the total N content. They concluded that a late N supply, before or shortly after flowering may significantly enhance grain N content and finally the crude protein amount in winter wheat. Winkler and Schön [37] found an increase of free Asn with increasing grain N concentration in barley. According to those studies, late N fertilization treatments may have led to an increased level of both crude protein and free Asn. However, only a significant increase of crude protein by late fertilization was found; therefore, it is assumed that synthesis of free Asn is genetically determined, and differences between cultivars will occur.
Under organic conditions, grain yield was only significantly influenced by treatment but not by year or treatment-year interaction. Hence, grain yield of cultivar Bussard is displayed combining years 2007 and 2008. Sedimentation value and crude protein content were both significantly influenced by the treatment and year but not by treatment-year interaction. In contrast to the conventional trial, under organic farming conditions free Asn content was only affected by year, but not by N treatment.
The highest grain yields (5.1 t ha−1) were achieved when slurry was applied with amounts of 100 kg N ha−1. The achieved grain yields were about 20% higher than the unfertilized control. The application of horn meal solely; however, did not increase grain yield significantly. This suggests that the mineralization of horn meal was slow, leading to late N availability. The high sedimentation value and crude protein content also indicated a late N availability.
Sedimentation value and crude protein content were lower in 2007 than in 2008 (34 compared to 44 units and 10.6% compared to 12.0%). Sedimentation values of the treatments S50, S50-H50 and H60 did not significantly differ from the control treatment while the treatments S100, S100-H20, H120, and H180 increased the sedimentation value significantly compared to the unfertilized control. The highest sedimentation value of 47 units was found when 180 kg horn meal ha−1 was applied. Compared to the unfertilized control, crude protein content increased significantly by about 1 to 2.9% if cv. Bussard was fertilized with N except for the application of 50 kg N ha−1 given as slurry. An amount of 180 kg N ha−1 horn meal led to the highest crude protein content of 13%, which was about 23% higher than the unfertilized control. For flour of organic origin, a lower baking quality is accepted. To reach a good baking quality, Brunner [38] recommends a sedimentation value of 34 units and a crude protein content of 11.6%. Regarding our results, all treatments exceeded the suggested sedimentation value, while only treatments S100-H20 and H180 achieved the values for crude protein. However, a clear year effect was observed in this study as previously found by other authors for durum wheat [39,40]. Specifically, in this study, significantly lower sedimentation values and crude protein values in 2007 compared to 2008 may be attributed to a higher N leaching-caused by the higher rainfall amount from May to July in 2007 (about 370 vs. 260 mm).
If organically produced bakery goods are demanded, lower yields and lower baking qualities must be accepted [41]. Bread bakery processing has to be adjusted to the lower protein contents of such flour [42] to achieve acceptable products.
Free Asn contents were higher in 2007 (11%) than in 2008 (7.5%) and tended to increase with increasing amounts of N from 8.5 to 10 mg 100 g−1, however, no statistically significant difference could be found.
When comparing the free Asn contents of the three winter wheat cultivars dependent on N supply (unfertilized control vs. 180 kg N ha−1), year, N treatment, cultivar, and the interaction year-nitrogen was significant under conventional farming, while N treatment, cultivar, and the interaction year-cultivar were significant under organic farming (Table 5).
The three conventionally cropped winter wheat cultivars differed in their capacity to store free Asn in the flour, with Capo showing the lowest value of 6.8 mg 100 g−1, followed by Bussard with 10.3 mg 100 g−1, across years and N treatments (Table 6). Cultivar Naturastar reached the highest level of free Asn (17.42 mg 100 g−1). Also, the application of organic N increased free Asn contents in flour when averaged across years and cultivars. Cultivars differed in the same ascending order under organic conditions as under conventional conditions, with Capo having a free Asn content of 6.5 mg 100 g−1, Bussard 7.2 mg 100 g−1, and Naturastar 11.3 mg 100 g−1 flour-DM averaged across years and N treatments. Though Bussard and Naturastar had a slight trend to produce less free Asn in 2008 compared to 2007 if organically grown and under N supply, Capo had a slightly higher free Asn content of about 2.5 mg 100 g−1 in 2007 compared to 2008 if N was applied. In contrast, if cultivars grow under conventional farming conditions all three cultivars had in 2008 a higher level of free Asn. Thus, besides the year the cropping system seems to effect free Asn formation.
Finally, across years, N treatments and cropping systems cultivar Capo was found to exhibit the lowest free Asn level by up to 22% lower amounts when compared to Bussard and 42% when compared to Naturastar. When comparing the same N treatments, significant differences between cultivars were also found by Weber et al. [21]. Stockmann et al. [43] found a reduction potential of free Asn of around 60% for wheat cultivars grown under organic cropping terms. Postles et al. [18] analyzed a significant increase in free Asn by up to 29% if tested rye cultivars were supplied with 200 kg N ha−1 compared to 1 kg N ha−1. Nevertheless, they reported, that independent of N supply differences between cultivars in free Asn was not affected by N nutrition. Thus, combining cropping practices like N fertilization and choosing cultivars including a low potential to form free Asn will more effectively reduce free Asn than applying single measurements.
When pooling the means of free Asn values from the three field trials across both experimental years and correlating them with the N supply, a clear trend of increasing free Asn levels with an intensified N supply was obvious (Figure 3). Contrary to a linear effect of increasing N amounts on crude protein content, the effect on free Asn followed a more quadratic function with moderate free Asn levels up to N amounts of 140 kg N ha−1. Amounts of 180 kg N ha−1 or higher increased the probability of high free Asn contents considerably, while N supply below that amount led to free Asn values that did not differ considerably from the unfertilized controls. Similar findings were described by Weber et al. [21] investigating one E-wheat cultivar (Enorm). They achieved an increase in free Asn by raising the level of N at different steps. Depending on the year, they found a significantly higher amount of free Asn at a level of 140 kg N ha−1. According to the German Bundessortenamt, high baking quality can be expected from wheat lots (conventionally cropped) with crude protein contents of 13.3% or higher. According to the regression line, this critical crude protein content was met already with N amounts of 160 kg N ha−1 in the experimental years. In order not to exceed N supply, farmers are encouraged to carefully choose the amount of N as baking quality will not be affected negatively.
The overall correlation between crude protein and free Asn was relatively weak (Figure 4), due to the fact that mean values of different cultivars and different trials were pooled. However, it was clear that considerably increased free Asn contents were found primarily if crude protein contents were 14% or higher. Also, a high scattering of free Asn, especially within untreated control without N supply and 180 kg N ha−1, was present. Thus, it has to be considered that environment (=location and year) can affect free Asn levels considerably, as also shown by Curtis et al. [17] for wheat and by Curtis et al. [8] for rye. There is now clear evidence that free Asn accumulates in most, if not all, plant organs during periods of low rates of protein synthesis and a plentiful supply of reduced nitrogen [44]. However, up to now information on how and why soil type, temperature, and precipitation affect grain Asn accumulation is missing. Corol et al. [45] stated that especially during grain development low rainfall and high temperatures increased free Asn amount in grain. This has to be taken into account when interpreting our data, as the climate conditions during 2007 and 2008 could have had an impact.
In addition, a poor relation of crude protein and free Asn was found for both N trials, whereas the conventional S trial showed a good correlation for both traits (R2 0.71). This means that a higher amount of crude protein may lead to higher levels of free Asn. Corol et al. [45] correlated free Asn with different quality traits of wheat wholemeal, and the closest relation was found for free Asn and protein content (r = 0.507). Marschner [46] reported an increase of amides if N fertilization was increased. Similar results concerning soluble N were reported by Gianibelli and Sarandon [47]. Acknowledging that S fertilization had no effect on the level of free Asn, the increase in both crude protein and free Asn was mainly due to the high N treatment of 200 kg N ha−1. Therefore, this high N supply could have led to an accumulation of soluble N, mainly as free Asn.
In addition to environmental conditions and N treatments, the cropping system also had an impact on free Asn (different symbols in Figure 3). Across N treatments and cultivars, organically treated samples (black triangles) showed up to 18% lower free Asn compared to conventional farming. While for single cultivars, a reduction of 23% was possible by choosing organically grown cultivars. This may favour the assumption that the level of free Asn is generally lower in organic farming systems due to a lower N supply. This is in agreement with studies of Stockmann et al. [22], who realized a significant reduction potential of free Asn (up to 30%) if wheat cultivars were grown under organic farming conditions.

3.2. Conventional S trial

Grain yield, crude protein, and sedimentation values were significantly influenced by treatment and year, but not by the interaction of both. Free Asn content was significantly influenced by the treatment and year-treatment interaction, but not by year. Since S level of flour samples was only influenced significantly by treatment, it is given as mean of both years.
Independent of S and N treatment, grain yield in 2007 ranged from 4.2 to 7.5 t ha−1 and from 4.3 to 7.5 t ha−1 in 2008 (Table 7). While N application led to a significant yield increase, S supply did not change grain yield significantly. Similar results were found by Pompa et al. [48] and Rossini et al. [40], where the effect of a foliar S supply was tested and no significant effect on grain yield was found.
Randall et al. [49] and Luo et al. [35] recommended that plants did not suffer from S deficiency if grain S concentration is higher than 0.12% and N/S ratios in grains are below 17:1. All grain S concentrations analyzed in this trial, including the control treatments, exceeded 0.12% (Table 7) and the N/S ratio was below 17:1. Thus, it can be assumed that no S deficiency occurred. In addition, Dai et al. [50] reported that the time of S availability is important as sufficient S supply, especially during grain filling, will invert high levels of free Asn. It can be assumed that in our trial soil S availability during grain filling was sufficient.
Crude protein contents ranged from 9.6% to 14.6% in 2007 while in 2008 it was significantly lower, ranging from 8.5% to 13.9% (Table 7). N fertilization levels of 200 kg ha−1 resulted in significantly higher crude protein contents of around 14%. Comparing type and amount of S fertilization within the same N amount applied, only a significant impact on crude protein was found for K20-N2 and elS-N2. The S content of flour samples varied from 0.13% to 0.19% across years (Table 7). All treatments except treatment KEp26-N1 produced significantly higher S contents than both control treatments. Consistent effects were found neither for the type nor for the amount of S supply.
The analysis of flour concerning free Asn showed means varying from 6.9 to 21.9 mg 100 g−1 in 2007 while in 2008 means ranged from 9.3 to 23.8 mg 100 g−1 (Table 7). The S supply had no influence on free Asn et al.
Weber et al. [51] investigated the effect of S fertilizer kieserite and an additional N supply of 180 kg ha−1 and found similar results. They concluded that an additional S application for lowering free Asn is not constructive if the S amount within the soil is sufficient. Nevertheless, if soils are poor in S, free Asn level can increase dramatically. This was revealed by Muttucumaru et al. [25], who showed that free Asn content in wheat grain increased up to 30 times under S deficiency. Similar results were reported by Granvogl et al. [24] from a greenhouse experiment with a summer wheat cultivar. They found a high increase of free Asn in flour of S poor wheat, which finally revealed the AA formation strongly. However, it might be a cereal species influenced output as Postles et al. [18] reported that there was no effect of S increasing free Asn in grain samples of five rye cultivars. Thus, it seems that S fertilization is more linked to protein-rich cereal species above all wheat, where S is needed to form storage proteins, not accumulating free Asn. Köhler et al. [52] and Shewry et al. [26] postulated that storage protein composition changes if S availability is limited, due to a limited formation of S rich protein fractions. They concluded that this leads to an increase of protein fractions low in S and boosts the amount of N structures, e.g., aspartic acid and free Asn. Besides those results, the working group of Postles et al. [18] also stated that S supply could minimize the effect of high N availability on free Asn formation. They found two cultivars which showed a reduced level of free Asn if high N was available and S was applied. Curties et al. [53] reported that in case of S supply the level of free Asn was less influenced by year and the cultivar was more stable in producing free Asn amounts. In our study, similar effects of S on free Asn formation were not found. There was no clear reduction effect of S comparing N1 with 100 kg N ha−1 and N2 with 200 kg N ha−1 within the single S treatments. However, one needs to keep in mind that, in our study, N was not applied without S. Maybe a treatment of N1 (100 kg N ha−1) and N2 (200 kg N ha−1) without an S application could have revealed other results. Nevertheless, most studies concerning the effect of S on free Asn formation were carried out as pot trials, including soils poor in S as well as field trials where S was deficient [24,25].

4. Conclusions

The scope of this paper was to examine the impact of N and S supply in organic and conventional wheat cropping systems with regard to their potential for AA minimization. Grain and flour samples from three different field trials, which had been carried out for two consecutive growing seasons, were analyzed. In addition to AA, free Asn, grain yield, and grain quality, with a focus on baking quality, were determined. The results of this study strongly suggest that crop- and agronomy-based studies could provide a significant contribution in reducing the levels of acrylamide in processed foods by lowering the relevant precursors in the raw material. N fertilization, significantly influenced grain yield, and baking quality in both cropping systems. Particularly within organic farming, an increased N treatment did not enhance free Asn, but baking quality could be influenced positively. The late N fertilization step within the conventional N trial significantly increased crude protein content, while for free Asn no clear effect was found. Furthermore, neither type nor amount of S fertilization influenced free Asn significantly. That suggests that on soils, which are not deficient in S, an additional S supply will not affect free Asn formation.
For free Asn, a clear impact of cultivars was shown. Capo was found to exhibit the lowest AA formation potential over the treatments 0 and 180 kg N ha−1. Interestingly, this cultivar reached a high crude protein (15% if conventionally cropped and 12.5% if organically cropped) at an N supply of 180 kg N ha−1, but at the same time the lowest level of free Asn. This leads to the assumption that cultivars differ in their genetic potential to form free Asn under increased N supply. Thus, concerning new wheat cultivars, the potential of forming low free Asn amounts accompanied by a good baking quality should be part of breeding programs. Overall, determination of the factors and mechanisms that influence free Asn accumulation may ultimately be manipulated to give safer food products to consumers. Therefore, acrylamide in food is an agronomic as well as a food science issue, and agronomists, breeders, and farmers must be engaged in addressing it.

Author Contributions

Conceptualization, F.S., E.A.W., W.C. and S.G.-H.; Methodology, F.S. and E.A.W.; Formal Analysis, F.S.; Investigation, F.S., N.M. and P.S.; Resources, W.C.; Data Curation, F.S. and E.A.W.; Writing-Original Draft Preparation, F.S.; Writing-Review & Editing, E.A.W. and S.G.-H.; Visualization, F.S.; Supervision, S.G.-H. and W.C.; Funding Acquisition, F.S. Please turn to the CRediT taxonomy for the term explanation.

Funding

This research was funded by a scholarship to Falko Stockmann by the Faculty of Agricultural Sciences of the University of Hohenheim.

Acknowledgments

The authors would like to thank the technical staff of the experimental station “Ihinger Hof” and “Kleinhohenheim” for the agronomic management of the field trials.

Conflicts of Interest

The authors declare no conflict of interest. The funders had no role in the design of the study; in the collection, analyses, or interpretation of data; in the writing of the manuscript, and in the decision to publish the results.

References

  1. Commission Regulation (EU) 2017/2158. Establishing mitigation measures and benchmark levels for the reduction of the presence as acrylamide in food. J. Eur. Union 2017, 60, 24–44. [Google Scholar]
  2. Delatour, T.; Perisset, A.; Goldmann, T. Improved sample preparation to determine acrylamide in difficult matrixes such as chocolate powder, cocoa, and coffee by liquid chromatography tandem mass spectrometry. J. Agric. Food Chem. 2004, 52, 4625–4639. [Google Scholar] [CrossRef] [PubMed]
  3. Mottram, D.S.; Wedzicha, B.L.; Dodson, A.T. Acrylamide is formed in the Maillard reaction. Nature 2002, 419, 448–449. [Google Scholar] [CrossRef] [PubMed]
  4. Stadler, R.H.; Blank, I.; Varga, N.; Robert, F.; Hau, J.; Guy, P.A.; Robert, M.C.; Riediker, S. Acrylamide from Maillard reaction products. Nature 2002, 419, 449–450. [Google Scholar] [CrossRef] [PubMed]
  5. Tareke, E.; Rydberg, P.; Karlsson, P.; Eriksson, S.; Törnqvist, M. Analysis of acrylamide, a carcinogen formed in heated foodstuffs. J. Agric. Food Chem. 2002, 50, 4998–5006. [Google Scholar] [CrossRef] [PubMed]
  6. Amrein, T.M.; Schönbächler, B.; Rohner, F.; Lukac, H.; Schneider, H.; Keiser, A.; Escher, F.; Amadò, R. Potential for acrylamide formation in potatoes: Data from the 2003 harvest. Eur. Food Res. Technol. 2004, 219, 572–578. [Google Scholar] [CrossRef]
  7. Claus, A.; Schreiter, P.; Weber, A.; Graeff, S.; Herrmann, W.; Claupein, W.; Schieber, A.; Carle, R. Influence of Agronomic Factors and Extraction Rate on the Acrylamide Contents in Yeast-Leavened Breads. J. Agric. Food Chem. 2006, 54, 8968–8976. [Google Scholar] [CrossRef] [PubMed]
  8. Curtis, T.Y.; Powers, S.J.; Balagianis, D.; Elmore, J.S.; Mottram, D.; Parry, M.A.J.; Rakszegi, M.; Bedo, Z.; Shewry, P.R.; Halford, N.G. Free Amino Acids and Sugars in Rye Grain: Implications for Acrylamide Formation. J. Agric. Food Chem. 2010, 57, 1013–1021. [Google Scholar] [CrossRef] [PubMed]
  9. Surdyk, N.; Rose’n, J.; Andersson, R.; Åman, P. Effects of asparagine, fructose, and baking conditions on acrylamide content in yeast-leavened wheat bread. J. Agric. Food Chem. 2004, 52, 2047–2051. [Google Scholar] [CrossRef] [PubMed]
  10. Claus, A.; Carle, R.; Schieber, A. Acrylamide in cereal products: A review. J. Cereal Sci. 2008, 47, 118–133. [Google Scholar] [CrossRef]
  11. European Food Safety Authority. Results on Acrylamide levels in food from monitoring yeas 2007–2009 and exposure assessment. EFSA J. 2011, 9, 2133. [Google Scholar] [CrossRef]
  12. Brathen, E.; Knutsen, S. Effect of temperature and time on the formation of acrylamide in starch–based and cereal model systems, flat breads and bread. Food Chem. 2005, 92, 693–700. [Google Scholar] [CrossRef]
  13. Ciesarova, Z.; Kukurova, K.; Bednarikova, A.; Morales, F.J. Effect of heat treatment and dough formulation on the formation of Maillard reaction products in fine bakery products—Benefits and weak points. J. Food Nutr. Res. 2009, 48, 20–30. [Google Scholar]
  14. Springer, M.; Fischer, T.; Lehrack, A.; Freund, W. Acrylamidbildung in Backwaren. Getreide Mehl Brot 2003, 57, 274–278. [Google Scholar]
  15. Capuano, E.; Ferrigno, A.; Acampa, I.; Serpen, A.; Acar, Ö.C.; Gökmen, V.; Fogliano, V. Effect of flour type on Maillard reaction and acrylamide formation during toasting of bread crisp model systems and mitigation strategies. Food Res. Int. 2009, 42, 1295–1302. [Google Scholar] [CrossRef]
  16. Yuan, Y.; Shu, C.; Zhou, B.; Qi, X.; Xiang, J. Impact of selected additives on acrylamide formation in asparagine/sugar Maillard model systems. Food Res. Int. 2010, 44, 449–455. [Google Scholar] [CrossRef]
  17. Curtis, T.Y.; Muttucumaru, N.; Shewry, P.R.; Parry, M.A.J.; Powers, S.J.; Elmore, J.S.; Mottram, D.S.; Hook, S.; Halford, N.G. Effects of Genotype and Environment on Free Amino Acid Levels in Wheat Grain: Implications for Acrylamide Formation during Processing. J. Agric. Food Chem. 2009, 57, 1013–1021. [Google Scholar] [CrossRef] [PubMed]
  18. Postles, J.; Powers, S.J.; Elmore, J.S.; Mottram, D.S.; Halford, N.G. Effects of variety and nutrient availability on the acramamide-forming potential of rye grain. J. Cereal Sci. 2013, 57, 463–470. [Google Scholar] [CrossRef] [PubMed]
  19. Taeymans, D.; Wood, J.; Ashby, P.; Blank, I.; Studer, A.; Stadler, R.H.; Gondé, P.; Van Eijck, P.; Lalljie, S.; Lingnert, H.; et al. A review of acrylamide: An industry perspective on research, analysis, formation, and control. Crit. Rev. Food Sci. Nutr. 2004, 44, 323–347. [Google Scholar] [CrossRef] [PubMed]
  20. Martinek, P.; Klem, K.; Vánová, M.; Bartácková, V.; Vecerková, L.; Bucher, P.; Hajslová, J. Effects of nitrogen nutrition, fungicide treatment and wheat genotype on free asparagine and reducing sugars content as precursors of acrylamide formation in bread. Plant Soil Environ. 2009, 55, 187–195. [Google Scholar] [CrossRef] [Green Version]
  21. Weber, E.A.; Graeff, S.; Koller, W.D.; Hermann, W.; Merkt, N.; Claupein, W. Impact of nitrogen amount and timing on the potential of acrlyamide formation in winter wheat (Triticum aestivum L.). Field Crop Res. 2008, 106, 44–52. [Google Scholar] [CrossRef]
  22. Stockmann, F.; Weber, E.A.; Graeff, S.; Claupein, W. Influence of cropping systems on the potential formation of acrylamide in different cultivars of wheat. In Proceedings of the 16th IFOAM Organic World Congress, Modena, Italy, 16–20 June 2008. [Google Scholar]
  23. Elmore, J.S.; Parker, J.K.; Halford, N.G.; Muttucumaru, N.; Mottram, D.S. Effects of Plant Sulfur Nutrition on Acrylamide and Aroma Compounds in Cooked Wheat. J. Agric. Food Chem. 2008, 56, 6173–6179. [Google Scholar] [CrossRef] [PubMed]
  24. Granvogl, M.; Wiesner, H.; Koehler, P.; Von Tucher, S.; Schieberle, P. Influence of Sulfur Fertilization on the Amounts of Free Amino Acids in Wheat. Correlation with Baking Properties as well as with 3-Aminopropionamide and Acrylamide Generation during Baking. J. Agric. Food Chem. 2007, 55, 4271–4277. [Google Scholar] [CrossRef] [PubMed]
  25. Muttucumaru, N.; Halford, N.G.; Elmore, J.S.; Dodson, A.T.; Parry, M.; Shewry, P.R.; Mottram, D.S. Formation of High Levels of Acrylamide during the Processing of Flour Derived from Sulfate-Deprived Wheat. J. Agric. Food Chem. 2006, 54, 8951–8955. [Google Scholar] [CrossRef] [PubMed]
  26. Shewry, P.R.; Zhao, F.J.; Gowa, G.B.; Hawkins, N.D.; Ward, J.L.; Beale, M.H.; Halford, N.G.; Parry, M.A.; Abécassis, J. Sulfur nutrition differentially affects the distribution of asparagine in wheat grain. J. Cereal Sci. 2009, 50, 407–409. [Google Scholar] [CrossRef]
  27. IUSS Working Group WRB. World Reference Base for Soil Resources 2006, First Update 2007. In World Soil Resources Reports No. 103; FAO: Rome, Italy, 2007. [Google Scholar]
  28. Zadoks, J.C.; Chang, T.T.; Konzak, C.F. A decimal code for growth stages of cereals. Weed Res. 1974, 14, 415–421. [Google Scholar] [CrossRef]
  29. Dumas, A. Stickstoffbestimmung Nach Dumas. Die Praxis des org. Chemikers, 41th ed.; Schrag: Nürnberg, Germany, 1962. [Google Scholar]
  30. Lüpke, M. Entwicklung und Anwendung von Reagenzien und Verfahren zur achiralen und chiralen Analytik von Aminosäuren mittels GC und HPLC. Ph.D. Thesis, Universität Hohenheim, Stuttgart, Germany, 1996. [Google Scholar]
  31. Weisshaar, R. Bestimmung von Acrylamid in Lebensmitteln, Aufarbeitungsverfahren für die LC-MS-MS. Prüfverfahren: 200L05401; Chemisches und Veterinäruntersuchungsamt Stuttgart: Fellbach, Germany, 2003.
  32. Weisshaar, R. Bestimmung von Acrylamid in Lebensmitteln, Prüfverfahren: 201L01301; Chemisches und Veterinäruntersuchungsamt Stuttgart: Fellbach, Germany, 2003.
  33. Ellen, J.; Spiertz, J.H.J. Effects of rate and timing of nitrogen dressings on grain yield formation of winter wheat (T. aestivum L.). Fertil. Res. 1980, 1, 177–190. [Google Scholar] [CrossRef]
  34. Ercoli, L.; Lulli, L.; Arduini, I.; Mariotti, M.; Masoni, A. Durum wheat grain yield and quality as affected by S rate under Mediterranean conditions. Eur. J. Agron. 2011, 35, 63–70. [Google Scholar] [CrossRef] [Green Version]
  35. Luo, C.; Branlard, G.; Griffin, W.B.; McNeil, D.L. The effect of nitrogen and sulphur fertilisation and their interaction with genotype on wheat glutenins and quality parameters. J. Cereal Sci. 2000, 31, 185–194. [Google Scholar] [CrossRef]
  36. Woolfolk, C.W.; Raun, W.R.; Johnson, G.V.; Thomason, W.E.; Mullen, R.W.; Wynn, K.J.; Freeman, K.W. Influence of Late-Season Foliar Nitrogen Applications on Yield and Grain Nitrogen in Winter Wheat Contrib. from the Oklahoma. Agric. Exp. Stn. Agron. J. 2002, 94, 429–434. [Google Scholar] [CrossRef]
  37. Winkler, U.; Schön, W.J. Amino acid composition of the kernel proteins in barley resulting from nitrogen fertilization at different stages of development. J. Agronomy Crop Sci. 1980, 149, 503–512. [Google Scholar]
  38. Brunner, B. Qualität von Ökobrotgetreide weiter verbessern. Ökologie Landbau 2001, 121, 35–37. [Google Scholar]
  39. Garrido-Lestache, E.; López-Bellido, R.J.; López-Bellido, L. Durum wheat quality under Mediterranean conditions as affected by N rate, timing and splitting, N form and S fertilization. Eur. J. Agron. 2005, 23, 265–278. [Google Scholar] [CrossRef]
  40. Rossini, F.; Provenzano, M.E.; Sestili, F.; Ruggeri, R. Synergistic Effect of Sulfur and Nitrogen in the Organic and Mineral Fertilization of Durum Wheat: Grain Yield and Quality Traits in the Mediterranean Environment. Agronomy 2018, 8, 189. [Google Scholar] [CrossRef]
  41. Gooding, M.J.; Davies, W.P.; Thompson, A.J.; Smith, S.P. The challenge of achieving breadmaking quality in organic and low input wheat in the UK—A review. Aspects Appl. Biol. 1993, 36, 189–198. [Google Scholar]
  42. Haglund, A.; Johansson, L.; Dahlstedt, L. Sensory evaluation of wholemeal bread from ecologically and conventionally grown wheat. J. Cereal Sci. 1998, 27, 199–207. [Google Scholar] [CrossRef]
  43. Stockmann, F.; Mast, B.; Graeff, S.; Claupein, W. Acrylamid-Bildungspotenzial ökologisch erzeugter Getreidearten und Sorten. In Werte–Wege–Wirkungen: Biolandbau im Spannungsfeld zwischen Ernährungssicherung, Markt und Klimawandel, Proceedings of the 10. Wissenschaftstagung Ökologischer Landbau, ETH Zürich, Switzerland, 11–13 Februar 2009; Mayer, J., Alföldi, T., Leiber, F., Dubois, D., Fried, P., Heckendorn, F., Hillmann, E., Klocke, P., Lüscher, A., Riedel, S., et al., Eds.; Verlag Dr. Köster: Berlin, Germany, 2009. [Google Scholar]
  44. Lea, P.J.; Sodek, L.; Parry, M.A.J.; Shewry, P.R.; Halford, N.G. Asparagine in Plants. Ann. Appl. Biol. 2006, 150, 1–26. [Google Scholar] [CrossRef]
  45. Corol, D.I.; Ravel, C.; Rakszegi, M.; Charmet, G.; Bedo, Z.; Beale, M.H.; Shewry, P.R.; Ward, J.L. 1H-NMR screening for the high-throughput determination of genotype and environmental effects on the content of asparagine in wheat grain. Plant Biotechnol. J. 2016, 14, 128–139. [Google Scholar] [CrossRef] [PubMed]
  46. Marschner, H. Mineral Nutrition of Higher Plants, 2nd ed.; Academic Press: London, UK, 1995; ISBN 978-0-12-473542-2. [Google Scholar]
  47. Gianibelli, M.C.; Sarandon, S.J. Effect of late nitrogen fertilization on the gluten content and technological quality of bread wheat (Triticum aestivum L.). In Gluten Proteins; Bushuk, W., Tkachuk, R., Eds.; AACC: St. Paul, MN, USA, 1991; pp. 755–764. [Google Scholar]
  48. Pompa, M.; Giuliani, M.M.; Giuzio, L.; Gagliardi, A.; di Fonzo, N.; Flagella, Z. Effect of sulphur fertilization on grain quality and protein composition of durum wheat (Triticum durum Desf.). Ital. J. Agron. 2009, 4, 159–170. [Google Scholar] [CrossRef]
  49. Randall, P.J.; Spencer, K.; Freney, J.R. Sulfur and Nitrogen Fertilizer Effects on Wheat. Concentrations of Sulfur and Nitrogen and the Nitrogen to Sulfur Ratio in Grain, in Relation to the Yield Response. Aust. J. Agric. Res. 1981, 32, 203–212. [Google Scholar] [CrossRef]
  50. Dai, Z.; Plessis, A.; Vincent, J.; Duchateau, N.; Besson, A.; Dardevet, M.; Prodhomme, D.; Gibon, Y.; Hilbert, G.; Pailloux, M.; et al. Transcriptional and metabolic alternations rebalance wheat grain storage protein accumulation under variable nitrogen and sulfur supply. Plant J. 2015, 83, 326–343. [Google Scholar] [CrossRef] [PubMed]
  51. Weber, E.A.; Koller, W.D.; Graeff, S.; Hermann, W.; Merkt, N.; Claupein, W. Impact of different nitrogen fertilizers and an additional sulfur supply on grain yield, quality, and the potential of acrylamide formation in winter wheat. J. Plant Nutr. Soil Sci. 2008, 171, 643–655. [Google Scholar] [CrossRef]
  52. Köhler, P.; Hüttner, S.; Wieser, H. Binding sites of glutathione in gluten proteins. In Gluten 96; Wrigley, C.W., Ed.; Royal Australian Chemical Institute: North Melbourne, Australia, 1996; pp. 137–140. [Google Scholar]
  53. Curtis, T.Y.; Powers, S.J.; Wang, R.; Halford, N.G. Effects of variety, year of cultivation and Sulphur supply on the accumulation of free asparagine in the grain of commercial wheat varieties. J. Food Chem. 2018, 239, 304–313. [Google Scholar] [CrossRef] [PubMed]
Figure 1. Air temperature (●) and precipitation (bars) at the trial site Ihinger Hof for the growing seasons 2006/2007 and 2007/2008.
Agronomy 08 00284 g001
Figure 2. Air temperature (●) and precipitation (bars) at the organic trial site Kleinhohenheim for the growing seasons 2006/2007 and 2007/2008.
Agronomy 08 00284 g002
Figure 3. Impact of N supply on crude protein (a) and free Asn (b) content, separated by trial. The scattered line shows which N supply needed crude protein when E-wheat was reached and how much free Asn was formed.
Agronomy 08 00284 g003
Figure 4. Correlation of crude protein and free Asn of winter wheat, separated by trial.
Agronomy 08 00284 g004
Table 1. Treatments of the conventional N trial differing in winter wheat cultivar (Bussard: B, Naturastar: N, Capo: C), amount of N fertilization, and temporal distribution of N fertilization.
TreatmentWheat CultivarTotal N
(kg ha−1)
Vegetation Start (kg N ha−1)Zadoks * 31/32
(kg N ha−1)
Zadoks
39
(kg N ha−1)
Zadoks
49/51
(kg N ha−1)
Zadoks
55
(kg N ha−1)
ControlB0-----
N60-lateB60-30-30-
N60B6030-30--
N100-lateB10030-4030-
N100B100303040--
N140-lateB14030303050-
N140B140504050--
N180-lateB1803040304040
N180B180606060--
ControlN0-----
N180-lateN1803040304040
ControlC0-----
N180-lateC1803040304040
* [28].
Table 2. Treatments in the organic N trial differing in winter wheat cultivar (Bussard: B, Naturastar: N, Capo: C), amount of N fertilization and temporal distribution of N fertilization.
TreatmentWheat CultivarN FertilizerTotal N
(kg ha−1)
Vegetation Start
(kg N ha−1)
Zadoks 31/32
(kg N ha−1)
Zadoks 39
(kg N ha−1)
ControlBControl0---
S50BSlurry5050--
S100BSlurry1005050-
S50-H50BSlurry & horn meal10050 slurry-50 horn
S100-H20BSlurry & horn meal12050 slurry50 slurry20 horn
H60BHorn meal6030-30
H120BHorn meal120404040
H180BHorn meal180606060
ControlNControl0---
H180NHorn meal180606060
ControlCControl0---
H180CHorn meal180606060
Table 3. Treatments in the S trial differing in amount, type (Kieserit: K, Epson salt: Ep, Kieserite + Epson salt: KEp, Elemental sulfur: elS) and temporal distribution of S fertilization and in amount of N fertilization (N1: 120 kg N ha−1, N2: 200 kg N ha−1).
S Fertilization (kg ha−1)
TreatmentTotal SVegetation StartZadoks
37/39
Zadoks
49/51
Zadoks
55
S FertilizerTotal N (kg ha−1)
Control0-----0
Control-S2020---K0
K20-N12020---K120
K20-N22020---K200
K40-N1402020--K120
K40-N2402020--K200
K60-N26060---K200
Ep-N16-222Ep120
Ep-N26-222Ep200
KEp26-N12620222KEp120
KEp26-N22620222KEp200
elS N15,62.8 (Zadoks 25)2.8 (Zadoks 32)--eS120
elS N25,62.8 (Zadoks 25)2.8 (Zadoks 32)--eS200
Table 4. Grain yield (GY), sedimentation value (SV), crude protein (CP), and free Asn of the conventional and organic N trial in dependence on fertilization and year for winter wheat cultivar Bussard.
Conventional
TreatmentGY (t ha−1)SV (mL)CP (%)Free Asn (mg 100 g−1)
20072008mean20072008mean07/082007 *2008mean
Control4.4 a3.5 a3.923.5 a33.5 a28.510.2 a11.710.3 ab11.0
N60-late5.7 b4.4 b5.129.7 ab43.8 bc36.712.0 b9.88.2 a9.0
N605.9 b4.7 bc5.328.5 ab39.7 ab34.111.2 b8.88.9 a8.9
N100-late6.3 bc5.2 cd5.734.0 b49.3 cd41.713.0 c11.29.1 a10.2
N1006.8 cd5.3 cd6.134.7 bc45.2 bcd39.912.5 c8.69.9 ab9.2
N140-late6.9 cd5.5 de6.237.3 bcd49.5 cd43.414.1 e11.515.4 b13.5
N1407.5 e6.1 ef6.837.2 bc47.0 bcd42.113.1 d12.111.8 ab12.0
N180-late7.2 de5.8 def6.546.5 d54.2 d50.315.2 g13.715.2 b12.4
N1807.7 e6.2 f6.943.7 cd47.2 bcd45.414.2 f12.317.8 b13.0
Year (mean)6.5 b5.2 a 35 a45.5 b n.s.10.611.4
Organic
TreatmentGY (t ha−1)SV (mL)CP (%)Free Asn (mg 100 g−1)
07/0820072008mean20072008mean20072008mean
Control4.2 ab28.540.234.3 a9.111.010.1 a9.87.28.5
S50 4.5 bc31.341.236.3 ab10.211.410.8 ab10.07.48.7
S1005.1 d36.043.039.5 bc10.712.011.4 bc10.88.79.8
S50-H504.6 bcd32.343.537.9 abc10.511.811.1 bc12.47.39.8
S100-H204.9 cd35.343.539.4 bc11.112.311.7 c10.47.59.0
H604.2 ab31.244.838.0 abc10.112.011.1 bc11.26.48.8
H1204.2 ab34.847.341.1 c10.712.211.5 bc11.16.89.0
H1803.9 a42.551.747.1 d12.613.413.0 d11.88.210.0
Year (mean)n.s.34.0 a44.4 b 10.6 a12.0 b 10.9 b7.5 a
Years are shown separately if the year or the interaction of year-treatment was significant. However, for the treatment letters only refer to the single year (α = 0.05%, Tukey test). For the year different letters assign significant differences (α = 0.05%, Tukey test). Where no letter appears, no significant differences were found or the interaction was significant but within the single year the treatment was not significant. For crude protein (within the conventional trial) and grain yield (within the organic trial), only the treatment was significant; therefore, only means of both years separated by treatment are given.
Table 5. F-values and p-values of -free Asn separated by cropping system for the main effects year, nitrogen, and winter wheat cultivar as well as forinteractions between main effects, df = degree of freedom.
Free Asn
Effect Conventional Organic
dff-Valuep1f-Valuep
Year (Y)14.69*2.92n.s.
Nitrogen (N)111.46**17.11***
Cultivar (C)220.25***36.24***
C × N20.81n.s.2.29n.s.
Y × N15.49*0.00n.s.
Y × C20.03n.s.4.25*
Y × C × N20.74n.s.1.72n.s.
1 level of confidence (p < 0.05 *, 0.01 **, 0.001 ***, n.s., not significant).
Table 6. Free Asn content of conventionally and organically grown winter wheat cultivars separated by N treatment and year.
ConventionalOrganic
Free Asn (mg 100 g−1)Free Asn (mg 100 g−1)
Wheat CultivarTreatment2007200807/082007200807/08
BussardControl11.7 ab10.3 ab11.09.8 a7.2 a8.5
N18013.7 ab15.2 bc14.411.8 ab8.2 a10.0
NaturastarControl13.2 ab13.3 abc13.311.3 ab11.4 ab11.3
N18015.9 b17.4 c16.616.6 b14.5 b15.6
CapoControl6.8 a7.6 a7.26.9 a6.5 a6.7
N1808.8 ab11.8 abc10.37.3 a9.8 ab8.6
Year 11.7 a12.9 b 10.6 9.6
Different letters assign significant differences (α = 0.05%, Tukey test).
Table 7. Grain yield and grain quality traits of winter wheat cultivar Enorm of the S trial dependent on N and S fertilization and year.
GY (dt ha−1)CP (%)SV (mL)S (%)Free Asn (mg 100 g−1)
Treatment2007200807/082007200807/082007200807/0807/082007200807/08
Control4.24.74.5 a9.88.59.3 a28.327.327.8 a0.137 ab8.6 ab9.4 a9.0
Control-S4.34.34.3 a9.68.89.2 a28.228.728.5 a0.133 a6.9 a10.1 a8.5
K20-N16.77.16.9 b12.011.411.7 b37.341.039.2 b0.155 cd9.5 b11.9 abc10.7
K20-N27.17.27.2 cde14.613.914.3 d44.850.247.5 e0.174 cde21.2 c16.8 d19.0
K40-N16.77.06.8 b12.011.611.8 b38.239.338.8 bc0.163 cd10.6 b9.5 a10.1
K40-N27.27.17.2 cd14.313.814.1 cd45,249.347.3 e0.175 de16.6 c18.9 de17.8
K60-N27.27.47.3 def14.513.614.1 cd43.548.546.0 de0.168 cde16.8 c14.5 cd15.7
Ep-N16.77.06.9 b12.411.512.0 b38.740.239.5 bc0.160 cd9.8 b9.3 a9.6
Ep-N27.37.57.4 def14.213.513.9 c43.047.245.1 de0.169 cde20.3 c14.6 cd17.5
KEp26-N16.87.17.0 bc12.111.711.9 b39.540.239.9 c0.153 bc10.2 b12.2 abc11.2
KEp26-N27.57.57.5 f14.513.614.1 cd42.745.344 d0.172 cde20.2 c13.9 bdc17.1
elS N16.67.26.9 b12.111.511.8 b39.041.040 bc0.190 e9.4 b10.4 ab9.9
elS N27.37.57.3 ef14.213.513.9 c44.346.545.4 de0.175 de21.9 c23.8 e22.9
Year (mean)6.6 a6.8 b 12.8 b12.1 a 39.4 a41.9 b n.s.14.0 13.5
Different letters within analyzed trait and year displays significant differences (Tukey test, α = 0.05). Letters only appear where the main effects or interactions were significant.

