Bird Management in Blueberries and Grapes

1
Department of Integrative Biology, Michigan State University, 288 Farm Ln., East Lansing, MI 48824, USA
2
Center for Global Change and Earth Observations, Michigan State University, 1405 S. Harrison Rd., East Lansing, MI 48823, USA
*
Author to whom correspondence should be addressed.
Agronomy 2018, 8(12), 295; https://0-doi-org.brum.beds.ac.uk/10.3390/agronomy8120295
Submission received: 8 November 2018
/
Revised: 28 November 2018
/
Accepted: 1 December 2018
/
Published: 7 December 2018
(This article belongs to the Special Issue Berry Crop Production and Protection)
Abstract
:Bird damage to fruit is a long-standing challenge for growers that imposes significant costs because of yield losses and grower efforts to manage birds. We measured bird damage in ‘Bluecrop’ blueberry fields and Pinot noir vineyards in 2012–2014 in Michigan to investigate how year, grower, and forest cover influenced the proportions of bird damage. We tested whether inflatable tubemen (2013–2014) and a methyl anthranilate spray (2015) reduced bird damage in blueberries, and tested the deterrent effect of inflatable tubemen in grapes (2014). Years when crop yield was lower tended to have a higher damage percentage; for blueberries, bird damage was highest in 2012, and in grapes, damage was highest in 2012 and 2014. Neither blueberry fields nor vineyards with inflatable tubemen showed significantly reduced bird damage, although the blueberry fields showed a non-significant trend toward lower damage in the tubemen blocks. Blueberry field halves treated with the methyl anthranilate spray had equivalent bird damage to untreated halves. Our results correspond to previous work showing that percent bird damage varies by year, which was likely because bird consumption of fruit is relatively constant over time, while fruit yield varies. Fruit growers should expect a higher proportion of bird damage in low-fruit contexts, such as low-yield years, and prepare to invest more in bird management at those times. Investigating patterns of bird damage and testing deterrent strategies remain challenges. Bird activity is spatially and temporally variable, and birds’ mobility necessitates tests at large scales.
1. Introduction
Cultivated blueberry (Vaccinium corymbosum L.) production in the United States (U.S.) more than doubled between 2005–2016 to nearly 272 million kilograms (600 million pounds), which was valued at over 700 million dollars [1,2]. U.S. grape (Vitis vinifera L.) production stayed steady between 2005–2016, at somewhat over six million metric tons (seven and a half million short tons), although the value nearly tripled to a price of $1500/short ton [1,2]. Fruit-eating birds pose consistent challenges for fruit growers (e.g., Tracey et al. [3] and Lindell et al. [4]). Growers from Michigan, New York, Oregon, California, and Washington estimated that bird damage to blueberries in 2011 was between 3.8–18.2%, and bird damage to wine grapes was between 2.9–9.2% [5]. Using these estimates with state price and production data, we calculated that, for example, bird damage costs Michigan blueberry growers over $14 million annually, and California wine grape growers over $49 million [5]. Given the size of the blueberry and wine grape industries, the documented health benefits of fruit and vegetable consumption [6,7], and the yield loss to pest birds, improving the understanding and management of pest birds will have economic benefits for both growers and consumers and increase the health of society.
In previous work on tree fruits, we found that the proportion of bird damage was higher in low-fruit yield contexts. For example, the proportion of bird damage to Michigan sweet cherries (Prunus avium L.) was much higher in a low-yield year than in higher-yield years [4]. We also found some evidence of spatial influences; bird damage to sweet cherries was lower in blocks surrounded by other sweet cherries than in blocks surrounded by non-sweet cherry land-cover types. Local populations of fruit-eating birds are likely relatively constant over a year-to-year time frame in the study region, and so the amount of food that they consume is an absolute amount. When there is a small absolute amount of fruit available (low yield years) and/or this is the only field in the local area that offers fruit (no surrounding fruit fields), the fixed absolute amount that birds eat will appear as a proportionally higher amount of the available fruit.
We also found greater bird damage in both sweet and tart cherry (Prunus cerasus L.) blocks that were in landscapes with low forest cover (less than 50% forest cover, compared to blocks with greater than 50% forest cover), potentially because of the close proximity of important resources in low forest cover landscapes, i.e., fruit in the blocks and nesting habitat, and cover from predators in the forest [4]. This pattern has been documented previously: Great-tailed grackles (Quiscalus mexicanus) caused higher bird damage in grapefruit groves close to sugarcane fields in Florida, presumably because the sugarcane fields provide roost sites for the grackles [8]. Similarly, blackbirds cause more damage in sunflower fields near cattail marshes that provided roosting habitat compared to fields farther from marshes [9].
Grower management may be another influence on bird damage levels, although not necessarily in an intuitive manner. Our recent work (Elser et al. in prep) indicated that higher bird damage levels are sometimes positively associated with bird management. We believe this pattern results because growers are more likely to employ management when a block is particularly susceptible to bird damage. Thus, when a grower manages for pest birds, he/she may simply be able to reduce bird damage down to regional averages. Assessing the efficacy of bird management techniques is inherently difficult, because birds are highly mobile. Thus, control and treatment sites should be large, and have baseline levels of damage that are similar. In the present work, we relied on bird damage estimates of blocks in previous years, or grower information, to match control and treatment blocks.
A relatively new bird management technique is inflatable tubemen that engage in haphazard movements and are driven by a fan, which may make them more effective at reducing bird activity than traditional stationary scarecrows or other visual deterrents. Bird-deterrent sprays are an appealing possibility to some growers, because the application technique is familiar. The only chemical currently registered for use on fruit is methyl anthranilate. Methyl anthranilate is a compound that occurs in grapes and strawberries and is added to foods to provide a fruit flavor and odor. Some anthranilate derivatives are avoided by birds in laboratory situations [10]. Methyl anthranilate is the active ingredient in a number of bird-deterrent sprays, although strong evidence is lacking that it reduces bird activity in crops (e.g., Avery et al. [11] and Dieter et al. [12]).
Our specific objectives were to (1) investigate the influence of year, grower, and forest cover on proportions of bird damage in blueberries and grapes, (2) test the efficacy of inflatable tubemen in reducing bird damage in blueberries and grapes, (3) determine whether bird damage was reduced for blueberries treated with Avian Control®, Stone Soap Co. Inc., Sylvan Lake, MI, USA, a spray with methyl anthranilate as the active ingredient, compared to untreated blueberries, and (4) make recommendations about managing pest birds in fruit.
2. Materials and Methods
2.1. Study Regions
Our blueberry study region is in western Michigan at approximately 42.3° latitude, −86.1° longitude. The average annual temperature for this region is 10.2 °C, and the average annual precipitation is 947 mm. Our grape study region is in the northern lower peninsula of Michigan at approximately 44.9° latitude, −85.7° longitude. Average annual temperature for this region is 7.4 °C, and average annual precipitation is 841 mm. Detailed information on the counties, varieties of fruit, and years the studies were conducted is in Table 1.
2.2. Block Selection
We defined a block as a contiguous area of one crop, with edges delimited by other land-cover types at least five meters wide. We approached fruit growers in each region to gain access to commercial orchards for studies. Blocks were a minimum of two kilometers apart for the influences-on-bird-damage studies (blueberries: mean = 4.6 km apart, SD = 6.5, n = 23 blocks, some sampled in multiple years; grapes: mean = 2.5 km apart, SD = 1.5, n = 19 blocks, some sampled in multiple years). In the case of the tubemen and methyl anthranilate tests, blocks were often closer than two kimometers, because block pairs, or halves of blocks in the case of the methyl anthranilate test, were owned by individual growers.
2.3. Sampling Bird Damage within Blocks
To estimate bird damage within blocks, we divided blocks into four edge strata and one interior stratum, given that the edges of blocks sometimes experience greater damage than interiors [13]. Within a block, edge strata were two rows wide, with the interior stratum comprising all of the other rows. We sampled whole blocks, except in the case of the methyl anthranilate test, where blocks were divided into treatment and control halves. For tests with tubemen, we sampled 2.5-acre areas around the tubemen. These 2.5-acre areas were generally on a corner of the block, so there were only two edge strata and one interior stratum. Since there were only three strata, we increased the number of bushes sampled per stratum to 20 to sample roughly 60 plants, as we did for the influences-on-bird-damage studies.
2.4. Plant Selection
We sampled up to 12 plants per stratum for blueberries, resulting in approximately 60 bushes sampled per block, and up to 20 plants per stratum for grapes, resulting in up to 100 vines sampled per block. We sampled fewer plants in blueberries because of the labor-intensive nature of the sampling (see below). Within each stratum, we randomly selected a starting plant, and then systematically chose the other plants for sampling to provide approximately even coverage of the stratum. For example, if we randomly selected the third plant from the northeast corner as the starting plant for a stratum, and the stratum contained 112 plants in total, we sampled every 10th plant, so that the 11 remaining sample plants were from all of the areas of the stratum.
2.5. Blueberry Cane Selection
For each plant, we randomly selected a number between one and eight; each number represented one of the eight half-winds of the compass rose (NNE, ENE, ESE, SSE, SSW, WSW, WNW, NNW). The half-wind selected represented the side of the plant from which we selected a cane for sampling. We then placed an inconspicuously colored twist tie between 0.5–1 m back from the tip of the cane. Two to three weeks before the first harvest, we counted all of the green and blue berries from the twist tie toward the tip. Since we needed to return to the same cane to recount the berries, we flagged a plant adjacent to the plant with the selected cane. The twist ties were dark green, and the flagging was placed on the side of the plant opposite the sampled plant; neither of these practices should have influenced berry consumption by birds. During the recount, which happened right before the first harvest, we again counted all of the green and blue berries, and any damaged berries. We subtracted the number of berries counted on the second date from the number of berries counted on the first date, and divided this value by the number of days between the sampling dates to obtain the number of berries per branch lost to birds per day. Our assumption was that the berries that were missing were primarily lost to birds. The growers who we spoke with believed this was a reasonable assumption. If there was a reason to think berries were missing for other reasons, we did not include data from sampled plants. For example, when we returned for a recount, we occasionally found evidence of mammal damage near a sampled plant (e.g., scat on the ground, substantial damage to leaves as well as fruit). Also, for example, damage from hail will leave distinctive marks on the berries, or occasionally it was clear that farm equipment had damaged a plant. If we found evidence of any non-bird damage or loss, these plants were removed from the datasets before analyses.
2.6. Grape Cluster Selection
Bird damage sampling took place right before harvest. We randomly selected one cluster per vine by randomly selecting a number, based on 10-cm intervals, to represent the height of the cluster, and a randomly selected number between one and six to represent the horizontal position of the cluster; three represented the vine stem, zero was the left-hard edge of the vine, six represented the right-hand edge, and the other numbers were equidistant between the edges [13]. Field workers worked in pairs to estimate the percent damage after practice, and used diagrams of clusters with various levels of damage prepared by R.W. Emmett of the Department of Agriculture, Mildura, Victoria, Australia. Damage was estimated to 1% intervals if the damage was less than 10% or more than 90%, and in 5% intervals if it was between 10–90% [13]. If there was evidence of mammal damage near a sampled plant, the plant was removed from the dataset before analyses.
2.7. Tubemen Site Selection in Blueberries
In 2013, we matched four pairs of Bluecrop blocks that had comparable damage levels based on 2012 damage assessments. In 2014, we used blocks of Jersey, and each of our control and treatment block pairs (n = 5) were owned by one grower, who stated that the blocks had comparable levels of bird damage. One block per pair in both years was randomly assigned to be a control, and one was a treatment. Treatment blocks had one or two inflatable tubemen “dancing” on the edge and/or interior of the block for two to three weeks before harvest, for approximately 10 h per day. The blocks were 2.6 acres or less with three exceptions: one of 3.1 acres, one of four acres, and one of 5.2 acres. We used tubemen that were approximately 5.5 m tall, with blue, white, and red sections, purchased from LookOurWay®, San Francisco, CA, USA. Tubemen were powered by generators.
2.8. Tubemen Site Selection in Grapes
All of the blocks were Pinot noir. Seven blocks that were assessed for damage levels in 2012 were randomly assigned to tubemen or control treatments in 2014; four of the blocks had tubemen, and three did not. The blocks with tubemen had between two and four tubemen that were moved several times in the weeks before harvest. Sometimes, they were placed on the edge of the blocks, and sometimes, they were placed in the interior. Blocks were 2.2 acres or less in size with two exceptions: one block of 3.6 acres, and one of 4.7 acres.
2.9. Methyl Anthranilate Site Selection in Blueberries
We cooperated with one grower in 2015 who sprayed half of four blocks with Avian Control® before harvest, according to label directions. The unsprayed halves of the blocks served as controls. All blocks were Bluecrop. Block sizes were 1.2 acres, 2.6 acres, 3.7 acres, and 20.4 acres.
2.10. Sampling for Fruit-Eating Bird Activity.
For the influences-on-bird-damage studies in blueberries and grapes, we sampled to obtain estimates of bird abundance using point counts. We performed point counts in blocks in 2012 and 2013, as close in time before harvest as possible, in three regions: Michigan, New York, and the Pacific Northwest. We only present abundance estimates for Michigan in this manuscript, because of our focus here on Michigan; estimates for other regions are in Hannay et al. [14]; please see the data analysis section for more details. In most of the cases, two observers conducted independent point counts simultaneously, not communicating during or after the count [15]. All of the birds that were visually detected within a 25-m radius were recorded for 15 min. Each observer’s point count was considered a separate temporal replicate. Point counts were conducted at random positions at both edge and interior points in blocks where interior points could be located at least 50 m from any edge. Interior and edge points were considered temporal replicates. Please see Hannay et al. [14] for additional details about point count sampling.
For the tubemen trials in blueberries, we sampled bird activity with 30-min observation periods, with the observer positioned 10 m from the southwest corner of the block, unless visibility or other issues prevented use of this corner, in which case another block corner was used. An observer scanned a one-acre area of the block with binoculars, and recorded each individual bird that entered the block. Therefore, these counts represent bird activity rather than numbers of individuals, because the same individuals could have visited a block more than once within the 30-min period. A few blocks were sampled more than once. We conducted 13 h of paired observations in blueberries, i.e., with half-hour observations at the control blocks, and half-hour observations at the paired treatment blocks, usually within the same day, although some of the paired observations were on consecutive days.
For the methyl anthranilate trial, we conducted bird sampling on one day close to harvest for each of the pairs of half-blocks. We followed the protocol described above for the tubemen trials, except that the observer scanned the entire half of the block (not just one acre, as in the tubemen trials) that was either the control or treatment, while another observer, at the same time, scanned the other half of the block. Each treatment and control was sampled once, and we had a total of 3.5 h of bird observations for this trial; one observation had to be shortened to 15 min rather than 30 min for logistical reasons.
We did not conduct bird sampling for the tubemen trial in grapes, but have examined data from seven hours of bird observations conducted in six vineyards from our other studies to determine which fruit-eating birds commonly visited vineyards.
2.11. Forest Cover Estimations
We classified land cover/use (LCLU) from the NAIP (National Agriculture Imagery Program [17] one-meter orthoimagery to determine the proportion of forest within roughly 500-m buffers around each study block. Please see Lindell et al. [4] for details and justification of use of this imagery. The classification was subsequently verified/corrected based on ground-truth observations by field workers.
For the influences-on-bird-damage study in blueberries, we created a categorical variable from the NAIP imagery; low (<50%) or high (50% or greater) forest cover in the 500-m buffer around each block. We chose the breakpoint as 50%, because the largest gap in the forest cover variable was between 44–54%. For the corresponding study in grapes, we discovered that the surrounding forest cover was less than 50% for all but one block, so instead, we used ground-truth data to create another more local-scale variable related to forest cover, i.e., the number of block edges of deciduous or coniferous forest at least five meters tall. We chose five meters because at that height, woody cover would generally provide resources—such as cover from predators—that could cause fruit-eating birds to move regularly between the woody cover and fruit blocks.
2.12. Data Management and Statistical Analyses
To determine the proportions of bird damage for both blueberry and grape blocks, we calculated weighted estimates by first determining the mean damage per stratum from the 12 (blueberries) or 20 (grapes) plants sampled in each of the strata per block. We then multiplied the mean for each stratum by the proportion of the plants in that stratum, given the number of plants in the whole block, and added the resulting values to arrive at an estimate of the bird damage for the block [4,13].
For the influences-on-bird-damage studies for blueberries and grapes, we used Proc Glimmix [18]. Proc Glimmix provides generalized linear mixed models (models with fixed and random factors), and can be used with data with non-normal distributions [19]. We considered year, grower, and forest variables as fixed factors. Year was coded as a dummy variable. We included site as a random factor, because some sites were sampled in more than one year, and bird damage within a site across years could have been correlated. We used a beta distribution and a logit link. We compared the null models (only the intercept) with all one-variable, two-variable, and three-variable models, and with the one global, four-variable model. We compared the AICc (Akaike information criterion corrected for small sample size) values of the models, and considered all of the models within two AICc units of the model with the lowest AICc value as potential final models. The model selection procedures for blueberries and grapes did not indicate that any interactions would be valuable additions to models. We checked the Pearson chi-square value/df to assess that final models had adequate fit.
For the tubemen test in blueberries, we combined data from 2013 and 2014 for analyses given the similarity of the experimental design, i.e., paired blocks, and used a paired t-test to compare bird damage levels between the control and tubemen treatments. For the grape tubemen test, we lost one control block because of unforeseen bird management efforts by the owner, so we conducted an unpaired t-test with the remaining treatment and control blocks. For the methyl anthranilate test in blueberries, we used a paired t-test to compare treated and control halves of fields. t-Tests for the tubemen tests were one-tailed, because we expected that treatment blocks with tubemen would have lower damage. The t-test for the methyl anthranilate test was two-tailed to account for the possibility that the chemical application could increase fruit damage. We calculated Hedges’ g as a measure of effect size for the deterrent tests with tubemen and the methyl anthranilate spray.
We estimated the abundance of fruit-eating birds at point count locations from the point count data using binomial mixture models. These models use site and temporal replicates to estimate abundance [20] and account for factors that may influence the abundance as well as the sampling process. Separate binomial mixture models for fruit-eating bird abundance were constructed for blueberries and grapes. Although we only generated estimates for Michigan, we used data from three regions, Michigan, New York, and the Pacific Northwest, collected in 2012 and 2013, to improve estimates, given the large number of point counts with no bird detections, leading to an overdispersion of the data. Multiple study blocks in each region were used as site replicates. In the cases where two observers conducted independent point counts simultaneously, each point count was used as a separate temporal replicate. When separate point counts were conducted in the edge and interior locations of some blocks, these were also considered temporal replicates. Therefore, there was a possible maximum of four temporal replicates for a study block when both edge and interior points were sampled by two observers. Models were analyzed in a Bayesian framework using the R2jags package [21].
The abundance model is as follows:
Ni,k ∼ Poisson (λi,k)
log(λi,k) = αk + β1 × (Regioni) + ei, where ei ∼ Normal (0, σ2λ)
The observation model is as follows:
Above, k is the number of years in the study (two), j is the number of temporal replicates, and i is the number of study blocks. Estimated site abundance is represented by N. Overdispersion, which is common in count data with many ‘zero’ counts, was accounted for in the abundance models by including a random variable for block (ei), and in the observation model through a random variable for each temporal replicate (δi,j,k). The terms σ2λ and σ2p represent the standard deviation of λ and p, respectively, and are estimated by the model with uninformative priors. Point count data were collected for two different years, 2012 and 2013, which were modeled with different intercepts (α1 and α2). We used uninformative priors for each model. We ran three Markov chains for 350,000 iterations, with the first 50,000 iterations being excluded as ‘burn in’. Model convergence was checked by making sure that the Rhat values for all of the models were within 0.1 of 1, which is considered to be an acceptable range for convergence [22], as well as by looking at the mixing of the three Markov chains. We inspected model fit by using the ratio between simulated and actual data; a good ’fit’ is around one [20]. Both models had a fit of 1.00 +/− 0.02, and a “Bayesian p-value” within 0.02 of 0.5, where values around 0.5 are considered ideal [20]. For additional details about the estimation process, please see Hannay et al. [14].
yi,j,k|Ni,k ∼ Binomial (Ni,k, pi,j,k)
logit(pi,j,k) = βk + δi,j,k, where δ ∼ Normal (0, σ2p)
2.13. Animal Care Statement
These studies were approved by the Michigan State University Institutional Animal Care and Use Committee, approval #04/14-076-00.
3. Results
3.1. Influences on Bird Damage to Blueberries and Grapes
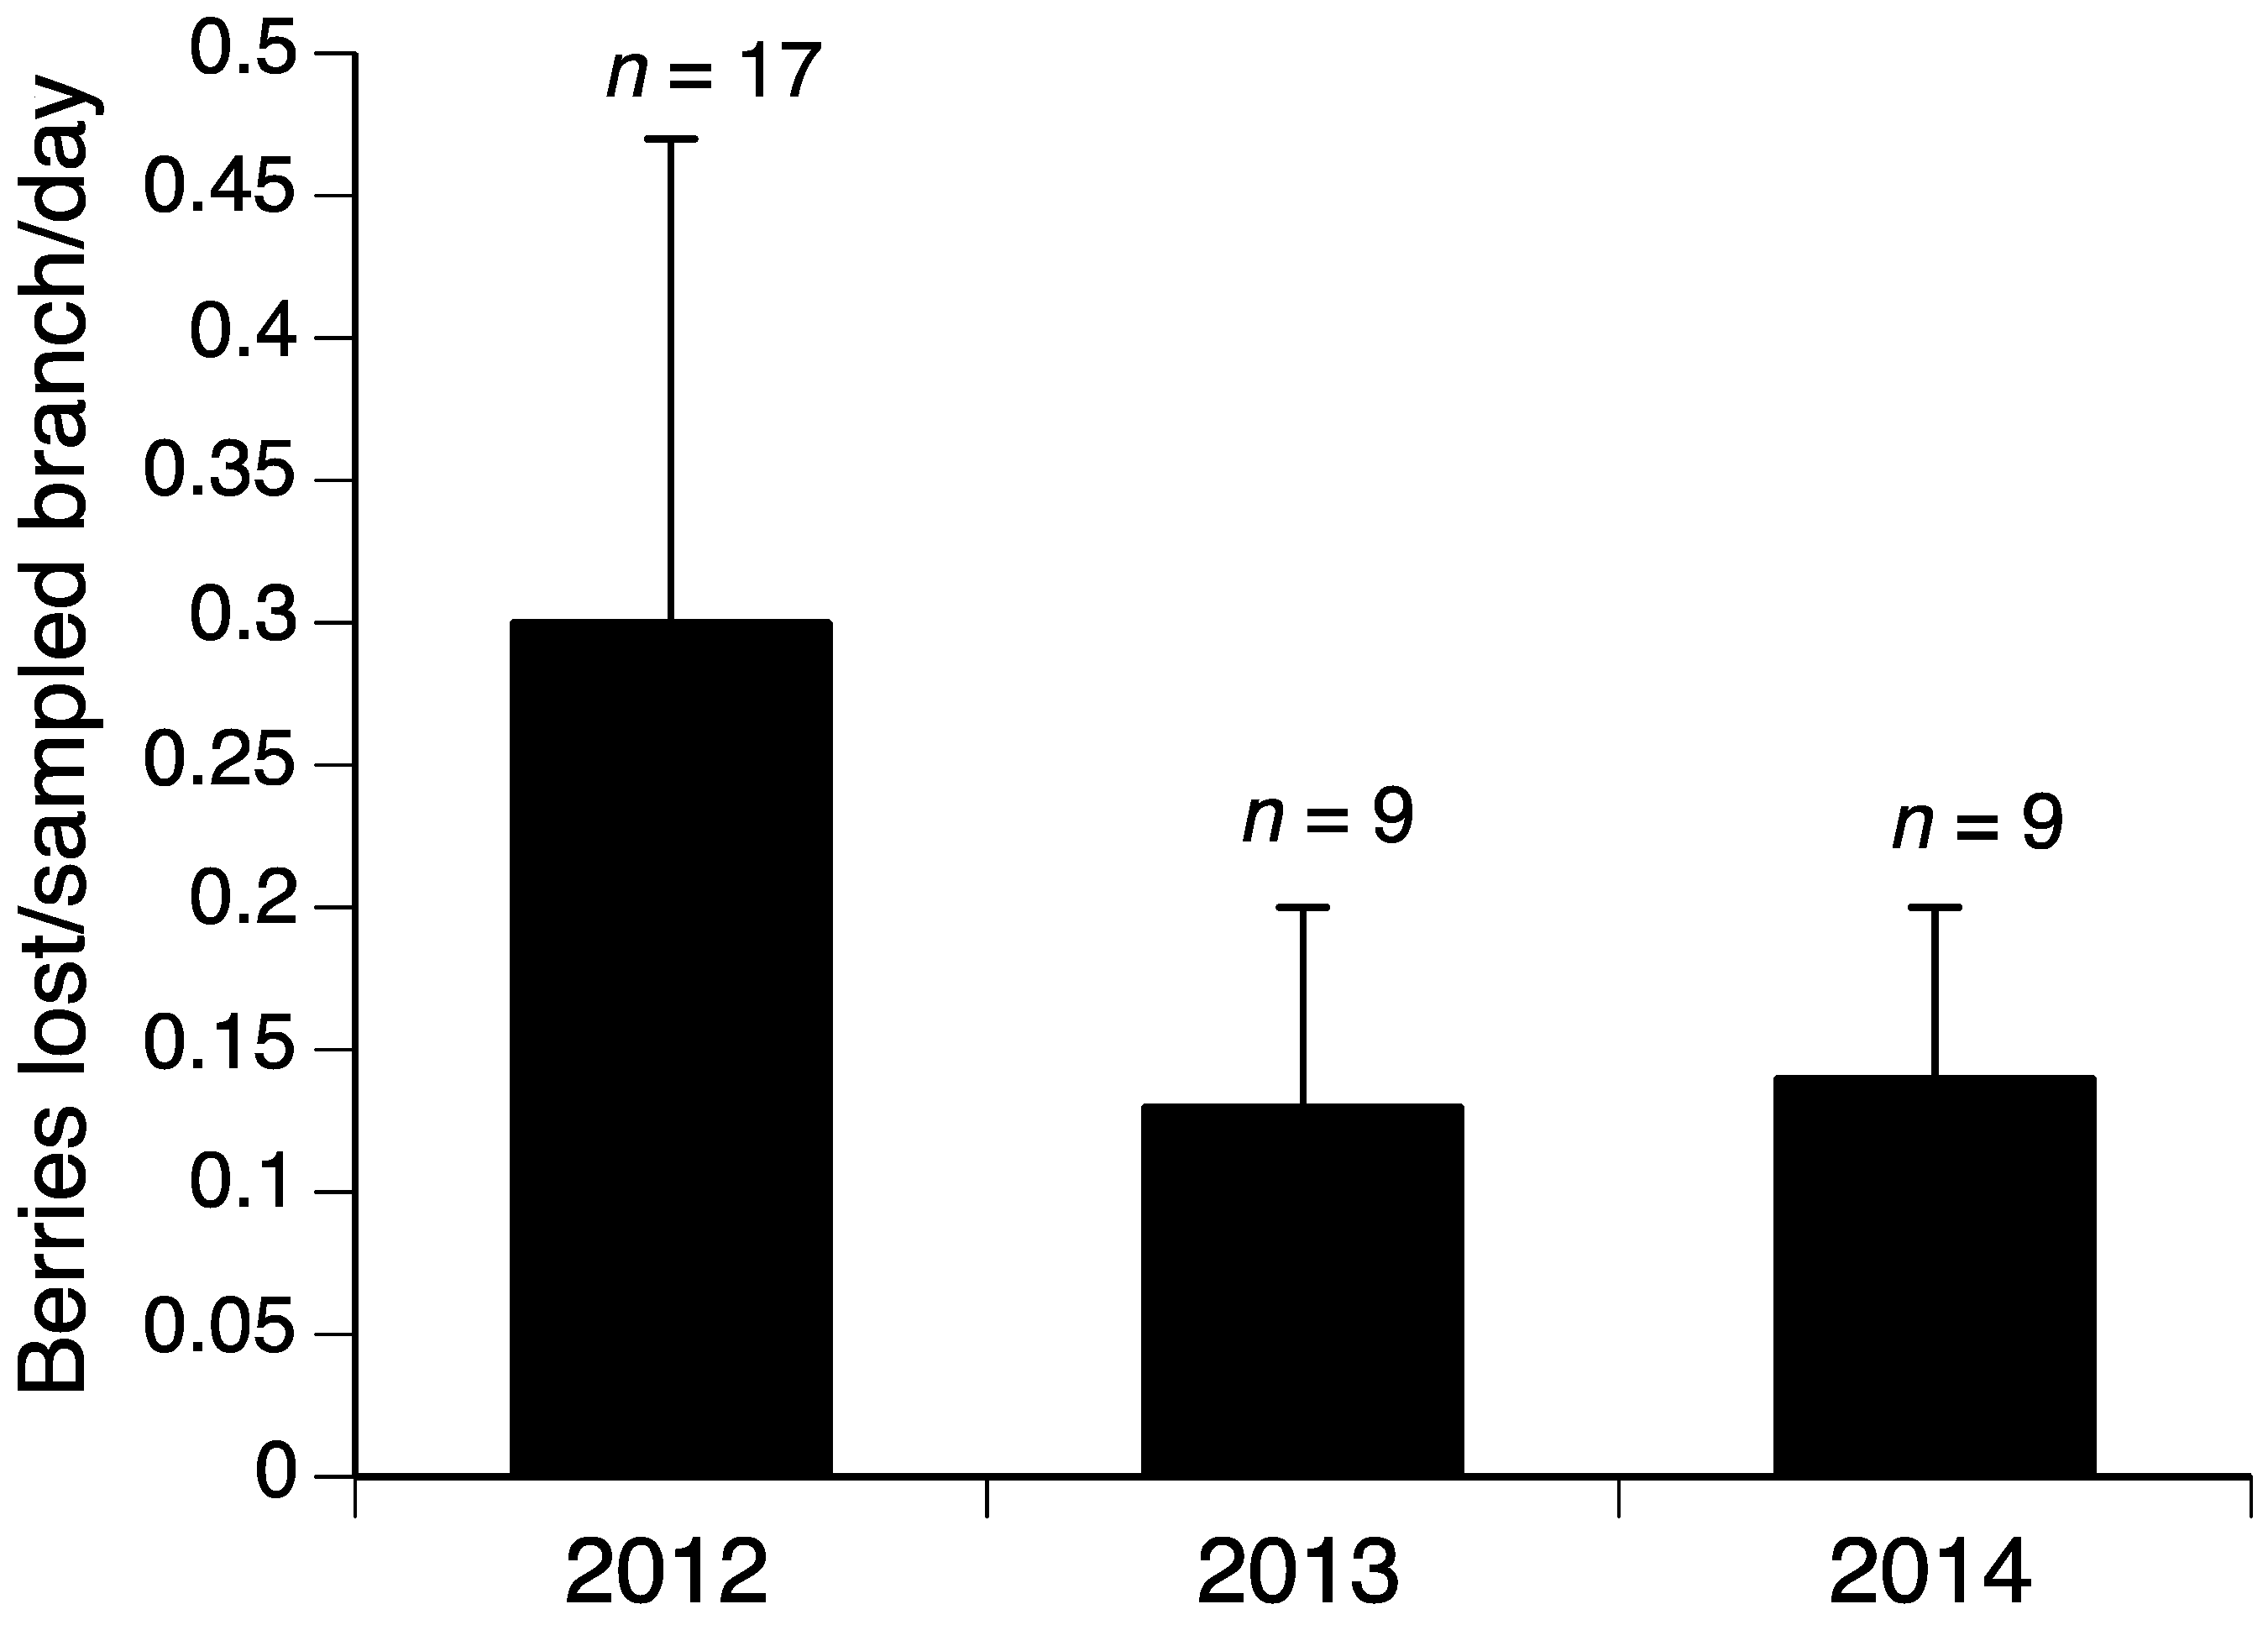
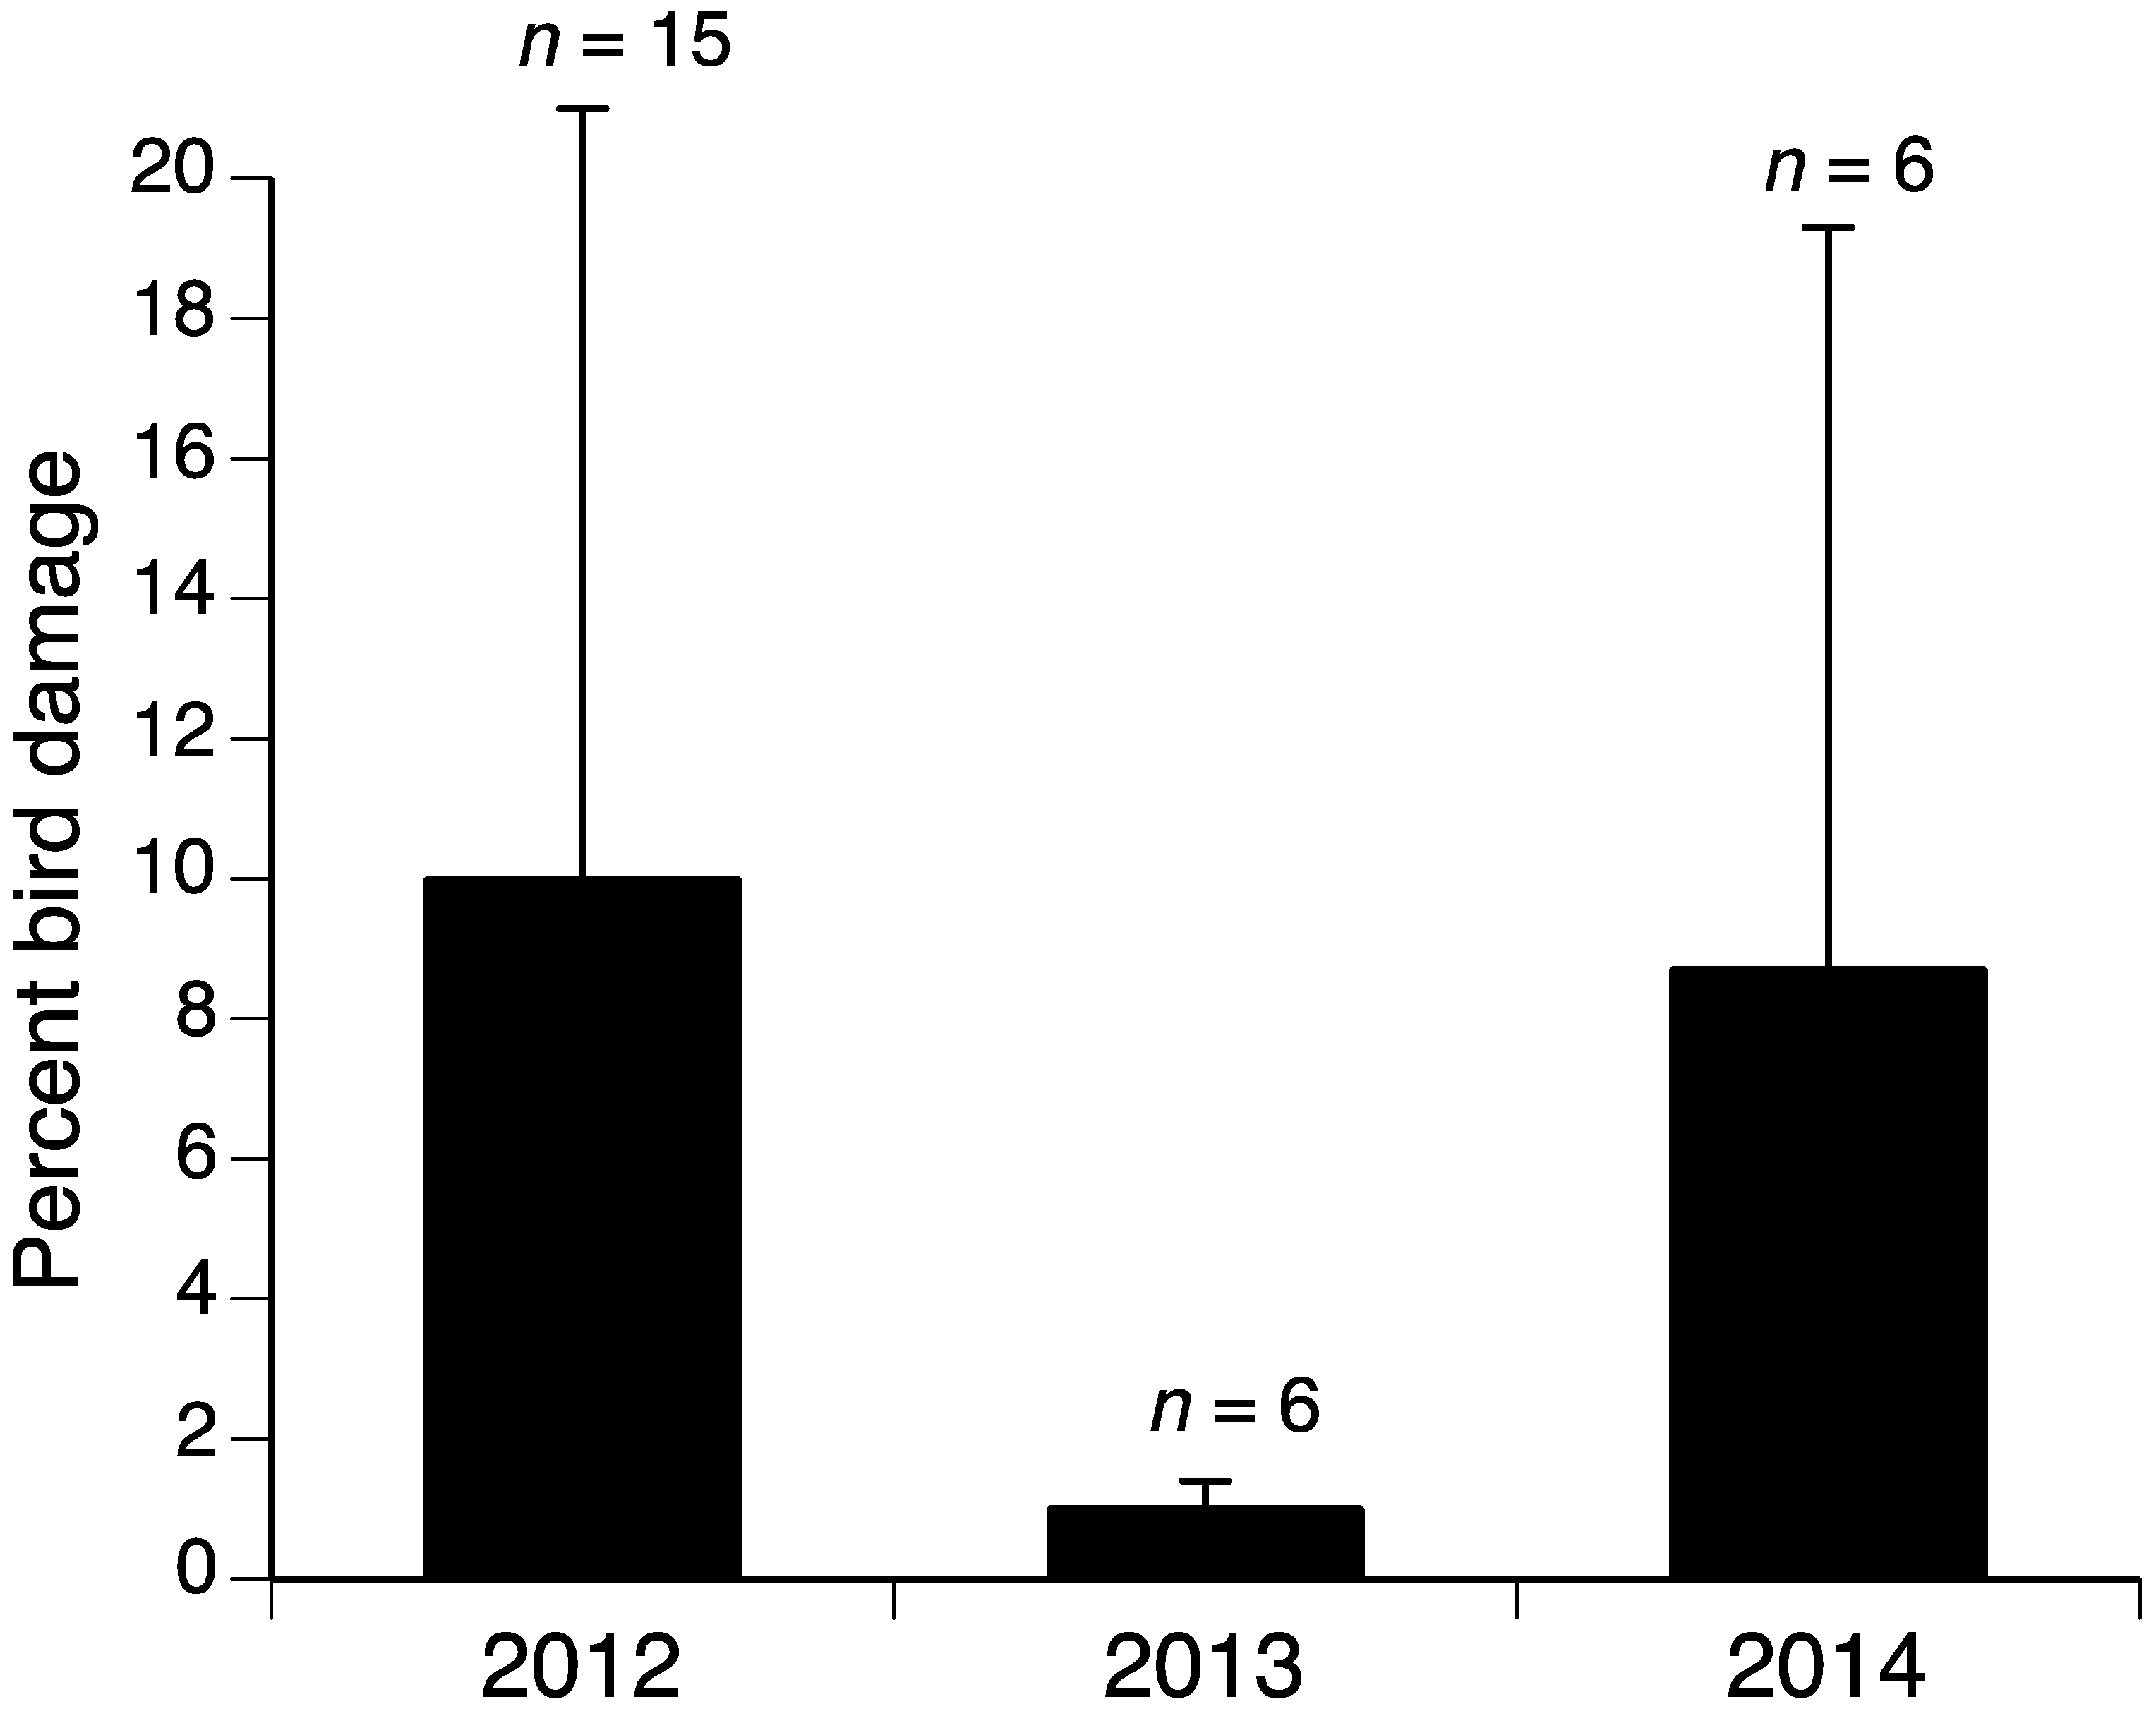
The model selection procedure for the influences-on-bird-damage study for blueberries indicated that the variables yeartwo (2013) and yearthree (2014) were important components of the model with lower damage in 2013 and 2014 compared to 2012 (Table 2 and Figure 1). The model including yeartwo and yearthree had the lowest AICc value, although the model with only yeartwo was within two AICc units, suggesting some support for that model as well [23] (Table 3). Given that the upper and lower confidence limits for the yearthree variable include 0, this variable is likely less important than yeartwo. The final model for grapes included the variable yeartwo (2013) with much lower damage in 2013 compared to 2012 and 2014 (Table 2 and Table 4, and Figure 2).
The years were coded as dummy variables; the estimates refer to the years besides the one listed as the explanatory variable. For example, the estimate in the yeartwo row for blueberries is the estimate for yearone (2012) and yearthree (2014) combined, with yeartwo as the reference value (estimate = 0). C.L. refers to confidence limits.
3.2. Bird Deterrent Tests
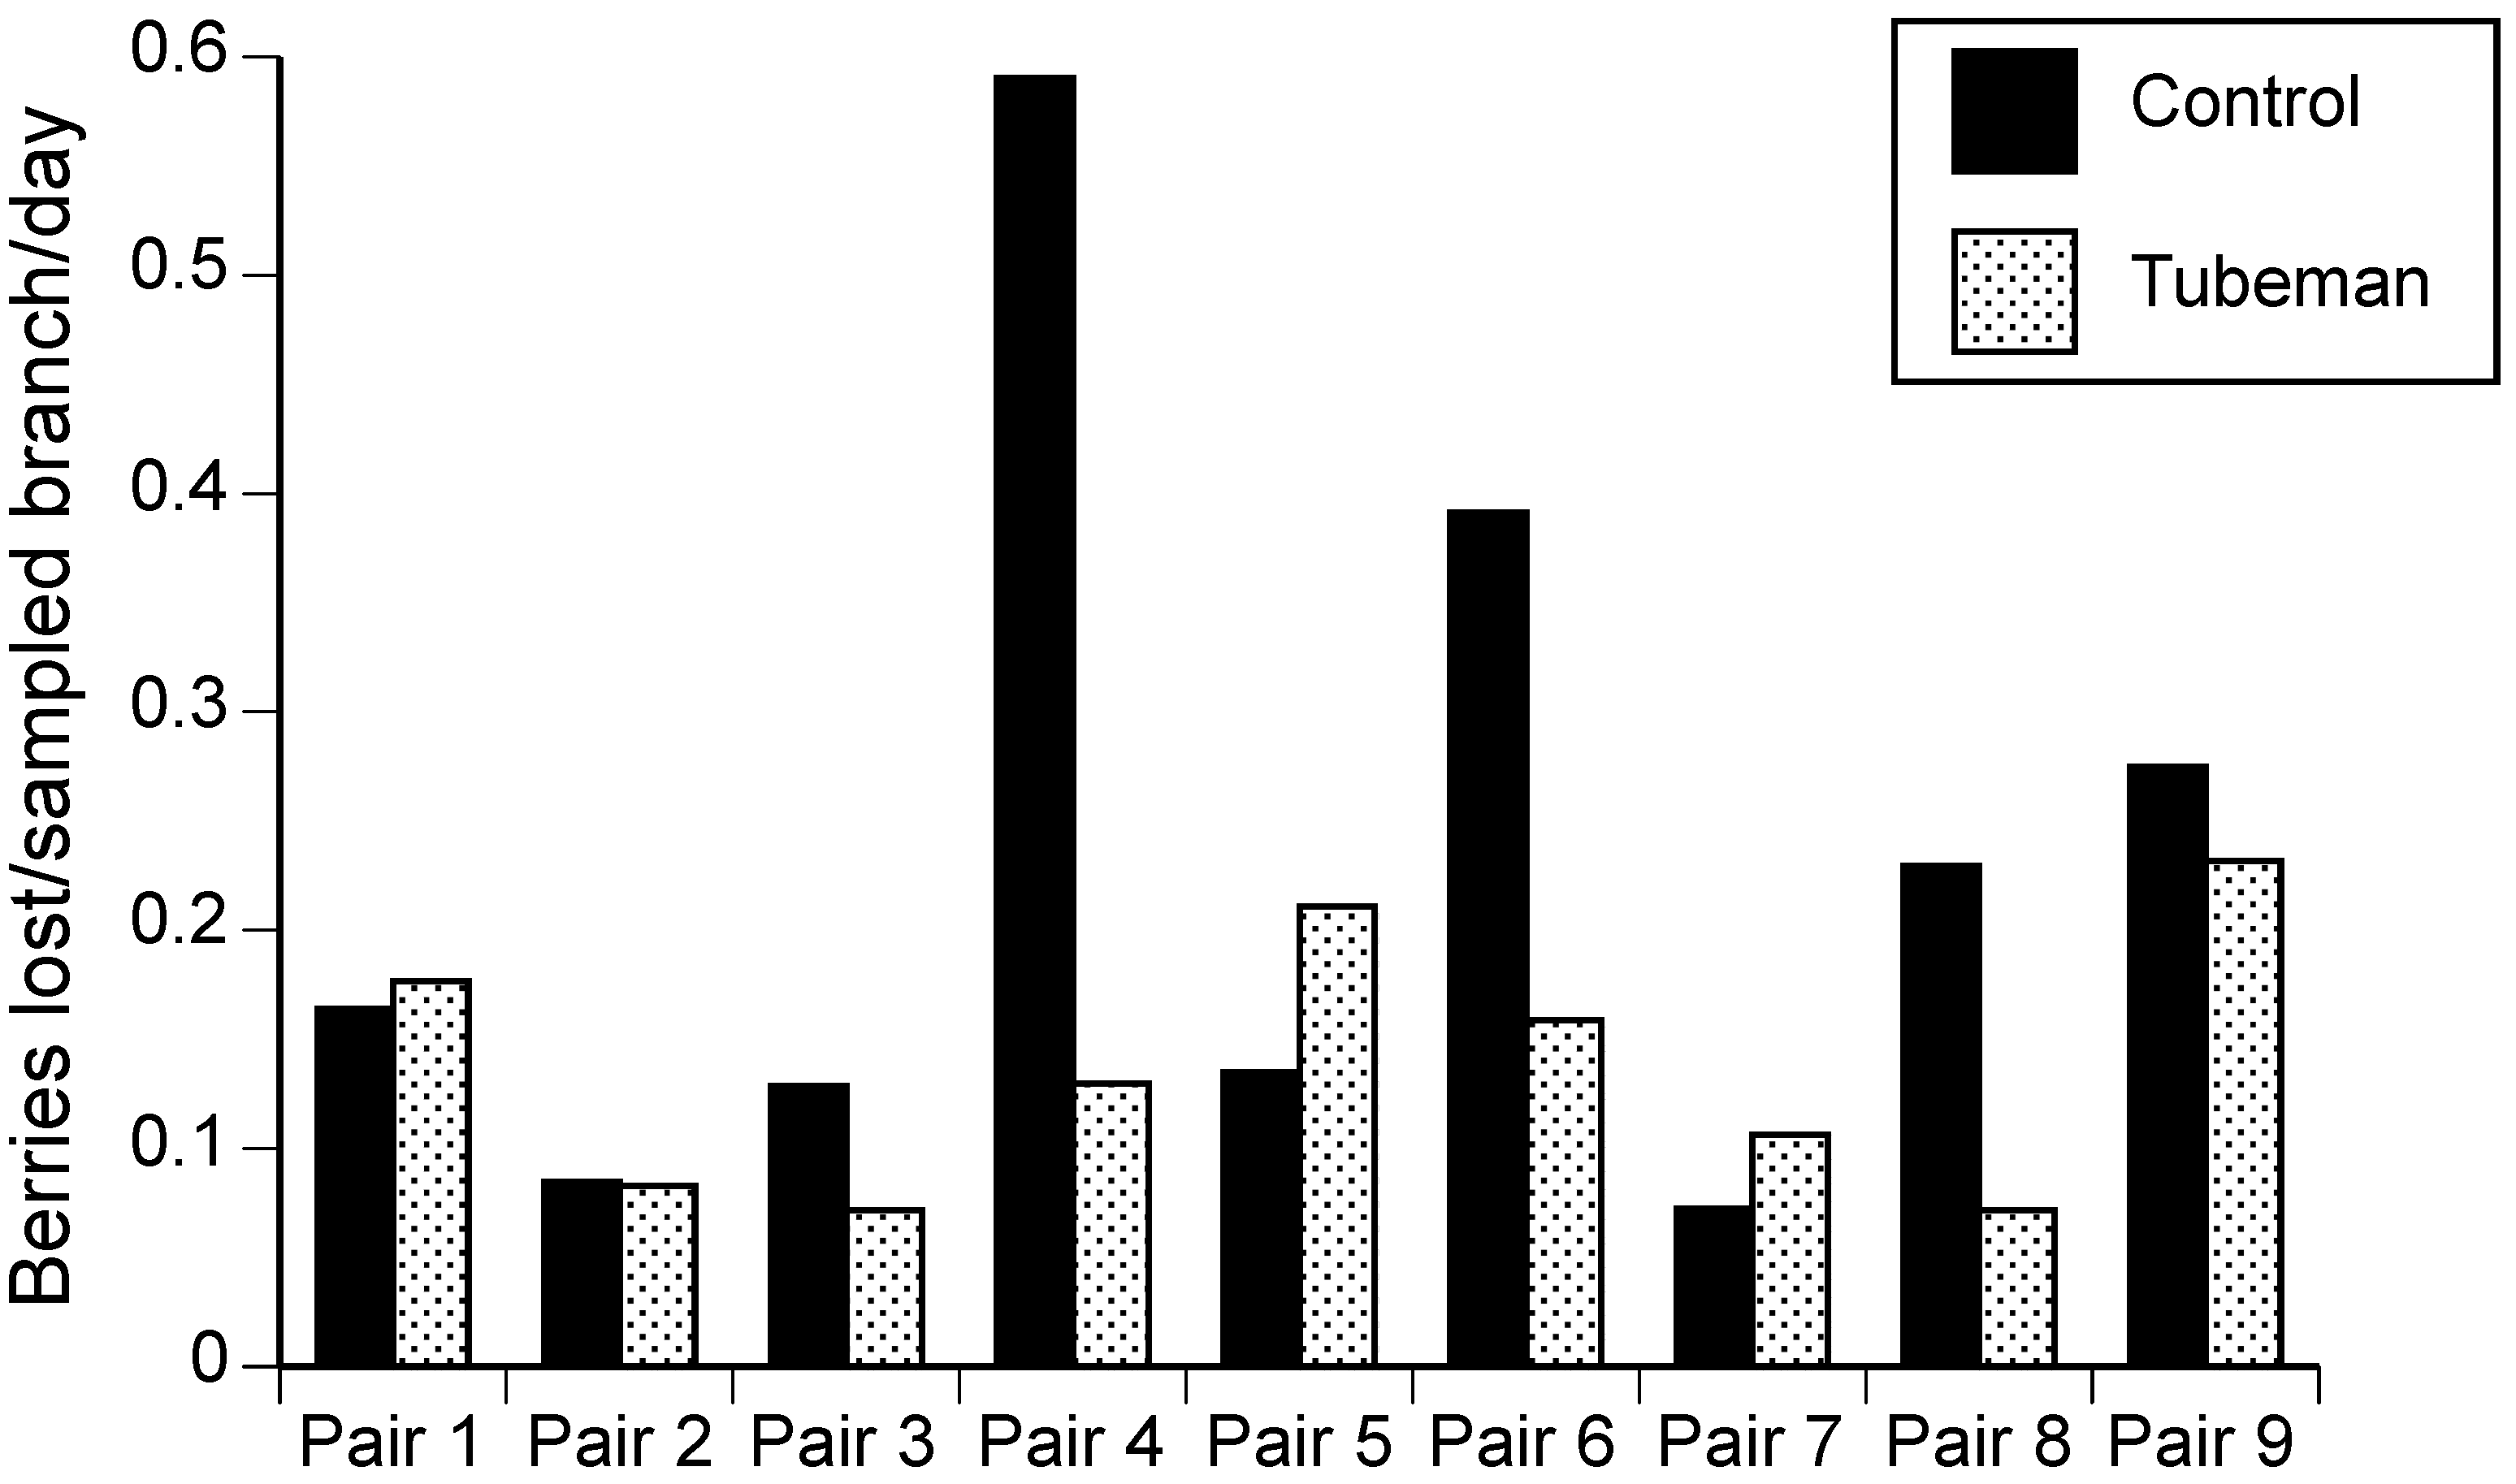
Bird damage to blueberries was not significantly different in blocks with tubemen compared to paired blocks without tubemen, although there was a non-significant trend toward lower damage in tubemen blocks (paired t-test, t = 1.64, df = 8, p = 0.07, Hedges’ g = 0.65; CI = −0.23–1.65, Figure 3). Three pairs of blocks showed at least 15% lower damage in treatment blocks; however, there was enough variation in outcomes in the other blocks to render the overall comparison between treatments and controls not significantly different. Similarly, grape blocks with tubemen did not have bird damage levels that were significantly different from the blocks that lacked tubemen (t-test, t = 0.25, df = 5, p = 0.41, Hedges’ g = 0.16; CI = −1.32–1.68; mean percent bird damage in control blocks was 4.7 ± 2.1 SD and in tubemen blocks was 4.3 ± 1.5 SD).
Bird damage was not significantly different in the halves of blocks treated with the methyl anthranilate product, Avian Control®, compared to halves that were not treated (paired t-test, t = 0.83, df = 3, p = 0.47, Hedges’ g = 0.49; CI = −1.04–2.29, Figure 4).
3.3. Fruit-Eating Bird Abundance and Activity.
The large degree of overlap of the credible intervals for 2012 and 2013 in both blueberries and grapes indicates that fruit-eating bird abundance per count area did not differ between the years (Table 5). The standard deviations were large, given the great variability in bird detections for the point counts, with many zeros. Thus, the estimates are imprecise with wide credible intervals.
Fruit-eating bird activity was not significantly different in paired blueberry blocks with and without tubemen (paired t-test, t = 0.54, df = 12, p = 0.60). The mean bird visits to control blocks was 30.8 (SD = 55.4), while the mean bird visits to tubemen blocks was 20.3 (SD = 42.7). We could identify the bird to species for 606 of 663 visits (91.4%). Of the visits by identified species, the four most common fruit-eating species in the control blocks were, from most common, European starlings (Sturnus vulgaris, 40.7% of identified visits), American robins (Turdus migratorius, 22.4% of identified visits), common grackles (Quisculus quiscula, 18.1% of identified visits), and song sparrows (Melospiza melodia, 7.1% of identified visits). For the tubemen blocks, the four most common fruit-eating species were European starlings (70.9% of identified visits), American robins (10.8% of identified visits), song sparrows (5.6% of identified visits), and American goldfinches (Spinus tristis, 5.2% of identified visits).
Fruit-eating bird activity was not significantly different in halves of blueberry blocks with control halves and halves treated with a methyl anthranilate spray (paired t-test, t = 0.70, df = 3, p = 0.53). Of 51 visits by birds, 42 (82.4%) were identified to species. The three most commonly identified species in the control halves of blocks were northern flickers (Colaptes auratus, 25.0% of identified visits), tufted titmice (Baeolophus bicolor, 25% of identified visits), and American robins (18.8% of identified visits). The only two identified species visiting the treatment halves were American robins and a brown thrasher (Toxostoma rufum).
Sixty-four of 73 visits of fruit-eating birds to Pinot noir blocks over seven hours of observation were by American robins, with a few other species comprising the remainder of the visits.
4. Discussion
This work corresponds with past work [4] demonstrating that the percent bird damage can vary greatly from year to year in fruit crops, which is likely because bird consumption remains relatively consistent over time, while the availability of fruit varies. In our previous work with tree fruits, we found remarkably consistent numbers of sweet cherries either lost to or damaged by birds, despite large differences in sweet cherry abundance from year to year (Table 6 in Lindell et al. [4]). Thus, in high-yield years, bird damage is diluted over a greater abundance of fruit, resulting in lower proportions of damage. In 2012, Michigan blueberry fields yielded 39 million kg; in 2013, this figure was 53 million kg, and in 2014, it was 45 million kg [24] (p. 35). The bird damage patterns reflect this varying abundance of fruit over the years with a lower percent damage in 2013 and 2014 and the highest in 2012 (Figure 1). The pattern was similar in grapes; Michigan grape production was nearly 35 million kg in 2012, compared to 85 million kg in 2013 and 57 million kg in 2014 [24] (p. 37). Bird damage results from these years show lower percent damage in 2013 compared to the other lower-yield years (Figure 2). Work in other crops reinforces the general principle that greater crop abundance results in lower percent damage by vertebrate pests; in a year with high food abundance, including crops and natural forage, percent damage to sunflowers by deer and elk was low; the following year, with reduced food abundance, percent crop damage increased [25]. Generally, absolute pest damage in a region should be consistent from year to year, while local damage depends on the amount of crop available to pests [26]. For example, where corn and sunflower covered the largest acreage in North Dakota, bird damage was lowest [27].
Our fruit-eating bird abundance estimates provided some evidence for relatively consistent bird numbers from year to year; the credible intervals for estimates for 2012 and 2013 broadly overlapped, indicating no differences in bird numbers between years. However, the credible intervals were large, reflecting the overdispersed data, i.e., a large number of point counts with no bird detections. We return to this point at the end of the discussion. We also note that fruit-eating bird abundance may not be as consistent from year to year in other regions where irruptive species such as the Bohemian waxwing, Bombycilla garrulus, are important fruit consumers.
The lack of effect of grower on percent bird damage is somewhat surprising in that growers manage their fields differently, based on experience and resources. We also anticipated that forest cover near blocks would influence percent damage, as we found in sweet and tart cherries [4]. However, the year effect is apparently large enough to outweigh any grower and forest land-cover effects.
Based on these results and previous work, growers should be able to predict when and where fruit is most likely to be at risk from bird damage. Times and areas where fruit abundance is low are likely to be high-risk situations for fruit. For example, orchards with varieties of fruit that ripen early in the season will provide some of the few food sources available for fruit-eating birds, and thus be particularly susceptible to bird damage (e.g., Eaton et al. [28]). Similarly, edges of fruit blocks adjacent to non-fruit landcovers will be at higher risk than edges adjacent to other fruit blocks [4]. If growers know it is likely to be a low-yield year, a higher proportion of their crop is likely to be taken by birds, and so they should prepare to invest more in bird management.
Fruit growers believe that many bird deterrent techniques are only slightly or moderately effective in deterring birds. The exception was netting, which was viewed by over 50% of growers surveyed as very effective [5]. The present work indicates that inflatable tubemen do not consistently reduce fruit damage. The comparison of bird damage per 2.5-acre sampling area in blueberries with and without tubemen nearly reached the level of statistical significance (p < 0.07), indicating that tubemen may reduce damage in some contexts (see also Steensma et al. [29]). Although the tubemen move somewhat randomly, it is likely that birds habituate over time to their presence, as is the case with scare tactics generally (e.g., Cook et al. [30] and Summers [31]). If growers use this technique, we recommend that they use several tubemen for each five acres, place them on the edges of blocks, begin running them before the fruit ripen, and change their positions every few days.
Similarly, the test with a methyl anthranilate spray did not result in detectable differences in bird damage between the control and treatment halves of fields. Systematic tests of methyl anthranilate sprays in fruit have generally not shown strong evidence of efficacy against birds (e.g., Avery et al. [11]), which is potentially because any irritation caused by methyl anthranilate sprays is short-term and birds can move away from treated fruit; thus, they do not learn to avoid it, because they are not exposed to large dosages [32].
Several other bird deterrent techniques that have not been tested in this study show promise; some only show promise in particular contexts. Natural predators can be attracted to fruit-production regions through landscape enhancements, such as for example nest boxes [33]. We demonstrated that box-nesting America kestrels, Falco sparverius, can be attracted to sweet cherry orchards and reduce the abundance of fruit-eating birds [34]. Some varieties of blueberries will ripen during the kestrel incubation and nesting periods, which is when the kestrels are most likely to provide protection from pest birds; as a result, this technique may be useful in some blueberry production regions. Grapes ripen after the kestrel nesting period, so this strategy is not well-suited for grapes. Deterrence by natural predators has the additional advantage that it is preferred by consumers compared to other deterrent techniques that are deemed less “natural”, and so growers may be able to garner better prices if they advertise their use of natural predators [35,36].
Unmanned aerial systems (UAS) may also be valuable bird deterrent systems, although work to date is very limited [37]. Since UAS are not simply passive scare devices, but could actually chase fruit-eating birds (while respecting wildlife regulations), they may be more effective as deterrents.
Other recent developments in bird management focus on disrupting input to birds’ sensory systems, which is likely to be a fruitful direction for future research. “Sonic nets”, for example, broadcast noise that interferes with birds’ communication channels, and have shown effectiveness in deterring birds from airfields [38]. This technique may be useful in fruit crops, although no systematic studies have yet been performed. Preliminary studies of laser scarecrows, where a laser beam sweeps over a field, showed apparent reduced bird damage in sweet corn fields with the devices compared to those without, although no statistical evidence was presented [39]. By imposing an actual cost on birds through reducing their ability to detect predators and/or communicate with conspecifics, these deterrent techniques may be less susceptible to habituation than deterrent techniques with no cost. A recent review discusses conservation and management strategies for seabirds focused on bird sensory systems that suggests some modalities (for example, olfaction) and life history traits (for example, coloniality) that could be fruitful targets for research into bird deterrence [40]. In all cases where birds could potentially cause significant crop damage, we recommend that growers consider an integrated pest management approach, using several deterrent techniques. We also suggest growers prepare and employ a management plan that is specific to their fields and considers risk factors for bird damage and potential mitigation strategies [3] (pp. 211–218).
We end with two methodological recommendations. Bird activity is often quite variable from place to place and time to time. A large number of our point counts resulted in no bird detections. This overdispersion of data can result in large credible intervals for bird abundance estimates. Thus, it is challenging to capture bird abundance, activity, and/or species composition in “snapshot”-type sampling, such as 10 or 15-min point counts. For future work, we suggest longer observation periods, such as the 30-min periods we used in concert with deterrent tests, over standardized areas. This type of sampling is likely to result in more accurate measures of bird abundance, activity, and species composition. Second, the effect sizes for our bird deterrent tests tended to have large confidence intervals, despite our having a greater degree of site replication than many previous studies. We suggest that before-and-after sampling (sampling birds or damage before and after deployment of a deterrence strategy) would be a helpful addition to pairs of treatment and control sites for tests of bird deterrence. Since birds are mobile and cover large areas, treatment and control sites should be relatively large, limiting the number of sites that can be sampled. Before-and-after sampling would have to be conducted over shorter time scales, for example over two-day periods very close to harvest, to ensure some confidence that conditions, including the ripeness of the fruit, are similar before and after the deployment of the strategy. Before-and-after sampling may allow sampling of a larger number of blocks, with environmental conditions controlled, thus increasing sample sizes and increasing the level of confidence in the results.
5. Conclusions
Reducing bird damage to fruit remains a challenging issue. We found that the year was the most important variable in explaining bird damage to blueberries and grapes, with high-yield years having lower proportions of bird damage. Thus, in high-yield years, growers may not view bird management as a priority. Two deterrent strategies, inflatable tubemen and a spray containing methyl anthranilate, did not consistently reduce bird activity or damage. Attracting natural predators with nest boxes and disrupting birds’ sensory systems are two promising bird deterrent strategies that should continue to be investigated. Given birds’ mobility and variability in activity over time and space, before-and-after sampling, along with pairs of treatment and control blocks, should be considered to increase sample sizes in deterrent tests.
Author Contributions
C.A.L. conceived and designed the experiments; B.C.H. and C.A.L. performed the field work; C.A.L. and M.B.H. analyzed the data; C.A.L. wrote the paper.
Funding
This work was supported by the Specialty Crop Research Initiative of USDA/NIFA (Grant number: 2011-51181-30860).
Acknowledgments
We thank the many fruit growers who provided access to their fields, assisted with tests, and pulled us out of the mud when necessary. We are grateful for the many and varied contributions of Shayna Wieferich, Della Fetzer, and Emily Oja. We thank the Stone Soap Company for providing Avian Control®.
Conflicts of Interest
The authors declare no conflict of interest. The founding sponsors had no role in the design of the study; in the collection, analyses, or interpretation of data; in the writing of the manuscript, and in the decision to publish the results.
References
- National Agricultural Statistics Service (NASS). Noncitrus Fruits and Nuts 2005 Summary; Fr Nt 1–3(06); U.S. Department of Agriculture: Washington, DC, USA, 2006.
- National Agricultural Statistics Service (NASS). Noncitrus Fruits and Nuts 2016 Summary; U.S. Department of Agriculture: Washington, DC, USA, 2017; ISSN 1948-2698.
- Tracey, J.; Bomford, M.; Hart, Q.; Saunders, G.; Sinclair, R. Managing Bird Damage to Fruit and Other Horticultural Crops; Bureau of Rural Sciences: Canberra, Australia, 2007. Available online: https://www.dpi.nsw.gov.au/content/_data/assets/pdf_file/0005/193739/managing_bird_damage-full-version.pdf (accessed on 25 September 2018).
- Lindell, C.A.; Steensma, K.M.M.; Curtis, P.D.; Boulanger, J.R.; Carroll, J.E.; Burrows, C.; Lusch, D.P.; Rothwell, N.L.; Wieferich, S.L.; Henrichs, H.M.; et al. Proportions of bird damage in tree fruits are higher in low-fruit-abundance contexts. Crop Prot. 2016, 90, 40–48. [Google Scholar] [CrossRef] [Green Version]
- Anderson, A.; Lindell, C.A.; Moxcey, K.M.; Siemer, W.F.; Linz, G.M.; Curtis, P.D.; Carroll, J.E.; Burrows, C.L.; Boulanger, J.R.; Steensma, K.M.M.; et al. Bird Damage to Select Fruit Crops: The cost of damage and the benefits of control in five states. Crop Prot. 2013, 52, 103–109. [Google Scholar] [CrossRef]
- Lock, K.; Pomerleau, J.; Causer, L.; Altmann, D.R.; McKee, M. The global burden of disease attributable to low consumption of fruit and vegetables: Implications for the global strategy on diet. Bull. World Health Organ. 2005, 83, 100–108. [Google Scholar] [PubMed]
- World Health Organization. Global Strategy on Diet, Physical Activity and Health. Available online: http://www.who.int/nmh/wha/59/dpas/en/ (accessed on 25 September 2018).
- Johnson, D.B.; Guthery, F.S.; Koerth, N.E. Grackle damage to grapefruit in the lower Rio Grande Valley. Wildl. Soc. Bull. 1989, 17, 46–50. [Google Scholar]
- Otis, D.L.; Kilburn, C.M. Influence of environmental factors on blackbird damage to sunflower. In Fish Wildl.; Tech. Rep. 16; U.S. Fish and Wildlife Service: Washington, DC, USA, 1988. [Google Scholar]
- Mason, J.R.; Adams, M.A.; Clark, L. Anthranilate repellency to starlings: Chemical correlates and sensory perception. J. Wild. Manag. 1989, 53, 55–64. [Google Scholar] [CrossRef]
- Avery, M.L.; Primus, T.M.; DeFrancesco, J.; Cummings, J.L.; Decker, D.G.; Humphrey, J.S.; Davis, J.E.; Deacon, R. Field evaluation of methyl anthranilate for deterring birds eating blueberries. J. Wild. Manag. 1996, 60, 929–934. [Google Scholar] [CrossRef]
- Dieter, C.D.; Warner, C.S.; Curiong, R. Evaluation of foliar sprays to reduce crop damage by Canada geese. Hum. Wildl. Interact. 2014, 8, 139–149. Available online: https://digitalcommons.usu.edu/hwi/vol8/iss1/15 (accessed on 25 September 2018).
- Tracey, J.; Saunders, G.R. A technique to estimate bird damage in wine grapes. Crop Prot. 2010, 29, 435–439. [Google Scholar] [CrossRef]
- Hannay, M.B.; Boulanger, J.R.; Curtis, P.D.; Eaton, R.A.; Hawes, B.C.; Leigh, D.K.; Rossetti, C.A.; Steensma, K.M.M.; Lindell, C.A. Bird species and abundances in fruit crops and implications for bird management. Crop Prot. in review.
- Nichols, J.D.; Hines, J.E.; Sauer, J.R.; Fallon, F.W.; Fallow, J.E.; Heglund, P.J. A double-observer approach for estimating detection probability and abundance from point counts. Auk 2000, 117, 393–408. [Google Scholar] [CrossRef]
- Rodewald, P. The Birds of North America; Cornell Laboratory of Ornithology: Ithaca, NY, USA, 2015; Available online: http://bna.birds.cornell.edu/BNA/ (accessed on 1 January 2018).
- National Agricultural Imagery Program (NAIP). Information Sheet. United States Department of Agriculture Farm Service Agency. Available online: http://fsa.usda.gov/Internet/FSA_File/naip_info_sheet_2013.pdf (accessed on 13 August 2014).
- SAS Institute Inc. SAS 9.3. for Windows. Cary, NC, USA, 2002–2010. Available online: http://support.sas.com/software/93/ (accessed on 24 May 2018).
- SAS Institute Inc. SAS/STAT® 9.3 User’s Guide. Available online: https://support.sas.com/documentation/cdl/en/statug/63962/HTML/default/viewer.htm#titlepage.htm (accessed on 24 May 2018).
- Kéry, M.; Schaub, M. Bayesian Population Analysis Using WinBUGS, a Hierarchical Perspective; Academic Press: Waltham, MA, USA, 2012; ISBN 10:0123870208. [Google Scholar]
- Su, Y.S.; Yajima, M. R2jags: A Package for Running Jags from R. Available online: https://CRAN.R-project.org/package=R2jags (accessed on 1 January 2014).
- Kéry, M. Introduction to WinBUGS for Ecologists: Bayesian Approach to Regression, ANOVA, Mixed Models and Related Analyses; Academic Press: Orlando, FL, USA, 2010; ISBN 10:0123786053. [Google Scholar]
- Burnham, K.P.; Anderson, D.R. Model Selection and Multimodel Inference: A Practical Information-Theoretic Approach, 2nd ed.; Springer-Verlag: New York, NY, USA, 2002; ISBN 0-387-95364-7. [Google Scholar]
- National Agricultural Statistics Service (NASS). Annual Statistical Bulletin. Michigan Agricultural Statistics 2016–2017. Available online: https://www.nass.usda.gov/Statistics_by_State/Michigan/Publications/Annual_Statistical_Bulletin/stats17/agstat17.pdf. (accessed on 25 September 2018).
- Johnson, H.E.; Fischer, J.W.; Hammond, M.; Dorsey, P.D.; Walter, W.D.; Anderson, C.; VerCauteren, K.C. Evaluation of techniques to reduce deer and elk damage to agricultural crops. Wildl. Soc. Bull. 2014, 38, 358–365. [Google Scholar] [CrossRef]
- Leitch, J.A.; Linz, G.M.; Baltezore, J.F. Economics of cattail (Typha spp.) control to reduce blackbird damage to sunflower. Agr. Ecosyst. Environ. 1997, 65, 141–149. [Google Scholar] [CrossRef]
- Klosterman, M.E.; Linz, G.M.; Slowik, A.A.; Homan, H.J. Comparisons between blackbird damage to corn and sunflower in North Dakota. Crop Prot. 2013, 53, 1–5. [Google Scholar] [CrossRef] [Green Version]
- Eaton, R.A.; Lindell, C.A.; Homan, H.J.; Linz, G.M.; Maurer, B.A. American Robins (Turdus migratorius) and Cedar Waxwings (Bombycilla cedrorum) vary in use of cultivated cherry orchards. Wilson J. Ornithol. 2016, 128, 97–107. [Google Scholar] [CrossRef]
- Steensma, K.; Lindell, C.; Leigh, D.; Burrows, C.; Wieferich, S.; Zwamborn, E. Bird damage to fruit crops: A comparison of several visual deterrent techniques. In Proceedings of the 27th Vertebrate Pest Conference, Newport Beach, CA, USA, 7–10 March 2016; Timm, R.M., Baldwin, R.A., Eds.; University of California: Davis, CA, USA; pp. 196–203. [Google Scholar]
- Cook, A.; Rushton, S.; Allan, J.; Baxter, A. An evaluation of techniques to control problem bird species on landfill sites. Environ. Manag. 2008, 41, 834–843. [Google Scholar] [CrossRef] [PubMed]
- Summers, R.W. The effect of scarers on the presence of starlings (Sturnus vulgaris) in cherry orchards. Crop Prot. 1985, 4, 520–528. [Google Scholar] [CrossRef]
- Sayre, R.W.; Clark, L. Effect of primary and secondary repellents on European starlings: An initial assessment. J. Wildl. Manag. 2001, 65, 461–469. [Google Scholar] [CrossRef]
- Lindell, C.A.; Eaton, R.A.; Howard, P.H.; Roels, S.M.; Shave, M.E. Enhancing agricultural landscapes to increase crop pest reduction by vertebrates. Agric. Ecosyst. Environ. 2018, 257, 1–11. [Google Scholar] [CrossRef]
- Shave, M.E.; Shwiff, S.A.; Elser, J.L.; Lindell, C.A. Falcons using orchard nest boxes reduce fruit-eating bird abundances and provide economic benefits for a fruit-growing region. J. Appl. Ecol. 2018, 55, 2451–2460. [Google Scholar] [CrossRef] [Green Version]
- Herrnstadt, Z.; Howard, P.H.; Oh, C.-O.; Lindell, C.A. Consumer preferences for ‘natural’ agricultural practices: Assessing methods to manage bird pests. Renew. Agric. Food Syst. 2016, 6, 516–523. [Google Scholar] [CrossRef]
- Oh, C.-O.; Herrnstadt, Z.; Howard, P. Consumer willingness to pay for bird management practices in fruit crops. Agroecol. Sust. Food 2015, 39, 782–797. [Google Scholar] [CrossRef]
- Mulero-Pazmany, M.; Jenni-Eiermann, S.; Strebel, N.; Sattler, T.; Negro, J.J.; Tablado, Z. Unmanned aircraft systems as a new source of disturbance for wildlife: A systematic review. PLoS ONE 2017, 12, e0178448. [Google Scholar] [CrossRef] [PubMed]
- Swaddle, J.P.; Moseley, D.L.; Hinder, M.K.; Smith, E.P. A sonic net excludes birds from an airfield: Implications for reducing bird strike and crop losses. Ecol. Appl. 2016, 26, 339–345. [Google Scholar] [CrossRef] [PubMed]
- Brown, R. Laser Scarecrows: Gimmick or Solution? University of Rhode Island Vegetable Production Research Reports. Available online: http://digitalcommons.uri.edu/riaes_bulletin/25 (accessed on 30 October 2018).
- Friesen, M.; Beggs, J.R.; Gaskett, A.C. Sensory-based conservation of seabirds: A review of management strategies and animal behaviours that facilitate success. Biol. Rev. 2017, 92, 1769–1784. [Google Scholar] [CrossRef] [PubMed]
Figure 1.
Blueberries lost to birds in Michigan ‘Bluecrop’ fields. Error bars are standard deviations. n = number of blocks sampled.
Figure 1.
Blueberries lost to birds in Michigan ‘Bluecrop’ fields. Error bars are standard deviations. n = number of blocks sampled.

Figure 2.
Percent bird damage in Michigan Pinot noir vineyards. Error bars are standard deviations. n = number of blocks sampled.
Figure 2.
Percent bird damage in Michigan Pinot noir vineyards. Error bars are standard deviations. n = number of blocks sampled.

Figure 3.
Blueberries per sampled branch per day lost to birds in control and tubemen blocks, 2013 and 2014.
Figure 3.
Blueberries per sampled branch per day lost to birds in control and tubemen blocks, 2013 and 2014.

Figure 4.
Blueberries per sampled branch per day lost to birds in control halves of fields compared to halves of fields treated with Avian Control® in 2015.
Figure 4.
Blueberries per sampled branch per day lost to birds in control halves of fields compared to halves of fields treated with Avian Control® in 2015.


Table 1.
Summary of years, locations of studies in Michigan, and varieties of fruit.
| Crop | Study | Counties | Varieties of Fruit | Years |
|---|---|---|---|---|
| Blueberries | Influences on bird damage | Van Buren, Allegan, Berrien | Bluecrop | 2012–2014 |
| Inflatable tubemen | Van Buren, Eaton, Ottawa, Berrien | Bluecrop, Jersey | 2013–2014 | |
| Methyl anthranilate | Van Buren | Bluecrop | 2015 | |
| Grapes | Influences on bird damage | Leelanau, Grand Traverse | Pinot noir | 2012–2014 |
| Inflatable tubemen | Leelanau, Grand Traverse | Pinot noir | 2014 |
Table 2.
Generalized linear model results for influences on bird damage for blueberries and grapes.
| Crop | Explanatory Variables in Best Model | Estimate | Standard Error | DF | t-Value | p-Value | Lower C.L. | Upper C.L. |
|---|---|---|---|---|---|---|---|---|
| Blueberries | Yeartwo (2013) | 0.856 | 0.281 | 10 | 3.05 | 0.012 | 0.173 | 1.495 |
| Yearthree (2014) | 0.797 | 0.278 | 10 | 2.87 | 0.017 | −0.246 | 1.787 | |
| Grapes | Yeartwo (2013) | 1.060 | 0.438 | 8 | 2.42 | 0.0417 | 0.051 | 2.069 |
C.L.: Confidence limit. DF: Degrees of freedom.
Table 3.
Models compared for influences-on-bird-damage to blueberries.
| Model | AICc | Delta AICc | Likelihood | Akaike Weight |
|---|---|---|---|---|
| Yeartwo Yearthree | −34.27 | 0 | 1 | 0.39 |
| Yeartwo | −33.73 | 0.54 | 0.76 | 0.30 |
| Yeartwo Yearthree Forestpercentcat | −31.5 | 2.77 | 0.25 | 0.10 |
| Yeartwo Forestpercentcat | −31.24 | 3.03 | 0.22 | 0.09 |
| Null | −30.89 | 3.38 | 0.18 | 0.07 |
| Yearthree | −29.3 | 4.97 | 0.08 | 0.03 |
| Forestpercentcat | −28.55 | 5.72 | 0.06 | 0.02 |
| Yearthree Forestpercentcat | −26.59 | 7.68 | 0.02 | 0.01 |
| Yeartwo Yearthree Grower | −18.45 | 15.82 | 0.00 | 0.00 |
| Yeartwo Grower | −16.85 | 17.42 | 0.00 | 0.00 |
| Grower | −16.41 | 17.86 | 0.00 | 0.00 |
| Yearthree Grower | −14.01 | 20.26 | 0.00 | 0.00 |
| Yeartwo Yearthree Grower Forestpercentcat | −13.25 | 21.02 | 0.00 | 0.00 |
| Yeartwo Grower Forestpercentcat | −13.01 | 21.26 | 0.00 | 0.00 |
| Grower Forestpercentcat | −12.6 | 21.67 | 0.00 | 0.00 |
| Yearthree Grower Forestpercentcat | −9.38 | 24.89 | 0.00 | 0.00 |
AICc: Akaike information criterion corrected for small sample size.
Table 4.
Models compared for influences-on-bird-damage to grapes.
| Model | AICc | Delta AICc | Likelihood | Akaike Weight |
|---|---|---|---|---|
| Yeartwo | −85.19 | 0 | 1 | 0.39 |
| Yeartwo Numberforestedges | −82.91 | 2.28 | 0.32 | 0.12 |
| Yeartwo Yearthree | −82.42 | 2.77 | 0.25 | 0.10 |
| Null | −80.95 | 4.24 | 0.12 | 0.05 |
| Numberforestedges | −80.53 | 4.66 | 0.10 | 0.04 |
| Yeartwo Yearthree Numberforestedges | −79.9 | 5.29 | 0.07 | 0.03 |
| Yearthree | −79.01 | 6.18 | 0.05 | 0.02 |
| Yearthree Numberforestedges | −77.97 | 7.22 | 0.03 | 0.01 |
| Yeartwo Grower | −38.98 | 46.21 | 0.00 | 0.00 |
| Grower | −35.05 | 50.14 | 0.00 | 0.00 |
| Yeartwo Grower Numberforestedges | −27.64 | 57.55 | 0.00 | 0.00 |
| Yeartwo Yearthree Grower | −26.59 | 58.6 | 0.00 | 0.00 |
| Yearthree Grower | −25.59 | 59.6 | 0.00 | 0.00 |
| Grower Numberforestedges | −24.71 | 60.48 | 0.00 | 0.00 |
| Yearthree Grower Numberforestedges | −12.83 | 72.36 | 0.00 | 0.00 |
| Yeartwo Yearthree Grower Numberforestedges | −12.04 | 73.15 | 0.00 | 0.00 |
Table 5.
Estimates of fruit-eating bird abundance in Michigan blueberries and grapes. Means are per point count area.
Table 5.
Estimates of fruit-eating bird abundance in Michigan blueberries and grapes. Means are per point count area.
| Credible Intervals | |||||
|---|---|---|---|---|---|
| Crop | Year | Mean | Standard Deviation | 2.5% | 97.5% |
| Blueberries | 2012 | 22.12 | 14.61 | 10.24 | 54.95 |
| 2013 | 9.75 | 27.10 | 1.35 | 57.83 | |
| Grapes | 2012 | 1.88 | 4.46 | 0.13 | 11.01 |
| 2013 | 4.30 | 9.22 | 0.27 | 27.34 |
© 2018 by the authors. Licensee MDPI, Basel, Switzerland. This article is an open access article distributed under the terms and conditions of the Creative Commons Attribution (CC BY) license (http://creativecommons.org/licenses/by/4.0/).
Share and Cite
MDPI and ACS Style
Lindell, C.A.; Hannay, M.B.; Hawes, B.C. Bird Management in Blueberries and Grapes. Agronomy 2018, 8, 295. https://0-doi-org.brum.beds.ac.uk/10.3390/agronomy8120295
AMA Style
Lindell CA, Hannay MB, Hawes BC. Bird Management in Blueberries and Grapes. Agronomy. 2018; 8(12):295. https://0-doi-org.brum.beds.ac.uk/10.3390/agronomy8120295
Chicago/Turabian StyleLindell, Catherine A., Melissa B. Hannay, and Benjamin C. Hawes. 2018. "Bird Management in Blueberries and Grapes" Agronomy 8, no. 12: 295. https://0-doi-org.brum.beds.ac.uk/10.3390/agronomy8120295
Note that from the first issue of 2016, this journal uses article numbers instead of page numbers. See further details here.