Performance and Stability of Commercial Wheat Cultivars under Terminal Heat Stress


Crop Science Department, Faculty of Agriculture, Damanhour University, Damanhour 22516, Egypt
Agronomy 2018, 8(4), 37; https://0-doi-org.brum.beds.ac.uk/10.3390/agronomy8040037
Submission received: 16 March 2018
/
Revised: 20 March 2018
/
Accepted: 27 March 2018
/
Published: 29 March 2018
(This article belongs to the Special Issue Biotic and Abiotic Stress Responses in Crop Plants)
Abstract
:Egypt, the fifteenth most populated country and the largest wheat importer worldwide, is vulnerable to global warming. Ten of the commercial and widely grown wheat cultivars were planted in two locations, i.e., Elbostan and Elkhazan for three successive seasons 2014/2015, 2015/2016, and 2016/2017 under two sowing dates (recommended and late). Elbostan and Elkhazan are the two locations used in this study because they represent newly reclaimed sandy soil and the Nile delta soil (clay), respectively. A split-plot, with main plots arranged as a randomized complete block design and three replicates, was used. The overall objective of this study was to identify the ideal cultivar for recommended conditions and heat stressed conditions. The results revealed that heat stress had a significant adverse impact on all traits while it raised the prevalence and severity of leaf and stem rust which contributed to overall yield losses of about 40%. Stability measurements, the additive main effects and multiplicative interaction model (AMMI) and genotype main effect plus genotype × environment interaction (GGE), were useful to determine the ideal genotypes for recommended and late sowing conditions (heat stressed). However, inconsistency was observed among some of these measurements. Cultivar “Sids12” was stable and outperformed other tested cultivars under combined sowing dates across environments. However, cultivar “Gemmeiza9” was more stable and outperformed other cultivars across environments under the recommended sowing date. Moreover, cultivar “Gemmeiza12” was the ideal cultivar for the late sown condition. Based on our findings, importing and evaluating heat stress tolerant wheat genotypes under late sown conditions or heat stressed conditions in Egypt is required to boost heat stress tolerance in the adapted wheat cultivars.
1. Introduction
Wheat (Triticum aestivum L.) accounts for 30% of the cereal grains production while providing 55% of the carbohydrates and 20% of the food calories consumed globally [1]. Thus, wheat is considered a strategic cereal crop for several countries around the globe including Egypt, in which wheat production became one of the crucial elements of food security [2]. Furthermore, wheat is cultivated and grown in a wide range of environmental and climatic conditions [3]. Therefore, the impact of climate change is expected to affect wheat production in several regions around the globe. The Mediterranean basin is one of the regions (hot spots) that is expected to have an annual mean temperature increase of 3 to 4 °C, which might lead to total grain yield reduction of about 18% to 24% [4]. Heat stress was defined as the rise in temperature for a period and beyond the point that causes irreversible damage to the plant growth and development [5].
The impact of heat stress on several aspects of wheat phenology and physiology during the reproductive stage was studied by several researchers, in which they reported that heat stress trigger senescence-related metabolic changes in wheat [6]. Heat stress decreases photosynthesis as a result of photosystem II (PSII) inhibition [7,8,9,10]. Moreover, during the reproductive stage, heat stress decreased the grain-filling duration significantly [11], increased floral abortion, and decreased the number of seeds [12,13,14]. Nevertheless, heat stress significantly increased protein concentration, but with lower end-use quality because the functionality of protein was reduced by the high temperature [15]. The increased protein concentration under terminal heat stress could be due to upregulation of heat shock proteins (HSPs) which is a plant mechanism to alleviate the effect of heat stress [16]. In wheat, 6560 probe sets for HSPs displayed expression upregulation under heat stress treatment of 34 °C and 40 °C [16].
Conceptually, the phenotype (P) of any plant is a result of the genotype (G), the environment (E), and the genotype–environment interaction (G × E). Based on this concept, one can cope with the negative impact of the heat stress either by altering the environment or using heat stress tolerant genotypes. Exploring highly adapted local genotypes to identify heat stress tolerant wheat genotypes is the first step to start a wheat breeding program for heat stress [5,17,18]. Whereas, if the breeder was able to find high yielding and stress tolerant genotype, then years of evaluation and crosses to develop such a cultivar can be saved. Plant breeders always look for genotypes that perform better across environments with minimal G × E interaction, but that seldom occurs, especially under the dynamic weather conditions and the fluctuations in the environmental conditions from year to year and location to location. Thus, measuring the stability of a given cultivar is an essential criterion before releasing new cultivars. Selecting superior genotypes using stability measurements instead of average performance is highly recommended because genotypes selected using stability measures are more reliable across environments with a minimized G × E interaction, or the provide a predictable response across environments. Studies have shown that stability analyses according to various measures can result in better identification of stable genotypes, even when there were no interactions among the measures [19]. Stability and G × E measurements can be classified into parametric and non-parametric measurements [20]. The most frequently utilized two parametric stability methods are partitioning of G × E interaction [21] and the regression model [22]. The additive main effects and multiplicative interaction model (AMMI) [23] and the genotype main effect plus G × E interaction (GGE) [24] are the most frequently utilized non-parametric methods. Both AMMI and GGE biplot analyses are based on the principal component analysis (PCA). However, GGE biplot is based on environment-centered principal component (PCA), whereas AMMI analysis is a double centered PCA method [25].
In the current study, ten wheat cultivars that represent around 60% of the commercially grown wheat cultivars in Egypt (based on 2017/2018 grown wheat cultivars) were evaluated under recommended and late sowing conditions (heat stressed). These cultivars were used to study the effect of heat stress (late sown) on several physiological and morphological traits. Egypt, the fifteenth most populated country worldwide, is one of the Mediterranean basin countries that is vulnerable to the effects of global warming [26]. In addition to the impact of the global warming, the Egyptian population is projected to be 125,870,736 inhabitants in 2030, which will require the production of more wheat grain. The recommended sowing date for wheat in Egypt is around mid-November. However, due to limited availability of land and water, several growers in Egypt tend to grow wheat after sugar beet (Beta vulgaris L.), carrot (Daucus carota L.), or pea (Pisum sativum L.), which results in sowing wheat around Mid-January. These later sowing dates expose wheat plants to terminal heat stress during the reproductive stage.
Therefore, evaluating wheat cultivars for heat tolerance has environmental and socioeconomic importance in this region of the world. Although screening for heat stress tolerance in wheat has been done in the past, limited research was conducted to study the effect of heat stress on the grain yield stability or wheat resistance to leaf and stem rust using commercial newly developed wheat cultivars under clay and sandy soils across three successive growing seasons. Thus, the primary objectives of this study were to; 1—evaluate ten of the commercially and widely distributed wheat cultivars under heat stressed and recommended (control) conditions across several environments. 2—Study the relationships among relevant phenological and physiological traits under normal and heat stress conditions.
2. Materials and Methods
2.1. Plant Materials and Field Conditions
Ten of the commercially widely distributed Egyptian wheat cultivars were used in this study (Table 1). The studied materials were planted in three successive growing seasons, i.e., 2014/2015, 2015/2016, and 2016/2017, in two locations; Elkhazan (31°05′35.2″ N, 30°30′10.4″ E) and Elbostan (30°45′19.4″ N, 30°29′04.8″ E), Behera governorate, Egypt. In each growing season for both locations, two sowing dates were used, i.e., recommended and late sown dates. The recommended sowing dates were 19, 12, 14 of November for 2014/2015, 2015/2016, and 2016/2017, respectively. While the late-sown dates were 7, 9, 13 of January, for 2014/2015, 2015/2016, and 2016/2017, respectively. A Split-plot, with main plots arranged as a randomized complete block design and three blocks, was used. The two sowing dates were randomly assigned to the main plots within each of the three blocks. The ten wheat cultivars were assigned randomly to the subplots within each main plot (sowing date). The experimental units (plots) were two meters long and four rows wide by 25 cm between rows. The surrounding border of the experimental areas of one meter wide, planted with the wheat cultivar “Morocco”, a “spreader” cultivar so named because it is susceptible to currently prevalent races of leaf and stem rust. Standard agronomic practices including recommended fertilization and irrigation schedules were followed.
2.2. Phenotypic Measurements
The number of days to flowering date was recorded visually as the number of days to anther exertion from 50% of the main spikes (days). Leaf area (LA) was estimated on three samples according to the following equation [25]:
where L and W are the length and width, respectively, of the flag leaf.
Leaf area (LA) = L × W × 0.75
Plant height was measured on a random sample of five plants in each plot as the distance from the soil surface to the tip of the spike awns excluded at harvest time (cm). Grain yield was measured by harvesting the four rows of each plot (tons/ha). Total leaf chlorophyll content (SPAD index) estimated using spad-502 chlorophyll meter (spad-502 plus, Konica Minolta, Kearney, NE, USA), during the flowering stage. Canopy temperatures (Tc) were measured using a handheld infrared thermometer (KM 843, Comark Ltd., Hertfordshire, UK) with a field view of 100 mm to 1000 mm. Canopy temperatures (Tc) data were taken from the same side of each plot at 1m distance from the edge and approximately 50 cm above the canopy at an angle of 30° to the horizontal. Readings were made between 1300 and 1500 h on sunny days. Grain filling duration (GFD) was measured from flowering to physiological maturity (when the peduncle changed color). Leaf and stem rust screening under recommended and late sown conditions were conducted using the modified Cobb’s scale described by Peterson et al. [26]. The infection type was expressed in the following types, i.e., Immune = 0, R = resistant, small uredinia surrounded by necrosis; MR = Moderately resistant, medium to large uredinia surrounded by necrosis; MS = moderately susceptible, medium to large uredinia surrounded by chlorosis; S = susceptible, large uredinia without necrosis or chlorosis [27]. The statistical analysis was conducted on the infection type after replacing the infection types with 0, 0.2, 0.4, 0.80, and 1 scores for immune, resistant, moderately resistant, moderately susceptible, and susceptible, respectively.
2.3. Statistical Analysis
Analysis of variance was carried out using SAS 9.2 (SAS v9.2; SAS Institute Inc., Cary, NC, USA), by fitting the following linear model [27]:
where Yijlm is the response measured on the ijlm plot, µ is the overall mean, Ei is the effect of ith environment (three seasons and two locations which compose six environments), EB(i)j is jth block nested within ith environment, Tl is the effect of the lth sowing date, ETil is the interaction between ith environment and lth sowing date, TBE(i)jl is interaction between lth sowing date and jth replicates within ith environment as an error term for environment, sowing date, and environment × sowing date. Gm is the effect of mth cultivar, ETGilm is the interaction effect among ith environment, lth sowing date, and Gth cultivar, and ԑijlm is the experimental error.
Yijlm = µ + Ei + EB(i)j + Tl + ETil + TBE(i)jl + Gm + EGim + ETGilm + ԑijlm
Means were compared using the least significance difference (LSD) test at p-value < 0.05, according to Gomez and Gomez [28]. Homogeneity of the variance in different environments was tested following Bartlett’s Test [29]. Combined analyses of variance were performed among the different environments with homogeneous variance, as outlined by Cochran and Cox [30]. Correlation coefficients were conducted using Pearson correlation coefficient.
2.4. Stability Analysis and Genotype × Interaction (G × E)
The following stability measurements were performed on grain yield under the six environments (three seasons and two locations which compose six environments), i.e., coefficient of variability (CVi) [31], regression coefficient (bi) [22], Wricke’s ecovalance (Wi) [32], superiority measure (Pi) [21], Perkins and Jinks (Di) [33], and average absolute rank difference of genotype on the environment (Si(1)) [24] . Moreover, the additive main effects and multiplicative interaction model (AMMI) [23] was applied on the grain yield variable for each sowing date separately, and after combing them. Then the genotype main effect plus G × E interaction (GGE biplot) [24] was used to visualize the G × E interaction. The stability and G × E analysis was conducted using R (software) package GEA-R (Version 4.0, 2017, CIMMYT, El Batán, Mexico) [34].
3. Results
3.1. Analysis of Variance
The analysis of variance for total chlorophyll content, canopy temperature, leaf area, grain filling duration, plant height, grain yield, leaf rust scores, stem rust scores, and the number of days to flowering are presented in Table 2. The results indicated highly significant effect (p-value < 0.01) for the six environments (three growing seasons and two locations which compose six environments) on all traits except for leaf rust scores and stem rust scores, in which the environmental effect was not found to be statistically significant. Furthermore, sowing dates (Sd) had a highly significant effect on all traits. More importantly, the analysis of variance revealed highly significant variance among the studied cultivars. Our results suggested that the magnitude of differences among cultivars was sufficient to provide a scope to characterize the effect of terminal heat stress (late sown condition). All traits except leaf and stem rust scores, had significant two-way and three-way interactions (environments × cultivars, environments × sowing dates, sowing dates × cultivars and environments × sowing dates × cultivars) effects. As for leaf and stem rust scores, the interaction effect of environments × cultivars and sowing dates × cultivars found to be highly significant, while the interaction effect of environments × sowing dates × cultivars was not statistically significant.
The late sown condition had a significant adverse effect on the total chlorophyll content, leaf area, grain filling duration, plant height, and grain yield. The average of the total chlorophyll content measured for all cultivars under recommended and late sown condition was 31.9 and 28.5, respectively. Moreover, the late sown condition decreased leaf area from 35.15 to 23.5 cm2. In the same manner, the late sown condition shortened the grain filling duration from 32.5 days to 25.5 days. The late sown condition had an adverse effect on plant height in which mean plant height across cultivars was dropped from 83.00 cm to 56.77 cm. Moreover, the late sown condition increased canopy temperature from 32.76 °C to 56.16 °C. Furthermore, the late sown condition decreased overall resistance to leaf rust (leaf rust scores increased from 0.34 to 0.73) and stem rust (stem rust scores increased from 0.36 to 0.79).
Results in Table 3 illustrate the effect of sowing date on the response of the studied cultivars for the total chlorophyll content, canopy temperature, leaf area, grain filling duration, plant height, grain yield, and leaf and stem rust scores across environments. Cultivar “Giza168” exhibited the tallest plants (95.8 and 64.9 cm), while the shortest plants were for cultivar “Gemmeiza10” (65.7 and 52.2 cm) obtained from recommended and late sown conditions, respectively. Furthermore, cultivar “Gemmeiza12” produced the highest grain yield (8.8 ton/hectare) under the recommended sowing date. While cultivar “Gemmeiza9” produced the highest grain yield (4.87 ton/hectare) under the late sown condition. Results in Table 3 indicated that cultivars Gemmeiza10 and Gemmeiza12 flowered earlier than other cultivars under the recommended and late sown conditions. Recommended sowing date extended the number of days to flowering for all cultivars across environments. Results of the adult plant resistance to leaf and stem rust indicated a negative impact of late sowing date on wheat resistance to both stem and leaf rust. Among the ten wheat cultivars tested based on the infection type (IT) and under the recommended sowing date, five cultivars were resistant to leaf rust, i.e., Gemmeiza9, Gemmeiza10, Gemmeiza12, Giza168, and Sids13. Furthermore, Sids12, Gemmeiza7, and Gemmeiza11 were moderately resistant to leaf rust. Whereas, Sakha94 was susceptible to leaf rust under the recommended sowing date. Under late sowing date, Gemmeiza9, Gemmeiza11, and Sids12 showed moderate resistance (MR) to leaf rust across all environments, while the rest of the cultivars were moderately susceptible or susceptible to leaf rust. Moreover, the stem rust results under recommended sowing date indicated that five wheat cultivars were stem rust resistant, i.e., Sids12, Sakha94, Gemmeiza10, Gemmeiza11, and Gemmeiza12, across all environments. Furthermore, Gemmeiza7, Gemmeiza9, and Misr2 were moderately resistant to stem rust, but Giza168 and Sids13 were susceptible. Nevertheless, stem rust results obtained from the late sowing date indicated that Sids12, Gemmeiza9, and Gemmeiza11 were moderately resistant, but Gemmeiza7, Gemmeiza10, Gemmeiza 12, Misr2, Sakha94, Giza168, and Sids13 were susceptible.
Even though wheat cultivars showed highly significant variance across environments for total chlorophyll content, the range of difference among values was rather narrow (Table 3). Cultivar Giza168 exhibited the highest values for total chlorophyll content (33.5 SPAD units) while the lowest values were for cultivar “Gemmeiza11” (30.7 SPAD) obtained from the recommended sowing date. Furthermore, under the late sown condition, cultivar “Sids13” has the highest total chlorophyll content value (29.5 SPAD). Besides, canopy temperature measurement indicated higher values on all cultivars under the recommended sowing date compared to the late sown condition. As shown in Table 3, cultivar “Gemmeiza9” had the highest canopy temperature (37.1) under the recommended sowing date. Cultivar “Misr2” had the highest canopy temperature (60.4) under the late sown condition. Significant reduction in leaf area due to the late sown condition was also detected. Leaf areas under the recommended sowing date ranged from 38.6 to 29.9 cm2 for cultivars Gemmeiza7 and Sakha94, respectively. However, leaf area ranges from 25.2 to 20.1 cm2 for the same cultivars under late sown condition. Under the recommended sowing date, grain filling duration ranged from 34.8 to 28.3 days for cultivars Gemmeiza7 and Sakha94, respectively. Furthermore, under the recommended sown date, cultivar “Misr2” had the most extended grain filling duration (34.9 days). Nevertheless, under the late sown condition cultivar, Gemmeiza9 had the most extended grain filling duration (29.3 days).
3.2. Interrelationships among the Studied Traits under Recommended Sown Condition
Pearson correlation coefficients among the studied traits under the recommended sowing date (normal) are presented in Table 4 (above diagonal). Results in Table 4 indicated significant positive correlation (p-value < 0.05) among total chlorophyll content, leaf area, and plant height. Significant negative correlation was detected for the relationship among total chlorophyll content, the number of days to flowering and leaf rust. However, non-significant correlation (p-value > 0.05) of total chlorophyll content with canopy temperature, grain filling duration, grain yield, and stem rust was detected (Table 4, above diagonal). There was a significant positive correlation between canopy temperature and leaf area. Furthermore, canopy temperature was negatively correlated with the number of days to flowering. A non-significant correlation was detected for the canopy temperature with grain filling duration, plant height, grain yield, and leaf and stem rust scores. Correlations of leaf area with grain filling duration, plant height, and grain yield were significant and positive. Whereas, the correlation of leaf area with stem rust and number of days to flowering were significant but negative. Grain filling duration was positive and significantly correlated with grain yield, but it was negative and significantly correlated with stem rust and the number of days to flowering. No significance was detected for the correlation among grain filling duration, plant height, and leaf rust. Plant height was significantly and positively correlated with grain yield but significantly and negatively correlated with both stem rust and number of days to flowering. Additionally, non-significant correlation was detected for plant height with stem and leaf rust scores. Grain yield was significantly and negatively correlated with the number of days to flowering and stem rust, but it was not significantly correlated with leaf rust scores. The correlation between leaf rust and number of days to flowering was positive and significant. The correlation between stem and leaf rust was significant. Finally, the correlation between stem rust and number of days to flowering was not significant.
3.3. Interrelationships among the Studied Traits under the Late Sown Condition
The Pearson correlations coefficients among the studied traits under the late sown condition are presented in Table 4 (below diagonal). The correlation of total chlorophyll content with leaf area, grain filling duration, plant height, and grain yield were significant and positive, but it was not significantly correlated with canopy temperature, leaf rust, stem rust, and the number of days to flowering. Canopy temperature was significantly and positively correlated with leaf and stem rust scores but negatively correlated with grain filling duration, grain yield, and the number of days to flowering. Non-significant correlation for canopy temperature with plant height and leaf area was detected. Leaf area was significantly and negatively correlated with leaf and stem rust, but it was significantly and positively correlated with grain filling duration, plant height, and grain yield. Furthermore, Leaf area was not significantly correlated with the number of days to flowering. Grain filling duration was significant and positively correlated with plant height and grain yield, but significant and negatively correlated with leaf and stem rust scores. However, non-significant correlation for grain filling duration with the number of days to flowering was detected. The correlation of plant height with grain yield was significant and positive. Plant height was significantly and negatively correlated with leaf rust scores, stem rust scores, and the number of days to flowering. Grain yield was significantly and negatively correlated with stem and leaf rust, but non-significant correlation was detected between grain yield and number of days to flowering. The correlation between leaf rust and stem rust scores was significant and positive. Furthermore, leaf rust was significant and negatively correlated with the number of days to flowering. Nevertheless, non-significant correlation between stem rust and the number of days to flowering was detected.
3.4. Genotype × Environment Interaction (G × E) for Grain Yield
Grain yield is a quantitative and complex trait that was found to be responsive to genotype by environment interaction (G × E). Additionally, grain yield is the most critical parameter that determines a cultivar’s acceptance by growers. Thus, in this part of the study, we performed stability analysis on the grain yield. The results of the stability parameters used in this study are presented in Table 5. Under the combined sowing dates (12 environments) model, i.e., two sowing dates, two locations and three years, Gemmeiza9 was the most stable cultivar in several measurements such as coefficient of variation (C.V%), Superiority measure (Pi) and Wrike’s ecovalence (Wi).Gemmeiza10 was the most stable cultivar for other measurements such as Regression coefficient (bi), and Perkins and Jinks (Di). However, Gemmeiza12 was the most stable genotype for the average absolute rank difference of genotype on the environment (Si(1)). Moreover, under the recommended sowing date, i.e., two locations and three years (six environments), coefficient of variation (C.V%), and Superiority measure (Pi) identified Sids12 to be the most stable cultivar. Wrike’s ecovalence (Wi) and average absolute rank difference of genotype on environment (Si(1)) identified Gemmeiza12 to be the most stable cultivar. Moreover, regression coefficient (bi) and Perkins and Jinks (Di) identified Gemmeiza10 to be the most stable cultivar. Furthermore, under the late sown condition, coefficient of variation (C.V%), Wrike’s ecovalence (Wi), Superiority measure (Pi), and the average absolute rank difference of genotype on the environment (Si(1)) identified Sids12 to be the most stable genotype. Furthermore, Giza168 was the most stable genotype under regression coefficient (bi) and Perkins and Jinks (Di).
The results of stability measures used in the current study indicated inconsistency among some of the stability measures used. Thus, to complement the results of the previous stability measures, Genotype by environment (G × E) was further investigated using the additive main effect and multiplicative interaction (AMMI) analysis (Table 6) and genotype main effect plus genotype × environment interaction (GGE). Additionally, two models were fitted in the AMMI and GGE biplot; the first was by considering sowing dates as part of the environments, i.e., 12 environments, while the second was by running the AMMI analysis across years and locations within each sowing date, i.e., six environments. In the first model (12 environments), the analysis of variance for AMMI model indicated significant effect of the environments, genotypes, and genotype × environment interaction. Whereas the variance of the environment was 63.2%, while the variance due to genotypes was 14.6% and that for genotype × environment interaction was 22.2%. In the second model (6 environments within each sowing date), the variance of the AMMI model for the recommended sowing date was 29.52%, 46%, and 24.48% for the environment, genotypes, and genotypes–environment interaction, respectively. Moreover, the variance of the AMMI model for the late sown condition was 12.99%, 48.57%, and 38.44% for the environment, genotypes, and genotypes–environment interaction, respectively. In both models, the genotype–environment interaction was highly significant (p-value < 0.01) implying differential response of genotypes to environments. Substantial variance for the environment in the first model compare to the second model was detected, which indicates an amplification effect of sowing dates on the environmental effect.
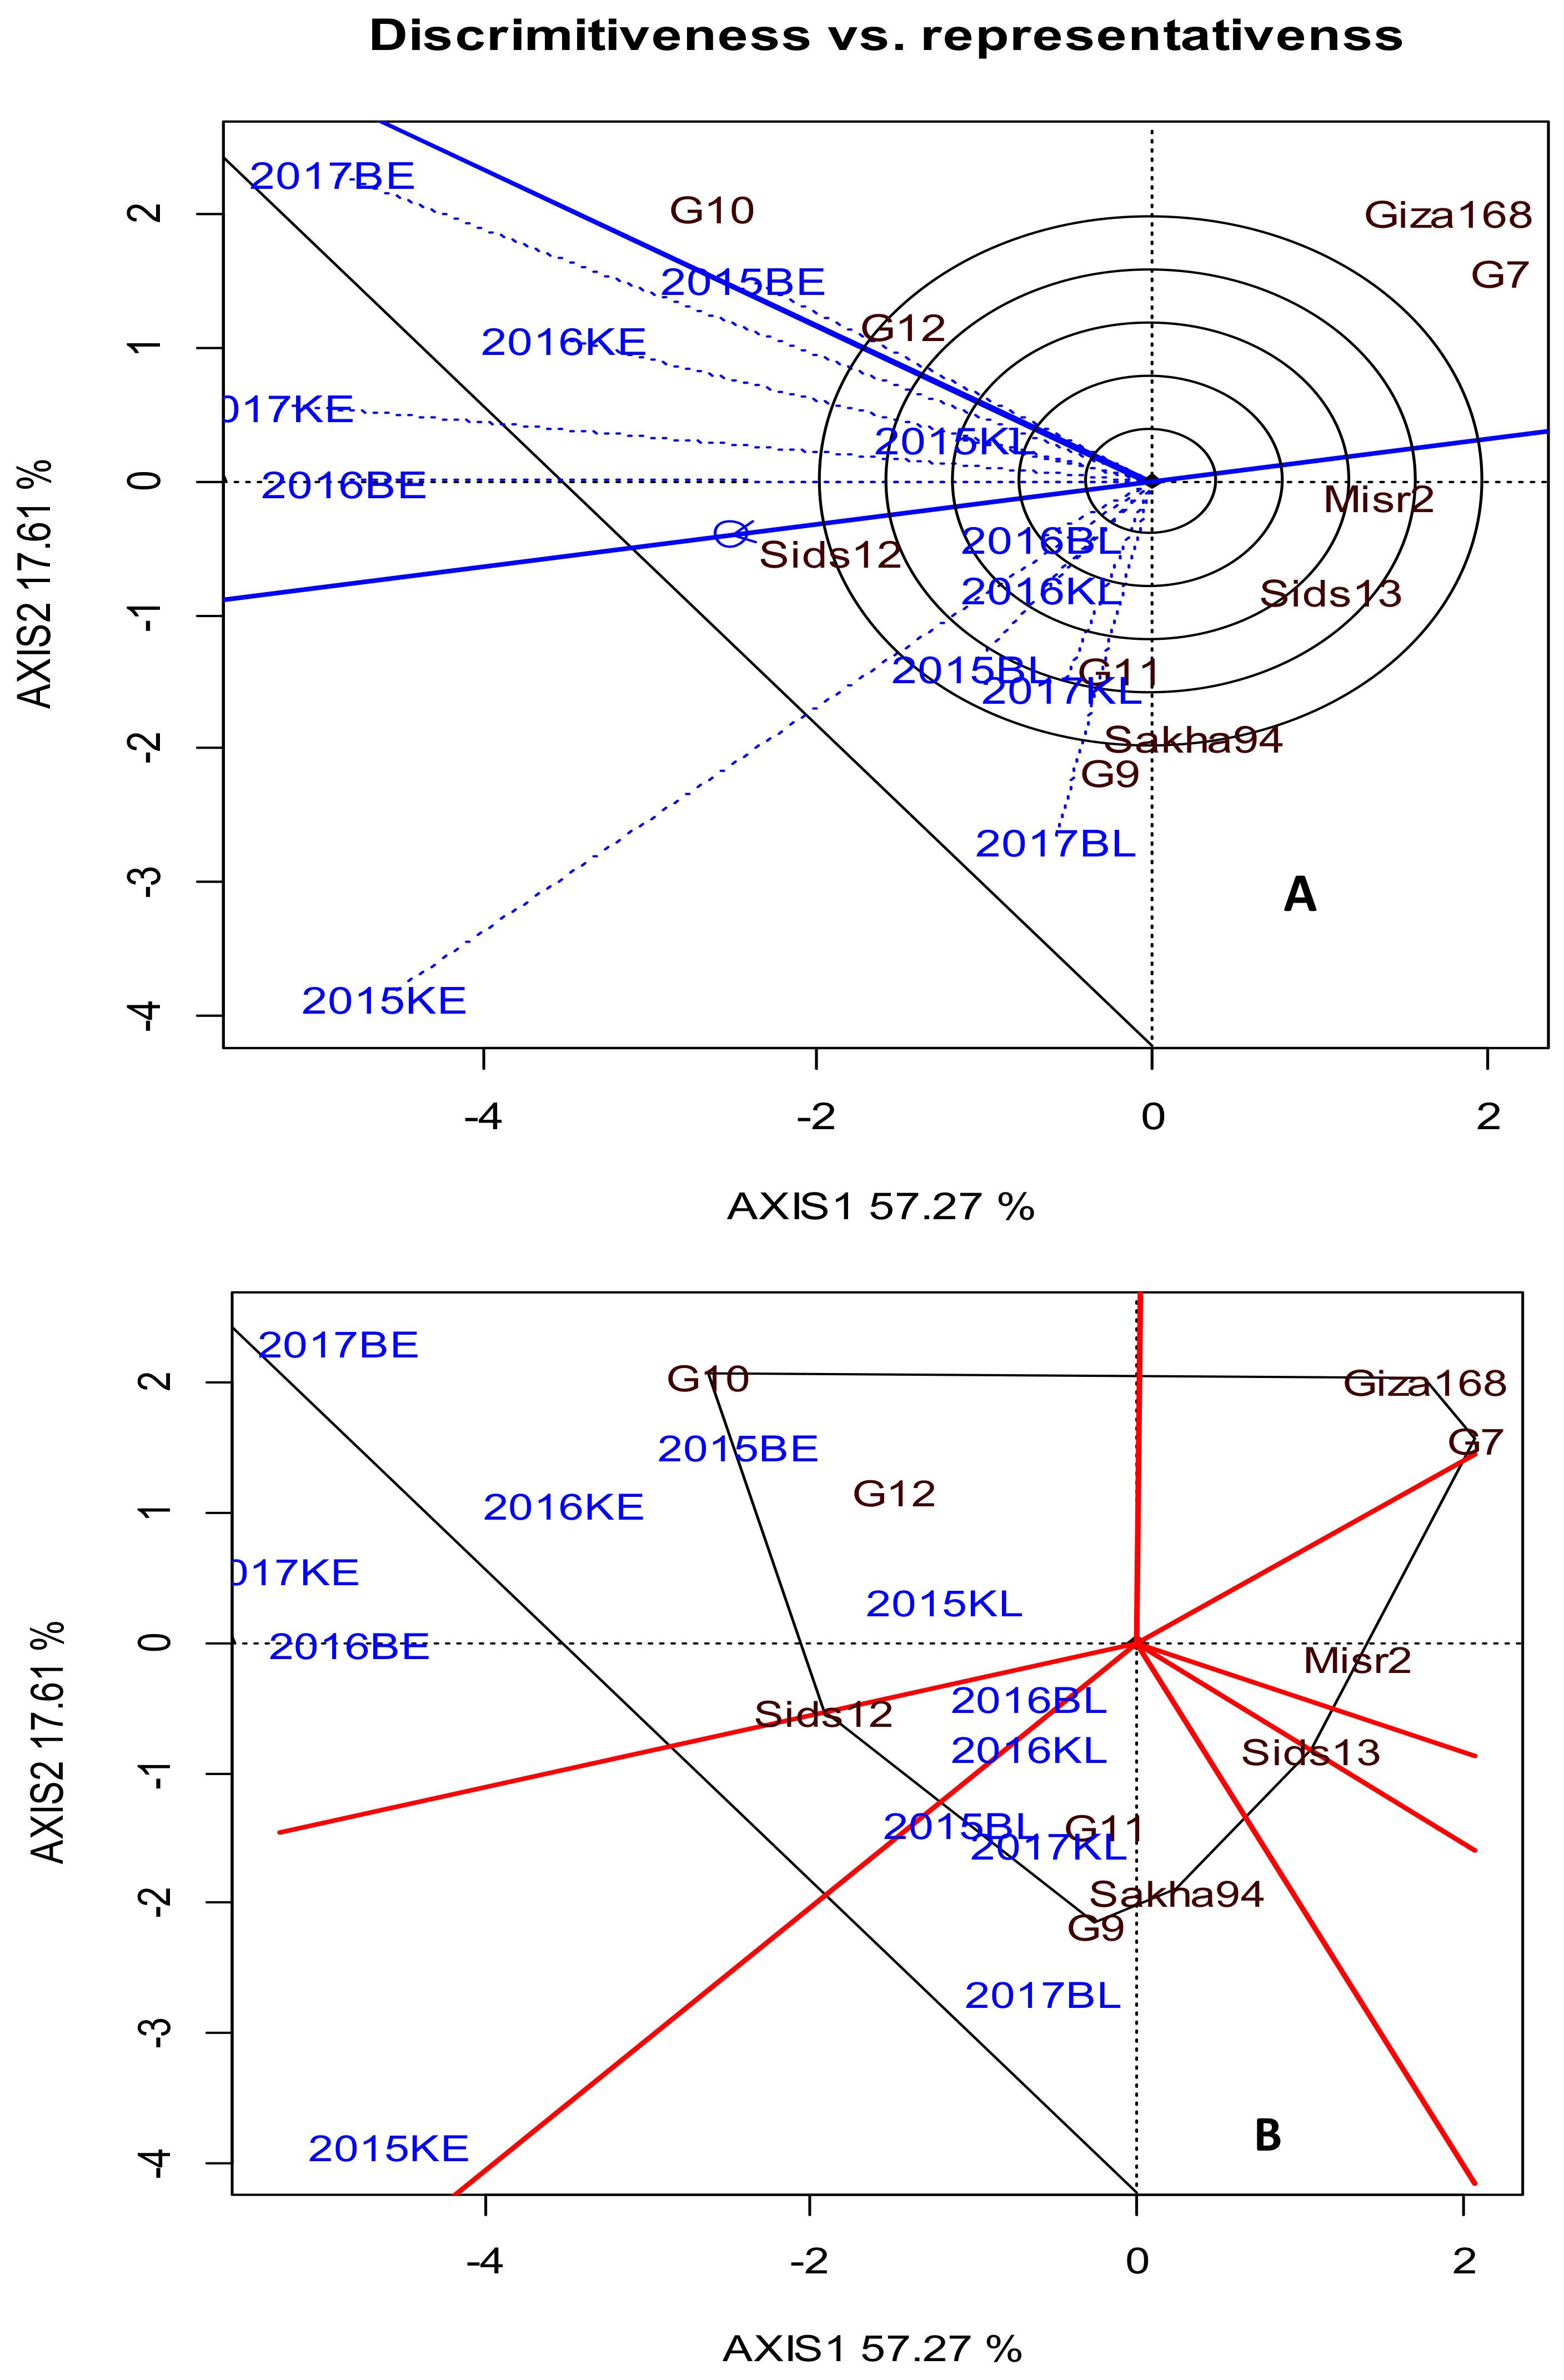
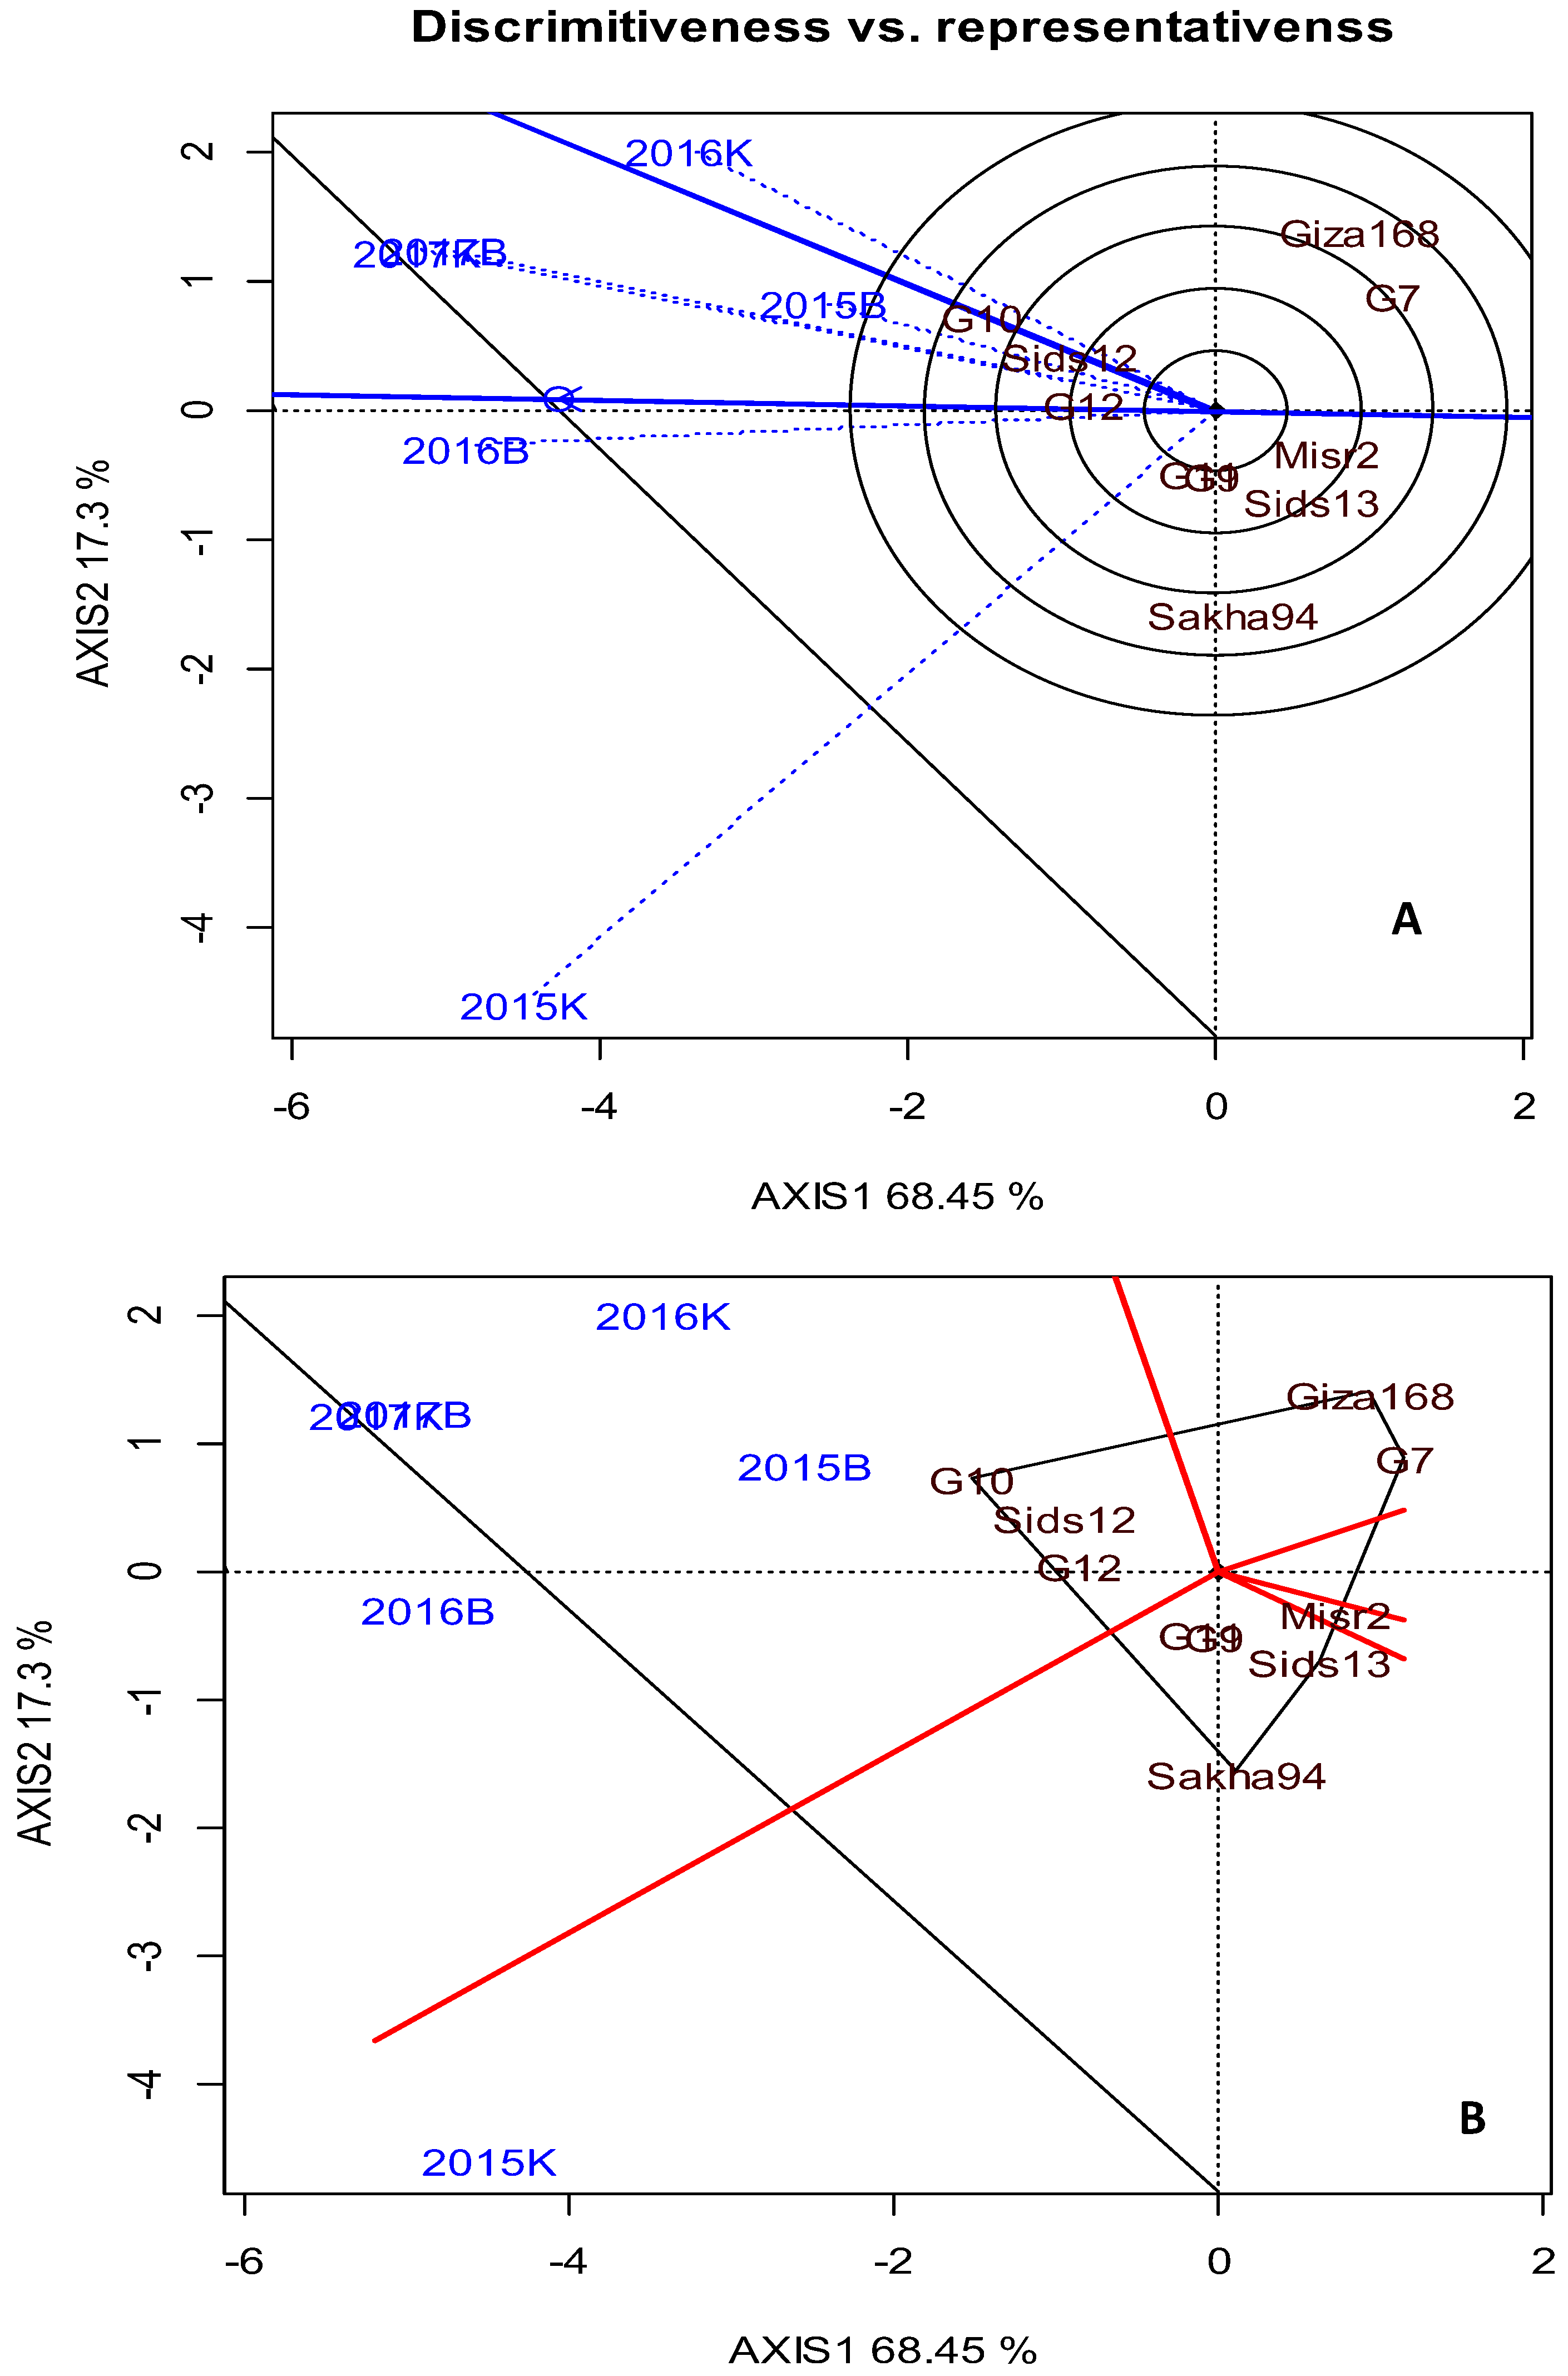
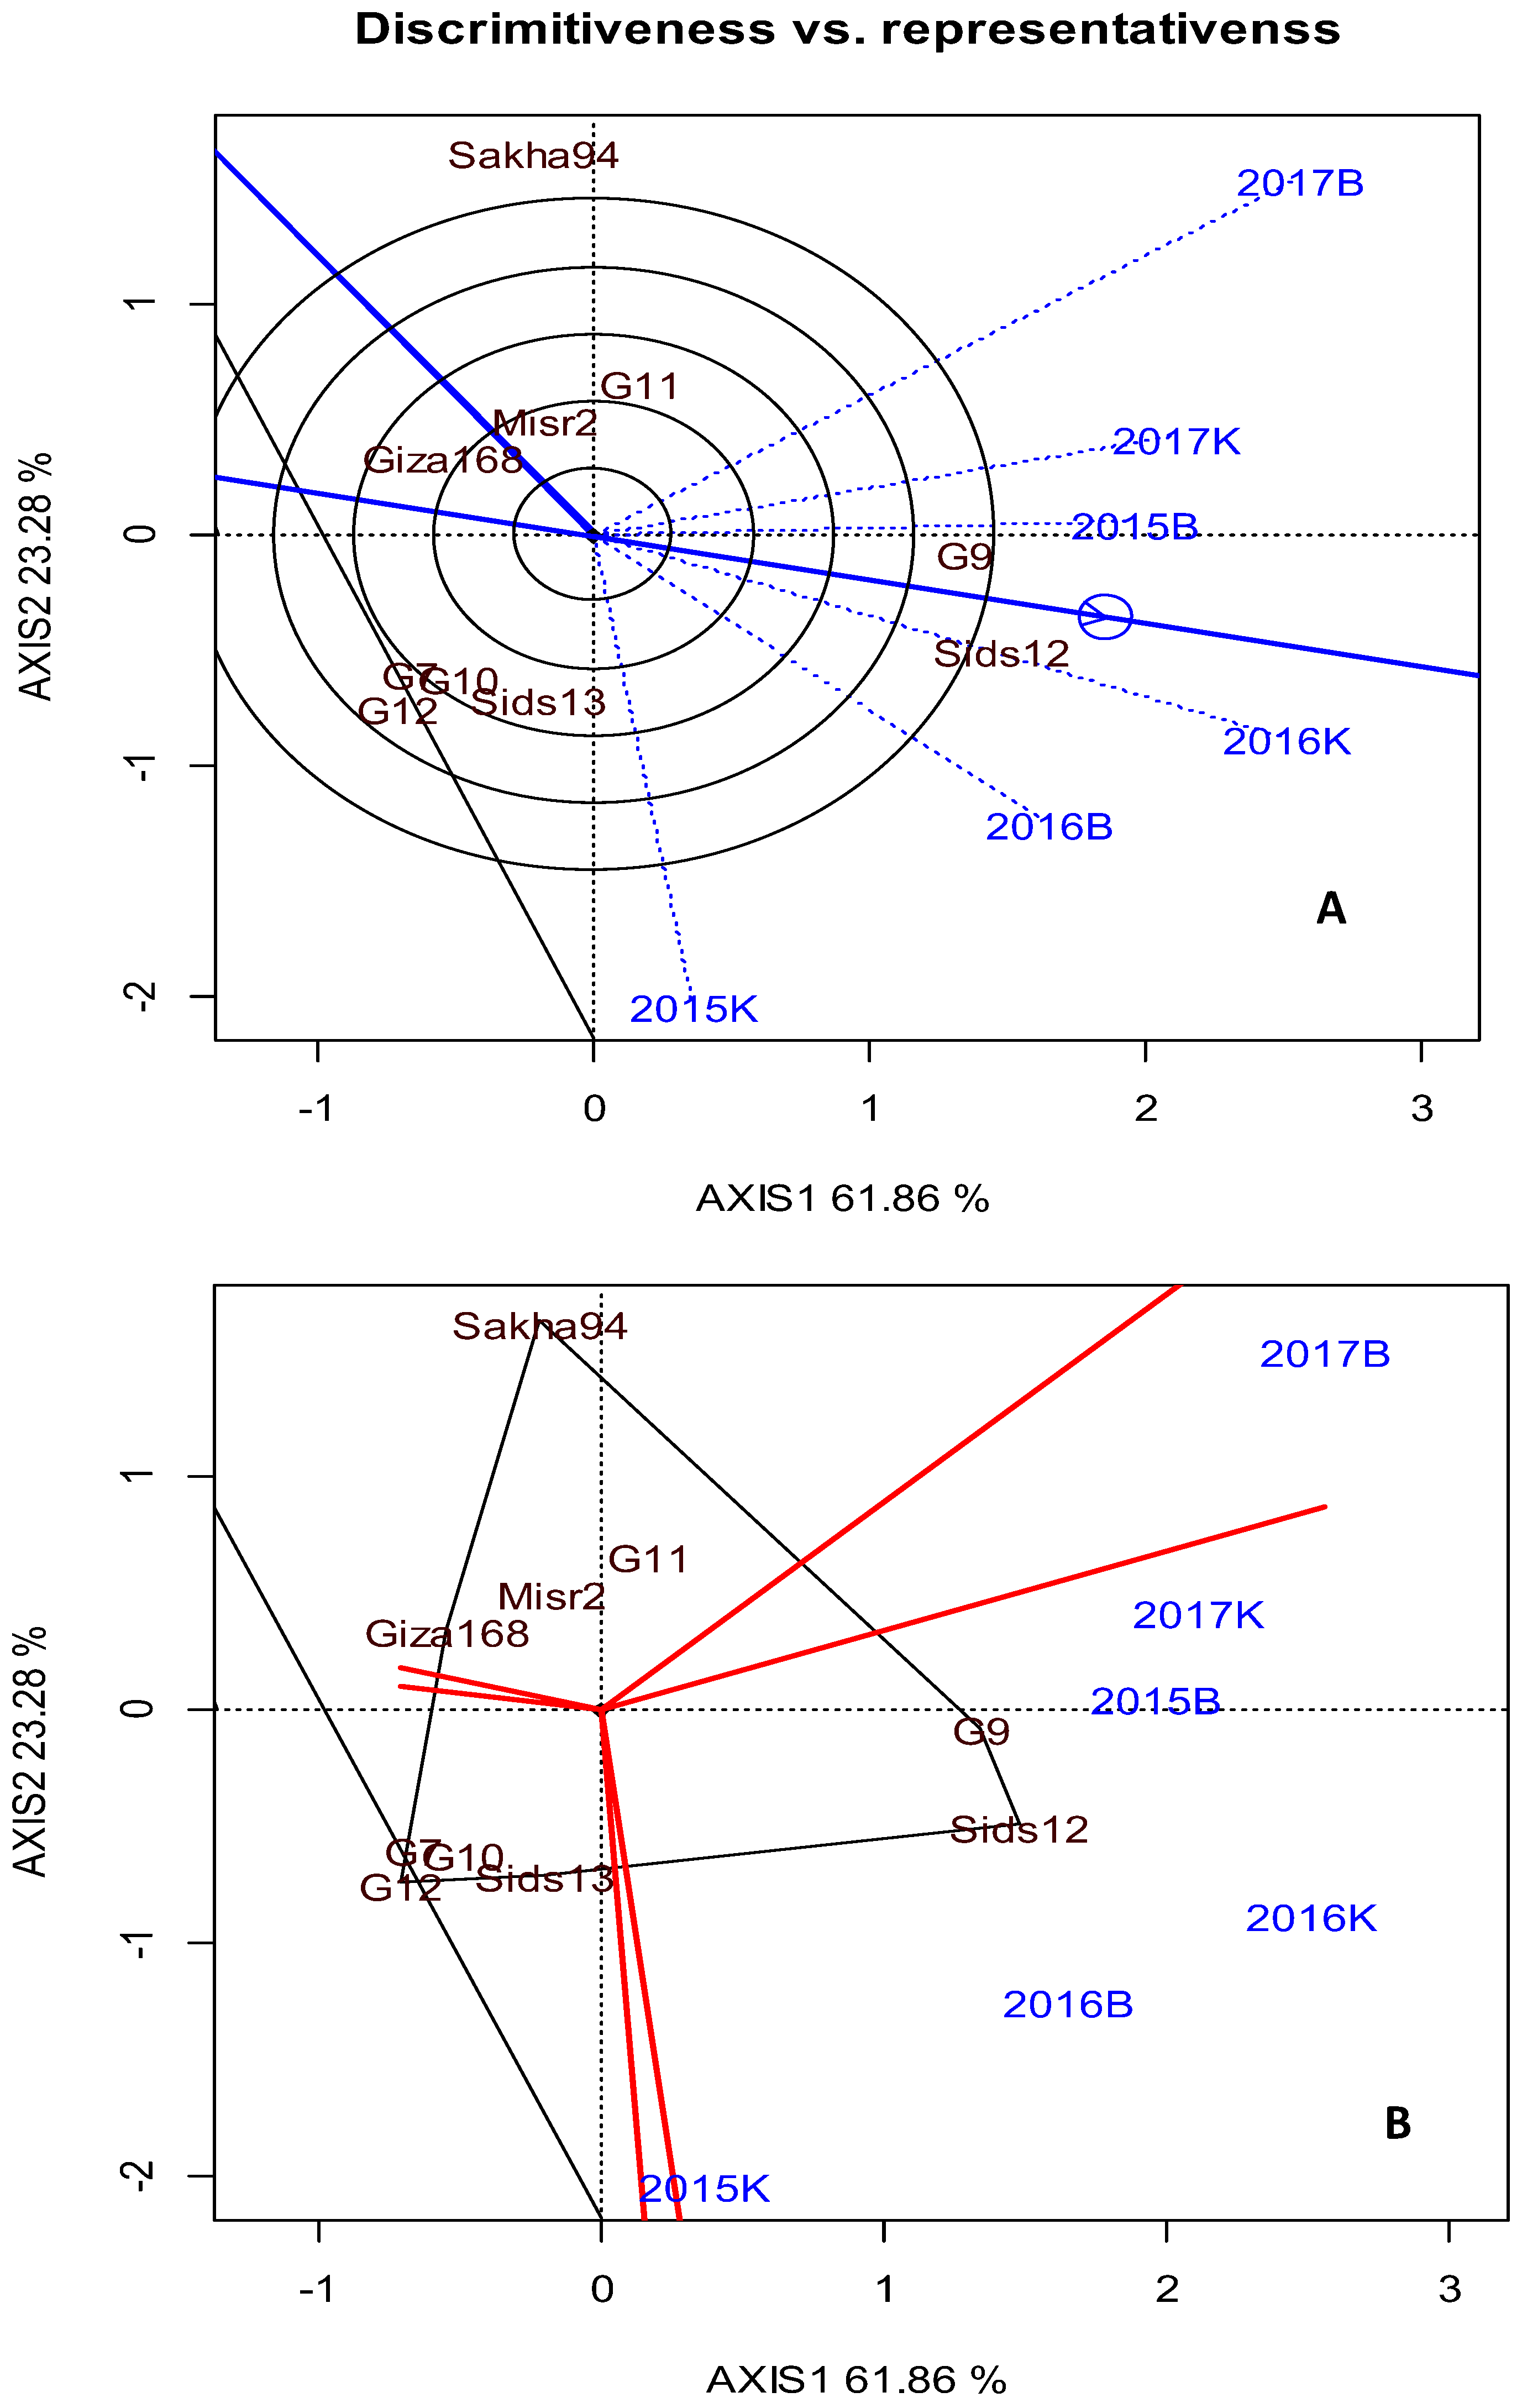
Based on AMMI analysis, the genotype–environments interaction was divided into three main principal components that explain 87.2% of the total variance under the first model (combined sowing dates). Furthermore, the first three principal components explained 92.08% and 96.16% of the interaction between genotype and environment under recommended and late sown conditions, respectively. A graphical representation of the relationship between cultivars and sowing dates across environments regarding grain yield is shown in a GGE biplot (Figure 1A,B). The previous biplot and the AMMI analysis of variance indicated a variable response of the genotypes under the two sowing dates. Therefore, in addition to running the biplot and stability analysis on the combined sowing dates, it was refitted within each sowing date. Thus, three biplots were generated; for combined, early, and late sown conditions (Figure 1, Figure 2 and Figure 3). For the three biplots, a polygon was formed by connecting the genotypes that were further away from the biplot origin, such that all other genotypes were contained in the polygon. Genotypes located on the vertices of the polygon performed either the best or the poorest in one or more locations since they had the longest distance from the origin of biplot. The vertex cultivars in the first GGE biplot (combined sowing dates) were Giza168, G7 (Gemmeiza7), Misr2, Sids13, Sakha94, G9 (Gemmeiza9), Sids12, and G10 (Gemmeiza10) (Figure 1B). Under the recommended sowing date (Figure 2B) the vertex genotypes were Giza168, G7 (Gemmeiza7), Sids13, Sakha94, and G10 (Gemmeiza10). Moreover, the vertex genotypes for the late sown condition were G9 (Gemmeiza9), Sids12, G12 (Gemmeiza12), Giza168, and Sakha94 (Figure 3B). The best genotype for combined sowing dates was Sids12 (Figure 4A). However, the best genotype for recommended sowing date was G12 (Gemmeiza12 (Figure 4B). Furthermore, G9 (Gemmeiza9) followed by Sids12 were the better genotypes for the late sown condition (Figure 4C).
4. Discussion
The world bank identified Egypt as one of the potentially vulnerable countries in the Mediterranean basin that might be affected by global warming [35]. Wheat is the backbone of food security in Egypt, where it provides more than 30% of the population’s calorie intake [36]. Wheat is a cool season crop that found to be sensitive to heat stress during the reproductive stage [37]. Heat stress tolerance is a complicated process controlled by several small effect genes or QTLs and is often confounded by differences in plant morphology and physiology under different environments [38,39,40]. Thus, to understand the complexity of plant responses to heat stress, it is vital to account for the morphological, physiological, and genetic basis of this response under the field conditions.
The current study intended to investigate the effect of heat stress on several morphological traits in addition to the grain yield using commercial wheat cultivars that are widely grown in Egypt [41]. Two locations in Egypt were used; Elbostan and Elkhazan, the first represents newly reclaimed sandy soil while the former represents the Nile delta soil (clay). In Elbostan the mean temperature during flowering under the late sown condition was higher than the recommended sowing conditions by 3.8, 2.3, and 3.2 °C for the 2015, 2016, 2017 growing seasons, respectively. Moreover, the mean temperature during flowering for Elkhazan was higher than the recommended sowing conditions by 3.8, 2.2, and 3.4 °C for the 2015, 2016, 2017 growing seasons, respectively.
The increased temperature during the late sown condition decreased total chlorophyll content, leaf area, grain filling duration, plant height, and grain yield. Moreover, the increased terminal temperature during flowering increased canopy temperature and leaf and stem rust susceptibility. Total chlorophyll content declined significantly under the late sown condition, suggesting structural damage to the chloroplast due to heat stress [7,8,9,42]. The decrease in the total chlorophyll content in response to induced heat stress has also been reported previously in several crops [43,44,45,46,47]. However, in the current study, total chlorophyll content was not significantly correlated with grain yield in either the timely-sown or the late-sown plots. The reasons for the weak correlation between total chlorophyll content and yield might be due to the growth stage in which we measured the total chlorophyll content. Several researchers indicated that plants start losing chlorophyll when the grain filling stage starts [48].
Heat stress (late sown condition) increased average canopy temperature across all cultivars. The correlation between canopy temperature and grain yield was negative and significant which agrees with previously reported results [49,50,51]. The prevalence and severity of stem and leaf rust were increased due to the late sown condition. A possible explanation is that the late sown condition creates favorable environmental conditions for both stem and leaf rust [52,53,54,55,56,57,58].
Overall, the late sown condition decreased the period of grain filling duration, while the sudden rise in the temperature during the reproductive stage decreased the amount of the assimilates [33]. High temperature increases the rate of seed filling, but the increase in the seed filling did not compensate for the loss in the grain filling duration [39]. Our results indicated variable response of the studied cultivars to heat stress across all traits under different environmental conditions which agrees with previous studies [40,59]. Moreover, the high temperature increased stem and leaf rust prevalence and severity during flowering stage under the late sown condition. Failure to understand the mechanisms of grain yield stability might impact both traditional breeding and the use of modern genetics in improving yield production [60]. Heat stress tolerance and maintaining high grain yield under heat stress is considered as one of the most critical aspects of wheat improvement [61,62,63,64]. Genotype–environment (G × E) interaction makes genotypic evaluation a complicated process because of the different response of genotypes under different locations or years. Obviously, grain yield is the most important trait that might solely determine the success of a plant breeder. At the same time, grain yield is a complex and quantitative trait that has strong G × E interactions. Thus, measuring the stability of a giving cultivar became one of the plant breeding routines before releasing the cultivar. The advantage of selecting superior genotypes using stability analysis instead of average performance is that stable genotypes are reliable across environments which reduce G × E interaction. Studies have shown that stability analyses according to various measures can result in better identification of stable genotypes, even when there were no interactions among the measures. In the current study, seven stability parameters were used, which were inconsistent in identifying ideal genotypes for environments or sowing dates; this result agrees with previous results [65,66,67]. The inconsistency could be attributed to the difference in statistical and mathematical methods that the stability parameters rely on [68]. AMMI and GGE biplot were also applied to identify the most stable genotypes. In our study, the ideal genotype was defined agronomically as the genotype that performs well, as “High yielding” and stable across a wide range of environments. Furthermore, in our study, we defined the ideal genotype statistically as the genotype that was stable in at least one of the seven traditional stability measures in addition to AMMI.
In the current study, some genotypes performed well under recommended sowing date but not under the late sown condition (heat stressed conditions) and vice-versa, while some of the studied materials performed well under both sowing dates. Previous results imply that the genotypes used in this study contain different combinations of genes governing their response to sowing dates and tolerance to heat stress, and this result agrees with previous findings [59,69,70,71,72,73]. The ultimate goal of this study was to estimate the effect of global warming and heat stress on grain yield using a representative sample of commercially distributed and widely grown wheat cultivars in Egypt. Thus, wheat breeders and decision makers in this region might have an idea about the effect of heat stress on wheat production.
5. Conclusions
The results revealed that wheat performance was significantly influenced by environment, genotype, and their interaction. Heat stress had a negative impact on all traits. The late sown condition increased the prevalence and severity of leaf and stem rust which most likely contributed to the overall yield losses. The late sown condition decreased the overall yield production for the studied cultivars by 45%. The cultivars showed high G × E interaction, and the sowing date increased that interaction. Stability measurements were useful in determining the most stable genotypes. However, inconsistency was observed among some measurements. AMMI and GGE biplots were adequate for analyzing and visualizing the patterns of G × E. Sids12 was stable and outperformed the tested materials under both the recommended and late sown conditions. Gemmeiza12 was more stable and outperformed the tested materials under the recommended sown conditions. Gemmeiza9 followed by Sids12 were stable and performed better than the rest of the tested cultivars under the late sown conditions. However, late sown conditions reduced yield by 47.15%, 64.5%, and 59.2% for cultivars Sids12, Gemmeiza9, and Gemmeiza10, respectively. As a result of this work, we recommend importing and evaluating wheat accessions known to be tolerant to heat stress and cross them with the adapted wheat cultivars in this region to boost heat stress tolerance. Even though this study was conducted using cultivars grown mainly in Egypt; we expect that heat stress will have a similar effect on the spring wheat cultivars grown in the Mediterranean region because most of the wheat breeding programs in the Mediterranean region share lines from each other and international wheat breeding organizations.
Acknowledgments
The author sincerely thanks the science and technology development fund (STDF), grant number 14935 and Damanhour University for funding and supporting this study. I would also like to thank Stephen Baenziger for reviewing, editing and helpful suggestions while preparing this manuscript.
Conflicts of Interest
The author declares no conflict of interest.
References
- Enghiad, A.; Ufer, D.; Countryman, A.M.; Thilmany, D.D. An Overview of Global Wheat Market Fundamentals in an Era of Climate Concerns. Int. J. Agron. 2017, 2017, 3931897. [Google Scholar] [CrossRef]
- Curtis, T.; Halford, N.G. Food security: The challenge of increasing wheat yield and the importance of not compromising food safety. Ann. Appl. Biol. 2014, 164, 354–372. [Google Scholar] [CrossRef] [PubMed]
- Olmstead, A.L.; Rhode, P.W. Adapting North American wheat production to climatic challenges, 1839–2009. Proc. Natl. Acad. Sci. USA 2011, 108, 480–485. [Google Scholar] [CrossRef]
- Asseng, S.; Ewert, F.; Martre, P.; Rötter, R.P.; Lobell, D.B.; Cammarano, D.; Kimball, B.A.; Ottman, M.J.; Wall, G.W.; White, J.W.; et al. Rising temperatures reduce global wheat production. Nat. Clim. Chang. 2015, 5, 143–147. [Google Scholar] [CrossRef]
- Bita, C.E.; Gerats, T. Plant tolerance to high temperature in a changing environment: Scientific fundamentals and production of heat stress-tolerant crops. Front. Plant Sci. 2013, 4, 273. [Google Scholar] [CrossRef] [PubMed] [Green Version]
- Farooq, M.; Bramley, H.; Palta, J.A.; Siddique, K.H.M. Heat Stress in Wheat during Reproductive and Grain-Filling Phases. Crit. Rev. Plant Sci. 2011, 30, 491–507. [Google Scholar] [CrossRef]
- Jat, R.K.; Singh, P.; Jat, M.L.; Dia, M.; Sidhu, H.S.; Jat, S.L.; Bijarniya, D.; Jat, H.S.; Parihar, C.M.; Kumar, U.; et al. Heat stress and yield stability of wheat genotypes under different sowing dates across agro-ecosystems in India. Field Crops Res. 2018, 218, 33–50. [Google Scholar] [CrossRef]
- Akter, N.; Rafiqul Islam, M. Heat stress effects and management in wheat. A review. Agron. Sustain. Dev. 2017, 37, 37. [Google Scholar] [CrossRef]
- Spiertz, J.H.J.; Hamer, R.J.; Xu, H.; Primo-Martin, C.; Don, C.; van der Putten, P.E.L. Heat stress in wheat (Triticum aestivum L.): Effects on grain growth and quality traits. Eur. J. Agron. 2006, 25, 89–95. [Google Scholar] [CrossRef]
- Feng, B.; Liu, P.; Li, G.; Dong, S.T.; Wang, F.H.; Kong, L.A.; Zhang, J.W. Effect of Heat Stress on the Photosynthetic Characteristics in Flag Leaves at the Grain-Filling Stage of Different Heat-Resistant Winter Wheat Varieties. J. Agron. Crop Sci. 2014, 200, 143–155. [Google Scholar] [CrossRef]
- Gonzalez, A.; Bermejo, V.; Gimeno, B.S. Effect of different physiological traits on grain yield in barley grown under irrigated and terminal water deficit conditions. J. Agric. Sci. 2010, 148, 319–328. [Google Scholar] [CrossRef]
- Matsui, T.; Omasa, K.; Horie, T. The Difference in Sterility due to High Temperatures during the Flowering Period among Japonica-Rice Varieties. Plant Prod. Sci. 2001, 4, 90–93. [Google Scholar] [CrossRef]
- Vara Prasad, P.V.; Craufurd, P.Q.; Summerfield, R.J. Sensitivity of peanut to timing of heat stress during reproductive development. Crop Sci. 1999, 39, 1352–1357. [Google Scholar] [CrossRef]
- Batts, G.R.; Ellis, R.H.; Morison, J.I.L.; Nkemka, P.N.; Gregory, P.J.; Hadley, P. Yield and partitioning in crops of contrasting cultivars of winter wheat in response to CO2 and temperature in field studies using temperature gradient tunnels. J. Agric. Sci. 1998, 130, 17–27. [Google Scholar] [CrossRef]
- Wardlaw, F.; Sofieldb, I.; Cartwrightc, P.M. Factors Limiting the Rate of Dry Matter Accumulation in the Grain of Wheat Grown at High Temperature. Aust. J. Plant Physiol. 1980, 7, 387–400. [Google Scholar] [CrossRef]
- Iqbal, M.; Raja, N.I.; Yasmeen, F.; Hussain, M.; Ejaz, M.; Shah, M.A. Impacts of Heat Stress on Wheat: A Critical Review. Adv. Crop Sci. Technol. 2017, 5, 251. [Google Scholar] [CrossRef]
- Adams, S. Effect of Temperature on the Growth and Development of Tomato Fruits. Ann. Bot. 2001, 88, 869–877. [Google Scholar] [CrossRef]
- Abiko, M.; Akibayashi, K.; Sakata, T.; Kimura, M.; Kihara, M.; Itoh, K.; Asamizu, E.; Sato, S.; Takahashi, H.; Higashitani, A. High-temperature induction of male sterility during barley (Hordeum vulgare L.) anther development is mediated by transcriptional inhibition. Sex. Plant Reprod. 2005, 18, 91–100. [Google Scholar] [CrossRef]
- Al-Otayk, S.M. Performance of Yield and Stability of Wheat Genotypes under High Stress Environments of the Central Region of Saudi Arabia. Meteorol. Environ. Arid Land Agric. Sci. 2010, 21, 81–92. [Google Scholar] [CrossRef]
- Farshadfar, E.; Sabaghpour, S.H.; Zali, H. Comparison of parametric and non-parametric stability statistics for selecting stable chickpea (Cicer arietinum L.) genotypes under diverse environments. Aust. J. Crop Sci. 2012, 6, 514–524. [Google Scholar]
- Lin, C.S.; Binns, M.R. A superiority measure of cultivar performance for cultivar × location data. Can. J. Plant Sci. 1988, 68, 193–198. [Google Scholar] [CrossRef]
- Eberhart, S.A.; Russell, W.A. Stability Parameters for Comparing Varieties. Crop Sci. 1966, 6, 36–40. [Google Scholar] [CrossRef]
- Romagosa, I.; Fox, P.N. Genotype × environment interaction and adaptation. In Plant Breeding; Springer: Dordrecht, The Netherlands, 1993; pp. 373–390. ISBN 9401046654. [Google Scholar]
- Akcura, M.; Kaya, Y. Nonparametric stability methods for interpreting genotype by environment interaction of bread wheat genotypes (Triticum aestivum L.). Genet. Mol. Biol. 2008, 31, 906–913. [Google Scholar] [CrossRef]
- Bavec, M.; Vuković, K.; Grobelnik Mlakar, S.; Rozman, Č.; Bavec, F. Leaf area index in winter wheat: response on seed rate and nitrogen application by different varieties. J. Cent. Eur. Agric. 2007, 8, 337–342. [Google Scholar] [CrossRef]
- Peterson, R.F.; Campbell, A.B.; Hannah, A.E. A diagrammatic scale for estimating rust intensity on leaves and stems of cereals. Can. J. Res. 1948, 26, 496–500. [Google Scholar] [CrossRef]
- Roelfs, A.P.; Singh, R.P.; Saari, E.E. Rust Diseases of Wheat: Concepts and Methods of Disease Management; CIMMYT (International Maize and Wheat Improvement Center): Mexico, D.F., Mexico, 1992; ISBN 968612747X. [Google Scholar]
- Gomez, K.A.; Gomez, A.A.; Gomez, K.A. Statistical Procedures for Agricultural Research; John Wiley & Sons: New York, NY, USA, 1984; ISBN 9780471870920. [Google Scholar]
- Steel, R.G.D.; Torrie, J.H. Principles and Procedures of Statistics: A Biometrical Approach, 2nd ed.; McGraw-Hill Publishing Co.: New York, NY, USA, 1980; 631p. [Google Scholar]
- Mellenbergh, G.J.; Arce, C. Experimental design and analysis. J. Mark. Res. (JMR) 1992, 29, 155–156. [Google Scholar] [CrossRef]
- Pinthus, M.J. Estimate of genotypic value: A proposed method. Euphytica 1973, 22, 121–123. [Google Scholar] [CrossRef]
- Mulusew, F.; Bing, D.J.; Tadele, T.; Amsalu, A. Comparison of biometrical methods to describe yield stability in field pea (Pisum sativum L.) under south eastern Ethiopian conditions. Afr. J. Agric. Res. 2014, 9, 2574–2583. [Google Scholar] [CrossRef]
- Blanco, A.; Mangini, G.; Giancaspro, A.; Giove, S.; Colasuonno, P.; Simeone, R.; Signorile, A.; De Vita, P.; Mastrangelo, A.M.; Cattivelli, L.; et al. Relationships between grain protein content and grain yield components through quantitative trait locus analyses in a recombinant inbred line population derived from two elite durum wheat cultivars. Mol. Breed. 2012, 30, 79–92. [Google Scholar] [CrossRef]
- Pacheco, Á.; Vargas, M.; Alvarado, G.; Rodríguez, F.; Crossa, J.; Burgueño, J. GEA-R (Genotype × Environment Analysis with R for Windows) Version 4.0. Available online: http://hdl.handle.net/11529/10203 (accessed on 29 January 2018).
- Hereher, M.E. Time series trends of land surface temperatures in Egypt: a signal for global warming. Environ. Earth Sci. 2016, 75, 1218. [Google Scholar] [CrossRef]
- Valizadeh, J.; Ziaei, S.M.; Mazloumzadeh, S.M. Assessing climate change impacts on wheat production (a case study). J. Saudi Soc. Agric. Sci. 2014, 13, 107–115. [Google Scholar] [CrossRef]
- Castro, M.; Peterson, C.J.; Dalla Rizza, M.; Díaz Dellavalle, P.; Vázquez, D.; Ibañez, V.; Ross, A. Influence of heat stress on wheat grain characteristics and protein molecular weight distribution. In Wheat Production in Stressed Environments; Springer: Dordrecht, The Netherlands, 2007; pp. 365–371. ISBN 978-1-4020-5496-9. [Google Scholar]
- Mohammed, A.R.; Tarpley, L. Impact of high nighttime temperature on respiration, membrane stability, antioxidant capacity, and yield of rice plants. Crop Sci. 2009, 49, 313–322. [Google Scholar] [CrossRef]
- Ayeneh, A.; Van Ginkel, M.; Reynolds, M.P.; Ammar, K. Comparison of leaf, spike, peduncle and canopy temperature depression in wheat under heat stress. Field Crops Res. 2002, 79, 173–184. [Google Scholar] [CrossRef]
- Fu, G.; Feng, B.; Zhang, C.; Yang, Y.; Yang, X.; Chen, T.; Zhao, X.; Zhang, X.; Jin, Q.; Tao, L. Heat Stress Is More Damaging to Superior Spikelets than Inferiors of Rice (Oryza sativa L.) due to Their Different Organ Temperatures. Front. Plant Sci. 2016, 7, 1637. [Google Scholar] [CrossRef] [PubMed]
- Gadallah, A.; Milad, I.; Yossef, Y.A.; Gouda, M.A. Evaluation of Some Egyptian Bread Wheat (Triticum aestivum) Cultivars under Salinity Stress. Alex. Sci. Exch. 2017, 38, 260. [Google Scholar]
- Chen, W.R.; Zheng, J.S.; Li, Y.Q.; Guo, W.D. Effects of high temperature on photosynthesis, chlorophyll fluorescence, chloroplast ultrastructure, and antioxidant activities in fingered citron. Russ. J. Plant Physiol. 2012, 59, 732–740. [Google Scholar] [CrossRef]
- Kreslavski, V.D.; Lyubimov, V.Y.; Shabnova, N.I.; Balakhnina, T.I.; Kosobryukhov, A.A. Heat-induced impairments and recovery of photosynthetic machinery in wheat seedlings. Role of light and prooxidant-antioxidant balance. Physiol. Mol. Biol. Plants 2009, 15, 115–122. [Google Scholar] [CrossRef] [PubMed]
- Kreslavski, V.; Tatarinzev, N.; Shabnova, N.; Semenova, G.; Kosobryukhov, A. Characterization of the nature of photosynthetic recovery of wheat seedlings from short-term dark heat exposures and analysis of the mode of acclimation to different light intensities. J. Plant Physiol. 2008, 165, 1592–1600. [Google Scholar] [CrossRef] [PubMed]
- Xu, S.; Li, J.; Zhang, X.; Wei, H.; Cui, L. Effects of heat acclimation pretreatment on changes of membrane lipid peroxidation, antioxidant metabolites, and ultrastructure of chloroplasts in two cool-season turfgrass species under heat stress. Environ. Exp. Bot. 2006, 56, 274–285. [Google Scholar] [CrossRef]
- Guo, Y.-P.; Zhou, H.-F.; Zhang, L.-C. Photosynthetic characteristics and protective mechanisms against photooxidation during high temperature stress in two citrus species. Sci. Hortic. 2006, 108, 260–267. [Google Scholar] [CrossRef]
- Havaux, M. Characterization of thermal damage to the photosynthetic electron transport system in potato leaves. Plant Sci. 1993, 94, 19–33. [Google Scholar] [CrossRef]
- Del Río, L.A.; Pastori, G.M.; Palma, J.M.; Sandalio, L.M.; Sevilla, F.; Corpas, F.J.; Jiménez, A.; López-Huertas, E.; Hernández, J.A. The Activated Oxygen Role of Peroxisomes in Senescence. Plant Physiol. 1998, 116, 1195–1200. [Google Scholar] [CrossRef] [PubMed]
- Asthir, B. Protective mechanisms of heat tolerance in crop plants. J. Plant Interact. 2015, 10, 202–210. [Google Scholar] [CrossRef]
- Hasanuzzaman, M.; Nahar, K.; Alam, M.M.; Roychowdhury, R.; Fujita, M. Physiological, biochemical, and molecular mechanisms of heat stress tolerance in plants. Int. J. Mol. Sci. 2013, 14, 9643–9684. [Google Scholar] [CrossRef] [PubMed]
- Hemantaranjan, A. Heat Stress Responses and Thermotolerance. Adv. Plants Agric. Res. 2014, 1. [Google Scholar] [CrossRef]
- Liu, J.Q.; Kolmer, J.A. Genetics of Leaf Rust Resistance in Canadian Spring Wheats AC Domain and AC Taber. Plant Dis. 1997, 81, 757–760. [Google Scholar] [CrossRef]
- Huerta-Espino, J.; Singh, R.P.; Germán, S.; McCallum, B.D.; Park, R.F.; Chen, W.Q.; Bhardwaj, S.C.; Goyeau, H. Global status of wheat leaf rust caused by Puccinia triticina. Euphytica 2011, 179, 143–160. [Google Scholar] [CrossRef]
- Liu, J.Q.; Kolmer, J.A. Inheritance of Leaf Rust Resistance in Wheat Cultivars Grandin and CDC Teal. Plant Dis. 1997, 81, 505–508. [Google Scholar] [CrossRef]
- Herrera-Foessel, S.A.; Singh, R.P.; Huerta-Espino, J.; Crossa, J.; Yuen, J.; Djurle, A. Effect of Leaf Rust on Grain Yield and Yield Traits of Durum Wheats with Race-Specific and Slow-Rusting Resistance to Leaf Rust. Plant Dis. 2006, 90, 1065–1072. [Google Scholar] [CrossRef]
- Broers, L.H.M. Partial resistance to wheat leaf rust in 18 spring wheat cultivars. Euphytica 1989, 44, 247–258. [Google Scholar] [CrossRef]
- Broers, L.H.M. Influence of development stage and host genotype on three components of partial resistance to leaf rust in spring wheat. Euphytica 1989, 44, 187–195. [Google Scholar] [CrossRef]
- Draz, I.S.; Abou-Elseoud, M.S.; Kamara, A.-E.M.; Alaa-Eldein, O.A.-E.; El-Bebany, A.F. Screening of wheat genotypes for leaf rust resistance along with grain yield. Ann. Agric. Sci. 2015, 60, 29–39. [Google Scholar] [CrossRef]
- Khan, A.A.; Kabir, M.R. Evaluation of Spring Wheat Genotypes (Triticum Aestivum L.) for Heat Stress Tolerance Using Different Stress Tolerance Indices. Cercet. Agron. Mold. 2015, 47, 49–63. [Google Scholar] [CrossRef]
- Mir, R.R.; Zaman-Allah, M.; Sreenivasulu, N.; Trethowan, R.; Varshney, R.K. Integrated genomics, physiology and breeding approaches for improving drought tolerance in crops. Theor. Appl. Genet. 2012, 125, 625–645. [Google Scholar] [CrossRef] [PubMed] [Green Version]
- Cossani, C.M.; Reynolds, M.P. Physiological Traits for Improving Heat Tolerance in Wheat. Plant Physiol. 2012, 160, 1710–1718. [Google Scholar] [CrossRef] [PubMed]
- Aziz, A.; Mahmood, T.; Mahmood, Z.; Shazadi, K.; Mujeeb-Kazi, A.; Rasheed, A. Genotypic Variation and Genotype × Environment Interaction for Yield-Related Traits in Synthetic Hexaploid Wheats under a Range of Optimal and Heat-Stressed Environments. Crop Sci. 2018, 58, 295–303. [Google Scholar] [CrossRef]
- Acevedo, E.; Silva, P.; Silva, H. Wheat Growth and Physiology; FAO Plant Production and Protection Series (FAO): Rome, Italy, 2002. [Google Scholar]
- Altenbach, S.B.; Dupont, F.M.; Kothari, K.M.; Chan, R.; Johnson, E.L.; Lieu, D. Temperature, Water and Fertilizer Influence the Timing of Key Events During Grain Development in a US Spring Wheat. J. Cereal Sci. 2003, 37, 9–20. [Google Scholar] [CrossRef]
- Chamekh, Z.; Karmous, C.; Ayadi, S.; Sahli, A.; Hammami, Z.; Fraj, M.B.; Benaissa, N.; Trifa, Y.; Slim-Amara, H. Stability analysis of yield component traits in 25 durum wheat (Triticum durum Desf.) genotypes under contrasting irrigation water salinity. Agric. Water Manag. 2015, 152, 1–6. [Google Scholar] [CrossRef]
- Mohamed, N.E.M.; Said, A.A. 7 Stability Parameters for Comparing Bread Wheat Genotypes under Combined Heat and Drought Stress. Egypt. J. Agron. 2014, 36, 123–146. [Google Scholar]
- Abbas Mosavi, A.; Babaiean Jelodar, N.; Kazemitabar, K. Environmental Responses and Stability Analysis for Grain Yield of Some Rice Genotypes. World Appl. Sci. J. 2013, 21, 105–108. [Google Scholar] [CrossRef]
- Witcombe, J.R. Estimates of stability for comparing varieties. Euphytica 1988, 39, 11–18. [Google Scholar] [CrossRef]
- Lopes, M.S.; El-Basyoni, I.; Baenziger, P.S.; Singh, S.; Royo, C.; Ozbek, K.; Aktas, H.; Ozer, E.; Ozdemir, F.; Manickavelu, A.; et al. Exploiting genetic diversity from landraces in wheat breeding for adaptation to climate change. J. Exp. Bot. 2015, 66, 3477–3486. [Google Scholar] [CrossRef] [PubMed]
- Omae, H.; Kumar, A.; Shono, M. Adaptation to High Temperature and Water Deficit in the Common Bean (Phaseolus vulgaris L.) during the Reproductive Period. J. Bot. 2012, 2012, 803413. [Google Scholar] [CrossRef]
- Qu, A.-L.; Ding, Y.-F.; Jiang, Q.; Zhu, C. Molecular mechanisms of the plant heat stress response. Biochem. Biophys. Res. Commun. 2013, 432, 203–207. [Google Scholar] [CrossRef] [PubMed]
- Lobell, D.B.; Field, C.B. Global scale climate–crop yield relationships and the impacts of recent warming. Environ. Res. Lett. 2007, 2, 14002. [Google Scholar] [CrossRef]
- Krasensky, J.; Jonak, C. Drought, salt, and temperature stress-induced metabolic rearrangements and regulatory networks. J. Exp. Bot. 2012, 63, 1593–1608. [Google Scholar] [CrossRef] [PubMed]
Figure 1.
Vector view of GGE biplot for relationships among environments (A), and GGE biplot identification of winning cultivars across environments (two years i.e., 2015 and 2016, and two locations i.e., Elbostan (B), and Elkhazan (K)) under recommended (E) and late (L) sowing dates (B). AXIS1 and 2 refer to Principal component 1 (PC1) and Principal component 2 (PC2), respectively.

Figure 2.
Vector view of GGE biplot for relationships among environments (A), and GGE biplot identification of winning cultivars across environments (two years, i.e., 2015 and 2016, and two locations, i.e., Elbostan (B), and Elkhazan (K)) under early sowing date (B). AXIS1 and 2 refer to Principal component 1 (PC1) and Principal component 2 (PC2), respectively.

Figure 3.
Vector view of GGE biplot for relationships among environments (A), and GGE biplot identification of winning cultivars across environments (two years, i.e., 2015 and 2016, and two locations, i.e., Elbostan (B), and Elkhazan (K)) under late sown condition (B). AXIS1 and 2 refer to Principal component 1 (PC1) and Principal component 2 (PC2), respectively.

Figure 4.
GGE biplot for the ideal genotype under both sowing dates (A), recommended sowing date (B) and late sown condition (C), across environments (two years, i.e., 2015 and 2016, and two locations, i.e., Elbostan (B), and Elkhazan (K)). AXIS1 and 2 refer to Principal component 1 (PC1) and Principal component 2 (PC2), respectively.


Table 1.
Name, pedigree, and year of release of the ten wheat cultivars used in this study.
| Cultivar | Pedigree | Year of Release |
|---|---|---|
| Giza168 | MRL/BUC//SERI | 1995 |
| Gemmeiza7 | 7CMH74A-630/SX//SERI82/AGEN | 1999 |
| Gemmeiza9 | ALD“s”/HUAC//CMH74A-630/SX | 1999 |
| Gemmeiza10 | Maya74“S”/ON/1160-147/3/Bb/G11/4/chat“S”/5/crow“S”CGM5820-3GM-1GM-2GM-0GM | 2004 |
| Gemmeiza11 | BOW “S”/KVZ “S”//7C/SERI82/3/GIZA168/SKHA61 | 2011 |
| Gemmeiza12 | OTUS/3/SARA/THB//VEECMSS97Y00227S-5Y- | 2011 |
| Sakha94 | OPATA/RAYON//KAUZ | 2004 |
| Sids12 | BUC//7C/ALD/5/MAYA74/ON//1160-147/3/BB/GLL/4/CHAT“S”/6/MAYA/VUL-4SD-1SD-1SD-0SD. | 2007 |
| Sids13 | KAUZ “S”//TSI/SNB“S”. ICW94-0375-4AP-2AP-030AP-0APS-3AP-0APS-050AP-0AP-0SD. | 2010 |
| Misr2 | SKAUZ/BAV92. CMSS96M0361S-1M-010SY-010M-010SY-8M-0Y-0S. | 2011 |
Table 2.
Analysis of variance for total chlorophyll content (CHLOR), canopy temperature (CANO), leaf area (LA), grain filling duration (GFD), plant height (PH), grain yield (YIELD), leaf rust (LR), stem rust (SR), and number of days to flowering (NDF) under two sowing date (SD) and different environments (ENV).
| SOURCE | DF | Mean Squares | ||||||||
|---|---|---|---|---|---|---|---|---|---|---|
| CHLOR | CANO | LA | GFD | PH | YIELD | LR | SR | NDF | ||
| ENV | 5 | 72.6 ** | 1316.1 ** | 212.7 ** | 492.5 ** | 785.5 ** | 34.02 ** | 0.025 | 0.016 | 2263.5 ** |
| Replication(ENV) | 12 | 0.60 | 2.27 | 1.44 | 3.36 | 37.73 | 0.10 | 0.017 | 0.017 | 67.00 ** |
| SD | 1 | 1055.4 ** | 61871.3 ** | 11969.29 ** | 6002.5 ** | 63374.9 ** | 836.1 ** | 14.88 ** | 16.72 ** | 85069.9 ** |
| ENV * SD | 5 | 119.0 ** | 463.2 ** | 115.33 ** | 16.3 * | 393.3 ** | 13.0 ** | 0.02 | 0.036 | 360.9 ** |
| Main plot Error | 12 | 0.59 | 1.36 | 2.10 | 6.83 | 37.55 | 0.12 | 0.042 | 0.011 | 68.9 |
| CULTIVAR | 9 | 15.1 ** | 182.5 ** | 142.8 ** | 116.7 ** | 1141.2 ** | 6.6 ** | 1.46 ** | 1.77 ** | 3500.5 ** |
| SD * CULTIVAR | 9 | 6.4 ** | 84.3 ** | 20.2 ** | 43.8 ** | 761.1 ** | 2.9 ** | 1.47 ** | 0.89 ** | 2003.76 ** |
| ENV * CULTIVAR | 45 | 9.08 ** | 109.7 ** | 53.4 ** | 38.04 ** | 371.1 ** | 2.2 ** | 0.02 | 0.035 * | 600.3 ** |
| ENV * SD * CULTIVAR | 45 | 6.8 ** | 193.18 ** | 28.59 ** | 44.9 ** | 423.2 ** | 2.8 ** | 0.019 | 0.031 | 682.9 ** |
| ERROR | 216 | 0.14 | 2.71 | 0.69 | 1.4 | 14.95 | 0.1 | 0.019 | 0.02 | 22.2 |
*, **: Significant at the 0.05 and 0.01 probability levels, respectively. SD: Sowing date; ENV: Environment.
Table 3.
Response of the ten wheat cultivars to recommended (R) and late sowing (L) dates for total chlorophyll content (CHLOR), canopy temperature (CANO), leaf area (LA), grain filling duration (GFD), plant height(PH), grain yield (GY), leaf rust scores (LR), stem rust scores(SR), and number of days to flowering (NDF).
| PH | GY | NDF | LR | SR | CHLOR | CANO | LA | GFD | ||||||||||
|---|---|---|---|---|---|---|---|---|---|---|---|---|---|---|---|---|---|---|
| Sowing date | R | L | R | L | R | L | R | L | R | L | R | L | R | L | R | L | R | L |
| Sids12 | 83.5 | 62.5 | 8.08 | 4.27 | 139.5 | 112.1 | 0.40 (40.7) | 0.36 (49.9) | 0.09 (37.52) | 0.46 (53.2) | 32.6 | 29.0 | 33.9 | 46.9 | 36.1 | 24.6 | 31.32 | 28.9 |
| Gemmeiza10 | 65.7 | 52.2 | 7.65 | 3.12 | 116.2 | 103.4 | 0.06 (40.5) | 0.85 (57.1) | 0.14 (32.6) | 0.90 (46.8) | 31.3 | 28.0 | 32.2 | 44.4 | 33.8 | 22.4 | 32.2 | 27.9 |
| Gemmeiza7 | 88.3 | 58.3 | 4.67 | 4.15 | 132.5 | 124.4 | 0.41 (30.4) | 0.94 (54.1) | 0.40 (39.2) | 0.95 (43.2) | 32.6 | 28.6 | 36.6 | 42.6 | 38.36 | 25.2 | 34.8 | 25.25 |
| Gemmeiza9 | 89.3 | 58.3 | 7.6 | 4.87 | 133.7 | 119.8 | 0.11 (38.8) | 0.41 (68.1) | 0.40 (32.8) | 0.46 (55.5) | 32.4 | 28.5 | 37.1 | 44.1 | 38.5 | 25.1 | 34.5 | 29.3 |
| Gemmeiza11 | 88.4 | 52.3 | 5.0 | 2.9 | 126 | 109.6 | 0.32 (20.6) | 0.36 (43.9) | 0.16 (26.3) | 0.41 (54.6) | 30.7 | 28.4 | 34.3 | 41.9 | 34.4 | 24.6 | 30.2 | 24.2 |
| Gemmeiza12 | 76.3 | 60.1 | 8.8 | 3.12 | 117.5 | 95.2 | 0.05 (36.6) | 0.84 (47.7) | 0.16 (26.3) | 0.93 (54.6) | 30.8 | 28.3 | 33.1 | 47.6 | 33.4 | 23.1 | 33.3 | 22.3 |
| Misr2 | 90.6 | 61.5 | 5.0 | 3.4 | 128.4 | 110.7 | 0.78 (38.4) | 0.83 (56.7) | 0.35 (38.0) | 0.91 (55.1) | 31.3 | 28.7 | 32.4 | 60.4 | 36.25 | 24.2 | 34.9 | 25.3 |
| Sakha94 | 75.5 | 63.9 | 5.0 | 3.3 | 127.0 | 121.4 | 0.94 (46.5) | 0.82 (44.3) | 0.08 (39.4) | 0.95 (56.8) | 30.8 | 27.8 | 31.1 | 47.5 | 29.9 | 20.1 | 28.3 | 21.8 |
| Giza168 | 95.8 | 64.9 | 5.4 | 4.0 | 121.8 | 114.0 | 0.06 (39.4) | 0.93 (59.8) | 0.91 (32.9) | 0.97 (45.5) | 33.5 | 28.5 | 29.6 | 42.5 | 34.5 | 22.9 | 32.5 | 25.9 |
| Sids13 | 79.9 | 58.3 | 5.0 | 3.7 | 126.7 | 110.3 | 0.11 (29.7) | 0.92 (52.2) | 0.88 (45.6) | 0.85 (52.5) | 32.7 | 29.5 | 33.5 | 48.7 | 36.5 | 23.2 | 32.7 | 24.2 |
| Lsd | 6.0 | 0.5 | 1.8 | 0.071 | 0.065 | 0.6 | 2.6 | 1.3 | 1.8 | |||||||||
| Sowing date mean | 83.3 | 59.2 | 6.2 | 3.7 | 126.9 | 112.1 | 0.32 | 0.73 | 0.36 | 0.78 | 31.9 | 28.5 | 33.4 | 46.7 | 35.2 | 23.5 | 32.5 | 25.5 |
Lsd: least significant difference for the interaction between sowing dates and genotypes at α = 0.05. Numbers in brackets refer to the severity of leaf and stem rust diseases at the adult plant stage.
Table 4.
Pearson correlation coefficients among total chlorophyll content (CHLOR), canopy temperature (CANO), leaf area (LA), grain filling duration (GFD), plant height (PH), grain yield (YIELD), leaf rust (LR), stem rust (SR) scores, and the number of days to flowering (NDF) under recommended sowing date (above diagonal), and correlation coefficients among same traits under late sown condition (below diagonal).
| CHLOR | CANO | LA | GFD | PH | YIELD | LR | SR | NDF | |
|---|---|---|---|---|---|---|---|---|---|
| CHLOR | −0.17 | 0.55 ** | 0.27 | 0.43 * | 0.07 | −0.33 * | 0.07 | −0.47 ** | |
| CANO | 0.00 | 0.44 ** | −0.11 | 0.10 | −0.20 | −0.05 | −0.25 | −0.31 * | |
| LA | 0.42 * | −0.21 | 0.61 ** | 0.50 ** | 0.43 * | 0.06 | −0.63 ** | −0.79 ** | |
| GFD | 0.40 * | −0.57 ** | 0.56 ** | 0.31 | 0.60 ** | 0.17 | −0.69 ** | −0.56 ** | |
| PH | 0.55 ** | −0.08 | 0.60 ** | 0.39 * | 0.45 * | 0.01 | −0.06 | −0.90 ** | |
| YIELD | 0.39 * | −0.55 ** | 0.55 ** | 0.77 ** | 0.43 * | 0.01 | −0.67 ** | −0.59 ** | |
| LR | −0.33 | 0.37 * | −0.71 ** | −0.81 ** | −0.53 ** | −0.82 ** | −0.38 | 0.42 * | |
| SR | −0.28 | 0.41 * | −0.63 ** | −0.84 ** | −0.42 * | −0.85 ** | 0.97 ** | −0.06 | |
| NDF | −0.30 | −0.80 ** | −0.30 | 0.25 | −0.46 ** | 0.23 | −0.53 ** | −0.1 |
*, **: Significant at the 0.05, 0.01 probability levels, respectively.
Table 5.
Stability parameters estimates for grain yield and ten cultivars, under combined, early, and late sown conditions.
Table 5.
Stability parameters estimates for grain yield and ten cultivars, under combined, early, and late sown conditions.
| Sowing Date | Genotypes | Coefficient of Variation C.V% | Regression Coefficient (bi) | Perkins and Jinks (Di) | Wrike’s Ecovalence (Wi) | Superiority Measure (Pi) | Average Absolute Rank (Si(1)) |
|---|---|---|---|---|---|---|---|
| Recommended & late combined | Sids12 | 49.03 | 1.60 | 0.60 | 28.42 | 0.78 | 0.82 |
| Gemmeiza10 | 32.43 | 0.60 | −0.40 | 12.53 | 6.35 | 0.32 | |
| Gemmeiza7 | 31.70 | 0.88 | −0.12 | 10.38 | 2.29 | 0.61 | |
| Giza168 | 40.77 | 1.10 | 0.10 | 8.82 | 2.66 | 0.41 | |
| Gemmeiza11 | 47.59 | 1.46 | 0.46 | 13.67 | 1.34 | 0.68 | |
| Gemmeiza12 | 32.28 | 0.61 | −0.39 | 12.83 | 5.75 | 0.21 | |
| Misr2 | 33.89 | 0.75 | −0.25 | 8.11 | 4.58 | 0.45 | |
| Sakha94 | 47.22 | 1.11 | 0.11 | 18.29 | 3.56 | 0.52 | |
| Gemmeiza9 | 30.03 | 1.06 | 0.06 | 3.91 | 0.54 | 0.24 | |
| Sids13 | 35.91 | 0.83 | −0.17 | 7.49 | 4.39 | 0.48 | |
| Recommended | Sids12 | 6.14 | 0.32 | −0.68 | 4.15 | 0.16 | 0.53 |
| Misr2 | 31.73 | 1.47 | 0.47 | 2.52 | 7.75 | 0.53 | |
| Gemmeiza7 | 24.62 | 0.62 | −0.38 | 5.79 | 11.01 | 0.47 | |
| Gemmeiza9 | 31.65 | 1.73 | 0.73 | 6.18 | 4.50 | 1.00 | |
| Gemmeiza11 | 30.89 | 1.54 | 0.54 | 7.61 | 4.44 | 1.20 | |
| Gemmeiza12 | 13.53 | 0.86 | −0.14 | 1.09 | 0.91 | 0.33 | |
| Gemmeiza10 | 19.67 | 0.18 | −0.82 | 9.98 | 9.74 | 0.60 | |
| Sakha94 | 23.90 | 0.83 | −0.17 | 4.52 | 7.84 | 1.00 | |
| Giza168 | 34.97 | 1.47 | 0.47 | 13.11 | 5.37 | 1.47 | |
| Sids13 | 17.07 | 0.98 | −0.02 | 3.31 | 1.08 | 0.60 | |
| late | Sids13 | 24.03 | 2.32 | 1.32 | 1.30 | 1.40 | 0.67 |
| Gemmeiza9 | 22.99 | 2.48 | 1.48 | 1.35 | 1.03 | 0.73 | |
| Gemmeiza7 | 25.24 | 2.26 | 1.26 | 1.36 | 1.69 | 0.67 | |
| Gemmeiza10 | 6.74 | −0.33 | −1.33 | 1.47 | 0.09 | 0.60 | |
| Gemmeiza11 | 8.37 | −0.12 | −1.12 | 1.21 | 0.88 | 0.87 | |
| Gemmeiza12 | 30.57 | 2.56 | 1.56 | 2.74 | 1.77 | 0.73 | |
| Misr2 | 11.30 | 0.50 | −0.51 | 0.63 | 1.77 | 0.80 | |
| Sakha94 | 17.77 | 0.68 | −0.32 | 1.65 | 1.32 | 0.83 | |
| Giza168 | 24.80 | −0.84 | −1.84 | 5.09 | 1.75 | 0.97 | |
| Sids12 | 5.27 | 0.49 | −0.51 | 0.36 | 0.00 | 0.07 |
Table 6.
Summary of the analysis of variance and partitioning of the G × E interaction by , the additive main effects and multiplicative interaction model (AMMI) for grain yield.
Table 6.
Summary of the analysis of variance and partitioning of the G × E interaction by , the additive main effects and multiplicative interaction model (AMMI) for grain yield.
| Sowing Date | Source | DF | MS | % of Variance Explained |
|---|---|---|---|---|
| Recommend and late combined | Environments (E) | 11 | 96.80 ** | 63.20 |
| Genotypes (G) | 9 | 27.40 ** | 14.60 | |
| G × E | 99 | 3.80 ** | 22.20 | |
| PC1 | 19 | 8.90 ** | 45.30 | |
| PC2 | 17 | 6.00 ** | 27.10 | |
| PC3 | 15 | 3.70 ** | 14.80 | |
| Residuals | 240 | 0.10 | ||
| Recommend | Environments (E) | 5 | 42.15 ** | 29.52 |
| Genotypes (G) | 9 | 36.50 ** | 46.00 | |
| G × E | 45 | 3.88 ** | 24.48 | |
| PC1 | 13 | 6.74 ** | 50.13 | |
| PC2 | 11 | 4.82 ** | 30.36 | |
| PC3 | 9 | 2.25 ** | 11.59 | |
| Residuals | 120 | 0.19 | ||
| late | Environments (E) | 5 | 3.48 ** | 12.99 |
| Genotypes (G) | 9 | 7.23 ** | 48.57 | |
| G × E | 45 | 1.14 ** | 38.44 | |
| PC1 | 13 | 2.42 ** | 61.16 | |
| PC2 | 11 | 1.20 ** | 25.59 | |
| PC3 | 9 | 0.54 ** | 9.41 | |
| Residuals | 120 | 0.03 |
**: Significant at 0.01 probability level.
© 2018 by the author. Licensee MDPI, Basel, Switzerland. This article is an open access article distributed under the terms and conditions of the Creative Commons Attribution (CC BY) license (http://creativecommons.org/licenses/by/4.0/).
Share and Cite
MDPI and ACS Style
Elbasyoni, I.S. Performance and Stability of Commercial Wheat Cultivars under Terminal Heat Stress. Agronomy 2018, 8, 37. https://0-doi-org.brum.beds.ac.uk/10.3390/agronomy8040037
AMA Style
Elbasyoni IS. Performance and Stability of Commercial Wheat Cultivars under Terminal Heat Stress. Agronomy. 2018; 8(4):37. https://0-doi-org.brum.beds.ac.uk/10.3390/agronomy8040037
Chicago/Turabian StyleElbasyoni, Ibrahim S. 2018. "Performance and Stability of Commercial Wheat Cultivars under Terminal Heat Stress" Agronomy 8, no. 4: 37. https://0-doi-org.brum.beds.ac.uk/10.3390/agronomy8040037
Note that from the first issue of 2016, this journal uses article numbers instead of page numbers. See further details here.