Field Screening of Waterlogging Tolerance in Spring Wheat and Spring Barley


1
Faculty of Biosciences, Department of Plant Sciences, Norwegian University of Life Sciences, Christian M. Falsensvei 18, 1433 Aas, Norway
2
Norwegian Institute of Bioeconomy, Department of Grain and Forage Seed Agronomy, Nylinna 226, 2849 Kapp, Norway
*
Author to whom correspondence should be addressed.
Agronomy 2018, 8(4), 38; https://0-doi-org.brum.beds.ac.uk/10.3390/agronomy8040038
Submission received: 25 January 2018
/
Revised: 7 March 2018
/
Accepted: 22 March 2018
/
Published: 29 March 2018
Abstract
:Improved waterlogging tolerance of wheat and barley varieties may alleviate yield constraints caused by heavy or long-lasting precipitation. The waterlogging tolerance of 181 wheat and 210 barley genotypes was investigated in field trials between 2013 and 2014. A subset of wheat genotypes were selected for yield trials in 2015 and 2016. Our aim was to: (1) characterize the waterlogging tolerance of genotypes with importance for Norwegian wheat and barley breeding, and (2) identify which phenotypic traits that most accurately determine the waterlogging tolerance of wheat in our field trials. Waterlogging tolerance was determined by principal component analysis (PCA) where best linear unbiased predictors (BLUPs) of the traits chlorosis, relative plant height, heading delay, relative spike number, relative biomass and an overall condition score were used as input variables. Six wheat and five barley genotypes were identified as consistently more tolerant in 2013 and 2014. This included the waterlogging tolerant CIMMYT line CETA/Ae. tauschii (895). Chlorosis and the overall condition score were the traits that best explained the yield response of the genotypes selected for the yield trials. Our results show that early stress symptoms did not necessarily reflect the ability to recover post treatment. Thus, records from full crop cycles appear as fundamental when screening populations with unknown tolerance properties.
1. Introduction
Heavy precipitation, floods, poorly drained soil or improper irrigation management may cause waterlogging and substantial yield loss of wheat (Triticum aestivum) and barley (Hordeum vulgare). The worldwide land area subjected to waterlogging has been estimated to 10–15 million hectares per year [1]. Furthermore, climate changes are likely to include a higher risk of floods and increased precipitation in parts of the world [2,3,4]. Meeting yield requirements of a growing population suggests a demand for wheat and barley varieties better adapted to temporary waterlogging and oxygen deficiency.
During a waterlogging event, water displaces air from the pore spaces in the soil. Soil microorganisms and plant roots respire the remaining oxygen and the reservoirs may be rapidly emptied. Until the soil is drained, the supply will be insufficient for plant root respiration. As the oxygen diffusion rate through water is 104-fold slower than through air [5], the absence of oxygen in the soil has immediate impact on plant cell respiration, inhibiting adenosine triphosphate (ATP) synthesis through the oxidative phosphorylation pathway [6]. Plant cells thus convert to anaerobic respiration to sustain vital cell functions. Ethanolic fermentation, the main anaerobic pathway in plants [7], is far less efficient in synthesizing ATP than oxidative phosphorylation. Hence, the shift from aerobic to anaerobic respiration results in energy shortage [8]. This may inhibit biosynthetic processes such as nutrient uptake [9,10,11] and photosynthesis [12,13]. Chemical alterations that arise in anaerobic soils may cause additional stress to plants. For instance, the reduction of iron and manganese to plant available Mn2+ and Fe2+ may reach toxic levels and are especially harmful in acidic soil where they co-occur with aluminum [14,15].
Waterlogging may cause substantial yield loss. Genotypes of both wheat [1,16,17,18] and barley [19,20] may tolerate waterlogging differently. Setter et al. [20] found that grain yield loss varied from 18 to 81% and from 16 to 49% among sixteen wheat and eight barley genotypes, respectively. Yield loss has been attributed to nearly all yield components: the number of tillers and spikes [21,22], grains per spike [23,24], spikelets per spike and floret formations per spikelet [25], as well as the grain weight [26]. In an outdoor pot study, Marti et al. [27] registered a wheat yield loss equivalent to 175 kg ha−1 day−1 when waterlogging occurred in the stem elongation period. The yield penalty depends on factors such as the duration of the waterlogging event [27], the developmental stage at the onset [1,28,29] and growth conditions, e.g., temperature [30] and soil properties [21,31]. These environmental factors may cause strong GxE interactions and genotypes may perform inconsistently across different environments [15,17].
Waterlogging may have profound impact on both root and shoot traits. Stress symptoms related to the shoots include ceased leaf extension and/or reduced biomass accumulation [32,33], foliar chlorosis or reduced chlorophyll content, as well as leaf senescence [10,22,24,31]. In addition to these symptoms and the yield components previously mentioned, the plant development, e.g., the date of heading may be delayed [21,24]. A variety of phenotyping approaches have been used to determine waterlogging tolerance in both field and greenhouse experiments. Van Ginkel et al. [18] found that visual scores of foliar chlorosis correlated strongly with yield obtained under waterlogged conditions. Setter et al. [20] on the other hand, reported that actual grain yield was a better selection criterion in Western Australia. In a study by Collaku and Harrison [22], tiller number counted at maturity was the most affected trait. Musgrave and Ding [16] found that the mineral content of roots (sum of Fe, Mn and P) and a visual score of root color correlated with yield under waterlogged conditions. In the assessment by Arguello et al. [34], normalized difference vegetation index (NDVI) was the best yield predictor of both biomass and grain yield. Zhou [35] defined waterlogging tolerance as a combined score of chlorosis and survival to determine the tolerance of 177 double haploid barley lines derived from the cross between the sensitive variety “Franklin” and tolerant “Yerong”. Ballesteros et al. [36] calculated an index based on the proportion of shoot or root biomass produced under waterlogged relative to control conditions. Pang et al. [31] recommended chlorophyll fluorescence (Fv/Fm) for tolerance determination of larger populations. However, the dark adaptation requirement for chlorophyll fluorescence measurements makes it less suitable for field screenings. In summary, there appears to be little agreement as to which traits most accurately determine waterlogging tolerance. Although high grain yield is the ultimate goal, as a selection criterion it has low heritability [34,37] and is confounded by other factors. One or a few traits, which clearly differentiate tolerant from sensitive genotypes across different environments, have not been defined. The apparent complexity of the trait, dependence on environmental factors and the comprehensive stress response one may observe are perhaps underlying reasons. This suggests that screening work ought to be concentrated to target environments and under relevant circumstances. It also suggests that the most relevant phenotypic traits may depend on the growth conditions under consideration.
In this paper, we present results from a four-year field screening trial of spring wheat and a two-year field screening trial of spring barley for waterlogging tolerance. The objectives of our research have been to: (1) document waterlogging tolerance of wheat and barley genotypes with unknown tolerance properties, and (2) identify which phenotypic traits most accurately determine the waterlogging tolerance of wheat in our field trials.
2. Materials and Methods
2.1. Experimental Site and Growth Environment
The experiments were conducted at Vollebekk Research Farm (coordinate 59.7° N, 10.8° E) of the Norwegian University of Life Sciences, Aas, Norway. The experimental site was autumn plowed and spring harrowed in all seasons except for 2015 when both plowing and harrowing were done in the spring. Compound fertilizer containing 132 kg N, 18 kg P, 60 kg K ha−1 was applied prior to seeding. Sowing occurred in late April or early May or June (Table 1). The weather conditions differed slightly during the years (Table S1).
The waterlogging experiments were placed on two different areas of the site (N and S), with north-south orientation, approximately 100 m apart. In 2013, the wheat and barley experiments were located in the northern area of the field (N). In 2014 and 2015, the wheat experiments were also placed in the northern area. The placement of wheat was changed to the south (S) in 2016. The barley experiment was placed in the south in 2014.
2.2. Plant Material
The experiments included 210 genotypes of spring barley and 181 spring wheat genotypes (Tables S2 and S3). The genotype collections included advanced breeding lines, cultivars, landraces and various crossing parents. The majority of wheat genotypes were of Norwegian origin (47%), of Swedish origin (12%), and from CIMMYT (24%). A number of CIMMYT genotypes, previously found to be waterlogging tolerant were included in the experiments [1,38,39]. PRL/SARA, VEE/MYNA, Ducula-1, Ducula-2, Ducula-3, Ducula-4, ALTAR 84/Ae. tauschii (221), 68.111/RGB-U//WARD/3/Ae. tauschii (454) and CETA/Ae. tauschii (895) were included in 2014, while Dulus, BOTNO/Ae. tauschii (617) and DVERD_2/Ae. tauschii (221) were included in both 2013 and 2014.
The barley collection was also dominated by Norwegian genotypes (58%, Table S2). Other major sources were Sweden (15%), Denmark and Finland (13% in total). The variety Henni was included especially as it performed well in the study by Bertholdsson [19].
The genotypes were screened in hillplots in 2013 and 2014. Based on results from those years, a subset of wheat genotypes (Table 2) were selected for the 2015 and 2016 experiments. Several aspects were considered when selecting genotypes. Our aim was to select genotypes that were either more tolerant or more sensitive. Other factors that influenced our selection was related to their suitability for combine harvest, relatedness (closely related genotypes were avoided) and that good quality seed was available.
2.3. Experimental Design and Treatment Procedure
The experiments were conducted as randomized alpha lattice designs with three and four replicates in 2013–2014 and 2015–2016, respectively. In the first two years, the experiments were carried out in hillplots with 4 gm. of seed in each plot. In the latter two years, the plot size was scaled up to 0.75 × 3 m to allow for yield measurements. Seeding rate was 50 and 70 gm. per plot in 2015 and 2016, respectively. Waterlogged and non-waterlogged control treatments were drill seeded in two separate but adjacent experiments.
An excavator was used to create levees and trenches surrounding the waterlogging experiments. The levees were reinforced with durable plastic. At the 3-leaf stage, water was pumped in to the experiments using irrigation pipes. By maintaining a gentle water flow throughout the treatment period, the water level was kept relatively constant just above the soil surface. The treatment lasted until the plants showed considerable stress symptoms and genotypic differences were easily distinguishable. The treatment duration differed between the years (Table 1).
2.4. Soil Characteristics and Measurements
The soil on the experimental site is classified as a mollic gleysol [40], a soil type that is characterized by being ground-water affected and poorly drained.
To monitor the soil redox potential, platinum electrodes (Ag/AgCl reference (HI 3032) Hanna Instruments, Inc., Woonsocket, RI, USA) connected to a portable pH/millivolt-meter (HI 8424, Hanna Instruments, Inc., Woonsocket, RI, USA) were used. Measurements were made directly in the waterlogged soil at 4–5 cm depth. The redox potential on control plots was not measured, as the electrodes cannot measure in a solid medium. Measurements were taken three and eight days into the waterlogging treatment in 2014, after nine days in 2015 and after three and five days in 2016. The average and standard deviation in millivolt (Eh) was calculated based on a minimum of six measurements.
To quantify the infiltration rate on the waterlogging fields at location N and S, a single ring infiltrometer test with falling head conditions was conducted in the spring of 2017. Plastic rings, 20 cm in length and 9.8 cm in diameter, were hammered down to 5 cm depth directly on the plough pan, approximately 23 cm below the soil surface. The rings were filled with water and the height of the water was measured with 10-min intervals for 30 min in total. Four measurements were made per site. The rings were refilled with water after each reading. Water was also poured in the hole surrounding the rings to ensure vertical flow within the ring. The infiltration rate in mm h−1 was calculated as the difference in water height between 0 and 10 min, divided by the number of minutes.
Soil samples for chemical and physical analysis were taken in the top soil layer in 2014. The soil bulk density and soil porosity (%) in the 4–9 cm layer were determined by using 100 cm3 steel cylinders. Samples for chemical analysis and soil texture were taken in the 0–15 cm layer. Contents of phosphorus, potassium, calcium and magnesium were determined by ammonium lactate extraction and inductively coupled plasma optical emission spectrometry. A sedimentation analysis with the pipette method was used to determine the soil particle size distribution in the samples. pH was measured in deionized water.
2.5. Measurements and Phenotypic Registrations
Traits clearly affected by the treatment that could be quantified by visual scoring or simple measures were recorded. Not all traits were recorded each year due to slight variations in the expressed stress response. Traits recorded in all years include the percentage foliar chlorosis on plot basis, the date of heading, plant height, and an overall condition score. The percentage of chlorosis was recorded when genotypic variation could be clearly observed. Heading date was determined when 50% of the heads in each plot had fully emerged. The heading delay was calculated as the difference between control and waterlogged plots. The plant height was measured in centimeters from the base of the culm to the first spike node. The number of spikes were counted directly in the hillplots in 2014. In 2015 and 2016, samples from a 50 × 50 cm area (2 rows) were harvested at maturation. These samples were used for the determination of spike number and straw yield. The overall condition score was based on the plants condition around maturation, and included a consideration of spike size, biomass, and the overall vigor. A combined score, on a 1–10 scale with 1 being the poorest, was given. The overall condition score was intended to indicate the yield potential of the genotypes, similar to the agronomic score given by Van Ginkel et al. [18]. In 2013, excessive precipitation caused waterlogging conditions in the control fields. It was therefore necessary to obtain control values for each genotype from a variety trial with similar statistical design, located 100 m from the waterlogging trial.
In 2014, the treatment caused severe stress in wheat and most plants became necrotic. After draining the experiments, the plants recovered growth of existing leaves and/or developed new ones. The ability to recover clearly differed among genotypes and was visually scored on a 1–10 scale, with 1 being the poorest. The percentage of green biomass, relative to senesced biomass, was recorded five and nineteen days after drainage. Wheat grain yield was harvested in 2015 and 2016 and the weights were adjusted to 15% moisture content.
2.6. Statistical Analysis
The R software was used for all statistical analysis [41]. Normally distributed phenotypic results were analyzed in the linear mixed model yijl = µ + τi + γj + ρi(j) + εijl, where τ is the effect of the genotype, γ is the effect of the replicate, ρ is the effect of block within replicate and ε is the error term. Genotype was treated as a random variable and the data was analyzed using the “lme4” package [42]. Results for control and waterlogged plots were analyzed separately. Estimated genotype means from control and waterlogged plots were used to calculate relative values of yield, plant height and number of spikes by dividing the value obtained on waterlogged plots by the control values. In 2013, relative values for plant height and the difference in heading date was calculated prior to the analysis of variance. This was done as the control values were obtained on another variety trial. Chlorosis, green biomass and overall condition scores were given only to waterlogged plants.
Best linear unbiased predictors (BLUPs) constituted the input variables (Tables S2 and S3) for principal component analysis (PCA) on the basis of correlation matrix. The princomp function in the “stats” package was used for the PCA. Scores for principal component 1 (PC 1) were used as an estimate for the genotypes’ waterlogging tolerance.
The relationship between PC 1 scores and grain yield data was evaluated in simple linear models with PC 1 as regressor and relative grain yield as response variable. In addition, the individual phenotypic traits and grain yield were analyzed in simple linear regression models.
3. Results
3.1. Soil Measurements
The chemical composition regarding plant available fractions of P, K, Ca, Mg and Mn, pH, total carbon and nitrogen was similar at both locations, in both waterlogged and control experiments (Table S4). The soil texture was determined to silty or medium loams.
Redox potential (Eh) measured at 4–5 cm depth ranged between 181 and 291 from 2014 to 2016 (Table S5). Repeated measurements were made within a few days in 2014 and 2016 but the results did not indicate a difference in the redox potential. The infiltration rate measured in 2017 was vastly different on location S and N. The average infiltration rate in mm h−1 ± the standard deviation at location S was 391 ± 242, 278 ± 162 and 211 ± 126 after 10, 20 and 30 min, respectively. The infiltration at location N was so poor that it was unmeasurable within the mentioned time intervals. Infiltration was still not quantifiable even after approximately 2 h.
3.2. General Stress Responses
Signs of stress were visible three to four days into the treatment, but genotypes were still not easily distinguishable at that time. The first visible symptom was chlorosis of older leaves. Later on, the whole plants became chlorotic and leaves started to senesce. Vegetative growth, i.e., leaf biomass and eventually plant height, was clearly reduced when compared to control plots. For most genotypes, the date of heading was delayed and the size of individual spikes was reduced.
3.3. Screening in Hillplots in 2013 and 2014
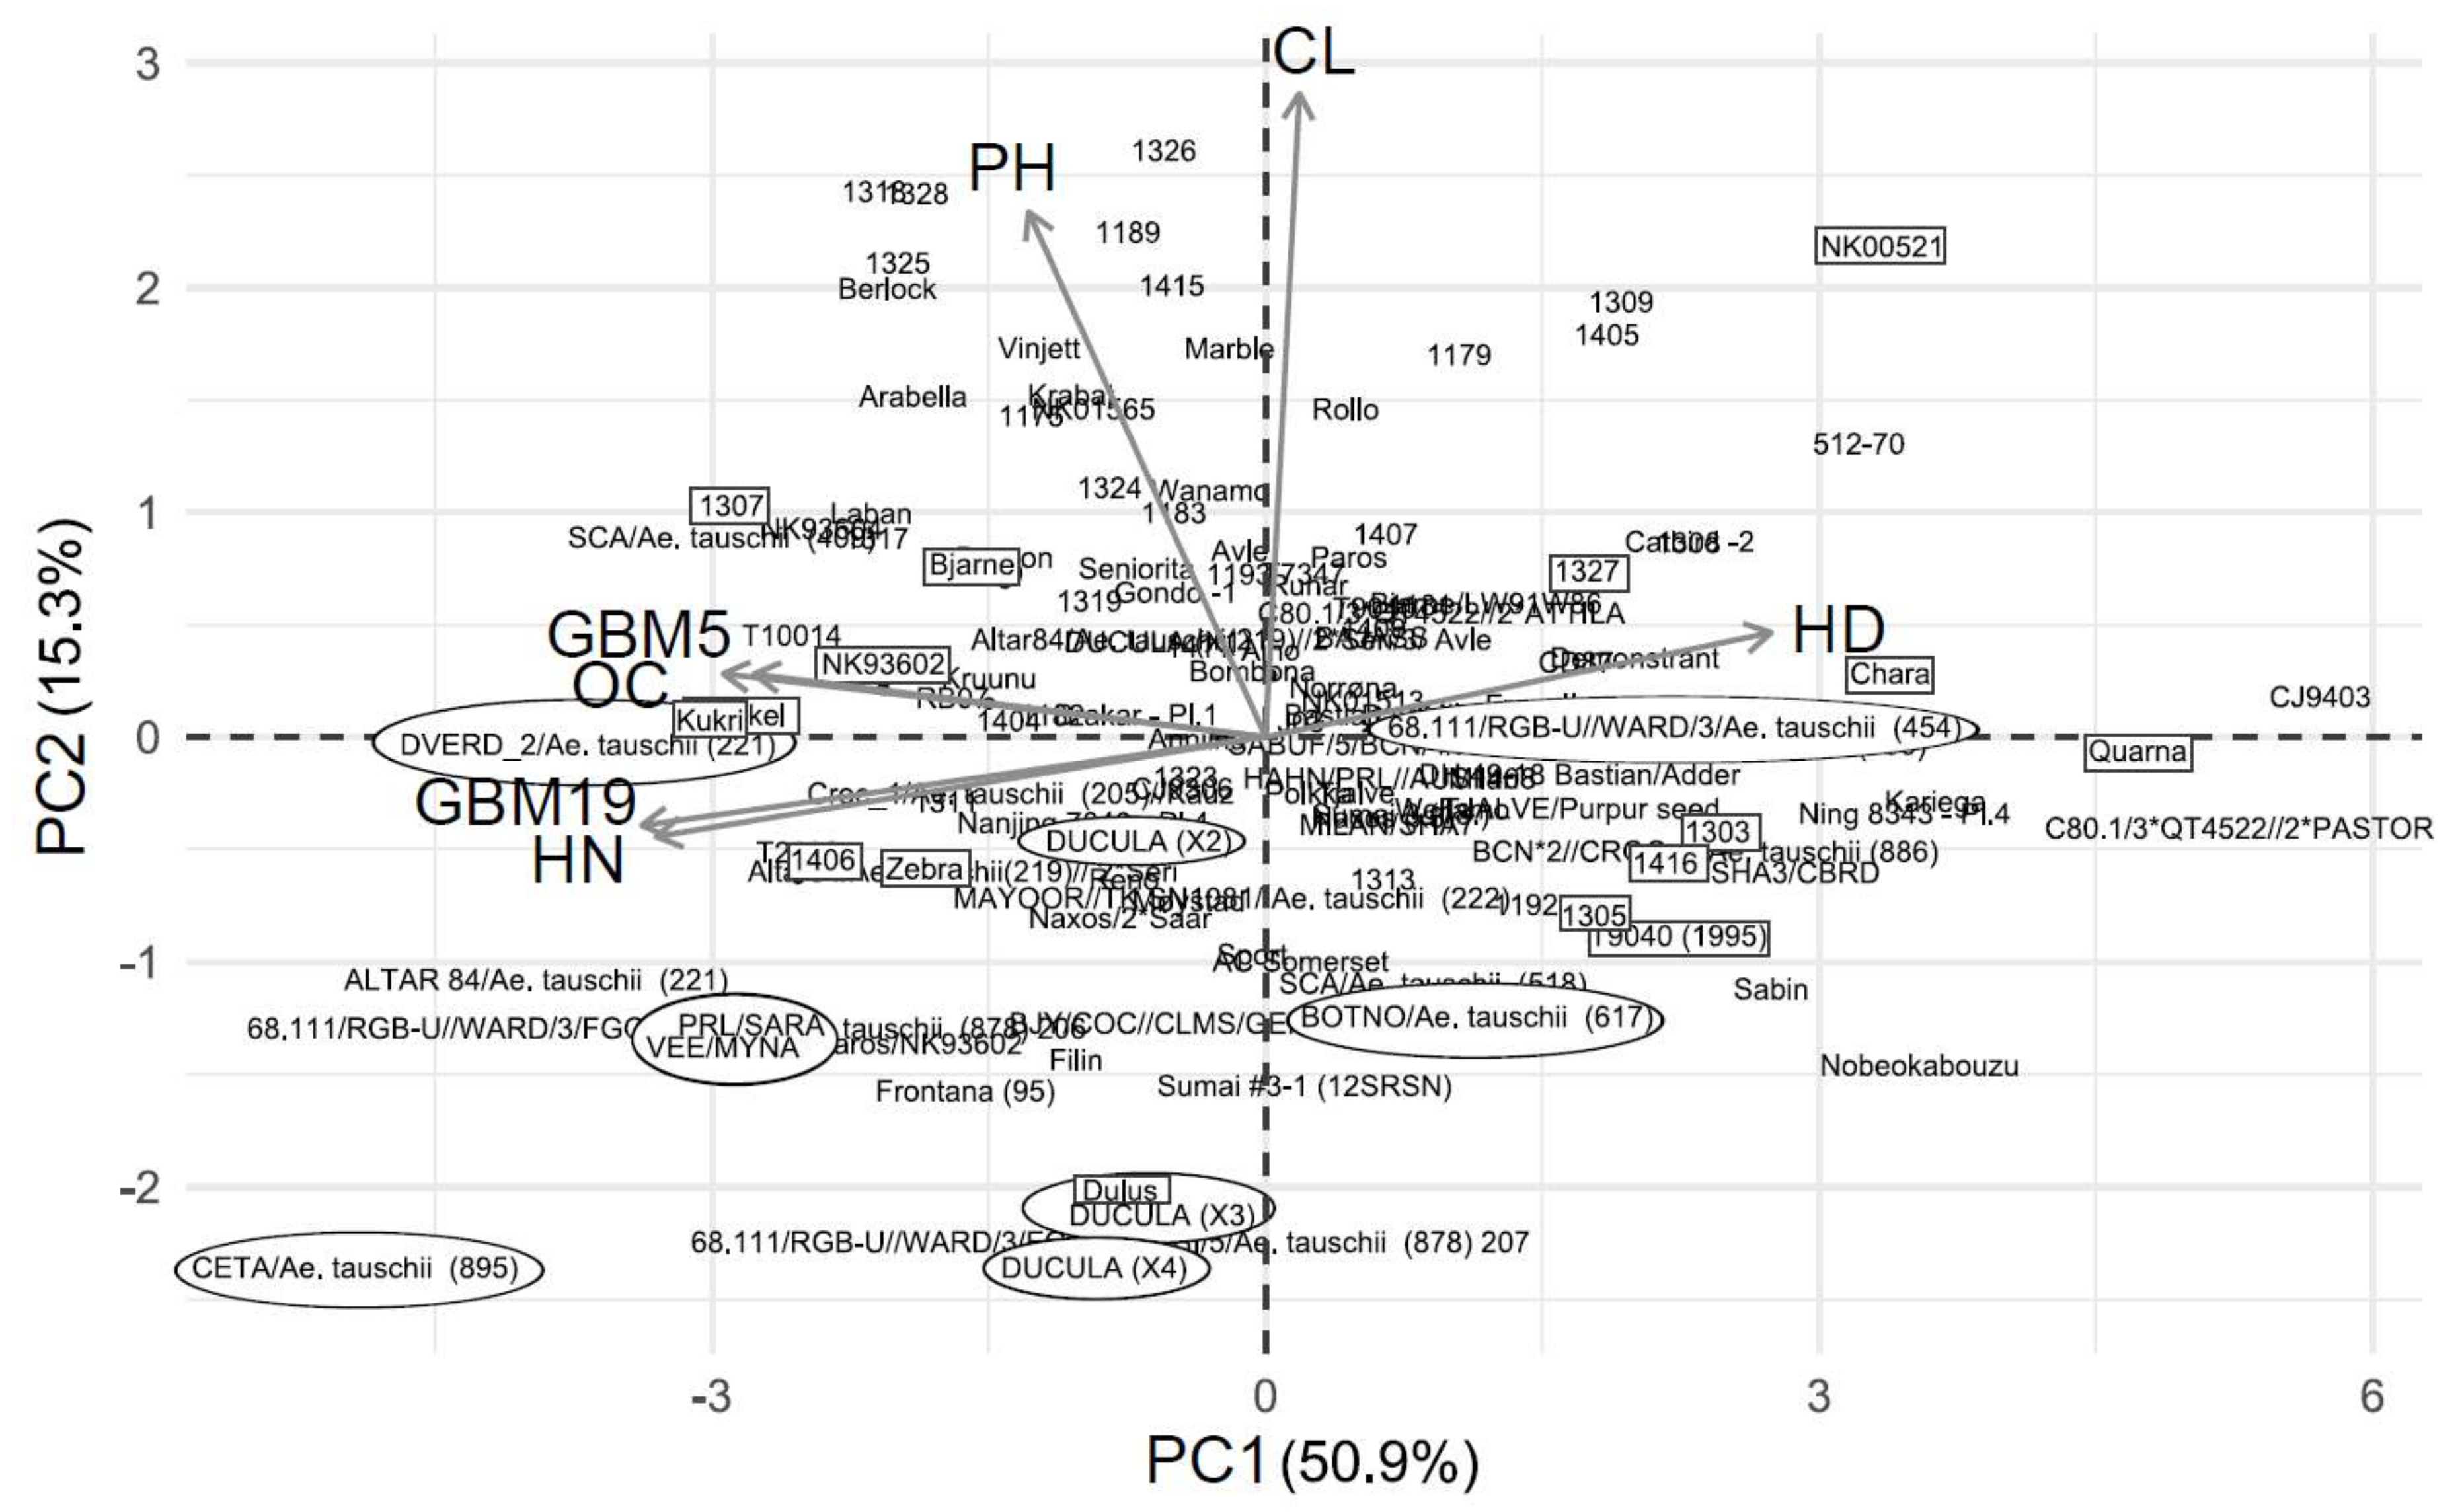
PC 1 explained 48.2 and 50.9% of the variance in wheat in 2013 and 2014, respectively (Figure 1 and Figure 2). Variables with arrows pointing in the same direction are positively correlated, while variables with arrows pointing in the opposite direction are negatively correlated. A high or low PC 1 score indicates sensitivity and tolerance, respectively. The variable overall condition had the highest contribution to PC 1 in both years while plant height contributed the least in 2013 and chlorosis in 2014 (Table 3). Chlorosis was correlated with the delay in heading in 2013 (Figure 1; Table S6. In 2014, the overall condition was positively correlated with the green biomass 5 days after drainage (Figure 2). The green biomass recorded 19 days after drainage was positively correlated with the number of heads and negatively correlated with the heading delay. Genotypes that performed well in the experiments generally had a high score for overall condition and their heading date was less delayed.
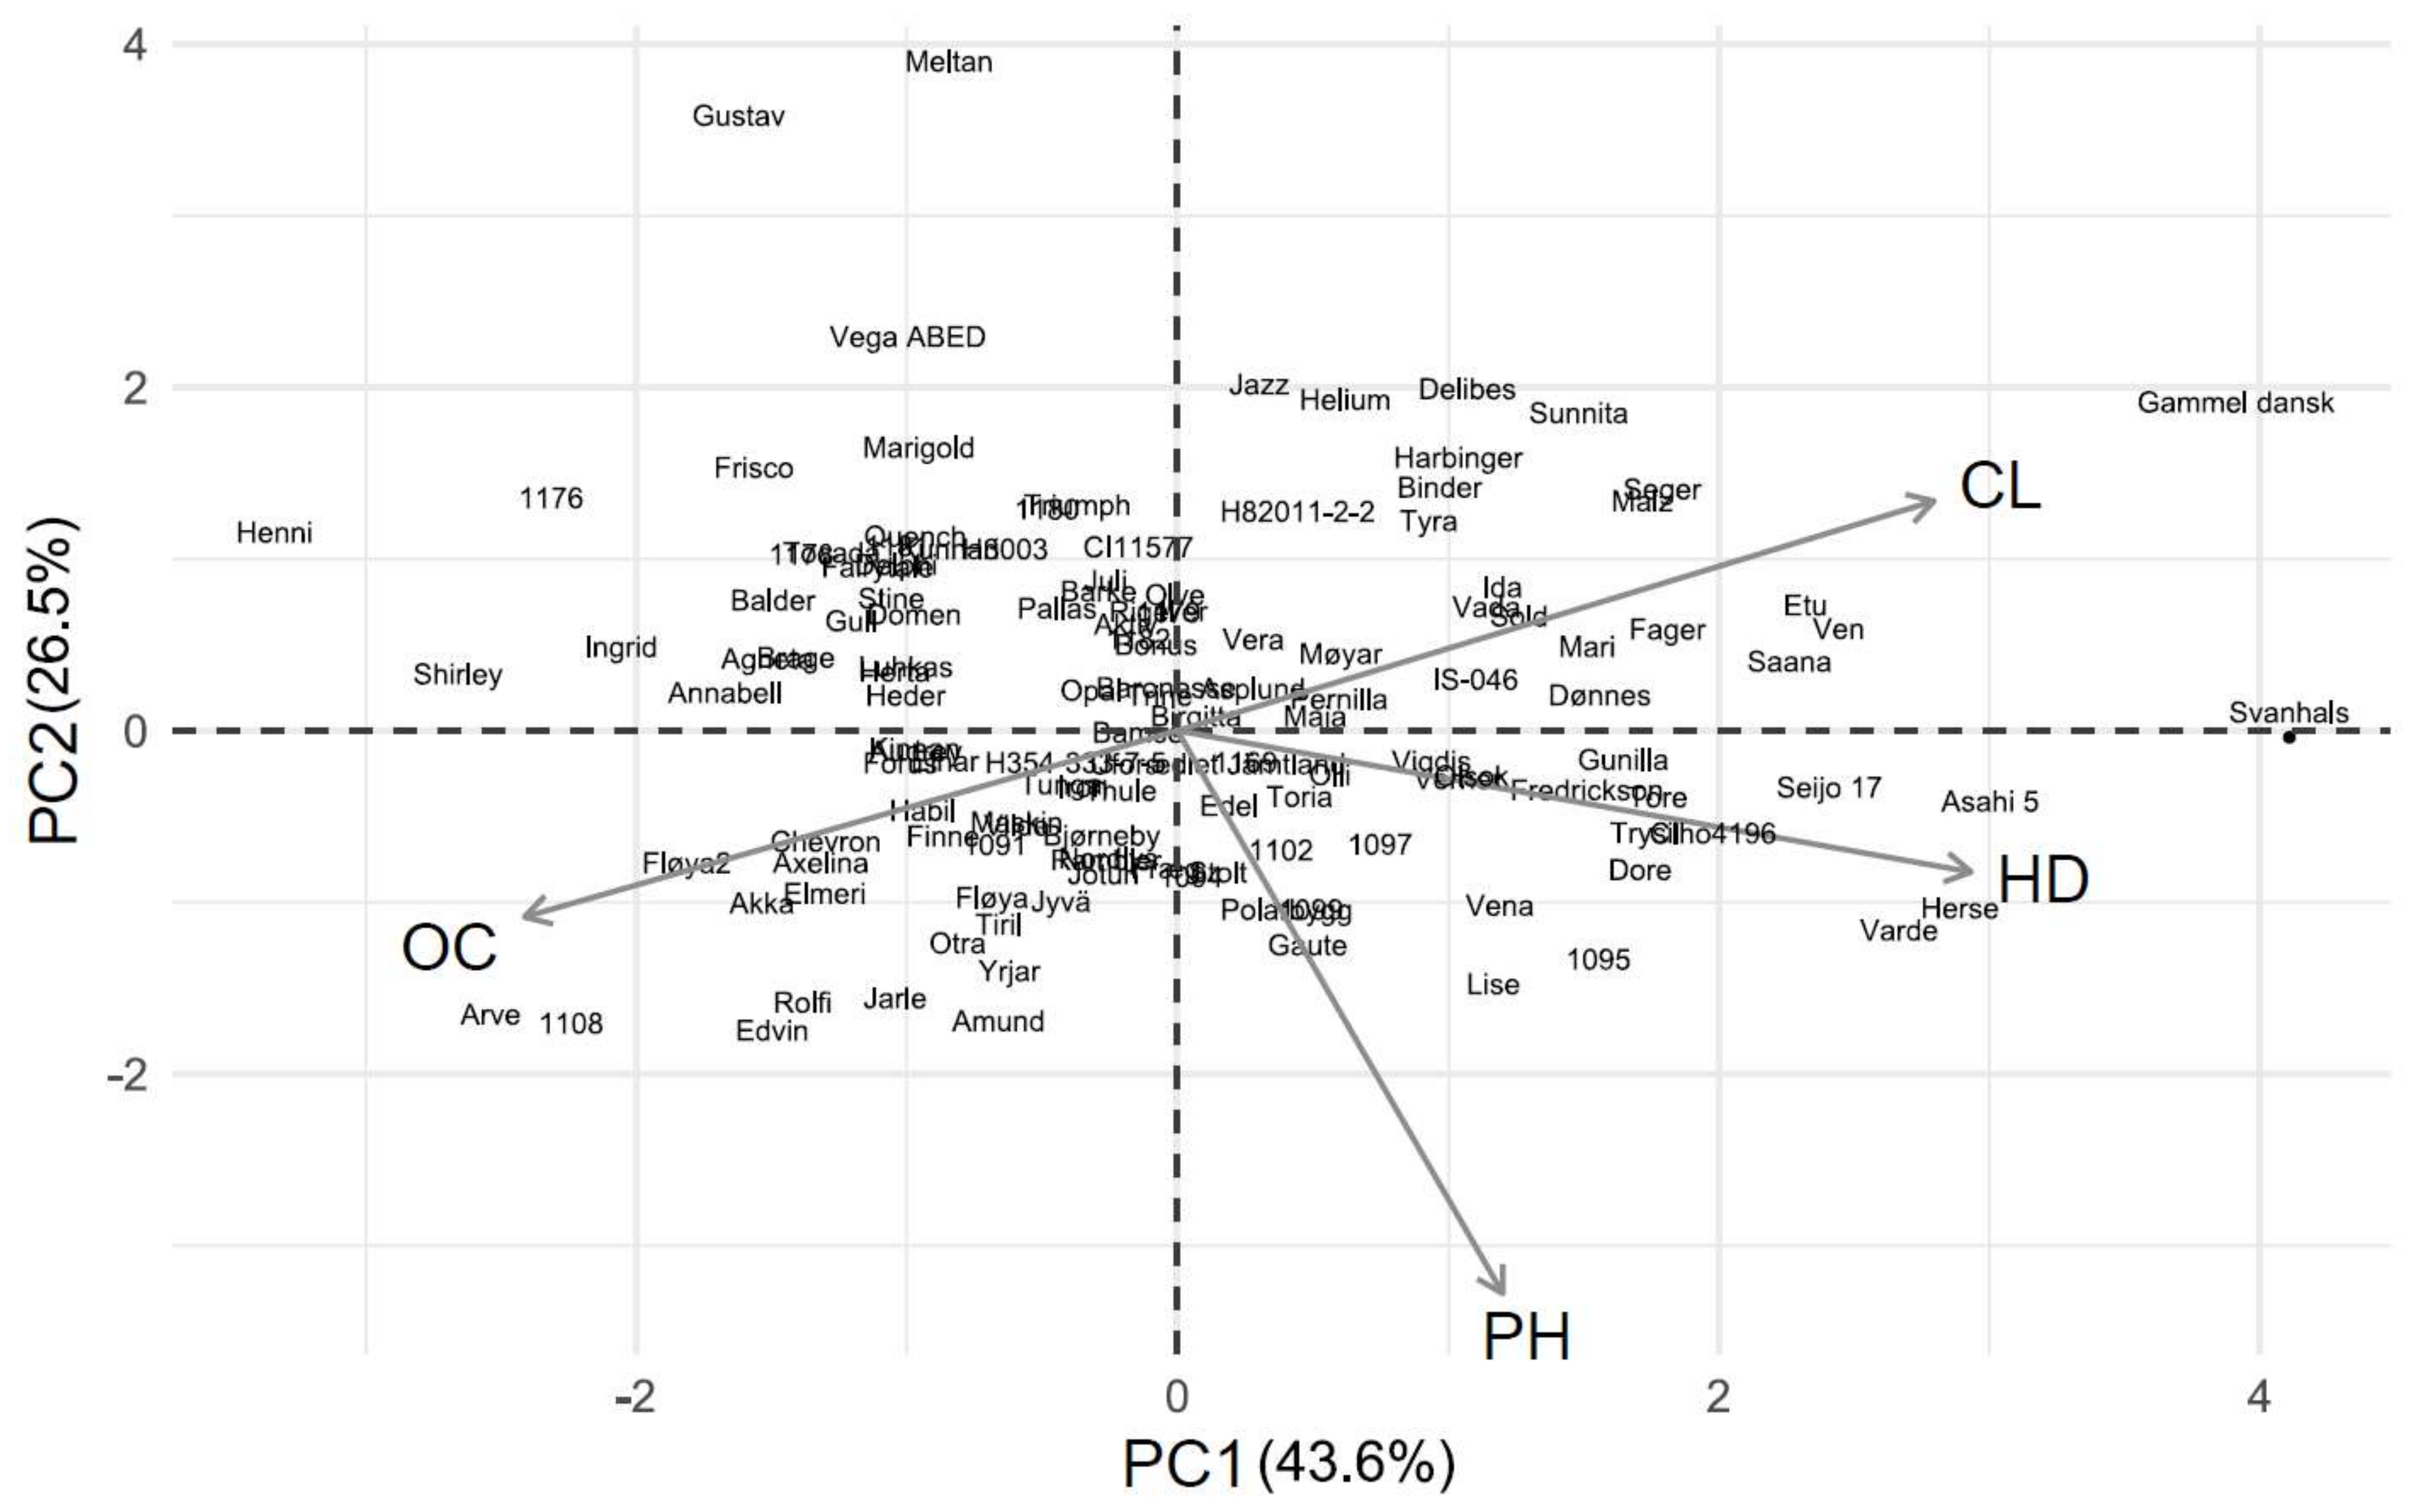
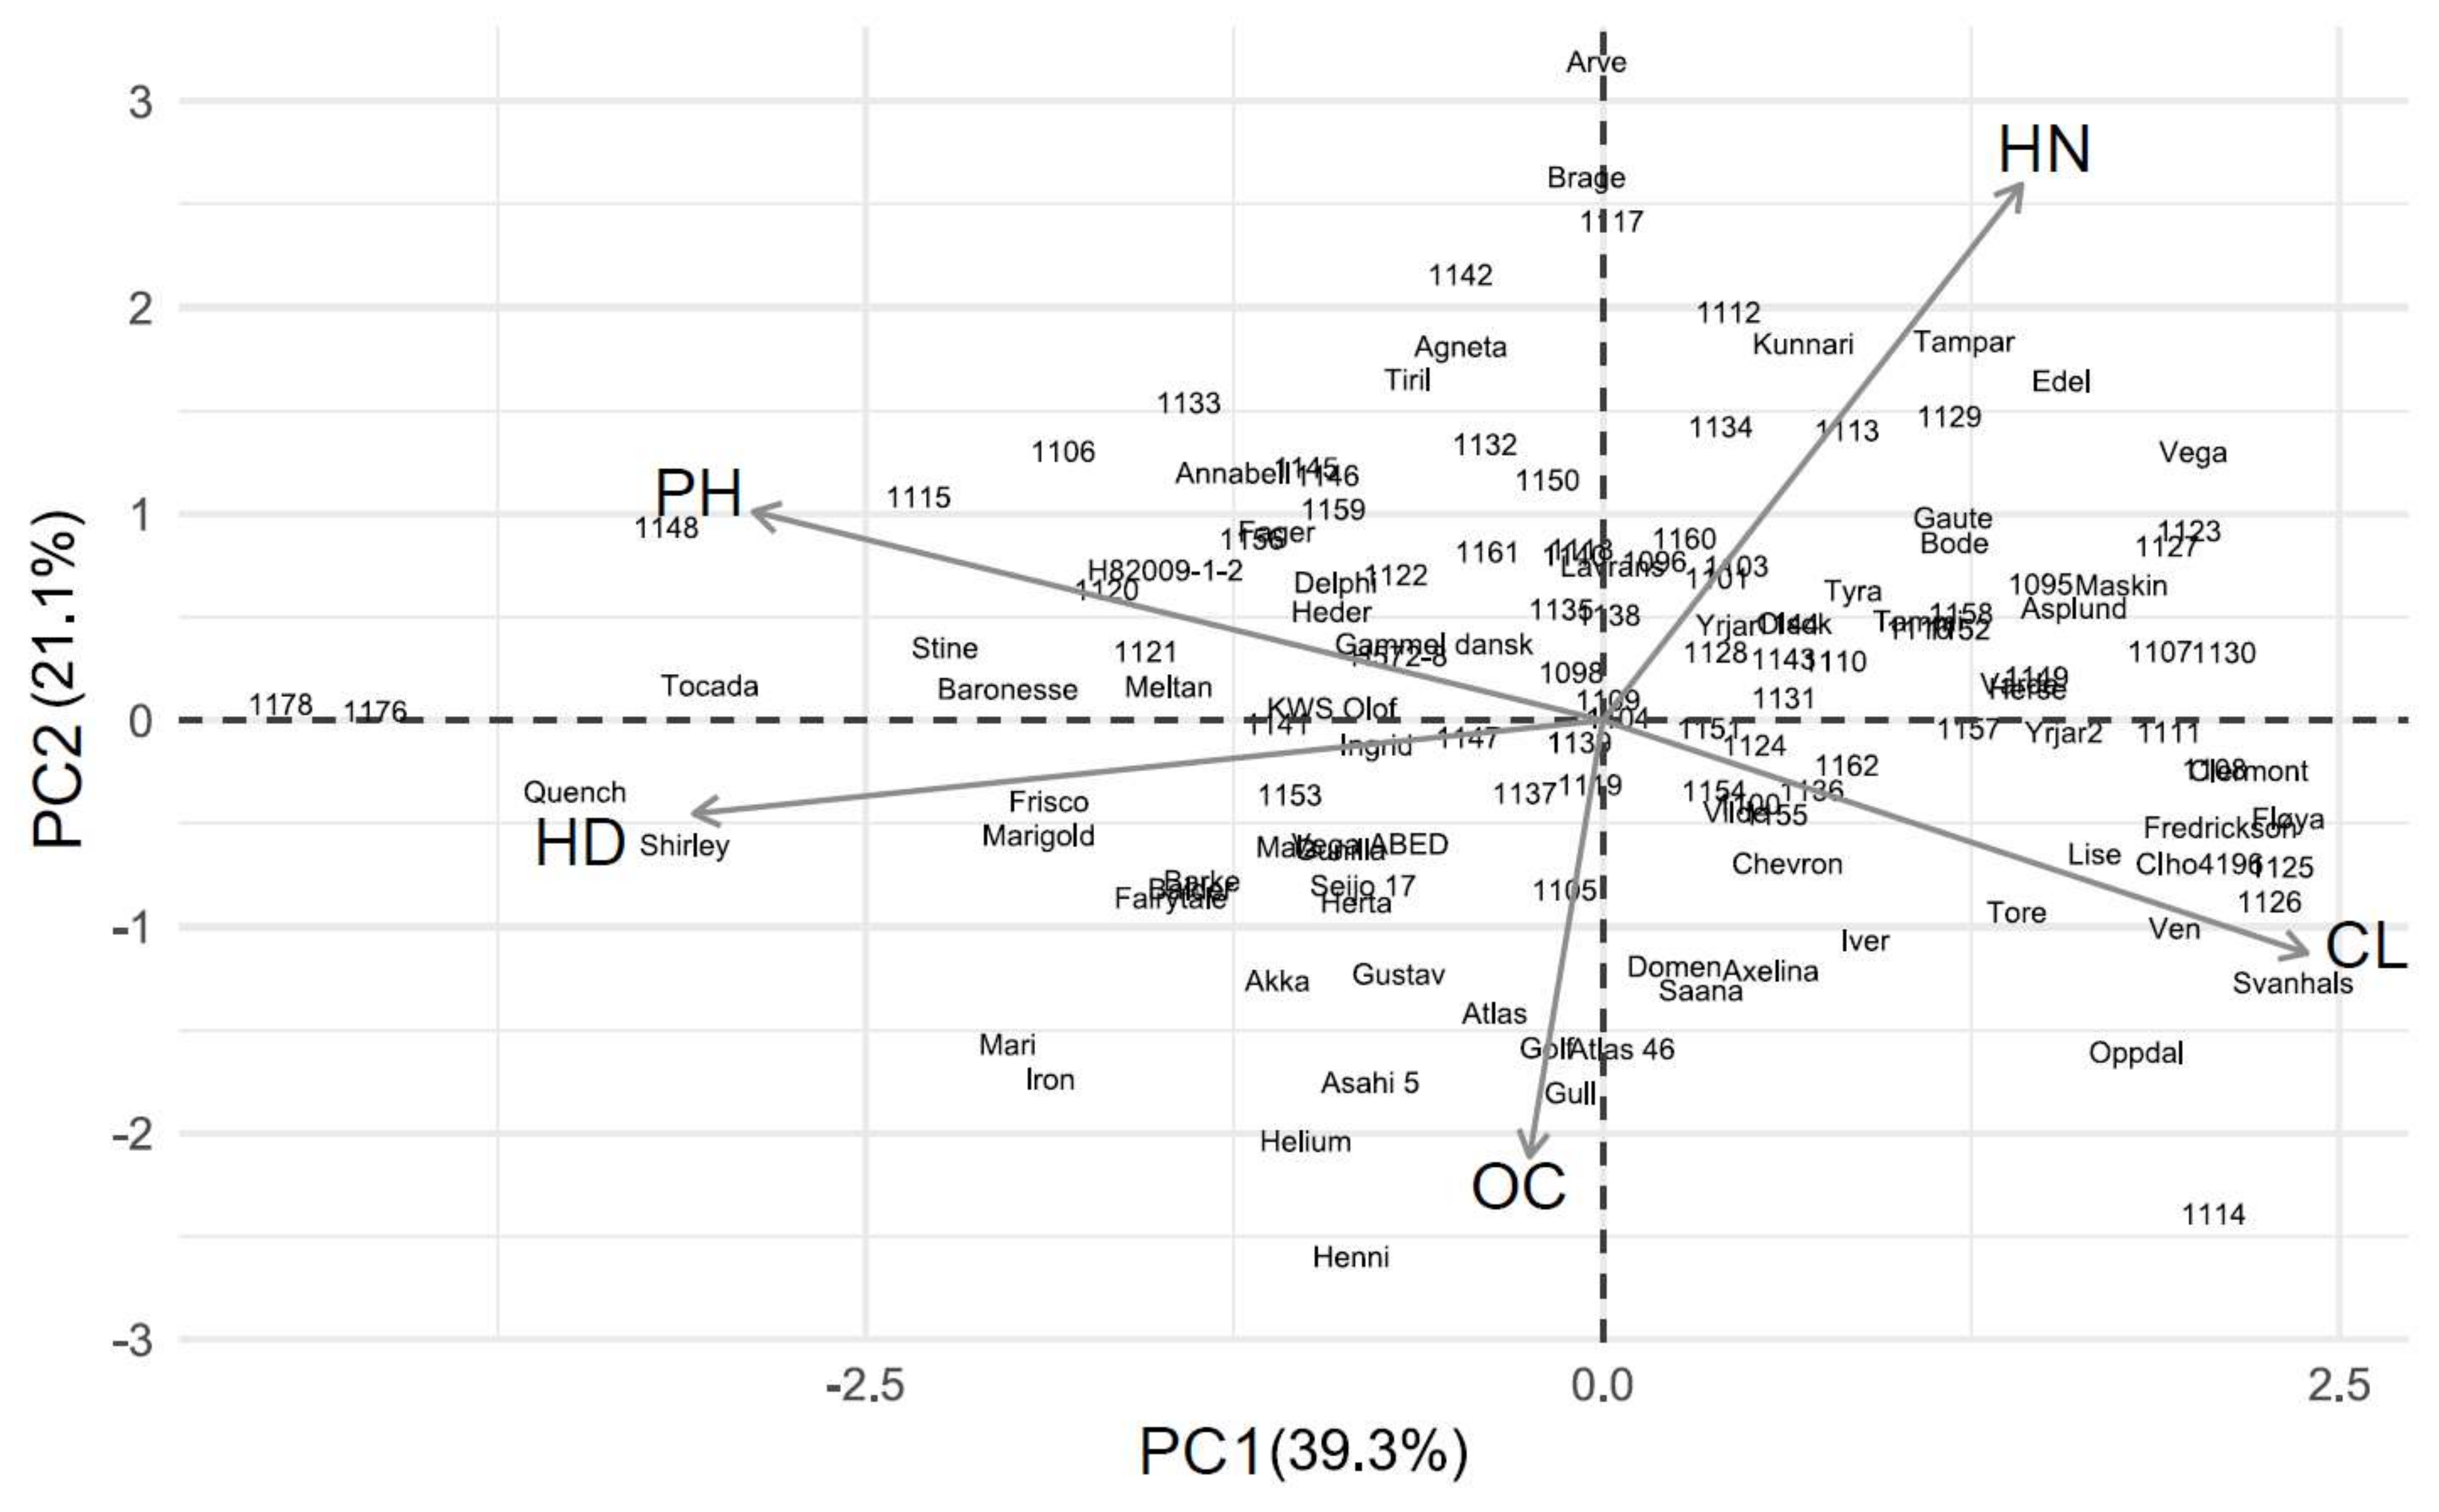
PC 1 explained 43.6 and 39.3% of the variation in the barley experiments in 2013 and 2014, respectively (Figure 3 and Figure 4). Chlorosis was negatively correlated with the overall condition score in 2013 and with the relative plant height in 2014 (Table S7). The heading delay, overall condition and chlorosis contributed similarly to PC 1 in 2013, while plant height was less important (Table 3). In 2014, the overall condition contributed the least and heading delay the most to PC 1.
Of the 181 wheat genotypes that were screened in 2013 and 2014, 106 were screened in both years. Of the 25% most tolerant genotypes, according to their PC 1 score, six genotypes were consistently more tolerant in both years (Table 4). Of the 25% most sensitive genotypes, twelve of them were consistently more sensitive. Similarly, of the 61 barley genotypes that were screened for both years, five of them were consistently more tolerant and eight were consistently more sensitive (Table 4).
3.4. Yield Registration Experiments in 2015 and 2016
The absolute wheat yields obtained on both waterlogged and control plots were generally lower in 2015 than 2016 (Table 5). Among the ten genotypes that were included in both years, the correlation in yield between 2015 and 2016 was 0.82 (p = 0.003) on control plots. Correlations between waterlogged and control plots were 0.82 (p = 0.003) in 2015 and 0.80 (p = 0.005) in 2016. Relative grain yields obtained by the wheat varieties were of a similar order of magnitude in 2015 and 2016. They ranged from 25% to 37% in 2015 and from 24 to 41% in 2016. Yield obtained on waterlogged plots was non-correlated between 2015 and 2016. Bjarne, which had the highest relative yield in 2015, had a relative yield in the lower range in 2016. Kariega, identified as a consistently more sensitive variety based on the hillplot trials, had 28% relative yield in 2015, but was one of the least affected genotypes in 2016. However, this genotype is significantly lower yielding than most other genotypes.
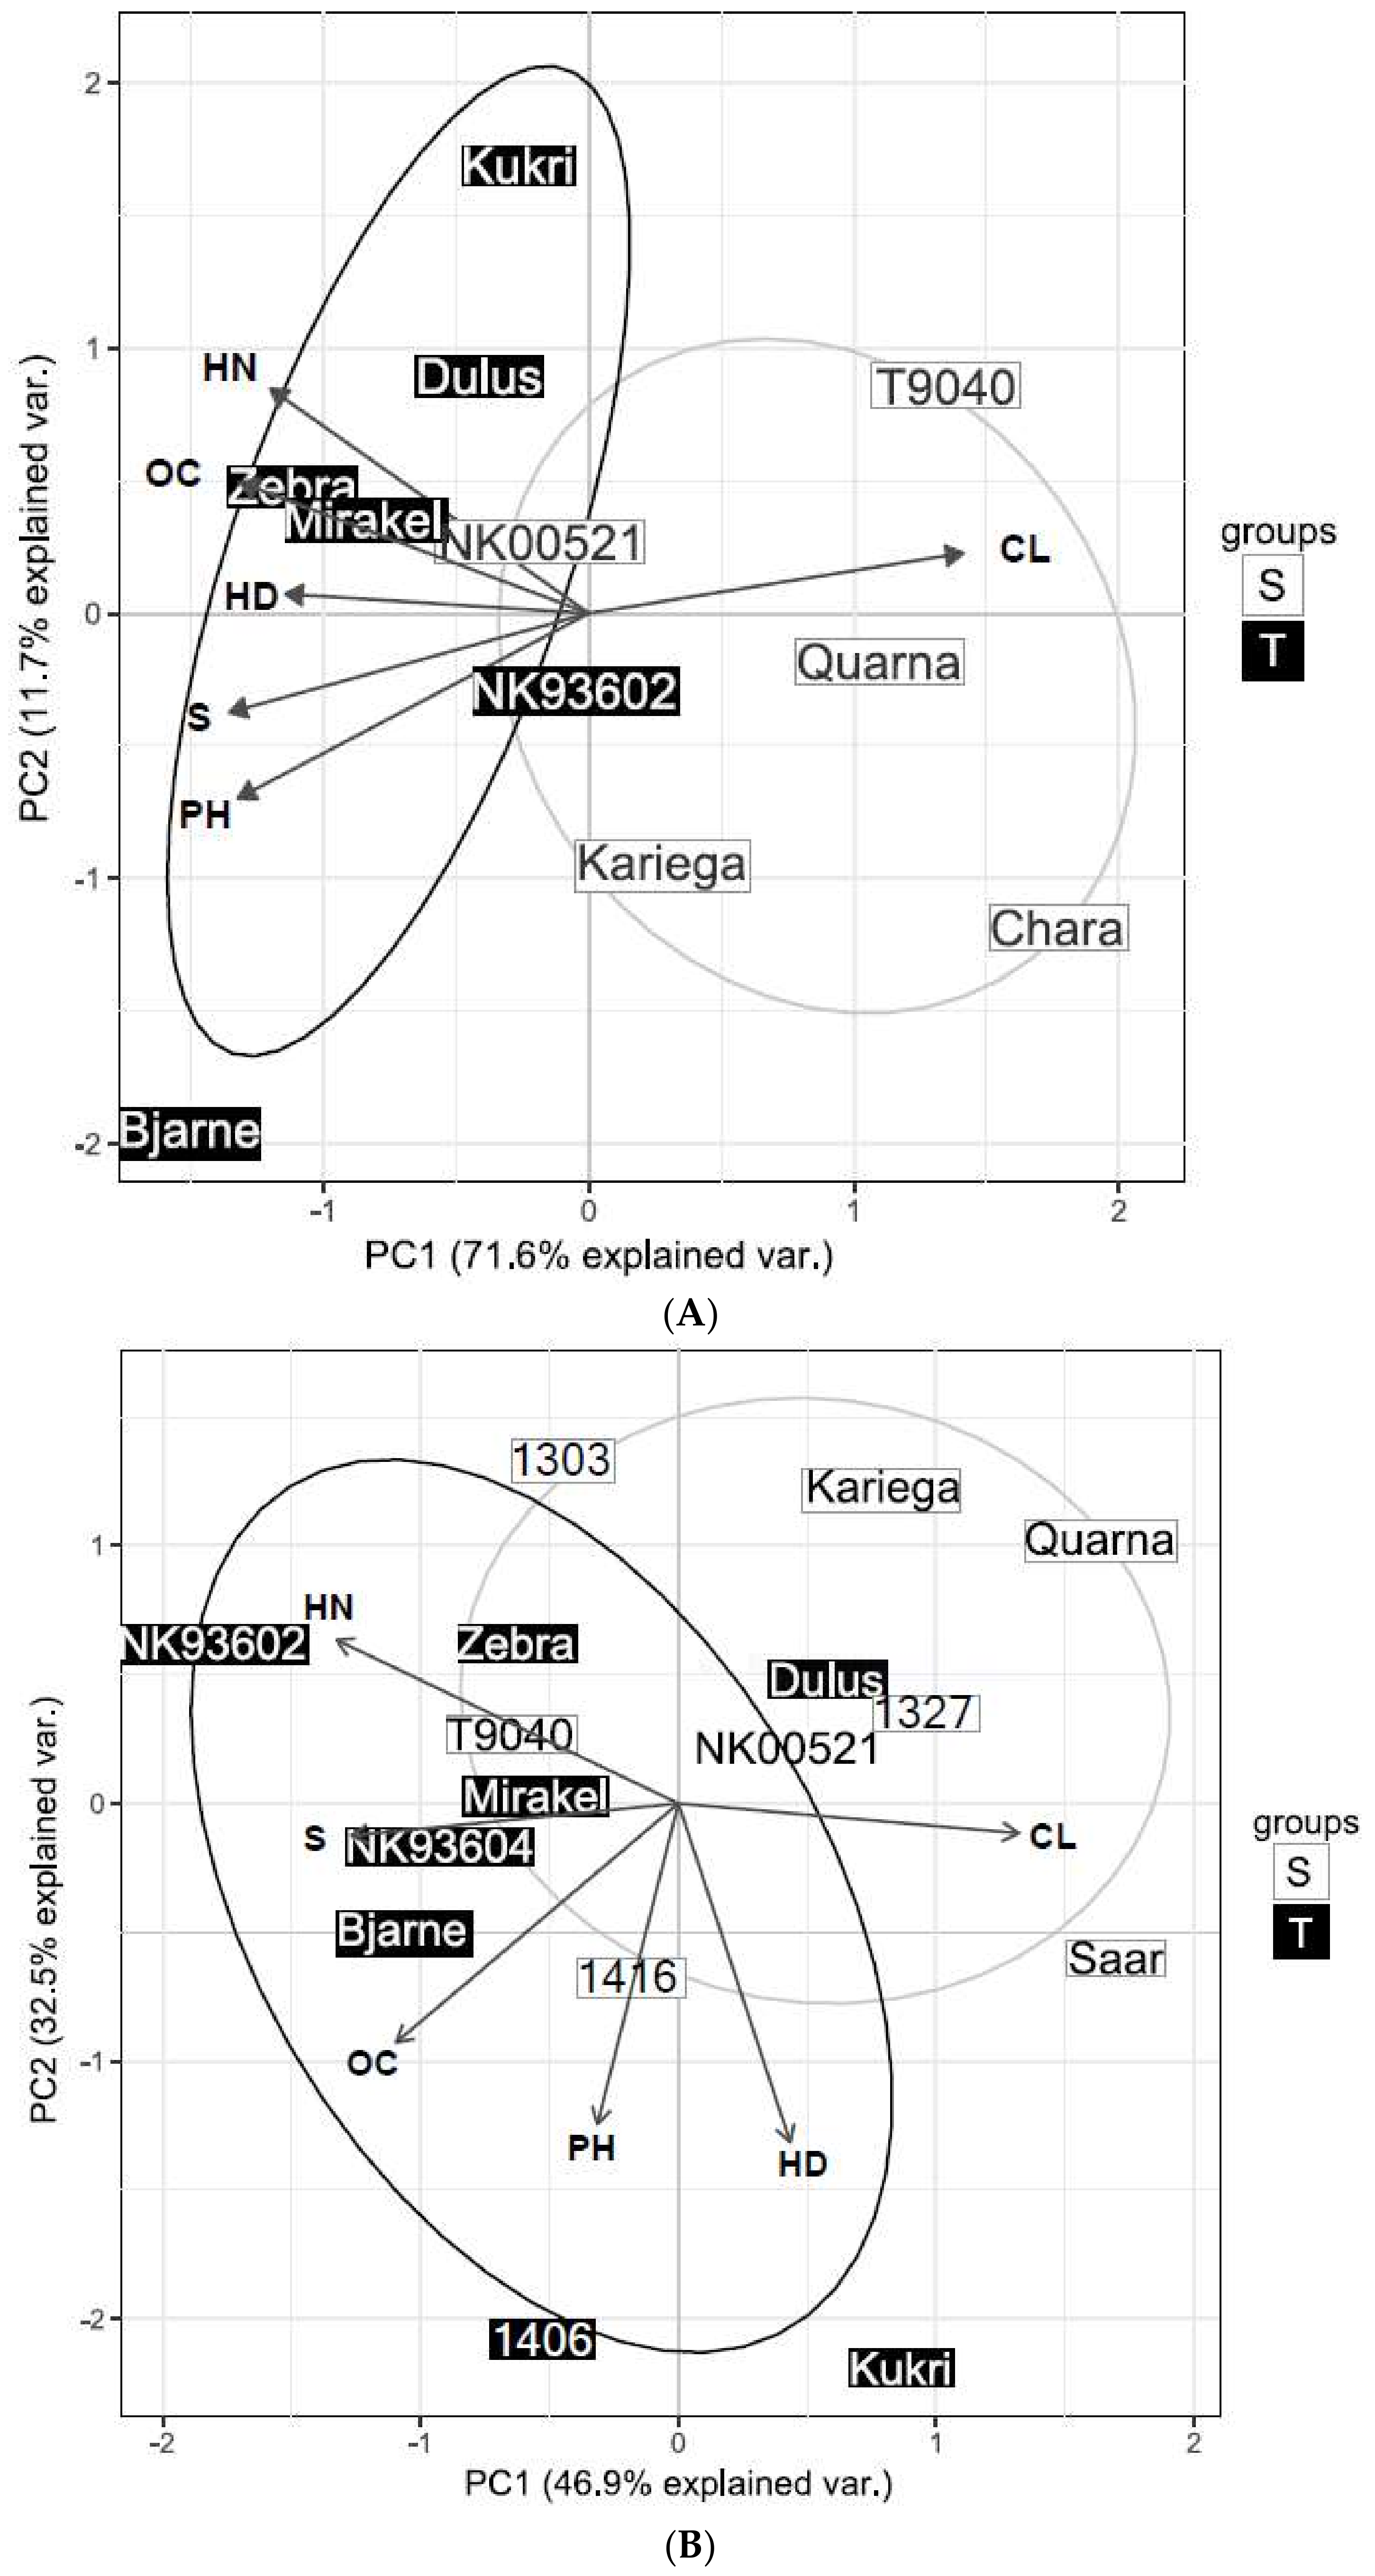
Variance explained by PC 1 in wheat was 71.6% in 2015 (Figure 5A). The traits contributed similarly to PC 1 (Table 3). Genotypes expected to be more tolerant showed similar responses (Figure 5A). Yet, Bjarne was differentiated from Zebra, Mirakel, Dulus, Kukri, and NK00521 by having a less reduced plant height and a heading date more similar to the control. Zebra, NK93602, Kukri, Mirakel, and Dulus on the other hand, were more associated with high overall condition scores, many heads per plot, and had a less delayed heading date. The more sensitive genotypes were associated with a high percentage of chlorosis. A fitted regression model with PC 1 as regressor and relative yield as explanatory variable showed that PC 1 explained 74% (R2adj, p < 0.001) of the yield response. Single regression models for individual traits showed that chlorosis alone explained 87% (p < 0.001) of the relative yield variation. The straw yield, plant height and overall condition score were also significant explanatory variables for the relative yield response. Correlation analysis showed that these traits were also negatively correlated with chlorosis (−0.86 at p < 0.001 for plant height, −0.77 at p = 0.005 for straw yield and −0.79 at p = 0.003 for the overall condition, Table S8).
PC 1 accounted for 46.9% of the variance in 2016 (Figure 5B). Chlorosis, head number and straw yield were the main contributors to PC1 with 23, 22 and 23%, respectively. Heading delay and plant height had little influence and contributed with only 8 and 5%. The latter two traits were statistically insignificant explanatory variables for yield obtained on waterlogged plots. The overall condition score, straw yield and plant height seemed to be the main differentiator between the genotypes. PC 1 was a non-significant explanatory variable for the relative yield. Chlorosis and the overall condition score were both significant regressors but the R2adj values were limited to 0.31 (p = 0.01) for the overall condition score and to 0.21 (p = 0.04) for chlorosis. The other traits were statistically insignificant for the relative yield response. PCA based on data obtained on the waterlogged plots alone showed that yield was strongly associated with PC 1 (R2adj = 0.59, p < 0.001) and the overall condition score (R2adj = 0.59, p < 0.001) but non-significant for chlorosis.
4. Discussion
In the present study, we have characterized the waterlogging tolerance of wheat and barley varieties based on affected phenotypic traits, found under waterlogged relative to non-waterlogged conditions. PCA was applied to reduce the number of variables into only one (PC 1), which was further used for varietal ranking in 2013 and 2014.
4.1. PCA for Tolerance Determination
Previous research has shown that a multitude of traits may be affected by waterlogging and there is little agreement as to which traits to use as selection criteria. To account for this, our phenotyping approach was to record all affected traits that could be easily quantified and that clearly differentiated the genotypes. To exclude potential noise and maintain only relevant data, PCA was our preferred statistical method. By utilizing PCA for dimensionality and noise reduction, the largest variance of the traits is captured in the principal components. PC 1 contains the largest variance and was therefore used for genotype ranking. Several wheat genotypes (CIMMYT) known to be waterlogging tolerant were included in the 2013, and particularly 2014 experiments [1,38,39]. One of them, the synthetic hexaploid wheat line CETA/Ae. tauschii (895), was one of the six genotypes that were consistently tolerant in both screening years (Table 4). This result confirms the previously stated tolerance of this line [38]. Dulus, BOTNO/Ae. tauschii (617) and DVERD_2/Ae. tauschii (221) were also included in both years. Dulus is a derived line from the waterlogging tolerant CIMMYT line Ducula (pedigree Bobwhite/Neelkant//Ducula/3/Ducula), while the other two are synthetic lines that were determined as waterlogging tolerant in experiments conducted in Mexico [38]. Several more genotypes with known tolerance properties were screened in 2014. Many of them seemed to be associated with low values of PC 1 and PC 2. Dulus, Ducula-3, and Ducula-4 were especially associated with low levels of chlorosis. However, they seemed less able to recover growth post treatment. BOTNO/Ae. tauschii (617) and especially 68.111/RGB-U//WARD/3/Ae. tauschii (454) appeared as more sensitive. The consistent performance of CETA/Ae. tauschii (895) suggests that it may be tolerant in different environments and might be a useful genetic resource in breeding.
Of the genotypes that were selected for the experiments in 2015 and 2016, yields obtained on waterlogged plots were highly correlated with yields on control plots. Hence, genotypes with high yield potential generally performed well also under waterlogged conditions. The varieties Mirakel, Bjarne and Zebra performed consistently well in the hillplot experiments. The relative yield of them were also in the upper range in 2015, when they were tested at the same location as the hillplot experiments in previous years (location N).
4.2. Stress Response as Influenced by Experimental Location
The selected genotypes were clearly more differentiated into groups of sensitive and tolerant in 2015 compared to 2016. This distinction coincides with the locations of the experiments in those years. Wheat was placed on location N in 2015 and location S in 2016. The genotypes included in the experiments in 2015 and 2016 were selected based on performance in 2013 and 2014. During those years, wheat was evaluated only at location N. When tested on location N, the selected genotypes performed similar as in 2013 and 2014, and PC 1 scores were strongly associated with yield on waterlogged relative to control plots.
Chemical and physical properties of the top soil were similar at the two locations (N and S). The redox potential measured at 4 cm depth was also similar, indicating that the conditions were equally anaerobic in this layer. However, the infiltration rate beneath the plow pan was distinctively different. The water pressure needed to maintain the water level at the soil surface was not quantified, but clearly higher at location S compared to location N. Stress was induced more quickly on location N compared to location S. The difference in imposed stress is also indicated by the yields, which were much lower in 2015 than 2016. The treatment lasted for only 13 days in 2015, while 21 days were necessary to achieve a stress level sufficient to visibly distinguish the genotypes in 2016. It is likely that the total duration of waterlogging was longer at location N due to slower dry-up. The continuous flow of oxygenated water to the basin at location S might have also supplied the plants with oxygen, sufficient to maintain growth and to suppress strongly reducing conditions. At location N, the conditions were clearly stagnant and it is more likely that severe anaerobic conditions arose.
4.3. Evaluation of Phenotypic Results
The agronomic definition of waterlogging tolerance according to Setter and Waters [28], is the ability to maintain yield under waterlogged relative to drained conditions. Another definition relates to the maintenance of high growth rates of physiological traits such as biomass. As discussed by Setter & Waters (2003), the latter definition is relevant since aboveground biomass often is correlated with yield. In the present study, we have considered the influence of waterlogging on both yield and physiological traits. Physiological traits has been emphasized in our study as hillplot experiments are not suitable for yield measurements. However, the smaller size of hillplots allow for screening of a greater number of genotypes. Yield registration in 2015 and 2016 was primarily intended to determine the relevance of phenotypic traits and of PC 1 under the concurrent growth conditions.
The percentage of chlorosis, chlorophyll content or similar traits are commonly used for tolerance determination [18,35,43]. Chlorosis is often a clearly visible stress symptom and it is simple to obtain a differentiation among genotypes if the screening population is diverse and the stress is severe. In our study, chlorosis showed fairly consistent influence on PC 1 over the years. The contribution was however low for wheat in 2014. Instead, chlorosis was strongly associated with PC 2 and PC 3 (data not presented). In 2014, it was apparent that genotypes with similar percentage of chlorosis could have contrasting abilities to recover growth post-treatment. The relationship between percentage of chlorosis and relative yield in 2015 was highly significant. Our results clearly indicate that chlorosis was the superior trait for determining the tolerance properties of the selected genotypes in this year. In contrast, the relationship between chlorosis and relative yield in 2016 was limited. Clearly, chlorosis was a poor predictor of tolerance when the stress was less severe. It was much less distinct between the selected genotypes and thus challenging to score. Even after 21 days of waterlogging in 2016, the wheat plants were in relatively good condition (location S). Setter et al. [20] also reported an inconclusive relationship between chlorosis and relative yield of both wheat and barley varieties in Western Australia. Two of the barley varieties used in their experiment, Franklin and Sterling, had equal scores of chlorosis percentage, but the relative yield of Sterling was three times larger than Franklin. Zhou [35] found that the differentiation among barley genotypes was much stronger after 9 weeks of waterlogging as opposed to only 2 weeks. The correlation of a waterlogging tolerance score (based on leaf chlorosis and survival) between years successively became stronger the longer the treatment lasted.
While the chlorosis percentage was recorded during or in conjunction with the treatment, the overall condition scores were recorded a few weeks later when the plants had been given time to recover. Chlorosis and the overall condition score were significantly correlated in 2013 (−0.42, p < 0.001, Table S6), 2015 (−0.79 at p = 0.003, Table S8) and 2016 (−0.62 at p = 0.01, Table S8), but not in 2014. Largely, the overall condition score reflected the chlorosis percentage that had been previously observed. This was apparent especially for the genotypes selected for the experiments in 2015 and 2016. In the two preceding years when the populations under investigation were much more diverse, the overall condition score was less related to the chlorosis. The green biomass score, recorded for wheat in 2014, also reflected the recovery but at an earlier stage. Genotypes with a high green biomass score were the ones that recovered the fastest. In this particular case, the green biomass score had the most influence on PC 1 and it was strongly correlated with the overall condition. The importance of considering the ability to recover was demonstrated by Setter & Waters [28]. The flooding tolerant wheat genotype Ducula-4 (CIMMYT) and moderately tolerant Chara (Australia) both had 60% relative shoot growth during a 28 day waterlogging event. The relative shoot growth after 21 days of recovery was 45% for Ducula-4 and 7% for Chara. As a comparison, in our experiments, there was a clear difference in the green biomass score between Chara and Ducula-1, a sister line of Ducula-4. Chara had an average green biomass score of 6.6% and Ducula-1 24.7%. The percentage of chlorosis was 40 and 43% for Ducula-1 and Chara, respectively. The plant height, the heading date and the number of spikes were poor predictors of yield on waterlogged plots. Single regression analysis of these traits showed non-significant relationships with yield of wheat in 2016.
Our results, along with cited references, indicate that chlorosis, as a single trait can be unreliable as a single selection criterion for waterlogging tolerance. The fact that there might be a discrepancy between leaf chlorosis and the ability to recover, clearly suggests that a measurement of recovery should always be included in waterlogging tolerance assessments. However, it is noteworthy that yield response might not be correlated to any of these traits. Although maintenance of the yield level is ultimately the most desired trait, it is influenced by many factors, has low heritability and thus may be a delusive selection criterion. Still, yield registrations are important and may reveal possible extreme observations, as observed by Van Ginkel et al. [18], who found certain wheat genotypes to be sterile despite retaining green leaf area.
Differences in the stress expression among genotypes might be a result of underlying tolerance mechanisms and survival strategies. The most favorable survival strategy likely depends upon the given soil conditions, the waterlogging event itself as well as the developmental stage of the plants. For instance, while withstanding elemental toxicity is crucial in soils high in iron and manganese, it might be a redundant trait in soils where these elements are scarce. At the experimental locations used in the present study, it was confirmed by chemical analysis of leaf tissue samples that manganese and iron were not present in toxic levels. Furthermore, long-term, short-term or even reoccurring waterlogging events might require different strategies. Since waterlogging tolerance is a trait that is strongly dependent on the environmental conditions, it is clear that screening and evaluation of tolerance properties in the target environment at relevant growth stages is of utmost importance.
Our analyses have shown that the percentage of chlorosis and the overall condition score were the traits that best determined the yield response of the genotypes we selected for the yield trials. Although these traits were well correlated in 2015 and 2016, they were less so for the larger population screened in 2013 and 2014. Waterlogging tolerance could likely have been determined fairly accurately based on chlorosis alone. However, as the ability to recover might differ, one might discard promising genotypes if such a measurement is neglected. Furthermore, precise scoring of chlorosis in small populations is challenging and severe stress is necessary to achieve differentiation. The relative plant height, the number of heads and the delay in heading did not explain much of the yield response of the selected genotypes in 2015 and 2016. Nonetheless, the traits were much affected by the treatment. Thus, it cannot be excluded that these traits might have been important for certain genotypes in the larger, very diverse populations investigated in 2013 and 2014. As PCA reduces noise and irrelevant information, we consider it as a better tool for tolerance determination of these populations.
5. Conclusions
Our results show that there is a diversity in waterlogging tolerance of the larger populations investigated in 2013 and 2014. A large number of agronomic traits were significantly affected by the treatment. For these genotypes, we consider PCA, where multiple phenotypic traits were considered, better determined tolerance properties instead of single traits. Based on PC 1 scores, six wheat genotypes and five barley genotypes appeared to be consistently more tolerant than others. This includes the CIMMYT line CETA/Ae.tauschii (895), which has been determined to be tolerant in previous waterlogging experiments conducted in Mexico. The percentage of chlorosis and the overall condition score given around maturation appeared to be the most important traits for yield response of the genotypes selected for the experiments in 2015 and 2016. The percentage of chlorosis did not necessarily reflect the genotypes’ ability to recover growth. Thus, to determine tolerance properties rightfully, records from a full crop cycle, including measurements of the ability to recover growth seem fundamental when screening populations with unknown tolerance properties. The results presented here show that phenotyping waterlogging tolerance based on agronomic traits demands consistency in methodology and testing environment. Precise scoring of chlorosis or other visual traits requires severe stress and diverse populations.
Supplementary Materials
The following are available online at https://0-www-mdpi-com.brum.beds.ac.uk/2073-4395/8/4/38/s1, Table S1: Monthly and accumulated precipitation (mm), temperature (°C) and day degrees from May through August in the experimental years, as compared to the normal period of 1961–1990, Table S2: Barley genotypes, their origin and best linear unbiased predictors (BLUPs) for the percentage of chlorosis, relative plant height, heading delay, overall condition and relative head number, Table S3: Wheat genotypes, their origin and best linear unbiased predictors (BLUPs) for the percentage of chlorosis, relative plant height, heading delay, overall condition, relative head number and green biomass recorded 5 and 19 days post treatment in 2014, Table S4: Mean percentage of clay, silt and sand, bulk density (4–9 cm depth) and porosity, pH, total carbon and nitrogen as well as contents of P, K, Ca, Mg, and Mn at the locations of the experimental site, Table S5: Redox potentials (Eh) ± the standard deviation measured at 4–5 cm depth at location N (north) and S (south) in 2014 to 2016, Table S6: Correlations of traits in barley (2013 and 2014), Table S7: Correlations of traits in wheat (2013 and 2014), Table S8: Correlations of traits in wheat (2015 and 2016).
Acknowledgments
This work was funded by The Research Council of Norway (the BIONÆR program) through the AGROPRO project (NFR project No. 225330). We thank Svend Pung and Jens Andreas Randem at the Centre for Plant Research in Controlled Environment (SKP), as well as Cecilie Yri and Eija M. Lampinen Bakken at the Department of Plant Sciences for technical support with the field experiments.
Author Contributions
Under the supervision of A.K.U., M.L. and W.W., T.S. conducted and assessed the experiments in 2014, 2015 and 2016, analyzed the data and wrote the manuscript. M.L. and A.K.U. designed and conducted the experiments, as well as collected data in 2013, while TS performed data analysis. M.L. designed the experiments in 2014. All authors have contributed to interpretation of the results and the writing of the manuscript.
Conflicts of Interest
The authors declare that they have no competing interests.
Abbreviations
| C | control |
| WL | waterlogged |
| PCA | principal component analysis |
| PC | principal component |
| N | north |
| S | south |
| CL | chlorosis |
| OC | overall condition score |
| HD | heading delay |
| PH | plant height |
| S | straw |
| HN | head number |
| GBM5 | green biomass score 5 days after drainage |
| GBM19 | green biomass score 19 days after drainage |
References
- Sayre, K.; Van Ginkel, M.; Rajaram, S.; Ortiz-Monasterio, I. Tolerance to waterlogging losses in spring bread wheat: Effect of time of onset on expression. Annu. Wheat Newsl. 1994, 40, 165–171. [Google Scholar]
- Parry, M.; Canziani, O.F.; Palutikof, J.P.; van der Linden, P.J.; Hanson, C.E. Climate Change 2007: Impacts, Adaptation and Vulnerability; Cambridge University Press: Cambridge, UK, 2007; Volume 4. [Google Scholar]
- Barua, S.K.; Berg, P.; Bruvoll, A.; Cederberg, C.; Drinkwater, K.F.; Eide, A.; Eythorsdottir, E.; Guðjónsso, S.; Gudmundsson, L.A.; Gundersen, P. Climate Change and Primary Industries: Impacts, Adaptation and Mitigation in the Nordic Countries; The Nordic Council of Ministers: Copenhagen, Denmark, 2014; p. 199. [Google Scholar]
- Bates, B.; Kundzewicz, Z.W.; Wu, S.; Palutikof, J.P. (Eds.) Climate Change and Water. Technical Paper of the Intergovernmental Panel on Climate Change; IPCC Secretariat: Geneva, Switzerland, 2008. [Google Scholar]
- Ponnamperuma, F. The Chemistry of Submerged Soils; Academic Press: New York, NY, USA, 1972; Volume 24. [Google Scholar]
- Colmer, T.D.; Greenway, H. Ion transport in seminal and adventitious roots of cereals during O2 deficiency. J. Exp. Bot. 2011, 62, 39–57. [Google Scholar] [CrossRef] [PubMed]
- Ricard, B.; Couee, I.; Raymond, P.; Saglio, P.H.; Saint-Ges, V.; Pradet, A. Plant metabolism under hypoxia and anoxia. Plant Physiol. Biochem. 1994, 32, 1–10. [Google Scholar]
- Gibbs, J.; Greenway, H. Mechanisms of anoxia tolerance in plants. I. Growth, survival and anaerobic catabolism. Funct. Plant Biol. 2003, 30, 1–47. [Google Scholar] [CrossRef]
- Drew, M.; Sisworo, E. The development of waterlogging damage in young barley plants in relation to plant nutrient status and changes in soil properties. New Phytol. 1979, 82, 301–314. [Google Scholar] [CrossRef]
- Trought, M.; Drew, M. The development of waterlogging damage in wheat seedlings (Triticum aestivum L.). I. Shoot and root growth in relation to changes in the concentrations of dissolved gases and solutes in the soil solution. Plant Soil 1980, 54, 77–94. [Google Scholar] [CrossRef]
- Letey, J.; Stolzy, L.; Valoras, N.; Szuszkiewicz, T. Influence of soil oxygen on growth and mineral concentration of barley. Agron. J. 1962, 54, 538–540. [Google Scholar] [CrossRef]
- Huang, B.; Johnson, J.W.; Nesmith, S.; Bridges, D.C. Growth, physiological and anatomical responses of two wheat genotypes to waterlogging and nutrient supply. J. Exp. Bot. 1994, 45, 193–202. [Google Scholar] [CrossRef]
- Shao, G.; Lan, J.; Yu, S.; Liu, N.; Guo, R.; She, D. Photosynthesis and growth of winter wheat in response to waterlogging at different growth stages. Photosynthetica 2013, 51, 429–437. [Google Scholar] [CrossRef]
- Khabaz-Saberi, H.; Barker, S.; Rengel, Z. Tolerance to ion toxicities enhances wheat (Triticum aestivum L.) grain yield in waterlogged acidic soils. Plant Soil 2012, 354, 371–381. [Google Scholar] [CrossRef]
- Setter, T.L.; Waters, I.; Sharma, S.K.; Singh, K.N.; Kulshreshtha, N.; Yaduvanshi, N.P.; Ram, P.C.; Singh, B.N.; Rane, J.; McDonald, G.; et al. Review of wheat improvement for waterlogging tolerance in australia and india: The importance of anaerobiosis and element toxicities associated with different soils. Ann. Bot. 2009, 103, 221–235. [Google Scholar] [CrossRef] [PubMed]
- Musgrave, M.; Ding, N. Evaluating wheat cultivars for waterlogging tolerance. Crop Sci. 1998, 38, 90–97. [Google Scholar] [CrossRef]
- McDonald, G.; Setter, T.; Waters, I.; Tugwell, R. Screening for waterlogging tolerance of wheat in the field in western australia. In Proceedings of the 13th Australian Society of Agronomy Conference, Perth, Australia, 10–14 September 2006; pp. 10–14. [Google Scholar]
- Van Ginkel, M.; Rajaram, S.; Thijssen, M. Waterlogging in Wheat: Germplasm Evaluation and Methodology Development; Tanner, T.G., Mwangi, W., Eds.; The Seventh Regional Wheat Workshop for Eastern, Central and Southern Africa: Nakuru, Kenya, 1992. [Google Scholar]
- Bertholdsson, N.-O. Screening for barley waterlogging tolerance in nordic barley cultivars (Hordeum vulgare L.) using chlorophyll fluorescence on hydroponically-grown plants. Agronomy 2013, 3, 376–390. [Google Scholar] [CrossRef]
- Setter, T.L.; Burgess, P.; Waters, I.; Kuo, J. Genetic diversity of barley and wheat for waterlogging tolerance in western australia. In Proceedings of the 9th Australian Barley Technical Symposium, Melbourne, Australian, 12–16 September 1999; Australian Barley Technical Symposium Incorporated: Melbourne, Australia, 1999. [Google Scholar]
- Watson, E.; Lapins, P.; Barron, R. Effect of waterlogging on the growth, grain and straw yield of wheat, barley and oats. Aust. J. Exp. Agric. 1976, 16, 114–122. [Google Scholar] [CrossRef]
- Collaku, A.; Harrison, S. Losses in wheat due to waterlogging. Crop Sci. 2002, 42, 444–450. [Google Scholar] [CrossRef]
- Robertson, D.; Zhang, H.; Palta, J.A.; Colmer, T.; Turner, N.C. Waterlogging affects the growth, development of tillers, and yield of wheat through a severe, but transient, N deficiency. Crop Pasture Sci. 2009, 60, 578–586. [Google Scholar] [CrossRef]
- Amri, M.; El Ouni, M.; Salem, M. Waterlogging affect the development, yield and components, chlorophyll content and chlorophyll fluorescence of six bread wheat genotypes (Triticum aestivum L.). Bulg. J. Agric. Sci 2014, 20, 647–657. [Google Scholar]
- Arduini, I.; Orlandi, C.; Pampana, S.; Masoni, A. Waterlogging at tillering affects spike and spikelet formation in wheat. Crop Pasture Sci. 2016, 67, 703–711. [Google Scholar]
- Saqib, M.; Akhtar, J.; Qureshi, R.H. Pot study on wheat growth in saline and waterlogged compacted soil: I. Grain yield and yield components. Soil Tillage Res. 2004, 77, 169–177. [Google Scholar] [CrossRef]
- Marti, J.; Savin, R.; Slafer, G. Wheat yield as affected by length of exposure to waterlogging during stem elongation. J. Agron. Crop Sci. 2015, 201, 473–486. [Google Scholar] [CrossRef]
- Setter, T.; Waters, I. Review of prospects for germplasm improvement for waterlogging tolerance in wheat, barley and oats. Plant Soil 2003, 253, 1–34. [Google Scholar] [CrossRef]
- Gardner, W.; Flood, R. Less waterlogging damage with long season wheats. Cereal Res. Commun. 1993, 21, 337–343. [Google Scholar]
- Trought, M.; Drew, M. Effects of waterlogging on young wheat plants (Triticum aestivum L.) and on soil solutes at different soil temperatures. Plant Soil 1982, 69, 311–326. [Google Scholar] [CrossRef]
- Pang, J.; Zhou, M.; Mendham, N.; Shabala, S. Growth and physiological responses of six barley genotypes to waterlogging and subsequent recovery. Crop Pasture Sci. 2004, 55, 895–906. [Google Scholar] [CrossRef]
- Drew, M.; Sisworo, E. Early effects of flooding on nitrogen deficiency and leaf chlorosis in barley. New Phytol. 1977, 79, 567–571. [Google Scholar] [CrossRef]
- De San Celedonio, R.P.; Abeledo, L.G.; Miralles, D.J. Identifying the critical period for waterlogging on yield and its components in wheat and barley. Plant Soil 2014, 378, 265–277. [Google Scholar] [CrossRef]
- Arguello, M.N.; Mason, R.E.; Roberts, T.L.; Subramanian, N.; Acuña, A.; Addison, C.K.; Lozada, D.N.; Miller, R.G.; Gbur, E. Performance of soft red winter wheat subjected to field soil waterlogging: Grain yield and yield components. Field Crops Res. 2016, 194, 57–64. [Google Scholar] [CrossRef]
- Zhou, M. Accurate phenotyping reveals better qtl for waterlogging tolerance in barley. Plant Breed. 2011, 130, 203–208. [Google Scholar] [CrossRef]
- Ballesteros, D.C.; Mason, R.E.; Addison, C.K.; Acuña, M.A.; Arguello, M.N.; Subramanian, N.; Miller, R.G.; Sater, H.; Gbur, E.E.; Miller, D. Tolerance of wheat to vegetative stage soil waterlogging is conditioned by both constitutive and adaptive QTL. Euphytica 2015, 201, 1–15. [Google Scholar] [CrossRef]
- Collaku, A.; Harrison, S. Heritability of waterlogging tolerance in wheat. Crop Sci. 2005, 45, 722–727. [Google Scholar] [CrossRef]
- Villareal, R.; Sayre, K.; Banuelos, O.; Mujeeb-Kazi, A. Registration of four synthetic hexaploid wheat (Triticum turgidum/Aegilops tauschii) germplasm lines tolerant to waterlogging. Crop Sci. 2001, 41, 274. [Google Scholar] [CrossRef]
- Boru, G.; Van Ginkel, M.; Kronstad, W.; Boersma, L. Expression and inheritance of tolerance to waterlogging stress in wheat. Euphytica 2001, 117, 91–98. [Google Scholar] [CrossRef]
- IUSS Working Group WRB. World Reference Base for Soil Resources; FAO (Food and Agriculture Organization): Rome, Italy, 2014. [Google Scholar]
- R Core Team. R: A Language and Environment for Statistical Computing; R Foundation for Statistical Computing: Vienna, Austria, 2017. [Google Scholar]
- Bates, D.; Mächler, M.; Bolker, B.; Walker, S. Fitting linear mixed-effects models using lme4. J. Stat. Softw. 2015, 67, 1–48. [Google Scholar] [CrossRef]
- Zhou, M.; Li, H.; Mendham, N. Combining ability of waterlogging tolerance in barley. Crop Sci. 2007, 47, 278–284. [Google Scholar] [CrossRef]
Figure 1.
Principal component analysis (PCA) biplot for wheat results in 2013. Circled genotypes have previously been defined as tolerant, while genotypes in boxes were selected for the experiments in 2015 and 2016. Abbreviations: CL, chlorosis; OC, overall condition score; HD, heading delay; PH, relative plant height.

Figure 2.
PCA biplot for wheat results in 2014. Circled genotypes have previously been defined as tolerant, while genotypes in boxes were selected for the experiments in 2015 and 2016. Abbreviations: CL, chlorosis; OC, overall condition score; HD, heading delay; PH, relative plant height; HN, relative head number; GBM5, green biomass score 5 days after drainage; GBM19, green biomass score 19 days after drainage.

Figure 3.
PCA biplot for barley results in 2013. Abbreviations: CL, chlorosis; OC, overall condition score; HD, heading delay; PH, relative plant height.
Figure 3.
PCA biplot for barley results in 2013. Abbreviations: CL, chlorosis; OC, overall condition score; HD, heading delay; PH, relative plant height.

Figure 4.
PCA biplot for barley results in 2014. Abbreviations: CL, chlorosis; OC, overall condition score; HD, heading delay; PH, relative plant height; HN, relative head number.
Figure 4.
PCA biplot for barley results in 2014. Abbreviations: CL, chlorosis; OC, overall condition score; HD, heading delay; PH, relative plant height; HN, relative head number.

Figure 5.
PCA biplot of PC 1 and 2 for selected wheat genotypes expected to be sensitive (S) and tolerant (T) in 2015 (A) and 2016 (B). Abbreviations: CL, chlorosis; OC, overall condition score; HD, heading delay; PH, relative plant height; S, relative straw yield; HN, relative head number.
Figure 5.
PCA biplot of PC 1 and 2 for selected wheat genotypes expected to be sensitive (S) and tolerant (T) in 2015 (A) and 2016 (B). Abbreviations: CL, chlorosis; OC, overall condition score; HD, heading delay; PH, relative plant height; S, relative straw yield; HN, relative head number.


Table 1.
Sowing date, treatment duration and location of the site as well as daily average temperature (°C) during the treatment in the experimental years. Abbreviations: N: northern location; S: southern location.
Table 1.
Sowing date, treatment duration and location of the site as well as daily average temperature (°C) during the treatment in the experimental years. Abbreviations: N: northern location; S: southern location.
| Year | Sowing Date | Treatment Duration (Days) and Location | Daily Average Air Temperature (°C) | |
|---|---|---|---|---|
| Barley | Wheat | |||
| 2013 | 06.06.2013 | 10 N | 10 N | 14 |
| 2014 | 02.05.2014 | 13 S | 7 N | 16 |
| 2015 | 29.04.2015 | - | 13 N | 13 |
| 2016 | 27.04.2016 | - | 21 S | 15 |
Table 2.
Wheat genotypes selected for the experiments conducted in 2015 and 2016.
| Wheat Genotype | Origin | Expected Tolerance Property | Testing Year |
|---|---|---|---|
| Bjarne | Norway | Tolerant | 2015–2016 |
| Chara | Australia | Sensitive | 2015 |
| Dulus | CIMMYT | Tolerant | 2015–2016 |
| Breeding line 1303 | Norway | Sensitive | 2016 |
| Breeding line 1327 | Sweden | Sensitive | 2016 |
| Breeding line 1406 | Norway | Tolerant | 2016 |
| Breeding line 1416 | Norway | Sensitive | 2016 |
| Kariega | South Africa | Sensitive | 2015–2016 |
| Kukri | Australia | Tolerant | 2015–2016 |
| Mirakel | Norway | Tolerant | 2015–2016 |
| NK00521 | Norway | Sensitive | 2015–2016 |
| NK93602 | Norway | Tolerant | 2015–2016 |
| NK93604 | Norway | Tolerant | 2016 |
| Quarna | Switzerland | Sensitive | 2015–2016 |
| Saar | CIMMYT | Sensitive | 2015 |
| T9040 | Norway | Sensitive | 2015–2016 |
| Zebra | Sweden | Tolerant | 2015–2016 |
Table 3.
Relative contribution of variables to principal component (PC) 1 in wheat and barley.
| Wheat | Barley | |||||
|---|---|---|---|---|---|---|
| Year | 2013 | 2014 | 2015 | 2016 | 2013 | 2014 |
| Chlorosis | 25.0 | 1.1 | 18.2 | 22.9 | 29.9 | 23.8 |
| Plant height | 17.8 | 7.7 | 17.1 | 5.5 | 12.8 | 28.7 |
| Heading delay | 27.4 | 16.5 | 14.8 | 7.5 | 31.4 | 30.8 |
| Overall condition | 29.8 | 17.7 | 17.0 | 19.0 | 25.8 | 2.5 |
| Head number | - | 19.9 | 15.5 | 23.0 | - | 14.2 |
| Green biomass 5 days post drainage | - | 16.7 | - | - | - | - |
| Green biomass 19 days post drainage | - | 20.4 | - | - | - | - |
| Straw yield | - | - | 17.5 | 22.0 | - | - |
Table 4.
Wheat genotypes with consistently poor or good tolerance properties in 2013 and 2014 according to their PC 1 scores.
Table 4.
Wheat genotypes with consistently poor or good tolerance properties in 2013 and 2014 according to their PC 1 scores.
| Wheat Line | Origin | Barley Line | Origin |
|---|---|---|---|
| Consistently more tolerant | |||
| Altar84/Ae. tauschii (219)//2 × Seri | CIMMYT | Breeding line 1176 | Denmark |
| CETA/Ae. tauschii (895) | CIMMYT | Shirley | Germany |
| Bjarne | Norway | Frisco | Denmark |
| Kukri | Australia | Balder | Sweden |
| Mirakel | Norway | Breeding line 1178 | Germany |
| Zebra | Sweden | - | - |
| Consistently more sensitive | |||
| Breeding line 1405 | Norway | Breeding line 1095 | Norway |
| Breeding line 1327 | Sweden | Fredrickson | Japan |
| T9040 (1995) | Norway | CIho4196 | China |
| BCN*2//CROC_1/Ae. tauschii (886) | CIMMYT | Tore | Norway |
| Breeding line 1303 | Norway | Ven | Norway |
| Sabin | USA | Varde | Norway |
| 512-70 | Norway | Herse | Norway |
| Nobeokabouzu | Japan | Svanhals | Sweden |
| Kariega | South Africa | - | - |
| Quarna | Switzerland | - | - |
| Saar | CIMMYT | - | - |
| DH 49-18 | Norway | - | - |
Table 5.
Absolute (kg ha−1) and relative yields obtained by wheat genotypes on waterlogged and control plots in 2015 and 2016. Uppercase letters denote significant differences among genotypes determined by ANOVA and Tukey’s honest significance difference test. Controls and waterlogged results were analyzed separately.
| 2015 | 2016 | |||||
|---|---|---|---|---|---|---|
| Variety | Control | Waterlogged | Relative Yield (%) | Control | Waterlogged | Relative Yield (%) |
| Bjarne | 3601 bc | 1299 ab | 37 | 6482 abc | 2076 bcdef | 32 |
| Dulus | 2519 efg | 760 def | 30 | 4274 ef | 1614 ef | 38 |
| Breeding line 1406 | - | - | - | 6892 a | 2983 a | 41 |
| Kukri | 3433 bcd | 908 cde | 26 | 6273 abc | 2588 ab | 41 |
| Mirakel | 3693 bc | 1230 abc | 34 | 7156 a | 2167 bcde | 30 |
| NK93602 | 3668 bc | 1192 bc | 33 | 6010 abcd | 2380 abcd | 40 |
| NK93604 | - | 5379 bcde | 1983 cdef | 37 | ||
| Zebra | 2933 def | 1012 bcd | 33 | 6386 abc | 2193 bcdef | 34 |
| Chara | 2179 g | 501 f | 25 | - | - | - |
| Breeding line 1303 | - | - | - | 5133 cde | 162 def | 32 |
| Breeding line 1416 | - | - | - | 6460 abc | 2364 abcd | 37 |
| Kariega | 2419 fg | 625 ef | 28 | 3594 f | 1429 f | 40 |
| NK00521 | 3379 bcd | 977 bcde | 29 | 5787 abcd | 1641 ef | 28 |
| Saar | - | - | - | 4712 def | 1586 ef | 34 |
| Breeding line 1327 | - | - | - | 6697 ab | 1857 cdef | 24 |
| T9040 | 3587 bc | 917 cde | 26 | 7124 a | 2510 abc | 35 |
| Quarna | 3108 cde | 801 def | 26 | 5864 ef | 1607 ef | 27 |
| p-value | <0.001 | <0.001 | <0.001 | <0.001 | ||
© 2018 by the authors. Licensee MDPI, Basel, Switzerland. This article is an open access article distributed under the terms and conditions of the Creative Commons Attribution (CC BY) license (http://creativecommons.org/licenses/by/4.0/).
Share and Cite
MDPI and ACS Style
Sundgren, T.K.; Uhlen, A.K.; Waalen, W.; Lillemo, M. Field Screening of Waterlogging Tolerance in Spring Wheat and Spring Barley. Agronomy 2018, 8, 38. https://0-doi-org.brum.beds.ac.uk/10.3390/agronomy8040038
AMA Style
Sundgren TK, Uhlen AK, Waalen W, Lillemo M. Field Screening of Waterlogging Tolerance in Spring Wheat and Spring Barley. Agronomy. 2018; 8(4):38. https://0-doi-org.brum.beds.ac.uk/10.3390/agronomy8040038
Chicago/Turabian StyleSundgren, Tove Kristina, Anne Kjersti Uhlen, Wendy Waalen, and Morten Lillemo. 2018. "Field Screening of Waterlogging Tolerance in Spring Wheat and Spring Barley" Agronomy 8, no. 4: 38. https://0-doi-org.brum.beds.ac.uk/10.3390/agronomy8040038
Note that from the first issue of 2016, this journal uses article numbers instead of page numbers. See further details here.