Article

Maize (Zea mays L.) Response to Secondary and Micronutrients for Profitable N, P and K Fertilizer Use in Poorly Responsive Soils

1
Division of Soil and Water Management, KU Leuven, Kasteelpark, Arenberg 20 box 2459, 3001 Leuven, Belgium
2
Department of Soil Science, University of Eldoret, box 30100-1125 Eldoret, Kenya
*
Author to whom correspondence should be addressed.
Submission received: 23 January 2018 / Revised: 2 April 2018 / Accepted: 9 April 2018 / Published: 15 April 2018
(This article belongs to the Special Issue Fertilizer Application on Crop Yield)

Abstract

:
Deficiencies of secondary and micronutrients (SMNs) are major causes of low maize yields in poorly responsive soils. This phenomenon minimizes the agronomic efficiency of N, P and K fertilizers and consequently result in a dwindling economic benefit associated with their use. Therefore, 18 on-farm trials were conducted in western Kenya during two cropping seasons to assess maize response to three NPK amendments; (i) N, P, K, Ca, Zn and Cu (inorganic and organic); (ii) N, P, K, Ca, Zn and Cu (inorganic) and (iii) N, P K, Zn and Cu (inorganic) and evaluate the profitability of their use compared to additions of only N, P and K fertilizers. In this set of experiments, maize response to any amendment refers to a yield increase of ≥2 t ha−1 above control and could be categorized in three clusters. Cluster 1, comprising of nine sites, maize responded to all amendments. Cluster 2, holding six sites, maize responded only to one amendment, N, P, K, Ca, Zn and Cu (inorganic). In this cluster, (2), emerging S, Mg and Cu deficiencies may still limit maize production. Cluster 3; consisting of three sites, maize responded poorly to all amendments due to relatively high soil fertility (≥17 mg P kg−1). Profitability of using NPK amendments is limited to Cluster 1 and 2 and the largest Value Cost Ratio (VCR) of 3.1 is attainable only when soil available P is below 4.72 mg kg−1. These variable responses indicate the need for developing site-specific fertilizer recommendations for improved maize production and profitability of fertilizer use in poorly responsive soils.

1. Introduction

Mineral fertilizers contribute to 40–60% of the world’s food production. However, their unbalanced use is obvious at the global scale [1]. Optimal and sometimes excessive mineral fertilizer use has resulted in food sufficiency in some parts of the developed world including North America, Western Europe, and China [2,3]. In contrast, quantities of fertilizer applied by farmers in Sub-Saharan Africa (SSA) are still below the 50 kg ha−1 target set by the African Heads of State at the 2006-Africa fertilizer summit [4]. Consequently, food insecurity remains the main developmental challenge in SSA [5,6,7]. Inadequate and unequal allocation of fertilizer within farm fields has been cited as one of the attributes to this unsustainable food production in the region [8]. High fertilizer costs, inaccessibility and/or limited availability and relatively low cereal grain prices are some of the major impediments to increased fertilizer use in the region [9]. Furthermore, food production in the SSA is dominated by the 70–80% resource-poor smallholder farmers [10]. Because of the above-mentioned challenges, crop production in the region is done mainly with limited inputs resulting in inevitable nutrient mining [11,12]. Nevertheless, some governments in West, East and South Africa have facilitated an increase in fertilizer use through subsidy programs [13,14]. However, fertilizer use in such cases is often based on blanket recommendations (“standard”) that ignore the importance of site and crop-specific requirements for its efficient use [15,16,17]. Moreover, research in SSA has overemphasized the most limiting nutrients N, P and sometimes K with little attention for the other essential nutrients. Consequently, the commonly available and most frequently applied fertilizers in the region are obviously N, P and K based. Therefore, there is need to stimulate awareness among farmers to supply all essential nutrients for sustainable crop production.
This unbalanced soil fertilization results in poor responses to fertilizers in some soils and consequently small crop yields [18,19,20]. These so-called ‘poor/ non-responsive’ soils are defined as those with small to no yield increases after fertilizer use and hence negligible economic returns [21]. The value cost ratio (VCR) of 2 is the acceptable profitability level of fertilizer use by farmers in SSA [22]. In poorly responsive soils that profitability criterion is hardly achieved and, therefore, this phenomena threatens fertilizer use in the region. Consensus grows that in SSA, on top of the well-known deficiencies in N, P and K, the occurrence of secondary macro- and micronutrients deficiencies constitute a major constraint for crop production in poorly responsive soils [16,19,23]. Jones et al. [24] also highlight that depletion of soil micronutrients is increasing in most developing countries especially through the high crop yield targets.
Hence our main research question at the outset is whether the addition of secondary (Ca) and micronutrients (Zn, Cu) (SMNs) increases the yields of maize and eliminates a possible lack of response to the standard N, P and K fertilizer application. Underlying issues relate to whether the responses can be understood based on leaf and/or soil analyses and whether the intervention of adding SMN’s lifts the N, P and K addition to (large) profitability.

2. Materials and Methods

2.1. Characteristics of the Study Area

The study was conducted in two regions of western Kenya: Bungoma-Southwest (latitudes and longitudes ranges from 0.49° to 0.55° North and 34.43° to 34.51° East, respectively) and Busia-North (latitudes and longitudes ranges from 0.65° to 0.70° North and 34.32° to 34.39° East, respectively), during two cropping seasons, i.e., the long (LR) and short (SR) rains of 2015 (Figure 1). The study areas are situated on “lower-middle-level uplands” which are gently undulating to undulated; slopes are 2–8% and altitudes range between 1200 to 1900 masl [25]. The common soil types in those regions are Acrisols, Ferralsols and Cambisols characterized by low soil fertility [26]. Temperature variations in the region are insignificant, monthly means range between 21 °C and 22 °C. The area has an average annual rainfall of 1400 mm with a probability of 66% [25]. The annual rainfall has a bimodal distribution pattern comprised of an initial long to medium season between March and July (LR) followed by a moderately weak season between September and December (SR). Maize growing period ranges between 100 and 150 days and hence, the two rainfall seasons are adequate for its production. In fact, the western region is considered as a medium production area for maize with potential yields of 5.0 t ha−1 [25]. However, yield gaps between farmer-led and research-led production remain wide in the region. While the actual production at farm level is as low as 1.1 t ha−1, some scientists have recorded yields as high as 4 t ha−1 [20].

2.2. Description of Experimental Sites

The trials comprised 18 sites, (nine sites in each region) as shown in Table 1. Selection of those sites was based on a previous multi-locational diagnostic study that sought to identify the extent of poorly responsive soils and their characteristics from the study area [27]. For that study, a poorly responsive soil was defined by economic values below the value cost ratio (VCR) of 2 after N, P and K fertilizer use for maize production. Further, using the compositional nutrient diagnosis (CND) tool for the same study, Ca, Zn and Cu were found to also limit maize production in such soils.
Soil types for the selected sites in Bungoma-Southwest mainly consisted of Acrisols and Cambisols (Table1) with subtypes ranging from deep, moderately deep to shallow overlying petroplinthite [26,28]. Arenosols were widespread in Busia-North (Table1) with two main subtypes; gleyic and luvic. Other soil types found in the two study areas include Alisols, Luvisols, Lixisols and Planosols. Around 80% of the total sites had a gentle slope (<5%) while the rest were slightly undulating. In addition, it was observed that three of the sites had soil depth ≤50 cm, two of which had a plinthic subsurface (Table 1). Majority of the soils are coarse-textured, with an average sand content above 50%. In general, the three primary nutrients N, P and K are low in most of the soils except in some cases where P is relatively large.

2.3. Crop Variety and Treatment Structure

Two medium maturing, Hybrid maize seed varieties, H516 and H513 from Kenya Seed Company were planted during the subsequent seasons; LR and SR, respectively. Each of the nine sites from the two regions had five fertilizer treatments laid out in a Randomized Complete Block Design (RCBD) and replicated three times. Besides the application of N, P and K nutrients at 100, 30 and 60 kg ha−1, respectively [27], we added three other nutrients (Ca, Zn and Cu) due to prevalent deficiencies observed in the poorly responsive soils within the study area. Therefore, the treatment structure consisted of an absolute control (without fertilizer), the standard N, P, and K fertilizer (NPK1) and three NPK amendments (i) N, P, K, Ca, Zn and Cu (inorganic and organic); NPK2 (ii) N, P, K, Ca, Zn and Cu (inorganic); NPK3 and (iii) N, P, K, Zn and Cu (inorganic), NPK4 (Table 2). We consider the latter three treatments as ‘pilot nutrient packages’ for rehabilitating the poorly responsive soils in western Kenya. The N, P and K nutrients sources for treatment NPK1 and NPK4 were from Urea, Triple Superphosphate (TSP) and Muriate of Potash (MOP). Mavuno, a blended fertilizer (10% N, 26% P2O5, 10% K2O, 4% S, 8% CaO, 4% MgO and traces of B, Zn, Mo, Cu, Mn) supplied N. P, K and Ca for NPK3. Application of Zn and Cu at 3 kg ha−1, respectively through amendments, NPK3 and NPK4 followed recent recommendations by National Accelerated Agricultural Input Access Programme (NAAIAP) and Kenya Agricultural Research Institute (KARI) [29]. The NPK2 treatment mainly consisted of farmyard manure (FYM) (0.27% N, 0.4% P, 2.1% K, 0.28% Ca, 0.2% Mg, 51.66 mg kg−1 Zn, 30.66 mg kg−1 Cu and 0.03 mg kg−1 Mn) with only N and P supplements (Table 2). In other words, six tons of FYM were applied together with 84 kg N ha−1 and 6 kg P ha−1 from urea and TSP, respectively to match the total amounts of N and P added given their small contents in the FYM. The large K-content of 2.1% analyzed in FYM was considered sufficient to supply 60 kg ha−1 and hence did not need to be supplemented like was the case for N and P. A correction to supplement the negligible Zn (51.66 mg kg−1) and Cu (30.66 mg kg−1) concentrations in FYM were intentionally ignored. This aimed at evaluating the potential of FYM to supply adequate amounts of micronutrients for maize.

2.4. Trial Establishment and Maintenance

The 15 plots in each site measured 4.5 m × 5 m individually with six planting rows spaced at 75 cm apart and intra-row spacing of 25 cm. During the planting period for both seasons, the various fertilizer treatments were assigned to their respective plots. For each treatment, the entire fertilizer components except N were in bands next to planting rows and thoroughly mixed with soil. The latter eliminates a possible risk of poor seed germination due to high salinity or excess acidity near the fertilizer granules when dissolving. The 100 kg N ha−1 derived from urea was applied in two splits. Half of it was banded together with the other fertilizers at planting. The other half was applied in small furrow (5 cm deep) next to the planting rows and was thoroughly mixed with soil six weeks after seedling emergence. Two maize seeds were planted per hill and two weeks after emergence, seedlings were thinned to one. Three weeding using a hand hoe ensured weed-free plots throughout the crop growing seasons. The first weeding was done three weeks after maize seeds were planted while the second and third weedings were done after every four consecutive weeks.

2.5. Soil and Leaf Tissue Analysis and Grain Yield

A composite soil sample for each site was analyzed for selected physiochemical parameters. Soil pH, Available P, organic carbon and textural analysis [30] was conducted at the Soil Science laboratory, University of Eldoret, Kenya while total N [31] and cation exchange capacity [32] were analyzed at the Soil and Water laboratory in KU Leuven, Belgium. Maize ear leaf tissues were sampled at silking stage [33] for nutrient content analysis (N, P, K, S, Ca, Mg, B, Cu, Zn and Mn) at KU Leuven, Belgium. All the leaf nutrient analysis except N followed an acid dissolution procedure [34] and measurements were taken by ICP-MS (Agilent7700X). N analysis was conducted by dry combustion [35] using a Flash Elemental Analyzer 1112HT (Thermo Fisher Scientific Bremen, Germany).
At the onset of physiological maturity, grain harvesting was confined within a net plot of 3 × 3 m2, comprising of four inner rows while leaving 1 m from the row edge. The total fresh weight of maize ears was recorded after which eight ears were randomly sampled for grain dry weight analysis.

2.6. Field Observations

Farmers were trained and facilitated on how to collect daily rainfall data from their respective sites. From this data, on-farm mean monthly rainfall distribution within the two cropping seasons was recorded and is presented in Figure 2. The rainfall data are cross-checked with long-term data from the closest meteorological stations within each region to determine deviations from the norm. The long-term rainfall data set (1984–2008) for Bungoma-Southwest were sourced from Mungatsi and Sangalo. A 20-year (1990–2010) rainfall data set was acquired from Kwamangor, Amagoro Division Commissioner’s (D.C) offices, Angurai and Kolanya meteorological stations for Busia-North. Although we acknowledge the spatial variations in rainfall amount and distribution over time, an overall trend of higher rainfall during the long rains in comparison to the short rains can be inferred from both data sets. A noticeable difference in the rainfall pattern in the farmers’ data, however, cannot be ignored. During the long rains, a decrease in rainfall is observed in Busia-North in the months of April and May while it increased during mid-season (November) and at the end of the short rains (December) compared to long-term averages. Rainfall in Bungoma-Southwest increased in June, November and December above the long-term averages.

2.7. Economic Analysis

This section seeks to find the most profitable fertilizer treatment to rehabilitate the poorly responsive soils. According to Townsend [36], the profitability of fertilizer use is one of the key factors that determine their adoption and hence the quantity of fertilizer used in SSA. In this context, the value cost ratio (VCR) of fertilizer is used to determine the economic benefit of each treatment for maize grain production. The VCR denotes the value of extra yield produced per unit of money invested in fertilizer as shown in Equation (1).
VCR = (additional maize yield due to fertilizer use (kg ha−1) × price of grain ($
kg−1)) / (amount of fertilizer applied × cost of fertilizer ($ kg−1))…………………
where VCR is the value cost ratio of fertilizer use and $ is US dollar.
A VCR value >1 means a net profit whereas < 1 denote a net loss as long as other production inputs such as labor, the cost of seeds are not altered as a result of fertilizer application. Obviously, the larger the VCR value the more worthwhile it is to invest in that particular fertilizer. A VCR value of 2 is considered as the critical threshold to adopt fertilizer use [22]. It implies that for every US dollar ($1) spent on fertilizer, a return of additional crop yield worth US$2 is obtained.
To compute VCR values for the two seasons, both the fertilizer cost and grain prices at the local market were taken into account as shown in Table 3. In addition, an average of 100 Kenya Shilling (KES) to 1 USD $ exchange was factored in for the two seasons to account for inflation effects. Maize grain sold at USD $0.4 during the LR increased by 10% in the SR.
Further, profitability of fertilizer use for maize was stratified using the decision tree partitioning model [37,38]. The aim of this analysis was to classify the economic benefits of fertilizer use in relation to soil conditions. A proper identification of those soil characteristics that predict profitability of fertilizer use is important to farmers in making sound decisions of fertilizer use. In the model, average VCR value of each treatment in a particular site was considered as the response variable while clusters, fertilizer treatments and selected soil parameters were the predictors explaining the profitability of fertilizer use. The model splits the data into two nodes recursively until a maximum number of nodes is obtained as defined by the maximum R square value. Each split maximizes the differences in responses between the 2 homogeneous nodes.

2.8. Statistical Analysis

All statistical analyses were conducted using JMP Pro statistical software version 12, SAS Institute Inc. SAS [39]. A mixed linear model was adapted to evaluate overall effects of various factors on maize grain yields. In the model, fertilizer treatments, seasons, study area and their interactions were considered as fixed factors while treatment replicates and sites nested within study area taken as random factors. Those factors were compared using the least square means and standard errors of difference (SED). Significant differences between, among the factors and their interactions were evaluated at p ≤ 0.05, p ≤ 0.01 and p ≤ 0.001.
We further conducted multivariate K-means cluster analysis to reveal meaningful patterns of maize agronomic response to the different fertilizer treatments [23]. The analysis aimed at grouping the experimental sites into sets (cluster) of defined responses to particular fertilizer treatment(s). Maize yield differences of each fertilizer treatment from the control were used for the analysis. Three out of five clusters deemed appropriate for the analysis since they explained the largest variations of the yield differences. We distinguish an agronomic response from a poor response if the yield difference from any of the amendments is 2 t ha−1 above control. This discriminating response value 2 t ha−1 is based on the fact that most of the smallholder farmers in western Kenya obtain an average yield of 1t ha−1 without fertilizer application (control) [20]. Therefore, obtaining 2 t ha−1 of maize yields above control corresponds to the green revolution yield target of 3 t ha−1 after fertilizer use for tropical Africa as suggested by Sanchez [40].
To identify the ear leaf nutrient(s) influencing allocation of a given site to a specific cluster, we regressed the response clusters against corresponding nutrient contents using a multinomial logit model. The cluster whose sites responded well to all the three NPK amendments (maize yield of 2 t ha−1 above control) was taken as the reference (base) cluster for the analysis.
In addition, significant soil parameters among the response clusters were identified using one-way analysis of variance where the cluster is the only fixed factor while replication for each fertilizer treatment is taken as the random factor. Further, a correlation analysis between the significant soil parameters among the response clusters and the influential ear leaf nutrients for site allocation to a given cluster shows the magnitude and direction of the soil-maize nutrient relationship.

3. Results

3.1. Effect of Fertilizer Treatments on Maize Yield

Effect of fertilizer treatments on maize yield is shown in Table 4. As expected, the control treatment (without fertilizer) had the smallest grain yield on average of 1.65 t ha−1 which was significantly different from the 2.79 t ha−1 obtained from the standard N, P and K treatment (NPK1). Application of NPK amendments (NPK2, NPK3 and NPK4) more than doubled the control yields, with average yields ranging between 3.38 and 3.56 t ha−1. Nevertheless, yields from those amendments were not significantly different (p ≤ 0.05).
Beyond the averages, a clear cropping season effect on maize grain yield was also obvious for both regions (Table 4). The long rains (LR) resulted in significantly (p ≤ 0.05) larger yields compared to the short rains (SR), irrespective the treatments. Interestingly, both regions had similar average grain yields of 3.6 t ha−1 during the LR. However, during the SR, Busia-North had the smaller yields, on average 0.9 t ha−1 below the 2.8 t ha−1 obtained in Bungoma-Southwest.
Further, Figure 3 shows the variability of maize yields obtained from each treatment for the two regions. A large variability is observed between the minim and maximum yield values for the control, NPK2 and NPK3 treatments compared to their counterparts in NPK1 and NKP4. Moreover, this variability is conspicuous in Bungoma-Southwest compared to Busia-North for the control plots. For the NPK2 and NPK3, the variability is larger in Busia-North compared to Bungoma-Southwest. In addition, Bungoma-Southwest had significantly (p ≤ 0.05) larger mean yields than Busia-North in all treatments except for NPK4. Maize control yields obtained in Bungoma-Southwest were 0.2 t ha−1 larger than the 1.55 t ha−1 obtained in Busia-North. Likewise, the standard N, P and K fertilizer (NPK1) application resulted in a yield of 3.1 t ha−1 in Bungoma-Southwest, 0.6 t ha−1 larger than the 2.5 t ha−1 obtained in Busia-North. In contrast, application of the inorganic/organic-based amendment (NPK2) in Bungoma-Southwest resulted in a yield only 5% above the 3.36 t ha−1 obtained in Busia-North with the same treatment. The amendment, NPK3 (standard N, P and K plus Ca, Cu and Zn) resulted in the largest yield difference between the two regions. Actually, the amendment yielded 4 t ha−1 of maize grain in Bungoma-Southwest compared to the 3 t ha−1 obtained in Busia-North. Applying the standard N, P and K fertilizer plus micronutrients Zn and Cu (NPK4) had insignificant (p ≤ 0.05) yields between the regions.

3.2. Maize Agronomic Response Clusters

Three clusters reveal a detailed variability in maize response to fertilizer treatments across all the experimental sites as shown in Figure 4. Cluster 1 represents sites in which maize responds well to all NPK amendments (NPK2, NPK3 and NPK4) compared to standard N, P and K fertilizer (NPK1). This cluster contains 50% of all sites. In this cluster, application of any of the NPK amendments increases maize yields by 40% above the 1.6 t ha−1 increase obtained after use of the standard N, P and K fertilizer (NPK1). Therefore, for the same cluster, additional nutrients (SMNs) beside N, P and K may be either sourced from organic (FYM) or inorganic without a significant (p ≤ 0.05) yield reduction. Cluster 2 holds sites with major limitations of micronutrients. Thirty-three percent of all sites are in this cluster and show a significant (p ≤ 0.05) maize response to NPK3 compared to the other amendments and NPK1. Maize yields in those sites increase significantly (p ≤ 0.05) only when Ca is added together with relatively large doses of Cu and Zn (3 kg ha −1) above the standard N, P and K fertilizer. Maize responds poorly to fertilizer treatments in sites belonging to Cluster 3. The 17% of all sites belonging to this cluster are relatively fertile based on the large yields observed from control plots of 3 t ha−1 on average. For the same cluster, application of standard N, P and K fertilizer results in a yield decline of 0.7 t ha−1 below control while the use of the amendments barely improved maize yields by 0.3 t ha −1 above control.

3.2.1. Relationship between Nutrient Content in Maize Ear Leaf and Type of Maize Response to NPK Amendments

Using Cluster 1 as the reference category in multinomial logit shows that reducing P, K and Zn content and increasing S, Mg and Cu would transfer a site from, Cluster 2 into Cluster 1 (Table 5). Ear leaves from sites in Cluster 2 were slightly larger in leaf P content and smaller in S and Mg content compared to their counterparts in Cluster 1.
Decreasing N and Ca and increasing S, Mg, B and Cu contents would ultimately transfer an individual site from the poorly responsive, Cluster 3 to Cluster 1 (Table 5). Similar to the plants in Cluster 2, contents of S, Mg, B and Cu were relatively smaller in maize ear leaves of Cluster 3 than in those of Cluster 1.

3.2.2. Soil Characteristics Corresponding to Maize Response Clusters

Table 6 shows the variation in soil characteristics among various maize response clusters. None of the soil parameters except P were significantly different (p ≤ 0.05) among clusters. Available P was smallest with 6.45 mg P kg −1 on average for soils in Cluster 1 while it was largest in Cluster 3 with an average content of 17.2 mg.kg−1 and ranging between 5 and 27 mg kg−1.

3.2.3. Relationship between Significant Soil Parameters and Influential Ear Leaf Nutrients for Maize Response Clusters

The relationship between soil available P and ear leaf nutrients that influenced site allocation to clusters, 2 and 3 is shown in Table 7. The larger soil available P for sites in Cluster 2, the larger the P, K and S contents in maize ear leaves. However, soil available P did not have a significant (p ≤ 0.05) effect on both Mg and Cu ear leaf content in this same cluster. For the poorly responsive, Cluster 3, large soil available P significantly (p ≤ 0.05) enhanced uptake of N, Ca and Cu. Similar effect of soil available P to Mg ear leaf content for sites in Cluster 2 is also observed for sites in Cluster 3. Although not significant, soil available P for Cluster 3 had a negative effect on S and B ear leaf content.

3.3. Economic Benefit from NPK Amendments for Maize Grain Production

In general, initial investments for the three NPK amendments; NPK2, NPK3 and NPK4 are costly compared to the standard N, P and K fertilizer, NPK1 (Table 3). However, the net profit of using those amendments after grain sales is worth the investment. On average, investing a kilogram of the NPK1 at $1.6 (Table 3) during planting results in 50% net profit. The largest net profit of 160% is obtained after investing $2.1 (Table 3) for a kilogram of NPK3. A similar net profit at 130% is obtained after investing $2.5 and $2.0 for NPK2 and NPK4 (Table 3), respectively.
Figure 5 illustrates profitability of using NPK amendments for maize production in poorly responsive soils of western Kenya. The mean values of VCR partition different levels of profitability. Returns on investment directly relate to the agronomic response clusters. This notwithstanding, it is the soil available P which ultimately determines the extent of the profitability. The first split with mean VCR value of 2.2 shows that use of amendments (NPK2, NPK3, and NPK4) is profitable compared to the standard N, P and K fertilizer, NPK1, irrespective of the response clusters. The mean VCR value of 2.4 obtained after using those amendments is 20% above the acceptable profitability threshold value of 2. In contrast, the profitability of using the standard N, P and K fertilizer for maize production is on average 25% less than the acceptable threshold. On average, lowest benefits of using the standard N, P and K fertilizer, NPK1 (VCR = 1.3) are observed in 13 of the total sites. Such sites had more than 5.04 mg P kg−1 of soil. Nevertheless, five of the total sites with less than 5.04 mg P kg−1 soil attained the profitability threshold, VCR value of 2.0 after application of the standard N, P and K fertilizer.
The average VCR value of 0.4 for all amendments is 80% below the acceptable threshold value of 2 for sites belonging to the poorly responsive, Cluster 3 irrespective of the amount of available P in the soil. Farmers with sites belonging to both clusters 1 and 2 satisfactorily benefit from using NPK amendments. However, on average, sites in Cluster 1 result in 25% larger VCR values above the 2.4 obtained in Cluster 2 when soils have more than 4.72 mg P kg−1. Use of NPK amendments, for both Clusters 1 and 2, is 15% more beneficial in sites where soils had less than 4.72 mg P kg−1. The mean VCR value of 3.3 indicates the largest economic benefits of using the NPK amendments. Sites with the lowest available P in the soil (2.93 mg P kg−1) are observed with such economic benefits.

4. Discussion

4.1. Effect of Fertilizer Treatments on Maize Yield

The overall maize yield increase after additions of selected secondary macro- and micronutrients (SMNs) above the standard N, P and K fertilizer confirms that the closure of maize yield gaps in poorly responsive soils requires more than the 3 primary nutrients [
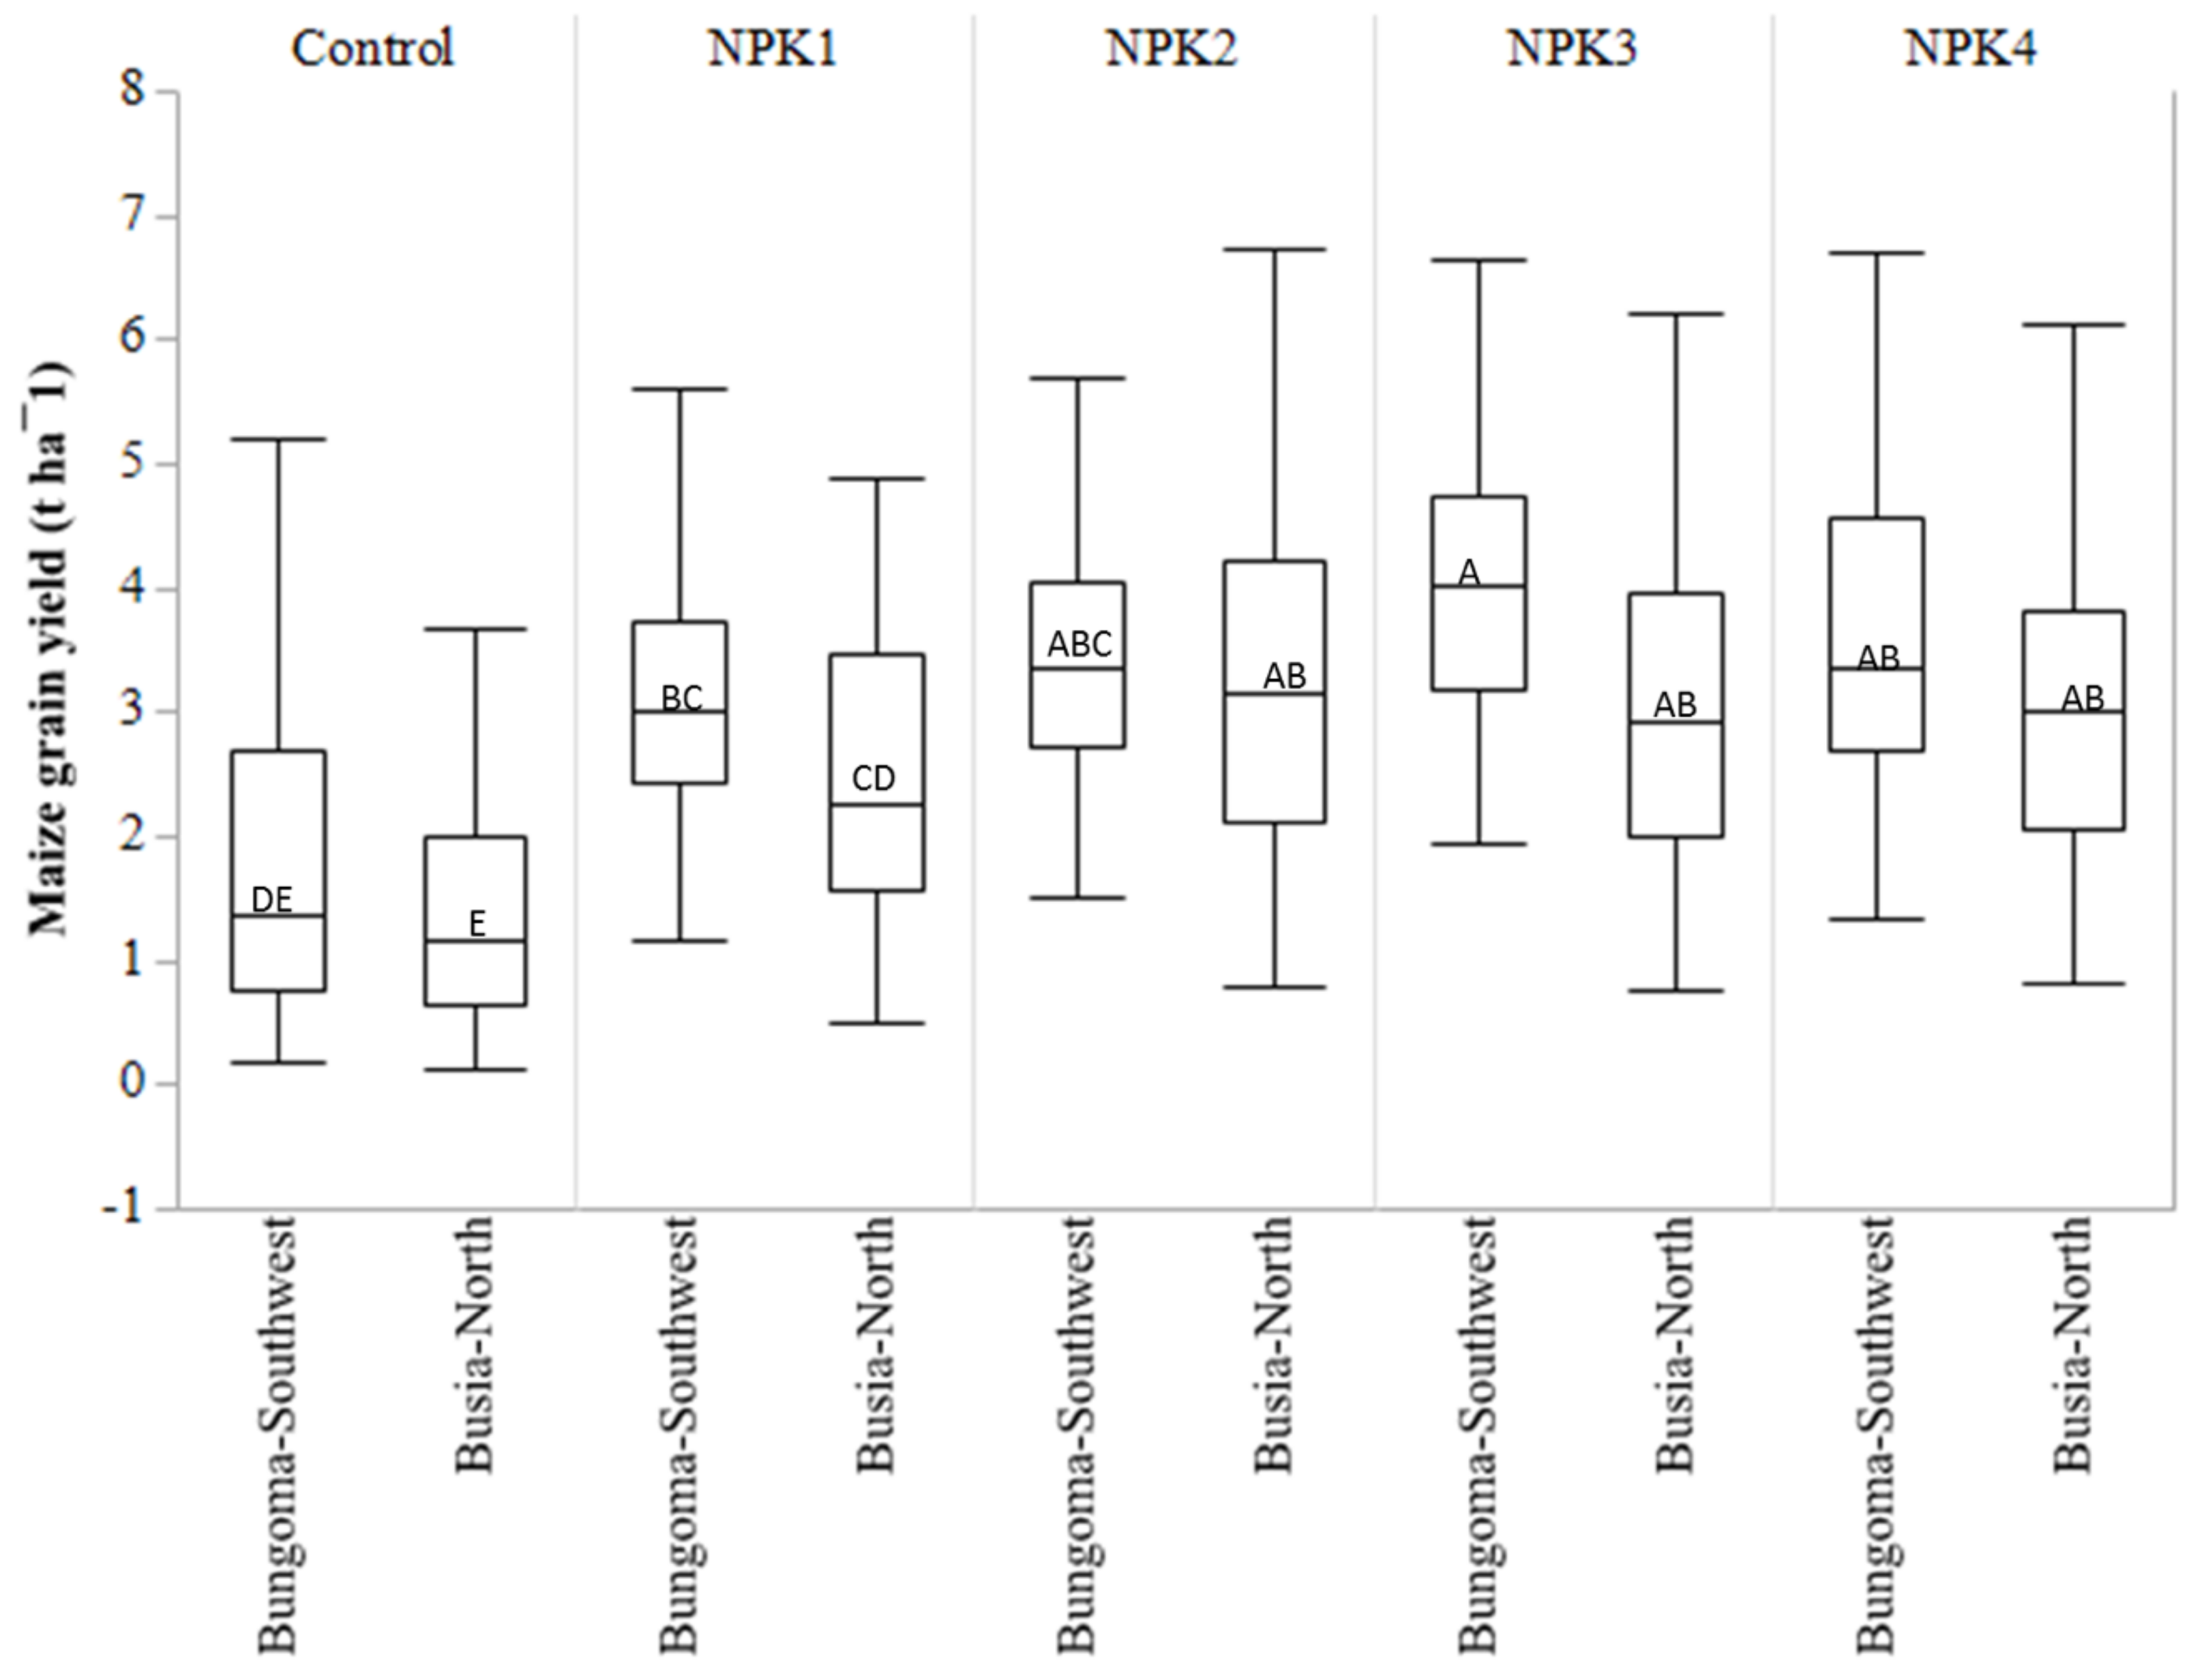
19]. On average, the smallest yield increase above the control was obtained after using the standard N, P and K fertilizer compared with using the NPK amendments for both regions. In Bungoma-Southwest, the largest yield increase of 2.3 t ha−1 was obtained after using NPK3. This implies that, beyond the supply of N, P and K, sites in that region require both Ca, Zn and Cu at optimal rates. It is observed that sites in Bungoma-Southwest had strongly acidic soils (mean pH = 5.2) compared to those in Busia-North (mean pH = 5.5) (Table 2) using the criterion documented by Kanyanjua, et al. [41]. Neutralization of acidity by CO32−, OH, and HCO3 derived from limestone in Mavuno fertilizer (NPK3) may have resulted in more nutrient availability for maize crop uptake in such soils [42,43]. For sites in Busia-North, application of FYM with N and P inorganic supplements performs better than the other amendments. This is an indication that, combining N, P, K and Ca with small rates of Zn and Cu is adequate to restore the productivity of poorly responsive soils in that region. Nearly of all sites in Busia-North had more than 75% sand and, therefore, the NPK2 deems important for nutrient and water retention.
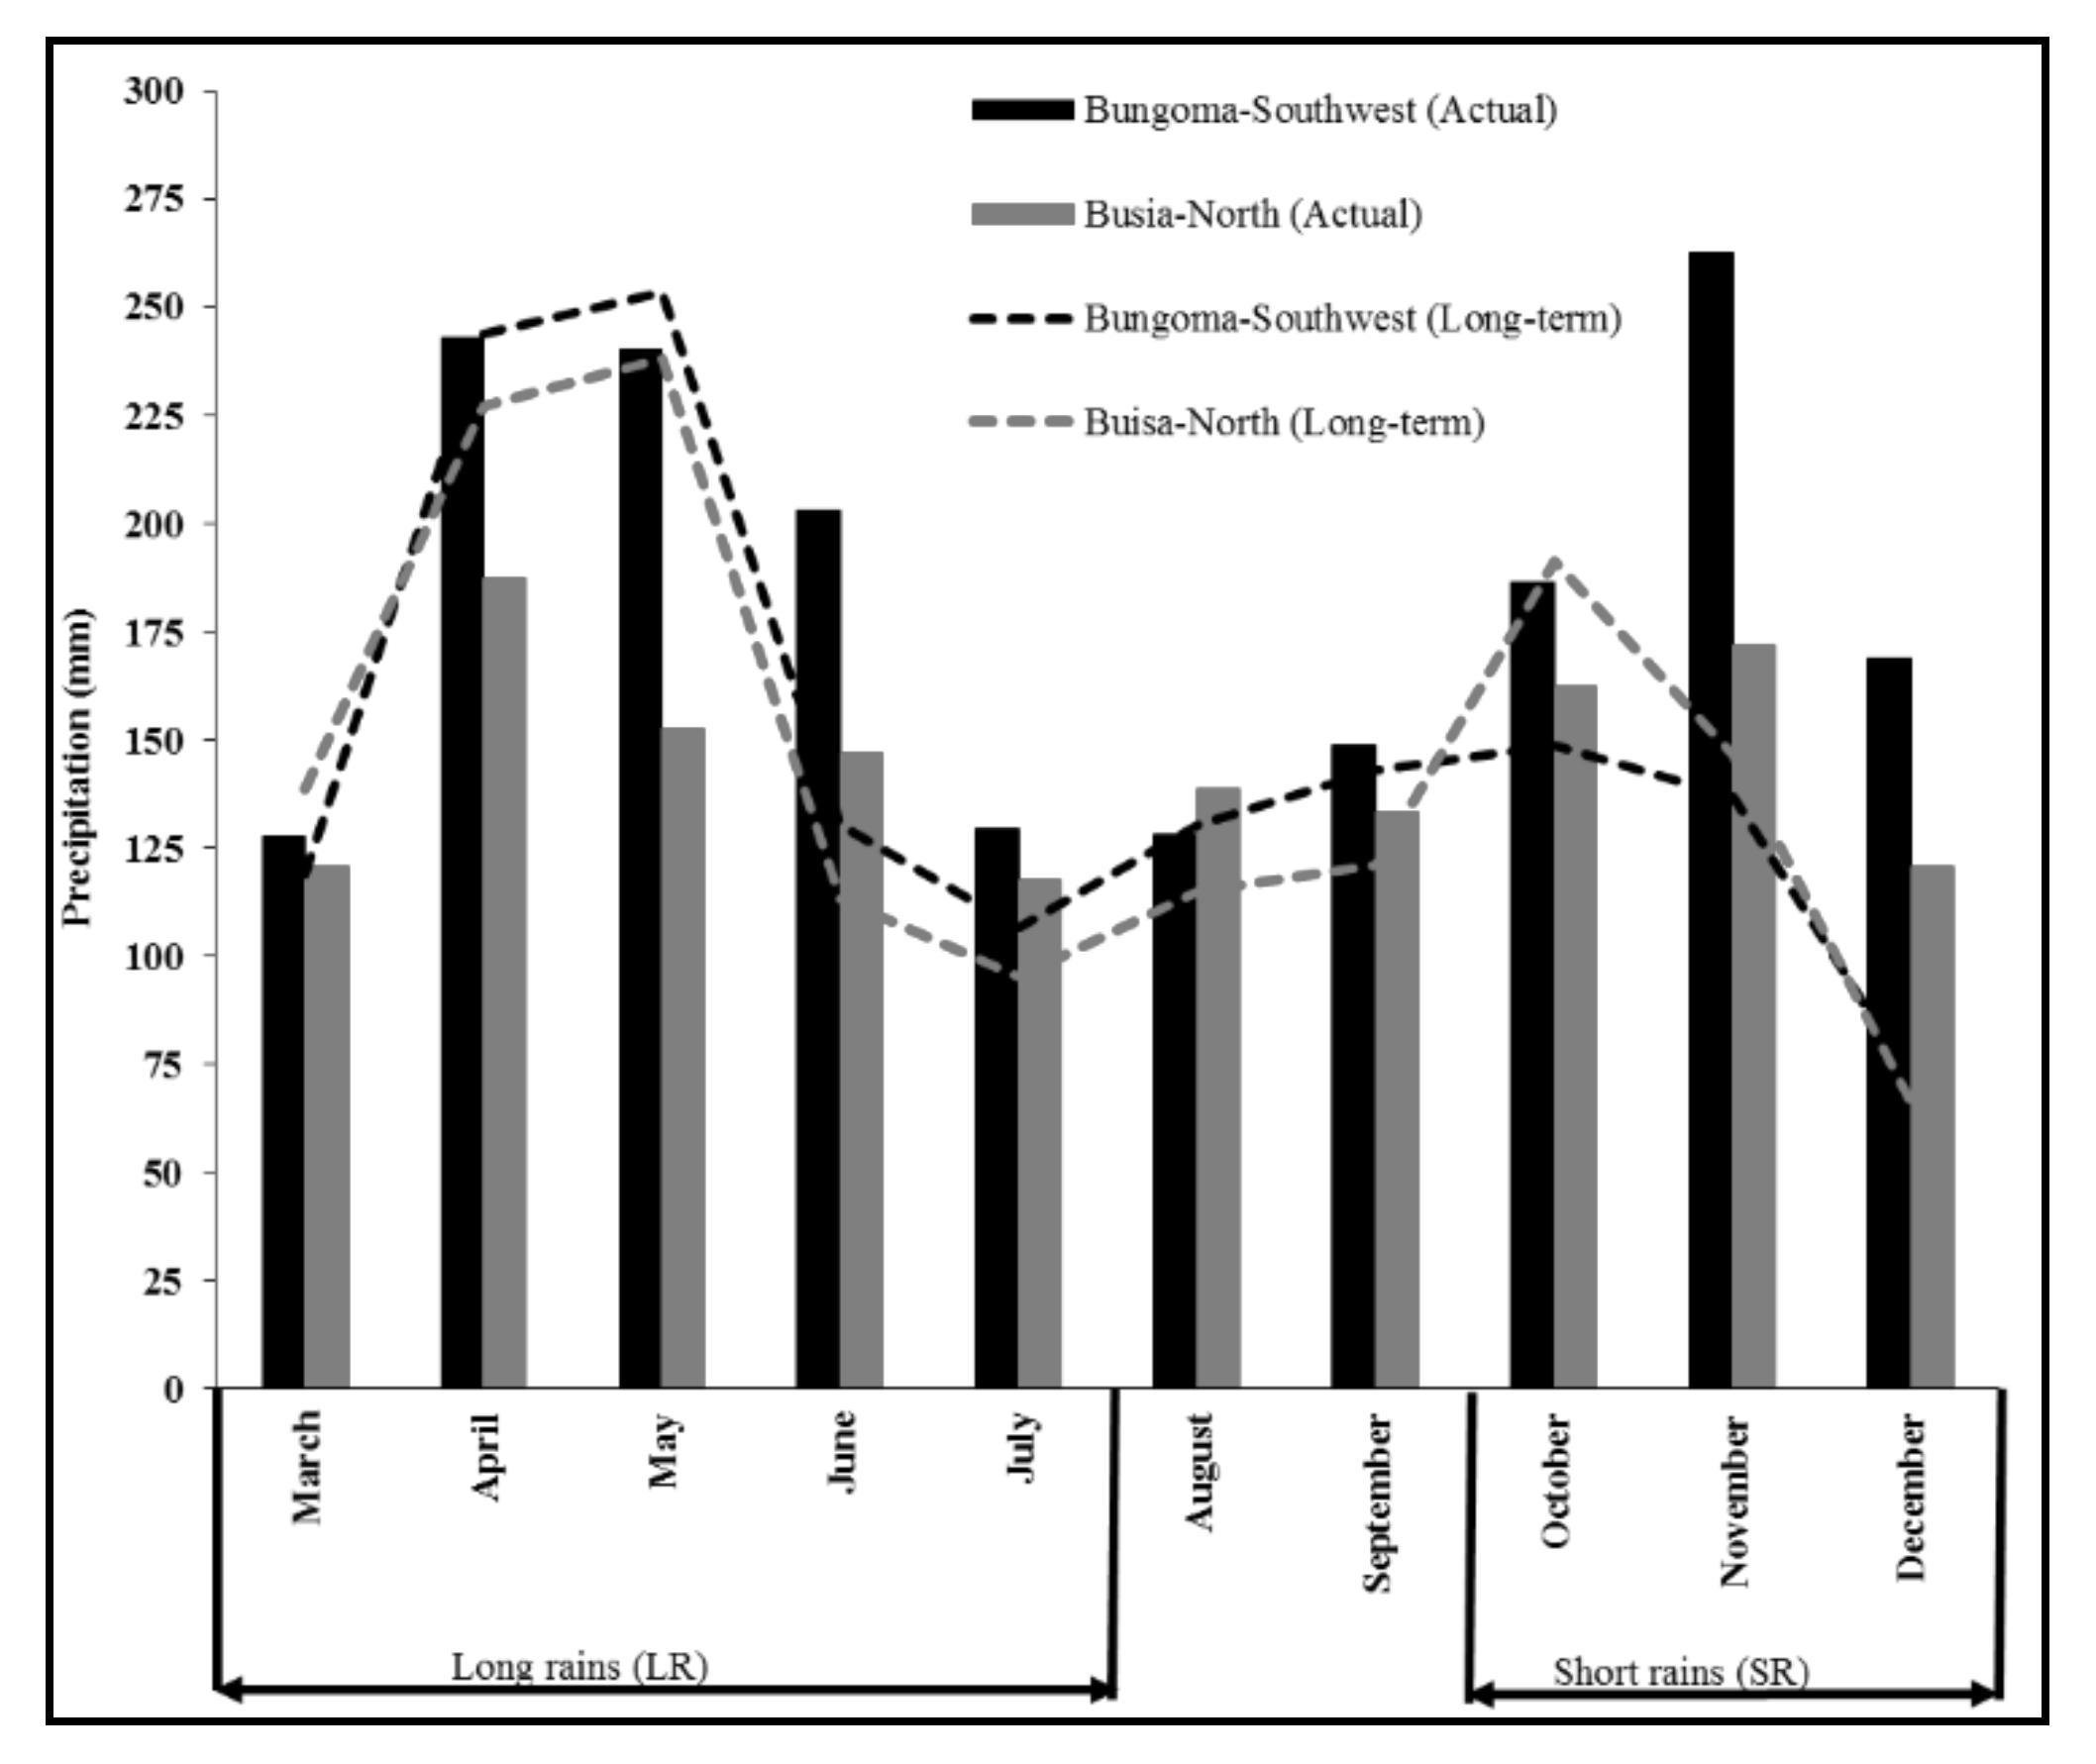
The conspicuous seasonal effect on yield also confirms weather pattern as a major constraint to maize production beyond nutrient deficiencies for the rain-fed agriculture [44]. In general, during the short rains, maize yields reduced by 28% below the 3.6 t ha−1 obtained during the long rains. Although a comparison between the yields at region level showed no significant differences, yields obtained during the second cropping seasons differed. Sites from Bungoma-Southwest produced larger yields after addressing the SMN deficiencies compared to Busia-North. It was observed that Bungoma-Southwest received a substantial amount of rainfall during the SR (cumulative rainfall of 482 mm between September and November) compared to the average of precipitation recorded over several years (Figure 2). The rainfall increase was largest in the month of November which coincides with grain filling [45] and consequently may have contributed to the yield difference between the sites

4.2. Maize Agronomic Response Clusters

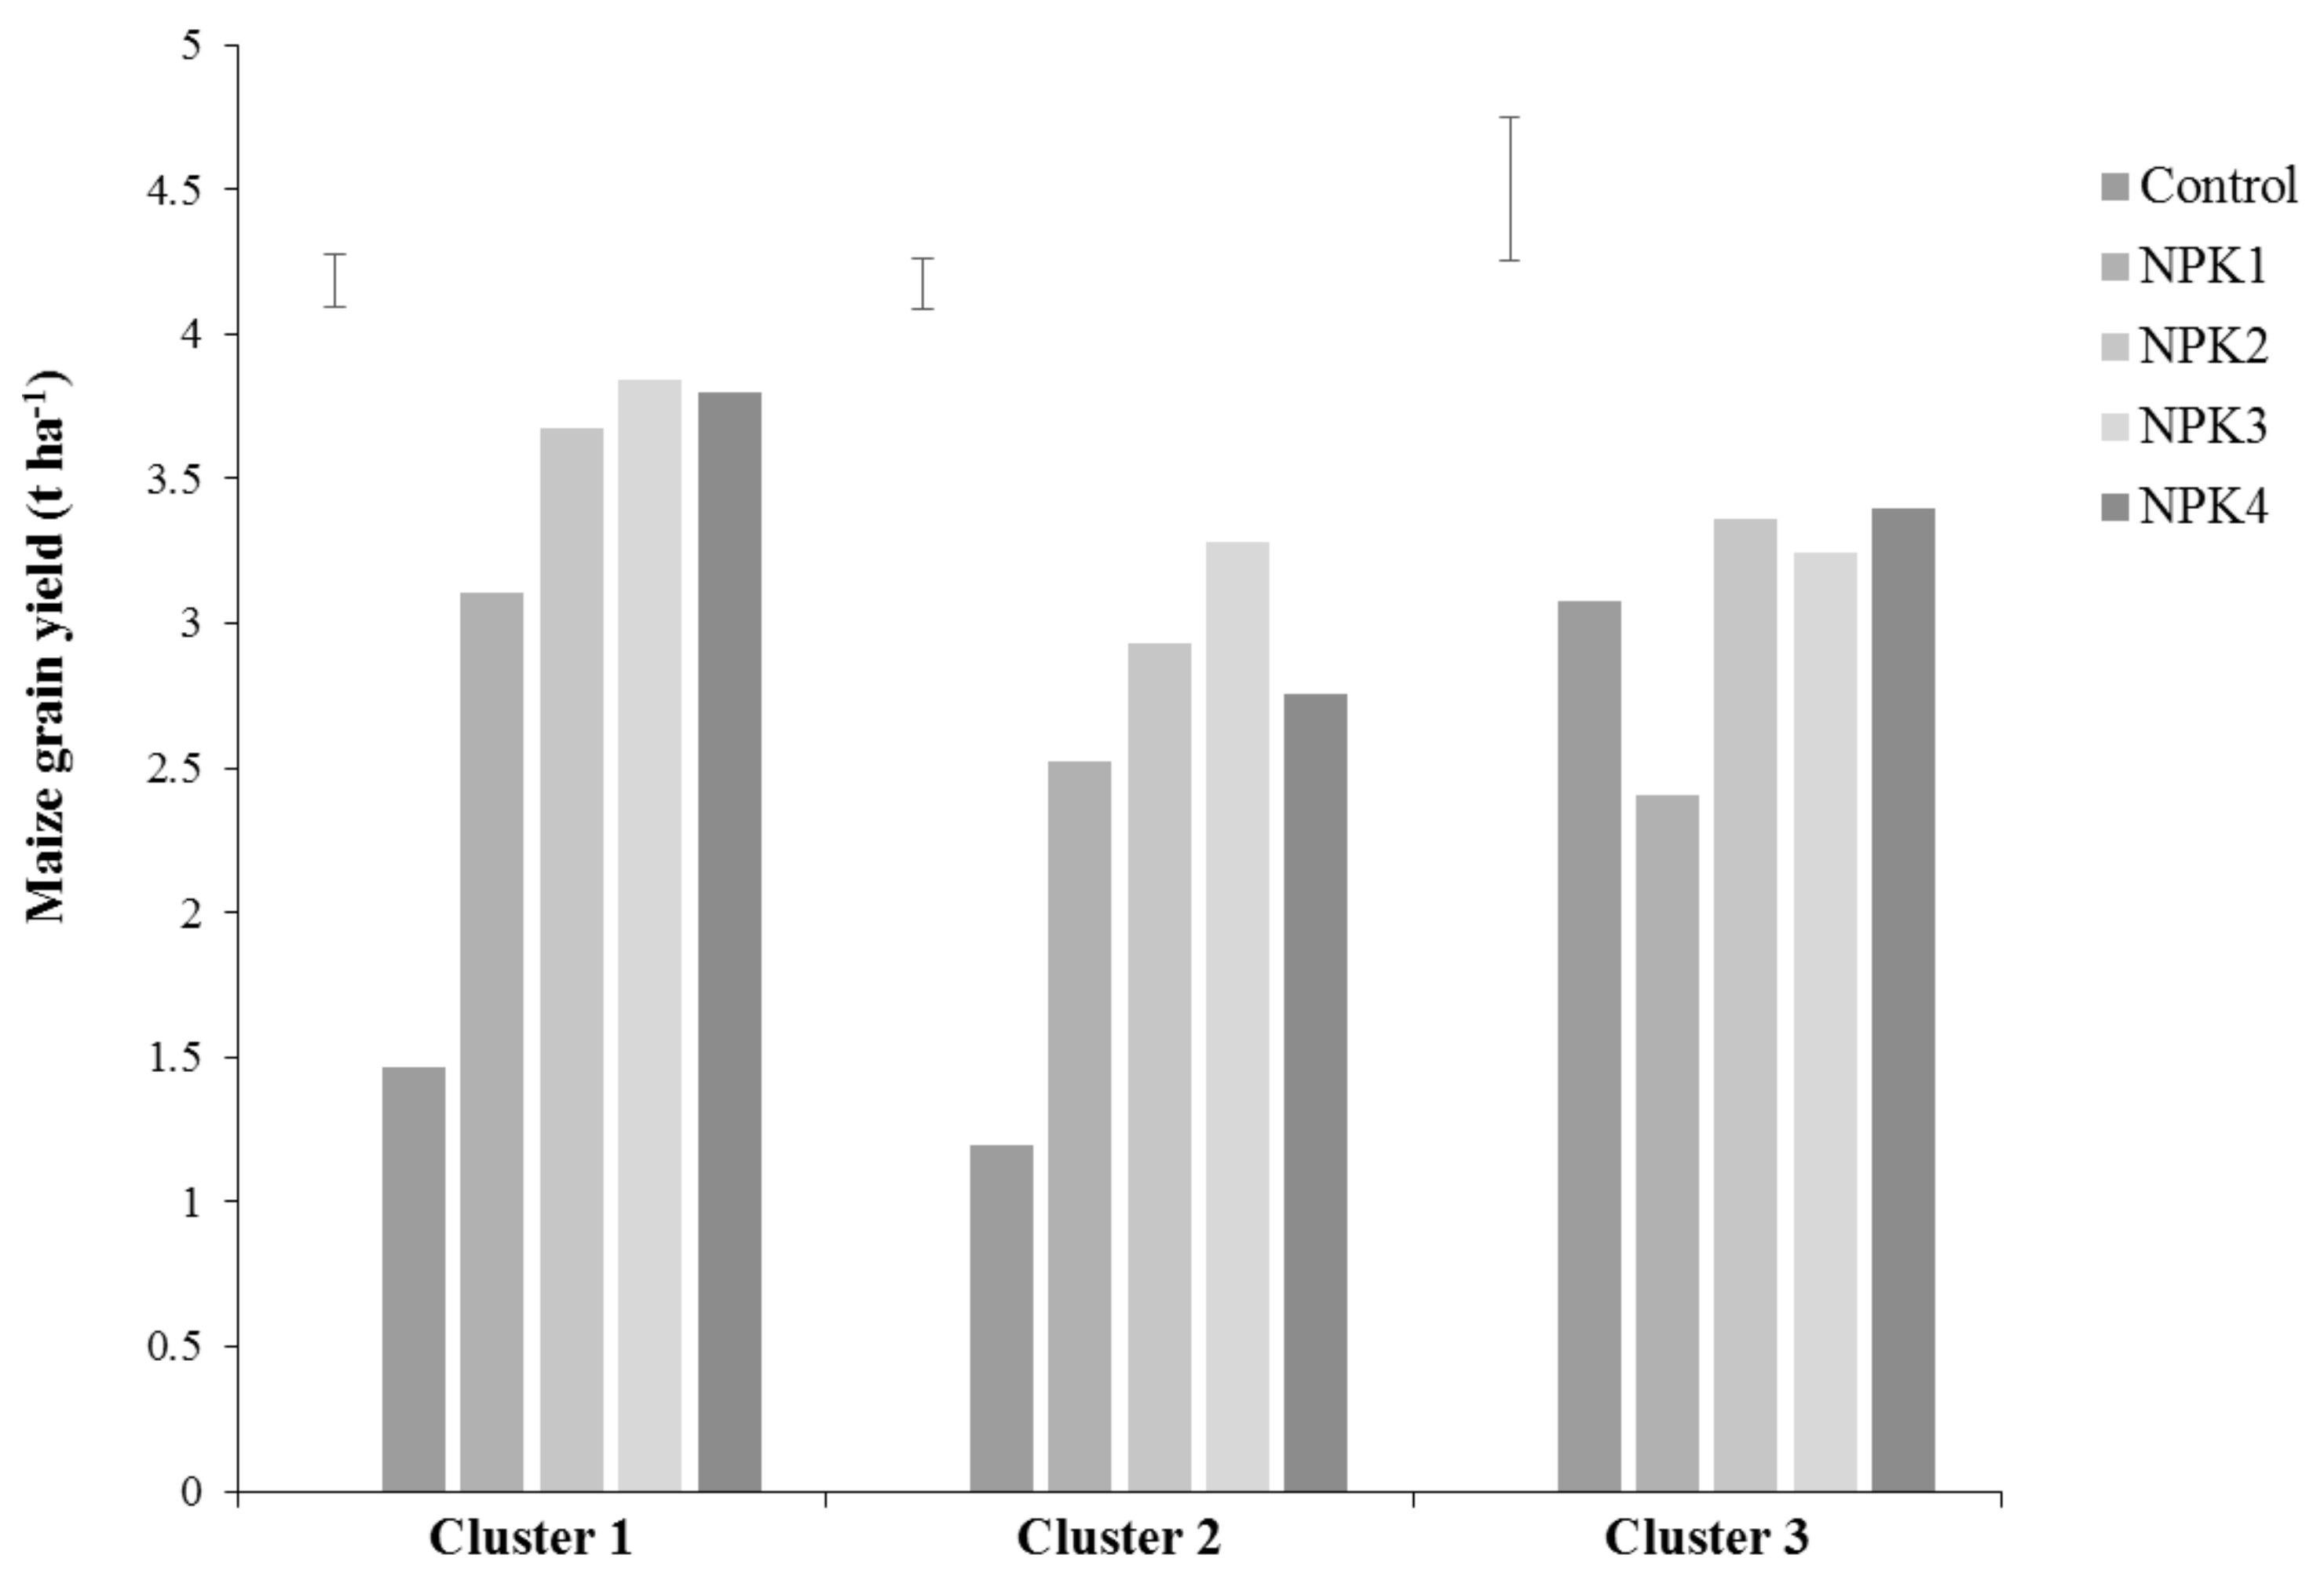
Beyond the yield averages, the clusters reveal diverse maize response patterns across the study sites. Sites in Cluster 1 showed a response to all three NPK amendments. Soils from sites belonging to this cluster were not only deficient in primary nutrients, P (<10 mg kg−1) and N (<0.2%) (Table 6) but also in SMNs (Ca, Zn and Cu) and hence the response to all NPK amendments. Therefore, these results indicate the need of supplying together all nutrients that limit maize production in poorly responsive soils. In agreement with earlier reports [23,24,46], on the contribution of SMNs in closing the yield gaps in SSA, it is also obvious in these soils. In addition, supplying small amounts of micronutrients, like Zn and Cu through FYM may be adequate for maize production in soils such as those found in this cluster. Negligible differences in yield improvement were observed from the application of FYM compared to the relatively high micronutrient rates supplied through the inorganic amendments. Soils for this cluster mainly comprised of Luvisols, Lixisols, Cambisols and Planosols. Those soils are commonly known for their relatively large base saturation and hence, can hold a larger amount of nutrients [28]. Alongside the supply of nutrients, FYM may have further increased the nutrient storage capacity of these soils considering their average low organic carbon content and a large sand content of 71% [40,47]. A similar observation by Zingore, et al. [48] also highlights the need of FYM for restoring productivity in nutrient depleted sandy soils.
Sites in Cluster 2 showed a selective response to the NPK3 amendment. Sites in this cluster also had low P (6.9 mg P kg−1) - while slightly higher- compared to those in Cluster 1 (6.5 mg P kg−1). Soil N was also low in sites belonging to Cluster 2 (Table 6). Although the restricted response to NPK3 indicates a larger demand of micronutrients compared to sites belonging to other clusters, it also demonstrates the need of Ca application in such soils. In addition, the small S, Mg and Cu contents measured in maize ear leaves from sites in this cluster may account for the relatively low yield improvement (Table 5). With reference to the S sufficiency ranges between 0.16–0.2% given by Reuters and Robinson [49], S was clearly deficient for optimal maize production in sites belonging to this cluster. With reference to Table 5, N and S play a significant role in allocating sites in this cluster, Cluster 2. The content of N requires being reduced while S requires being increased for those sites to move to Cluster 1. This implies an imbalance between N and S. According to FAO [50], and in line with first principles, some nutrient deficiencies may be aggravated by application of another. Other studies in SSA also indicate that soils become deficient in nutrients like S once the macronutrient status has been optimized [51]. The severity of S deficiency is usually aggregated by high rates of N application ([52]), probably as those applied in our study.
In recent past, crop deficiencies of S have been reported in cropping systems that have reduced anthropogenic S input and failure to replenishment S through fertilizer input to compensate exportation [53]. In line with this, continuous application of Sulphur-free fertilizers may also induce S deficiency [54] such as the case in this study. All the nutrient sources were S-free except for the negligible content contained in FYM (NPK2) and Mavuno fertilizer, used in the NPK3 treatment [55]. The consequence of S-deficient conditions is an inefficient utilization of N, P and K fertilizers and the resulting poor profitability [56].
Similar to S, Mg was not addressed in this study since it had not been diagnosed as a major problem limiting maize production in poorly responsive soils [27]. However, based on the sufficiency ranges between 0.21 and 0.5% given by Reuters and Robinson [49], the measured average content of 0.11% for sites in Cluster 2, indicates deficiency. According to Gransee and Führs [57], Mg deficiency principally occurs due to an absolute small content in the soil or due to cation competition. Using the criterion given by Okalebo, Gathua and Woomer [30], soils in this cluster had moderate exchangeable Mg content on average of 0.74 cmolc kg−1 and hence not limiting. Application of K may have therefore accentuated Mg deficiency through cation competition [58,59]. In addition, low Mg content in ear leaves from sites in Cluster 2 confirms such possibility.
Likewise, while we did address Cu deficiencies in this study, ear leaf contents of this nutrient were still relatively small in samples from sites belonging to Cluster 2. On average, the Cu content for the latter was 1 mg kg−1 below the 9.19 mg kg−1 obtained from sites in Cluster 1 (Table 5). However, those Cu contents for Cluster 2 may not be regarded as deficient as such since their values are still within the sufficiency ranges between 6 and 20 mg kg−1 specified by Reuters and Robinson [49]. Nevertheless, ion competition may still explain a scenario of deficiency. Both Cu and Zn are bivalent cations known to compete for adsorption, i.e., Zn may have inhibited Cu adsorption at the root surface [60]. This can be derived from the slightly larger Zn contents for sites in Cluster 2 (16.22 mg kg−1) compared to 15.9 mg kg−1 measured for those in Cluster 1 (Table 5).
Poor responses to SMNs interventions was observed for sites in Cluster 3. This implies that application of NPK amendments had an insignificant effect on yield increase above control for Cluster 3. The average maize yield of 3 t ha−1 obtained from control plots is indicative of relatively fertile sites in this cluster and hence may be considered as ‘fertile poor responsive cluster’. The soils in this cluster comprised Eutric Cambisols and Gleyic Arenosols with adequate levels of available P at an average of 17 mg.kg−1 [30,61]. Nevertheless, ear leaf content of several micronutrients (S, Mg, B and Cu) for this cluster were small compared to those measured in Cluster 1. Out of the four micronutrients, only Cu was added in the NPK amendments. Although the correlation between soil available P and ear leaf Cu content indicate a synergistic relationship (Table 7), Cu content still seems inadequate to result in a significant maize yield increase. In addition, the emerging S and Mg deficiencies for the same cluster may have also occurred due to similar conditions as those explained for Cluster 2. Furthermore, the marginal B deficiency at 4.5 mg kg−1 in maize ear leaves [62] for Cluster 3 significantly relates to the negligible yield increase above the control. As shown from multinomial logit analysis, N and Ca ear leaf content has an antagonistic effect on B content for the same cluster. Application of N may, therefore, have offset the N: B ratio in soil resulting in low B uptake [63]. Boron is also known to have a close relationship with Ca. Application of Ca to sites belonging to Cluster 3 may have reduced the availability of B resulting in its low uptake [64,65]. A dilution effect is also another possibility of the observed small B ear leaf concentration for Cluster 3. This mostly occurs when large Ca concentration in plant tissue increases B demand due to close similarity in function [66]. In addition, Ca may also influence uptake of B indirectly. Application of Ca in soils for sites belonging the poor responsive Cluster 3 may have increased the uptake of P as observed in Table 5. Both B and Pare anions that have an antagonistic effect. Increase in P uptake reduces B uptake [67] and hence the small content measured.

4.3. Economic Benefit from NPK Amendments for Maize Grain Production

The Economic benefit of fertilizer use is affected by fertilizer cost, grain prices and ultimately how maize responds to fertilizer application [22]. Investing on any of the NPK amendments at an average $0.5 extra above the $1.6 (Table 3) already used to purchase the standard N. P and K fertilizer results in 3 times net profits. Such profits would be satisfactory incentives for investing in fertilizer use in SSA [68,69]. Moreover, it is important to identify the most profitable and suitable fertilizer intervention that fits a local context. In this case, results indicate that NPK3 (Mavuno based amendment) was more profitable in Bungoma-Southwest compared to the other amendments while the FYM based amendment was the most profitable in Busia-North. Further, delineating the type of maize responses clearly separates sites where NPK amendments can be recommended from those that still require further attention. In agreement with Kihara, et al. [70] substantiating the highly variable profitability of fertilizer use helps farmers to make well-informed decisions on fertilizer use.
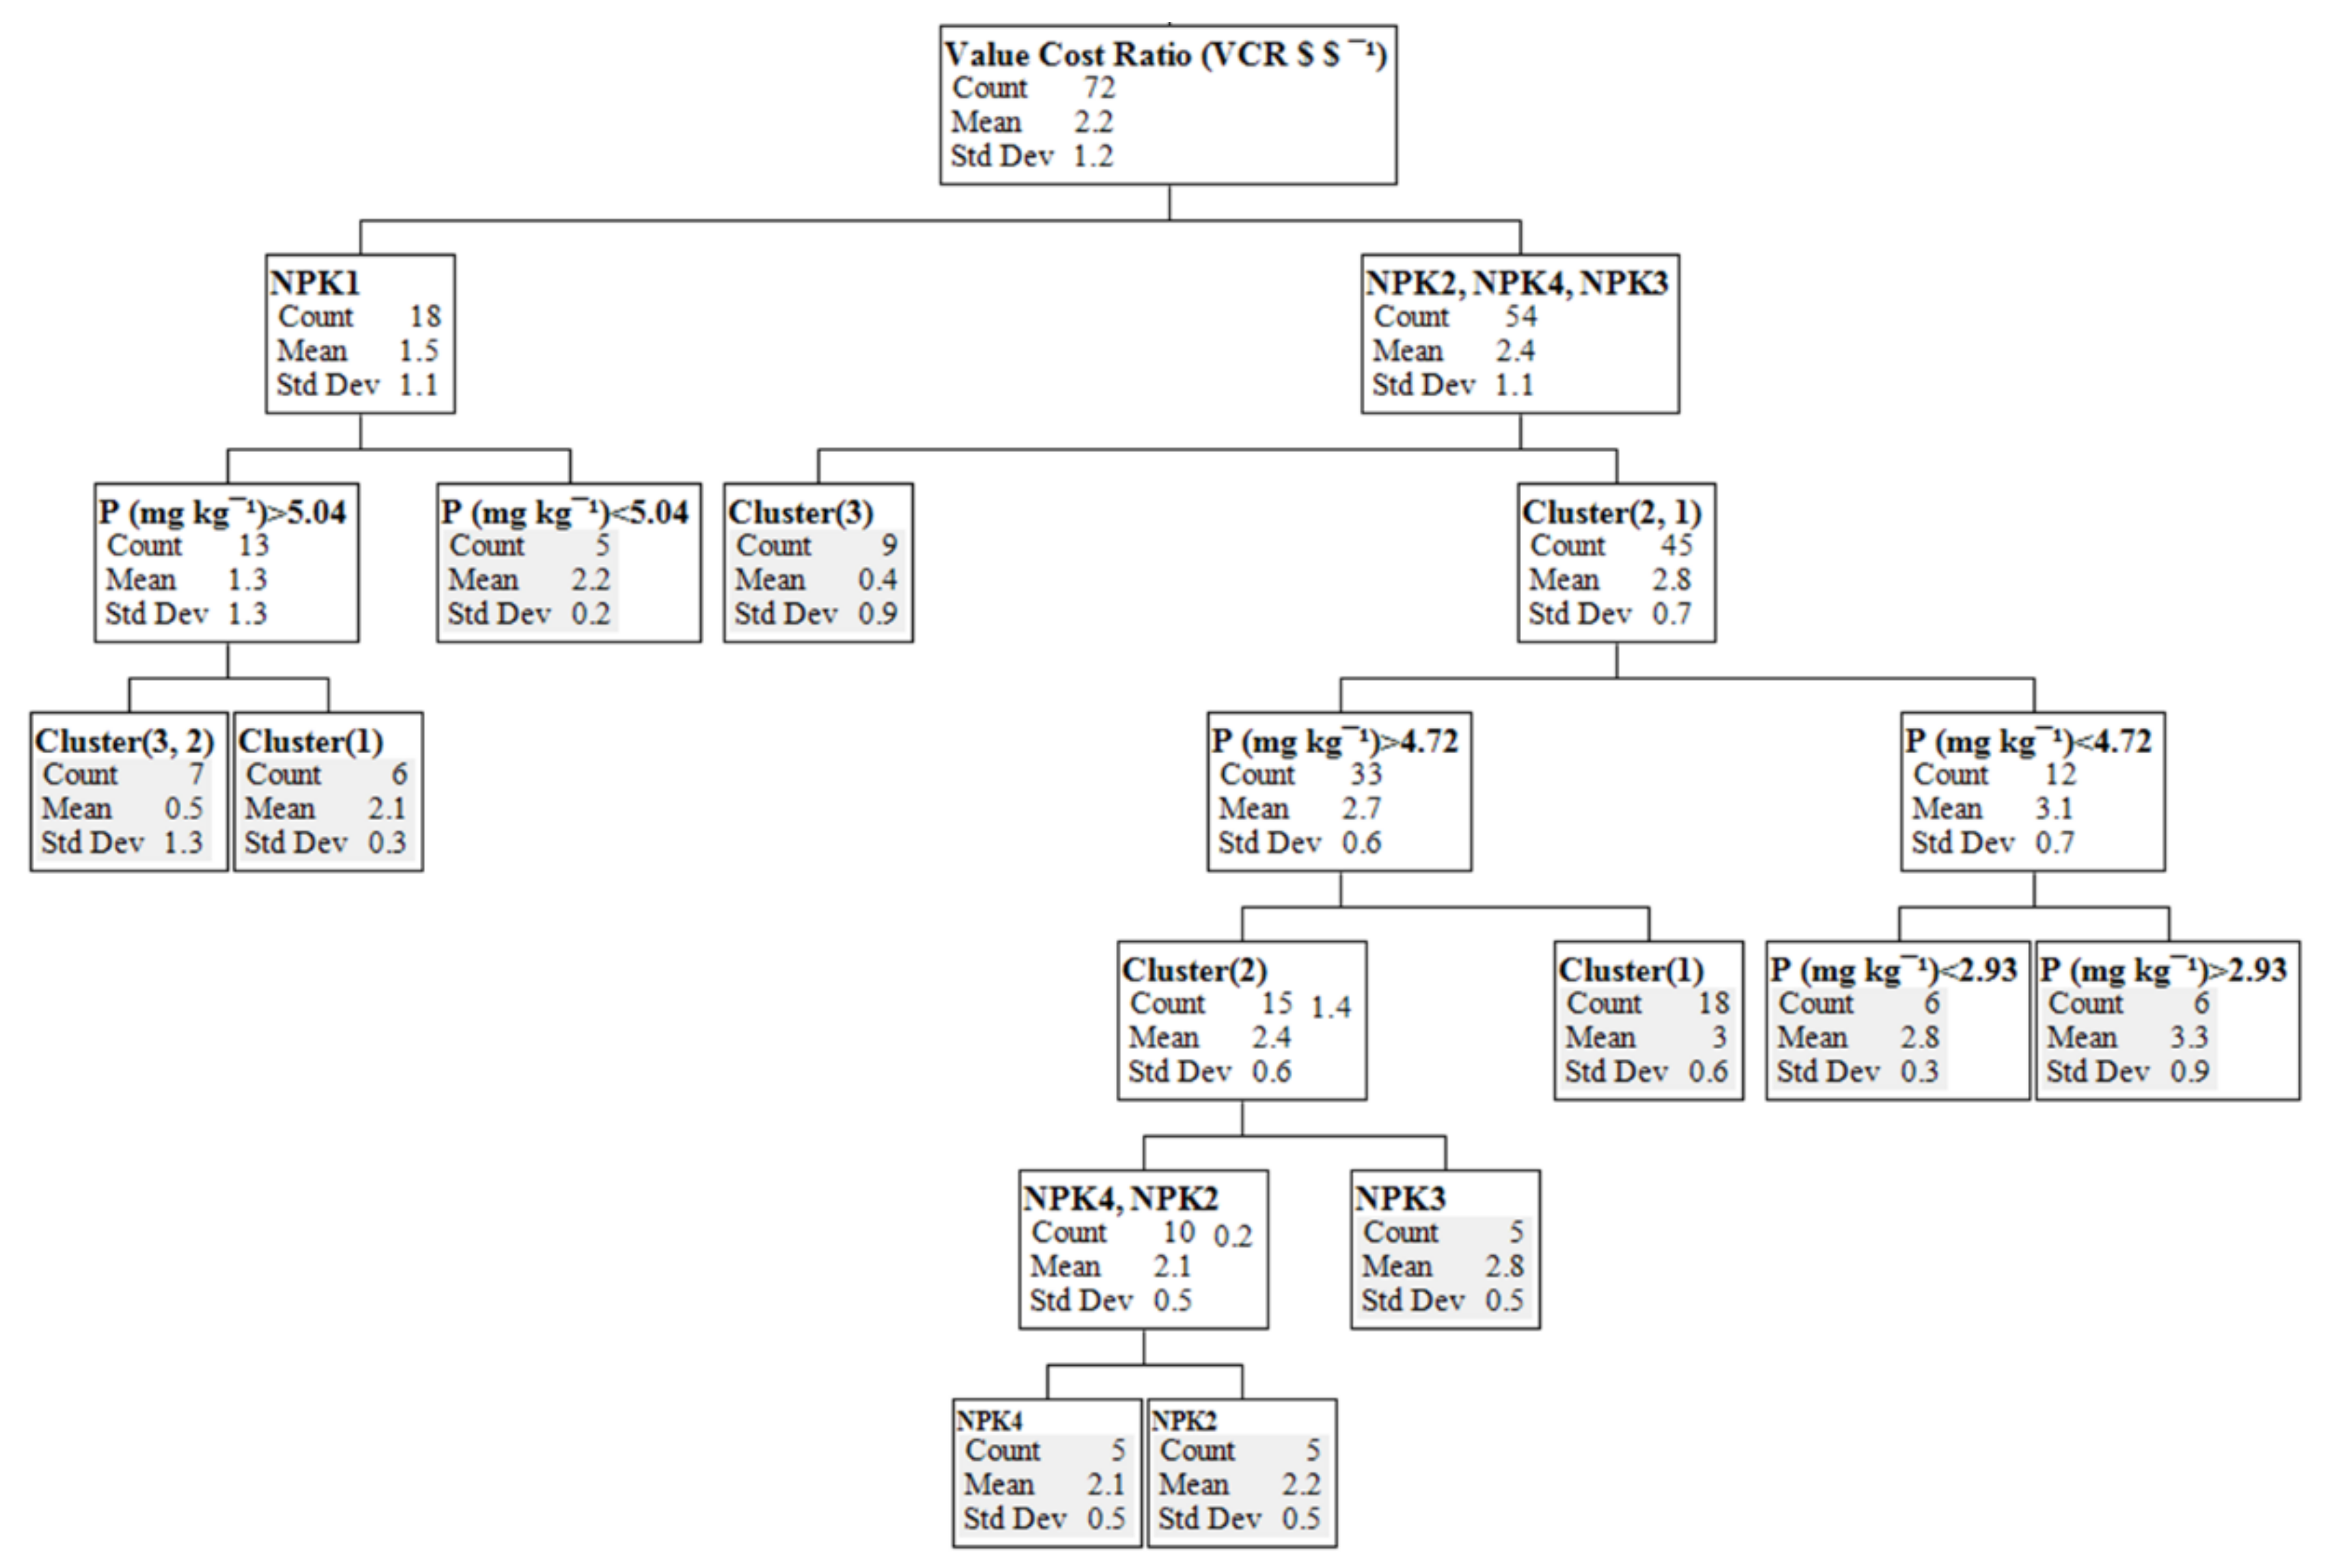
Application of the CART tool reveals the underlying soil characteristics that would predict the profitability of fertilizer use. The tool, therefore, provides a simple method of determining which would the most profitable fertilizer interventions under specific soil conditions. Use of the standard N, P and K fertilizer can be profitable only to farmers whose sites have less than 5.04 mg P kg−1 irrespective of the response clusters. Only 28% of the total sites are in this category; confirming the diagnosis of poorly responsive soils in an earlier study [27]. Obviously, the use of NPK amendments remains a risky intervention for farmers with sites that belong to the poorly responsive, Cluster 3. Therefore, recommending the NPK amendments would also not be appropriate to farmers whose sites belong that cluster. However, determination of judicious and balanced nutrient combinations for maintaining soil productivity in such sites is indispensable [71,72]. For example, applying lower N and Ca rates may not only reduce the fertilizer cost but would maintain the desired nutrient balance ratio in maize ear leaf tissue. Application of NPK amendments can be beneficial to farmers whose sites belong to clusters 1 and 2, respectively. Furthermore, the smaller the available P (< 4.72 mg kg−1) in such soils, the more financial benefits may be realized. However, if the soils have more than 4.72 mg P kg−1 of soil, supplying of both macro and micronutrients at optimum levels is critical for sites in Cluster 2. For maximum benefit of the NPK amendments, sites should have less than 2.93 mg P kg−1 of soil. In such case, not only P would be limiting maize production but also the secondary and micronutrients.

5. Conclusions

This study has demonstrated the need for going beyond the application of the standard N, P and K fertilizers in rehabilitating the poorly responsive soils. Specifically, we demonstrated that (i) maize grain yields increased following inclusion of SMNs in specific cases; (ii) maize response patterns to the interventions relate to specific leaf nutrient content and soil properties and (iii) the addition of the selected nutrients to the standard N, P and K fertilizer renders the interventions profitable in some cases. In general, the results indicate that application of Ca is important for all the poor responsive soils irrespective of the source and region. In addition, the optimal rates of Zn and Cu at 3 kg ha−1 are necessary for sites in Bungoma-Southwest compared to those in Busia-North. For the latter region, amendment of those nutrients through FYM is adequate. Further, varied crop responses to the NPK amendments irrespective of the regions were observed: (i) response to all three NPK amendments, Cluster 1 (ii) response to only one amendment, Cluster 2 and (iii) poor response to all the three NPK amendments, Cluster 3. Emerging deficiencies of both S, Mg and B were observed while Cu amendment was not still sufficient for optimal maize production in some of the sites. This study was also able to delineate those sites in which the NPK amendments may be profitable from those that require further attention. Beyond the maize response clusters, available P in soil determines the profitability of NPK amendments. This is an indication that farmers may have fertilizer options that guide them in decision making for management of poorly responsive soils. The persistent poor responses call for further research to understand the underlying factors such as soil mineralogy and after modifying the NPK amendments for improved crop productivity with a balanced nutrition.

Acknowledgments

We acknowledge the funding of this study by the VLIR–IUC-MUK Programme (Vlaamse Interuniversitaire Raad, Institutional University Cooperation between Flanders (Belgium) and Moi University, Kenya) of which the project was part. The ‘CONNESSA’ project ERAfrica_IC-080, ERA-NET FP7 partly also funded this study. We are grateful for the farmers’ cooperation and participation across Bungoma-Southwest and Busia-North sites throughout the stud period. We also appreciate the provision of long-term rainfall data from Kenya meteorology department, Nairobi, Kenya. Finally, yet importantly, we acknowledge the technical support accorded by experts from both the University of Eldoret, Kenya and KU Leuven, Belgium.

Author Contributions

Ruth Njoroge designed and conducted all field trials, analyzed data and wrote the manuscript. Roel Merckx conceived the research and revised the manuscript. Abigael N. Otinga and John R. Okalebo revised the manuscript. Mary Emongole assisted in the maintenance of field trials and data collection.

Conflicts of Interest

The authors declare no conflicts of interest.

References

  1. Bindraban, P.S.; Dimkpa, C.; Nagarajan, L.; Roy, A.; Rabbinge, R. Revisiting fertilisers and fertilisation strategies for improved nutrient uptake by plants. Biol. Fertil. Soils 2015, 51, 897–911. [Google Scholar] [CrossRef]
  2. Hossain, M.; Singh, V.P. Fertilizer use in asian agriculture: Implications for sustaining food security and the environment. Nutr. Cycl. Agroecosyst. 2000, 57, 155–169. [Google Scholar] [CrossRef]
  3. FAO (Food and Agriculture Organization of the United Nations). Regional Overview of Food Insecurity: African Food Security Prospects Brighter than Ever; FAO: Accra, Ghana, 2015. [Google Scholar]
  4. IFDC (International Fertilizer Development Center). Proceedings of the Africa Fertilizer Summit, Fertilizer Africa Congress. Abuja, Nigeria, 9–13 June 2006; Thigpen, L.L., Hargrove, T.R., Eds.; IFDC: Abuja, Nigeria. [Google Scholar]
  5. Sasson, A. Food security for africa: An urgent global challenge. Agric. Food Secur. 2012, 1, 1–16. [Google Scholar] [CrossRef]
  6. Ozor, N.; Umunnakwe, C.P.; Acheampong, E. Challenges of food security in africa and the way forward. Development 2013, 56, 404–411. [Google Scholar] [CrossRef]
  7. Diriye, M.; Nur, A.; Khalif, A. Food aid and the challenge of food security in africa. Development 2013, 56, 396–403. [Google Scholar] [CrossRef]
  8. Marenya, P.P.; Barrett, C.B. State-conditional fertilizer yield response on western kenyan farms. Am. J. Agric. Econ. 2009, 91, 991–1006. [Google Scholar] [CrossRef]
  9. Vanlauwe, B.; Giller, K.E. Popular myths around soil fertility management in sub-saharan africa. Agric. Ecosyst. Environ. 2006, 116, 34–46. [Google Scholar] [CrossRef]
  10. Tamene, L.; Mponela, P.; Ndengu, G.; Kihara, J. Assessment of maize yield gap and major determinant factors between smallholder farmers in the dedza district of malawi. Nutr. Cycl. Agroecosyst. 2016, 105, 291–308. [Google Scholar] [CrossRef]
  11. Drechsel, P.; Kunze, D.; de Vries, F.P. Soil nutrient depletion and population growth in sub-saharan africa: A malthusian nexus? Popul. Environ. 2001, 22, 411–423. [Google Scholar] [CrossRef]
  12. Stoorvogel, J.J.; Smaling, E.M.A.; Janssen, B.H. Calculating soil nutrient balances in africa at different scales. Fertil. Res. 1993, 35, 227–235. [Google Scholar] [CrossRef]
  13. Ricker-Gilbert, J.; Mason, N.M.; Darko, F.A.; Tembo, S.T. What are the effects of input subsidy programs on maize prices? Evidence from malawi and zambia. Agric. Econ. 2013, 44, 671–686. [Google Scholar] [CrossRef]
  14. Druilhe, Z.; Barreiro-Hurlé, J. Fertilizer Subsidies in Sub-Saharan Africa; FAO: Rome, Italy, 2012. [Google Scholar]
  15. Vanlauwe, B.; Kihara, J.; Chivenge, P.; Pypers, P.; Coe, R.; Six, J. Agronomic use efficiency of n fertilizer in maize-based systems in sub-saharan africa within the context of integrated soil fertility management. Plant Soil 2011, 339, 35–50. [Google Scholar] [CrossRef]
  16. Nziguheba, G.; Tossah, B.K.; Diels, J.; Franke, A.C.; Aihou, K.; Iwuafor, E.N.O.; Nwoke, C.; Merckx, R. Assessment of nutrient deficiencies in maize in nutrient omission trials and long-term field experiments in the west african savanna. Plant Soil 2008, 314, 143–157. [Google Scholar] [CrossRef]
  17. Nziguheba, G.; Zingore, S.; Kihara, J.; Merckx, R.; Njoroge, S.; Otinga, A.; Vandamme, E.; Vanlauwe, B. Phosphorus in smallholder farming systems of sub-saharan africa: Implications for agricultural intensification. Nutr. Cycl. Agroecosyst. 2016, 104, 321–340. [Google Scholar] [CrossRef]
  18. Vanlauwe, B.; Coe, R.I.C.; Giller, K.E. Beyond averages: New approaches to understand heterogeneity and risk of technology success or failure in smallholder farming. Exp. Agric. 2016, 1–23. [Google Scholar] [CrossRef]
  19. Vanlauwe, B.; Descheemaeker, K.; Giller, K.E.; Huising, J.; Merckx, R.; Nziguheba, G.; Wendt, J.; Zingore, S. Integrated soil fertility management in sub-saharan africa: Unravelling local adaptation. Soil 2015, 1, 491–508. [Google Scholar] [CrossRef]
  20. Tittonell, P.; Vanlauwe, B.; Corbeels, M.; Giller, K.E. Yield gaps, nutrient use efficiencies and response to fertilisers by maize across heterogeneous smallholder farms of western kenya. Plant Soil 2008, 313, 19–37. [Google Scholar] [CrossRef]
  21. Vanlauwe, B.; Bationo, A.; Chianu, J.; Giller, K.E.; Merckx, R.; Mokwunye, U.; Ohiokpehai, O.; Pypers, P.; Tabo, R.; Shepherd, K.D.; et al. Integrated soil fertility management: Operational definition and consequences for implementation and dissemination. Outlook Agric. 2010, 39, 17–24. [Google Scholar] [CrossRef]
  22. Kelly, A.V. Factors affecting demand for fertilizer in sub-Saharan Africa. In Discussion Paper; World Bank: Washington, DC, USA, 2006. [Google Scholar]
  23. Kihara, J.; Nziguheba, G.; Zingore, S.; Coulibaly, A.; Esilaba, A.; Kabambe, V.; Njoroge, S.; Palm, C.; Huising, J. Understanding variability in crop response to fertilizer and amendments in sub-saharan africa. Agric. Ecosyst. Environ. 2016, 229, 1–12. [Google Scholar] [CrossRef] [PubMed]
  24. Jones, D.L.; Cross, P.; Withers, P.J.A.; DeLuca, T.H.; Robinson, D.A.; Quilliam, R.S.; Harris, I.M.; Chadwick, D.R.; Edwards-Jones, G.; Kardol, P. Review: Nutrient stripping: The global disparity between food security and soil nutrient stocks. J. Appl. Ecol. 2013, 50, 851–862. [Google Scholar] [CrossRef]
  25. Jaetzold, R.; Schmidt, H.; Hornetz, B.; Shisanya, C. Farm Management Handbook of Kenya: Natural Conditions and Farm Management Information. Part A: West Kenya, Subpart a1, Western Province, 2nd ed.; Ministry of Agriculture and German Agency for Technical Cooperation: Nairobi, Kenya, 2005; Volume 2. [Google Scholar]
  26. Sombroek, W.G.; Braun, H.M.H.; Pouw, B.J.A.V.D. Exploratory Soil Map and Agro-Climatic Zone Map of Kenya, 1980, Scale 1:1,000,000; 9789032701628; Kenya Soil Survey: Nairobi, Kenya, 1982. [Google Scholar]
  27. Njoroge, R.; Otinga, A.N.; Okalebo, J.R.; Pepela, M.; Merckx, R. Occurrence of poorly responsive soils in western kenya and associated nutrient imbalances in maize (zea mays l.). Field Crop. Res. 2017, 210, 162–174. [Google Scholar] [CrossRef]
  28. IUSS Working Group WRB. World reference base for soil resources 2014, update 2015. International soil classification system for naming soils and creating legends for soil maps. In World Soil Resources Reports; FAO: Rome, Italy, 2015. [Google Scholar]
  29. NAAIAP (National Accelerated Agricultural Inputs Access Programme); KARI (Kenya Agricultural Research Institute). Soil Suitability Evaluation for Maize Production in Kenya, Agriculture, Ed.; Ministry of Agriculture Livestock & Fisheries: Nairobi, Kenya, 2014.
  30. Okalebo, J.R.; Gathua, K.W.; Woomer, P.L. Laboratory Methods of Soil and Plant Analysis. A Working Manual, 2nd ed.; TSBF-CIAT and SACRED AFRICA: Nairobi, Kenya, 2002. [Google Scholar]
  31. Dumas, J.B.A. Procedes de l’analyse organic. Ann. Chim. Phys. 1931, 247, 198–213. [Google Scholar]
  32. Ciesielski, H.; Sterckeman, T.; Santerne, M.; Willery, J.P. Determination of cation exchange capacity and exchangeable cations in soils by means of cobalt hexamine trichloride. Effects of experimental conditions. Agronomie 1997, 17, 1–7. [Google Scholar] [CrossRef]
  33. Jones, J.B. Field sampling procedures for conducting a plant analysis. In Handbook of Reference Methods for Plant Analysis; CRC Press: Boca Raton, FL, USA, 1997. [Google Scholar]
  34. Havlin, J.L.; Soltanpour, P.N. A nitric acid plant tissue digest method for use with inductively coupled plasma spectrometry. Commun. Soil Sci. Plant Anal. 1980, 11, 969–980. [Google Scholar] [CrossRef]
  35. Bremner, J.; Tabatabai, M. Use of automated combustion techniques for total carbon, total nitrogen, and total sulfur analysis of soils. In Instrumental Methods for Analysis of Soils and Plant Tissue; Soil Science Society of America: Madison, WI, USA, 1971; pp. 1–15. [Google Scholar]
  36. Townsend, R.F. Agricultural Incentives in Sub-Saharan Africa: Policy Challenges; World Bank: Washington, DC, USA, 1999; Volume 23. [Google Scholar]
  37. Tittonell, P.; Shepherd, K.D.; Vanlauwe, B.; Giller, K.E. Unravelling the effects of soil and crop management on maize productivity in smallholder agricultural systems of western Kenya—An application of classification and regression tree analysis. Agric. Ecosyst. Environ. 2008, 123, 137–150. [Google Scholar] [CrossRef]
  38. Breiman, L.; Friedman, J.H.; Olshen, R.A.; Stone, C.J. Classification and Regression Trees; Wadsworth & Brooks: Monterey, CA, USA, 1984. [Google Scholar]
  39. SAS Institute. Discovering Jmp 12®; SAS Institute: Cary, NC, USA, 2015. [Google Scholar]
  40. Sanchez, P.A. Tripling crop yields in tropical africa. Nat. Geosci. 2010, 3, 299–300. [Google Scholar] [CrossRef]
  41. Kanyanjua, S.M.; Ireri, L.; Wambua, S.; Nandwa, S.M. Acidic soils in Kenya: Constraints and remedial options. In KARI Technical Note Series; Mugah, J.O.E.A., Ed.; KARI Headquarters, Nairobi, Kenya: Nairobi, 2002; p. 27. [Google Scholar]
  42. Otinga, A.N.; Pypers, P.; Okalebo, J.R.; Njoroge, R.; Emong’ole, M.; Six, L.; Vanlauwe, B.; Merckx, R. Partial substitution of phosphorus fertiliser by farmyard manure and its localised application increases agronomic efficiency and profitability of maize production. Field Crops Res. 2013, 140, 32–43. [Google Scholar] [CrossRef]
  43. Opala, P.; Okalebo, J.; Othieno, C. Effects of organic and inorganic materials on soil acidity and phosphorus availability in a soil incubation study. ISRN Agron. 2012, 2012. [Google Scholar] [CrossRef]
  44. Cooper, P.J.M.; Dimes, J.; Rao, K.P.C.; Shapiro, B.; Shiferaw, B.; Twomlow, S. Coping better with current climatic variability in the rain-fed farming systems of sub-Saharan Africa: An essential first step in adapting to future climate change? Agric. Ecosyst. Environ. 2008, 126, 24–35. [Google Scholar] [CrossRef] [Green Version]
  45. Saini, H.S.; Westgate, M.E. Reproductive development in grain crops during drought. Adv. Agron. 1999, 68, 59–96. [Google Scholar]
  46. Kihara, J.; Njoroge, S. Phosphorus agronomic efficiency in maize-based cropping systems: A focus on western Kenya. Field Crops Res. 2013, 150, 1–8. [Google Scholar] [CrossRef]
  47. Palm, C.A.; Gachengo, C.N.; Delve, R.J.; Cadisch, G.; Giller, K.E. Organic inputs for soil fertility management in tropical agroecosystems: Application of an organic resource database. Agric. Ecosyst. Environ. 2001, 83, 27–42. [Google Scholar] [CrossRef]
  48. Zingore, S.; Delve, R.J.; Nyamangara, J.; Giller, K.E. Multiple benefits of manure: The key to maintenance of soil fertility and restoration of depleted sandy soils on African smallholder farms. Nutr. Cycl. Agroecosyst. 2008, 80, 267–282. [Google Scholar] [CrossRef]
  49. Reuters, D.J.; Robinson, J.B. Plant Analysis: An Interpretation Manual, 2nd ed.; CSIRO: Collinwood, Australia, 1997. [Google Scholar]
  50. FAO. Fertilizer and Plant Nutrition Guide; FAO: Rome, Italy, 1984; Volume M-52, pp. 2–14. [Google Scholar]
  51. Sillanpää, M. Micronutrient assessment at the country level: An international study. In FAO Soils Bulletin; FAO: Rome, Italy, 1990; Volume 63. [Google Scholar]
  52. Kopriva, S.; Koprivova, A. Plant adenosine 5′-phosphosulphate reductase: The past, the present, and the future. J. Exp. Bot. 2004, 55, 1775–1783. [Google Scholar] [CrossRef] [PubMed]
  53. Scherer, H.W. Sulphur in crop production. Eur. J. Agron. 2001, 14, 81–111. [Google Scholar] [CrossRef]
  54. Van Biljon, J.; Fouche, D.; Botha, A. Threshold values for sulphur in soils of the main maize-producing areas of South Africa. South Afr. J. Plant Soil 2004, 21, 152–156. [Google Scholar] [CrossRef]
  55. Poulton, C.; Kydd, J.; Dorward, A. Increasing fertilizer use in Africa: What have we learned? In Discussion Paper; World Bank: Washington, DC, USA, 2006; Volume 25. [Google Scholar]
  56. Channabasamma, A.; Habsur, N.S.; Bangaremma, S.W.; Akshaya, M.C. Effect of nitrogen and sulphur levels and ratios on growth and yield of maize. Mol. Plant Breed. 2013, 4, 292–296. [Google Scholar]
  57. Gransee, A.; Führs, H. Magnesium mobility in soils as a challenge for soil and plant analysis, magnesium fertilization and root uptake under adverse growth conditions. Plant Soil 2013, 368, 5–21. [Google Scholar] [CrossRef]
  58. Walsh, T.; O'Donohoe, T.F. Magnesium deficiency in some crop plants in relation to the level of potassium nutrition. J. Agric. Sci. 2009, 35, 254–263. [Google Scholar] [CrossRef]
  59. Cai, J.; Chen, L.; Qu, H.; Lian, J.; Liu, W.; Hu, Y.; Xu, G. Alteration of nutrient allocation and transporter genes expression in rice under N, P, K, and Mg deficiencies. Acta Physiol. Plant. 2012, 34, 939–946. [Google Scholar] [CrossRef]
  60. Bowen, J.E. Absorption of copper, zinc, and manganese by sugarcane leaf tissue. Plant Physiol. 1969, 44, 255–261. [Google Scholar] [CrossRef] [PubMed]
  61. Okalebo, J.; Simpson, J.; Probert, M. A search for strategies for sustainable dryland cropping in semi-arid Eastern Kenya, Nairobi. In Phosphorus Status of Cropland Soils in the Semi-Arid Areas of Machakos and Kitui Districts, Kenya; Probert, M., Ed.; Australian Centre for International Agricultura1 Research: Nairobi, Kenya, 1990; pp. 50–54. [Google Scholar]
  62. Lordkaew, S.; Dell, B.; Jamjod, S.; Rerkasem, B. Boron deficiency in maize. Plant Soil 2011, 342, 207–220. [Google Scholar] [CrossRef]
  63. Woodruf, J.R.; Moore, F.W.; Musen, H.L. Potassium, boron, nitrogen, and lime effects on corn yield and earleaf nutrient concentrations1. Agron. J. 1987, 79, 520–524. [Google Scholar] [CrossRef]
  64. Kanwal, S.; Rahmatullah; Aziz, T.; Maqsood, M.A.; Abbas, N. Critical ratio of calcium and boron in maize shoot for optimum growth. J. Plant Nutr. 2008, 31, 1535–1542. [Google Scholar] [CrossRef]
  65. Gupta, U.C. Boron nutrition of crops. Adv. Agron. 1980, 31, 273–307. [Google Scholar]
  66. Chatterjee, C.; Sinha, P.; Nautiyal, N.; Agarwala, S.C.; Sharma, C.P. Metabolic changes associated with boron-calcium interaction in maize. Soil Sci. Plant Nutr. 1987, 33, 607–617. [Google Scholar] [CrossRef]
  67. Günes, A.; Alpaslan, M. Boron uptake and toxicity in maize genotypes in relation to boron and phosphorus supply. J. Plant Nutr. 2000, 23, 541–550. [Google Scholar] [CrossRef]
  68. Suri, T. Selection and comparative advantage in technology adoption. Econometrica 2011, 79, 159–209. [Google Scholar]
  69. Koussoubé, E.; Nauges, C. Returns to fertiliser use: Does it pay enough? Some new evidence from sub-Saharan Africa. Eur. Rev. Agric. Econ. 2017, 44, 183–210. [Google Scholar] [CrossRef]
  70. Kihara, J.; Huising, J.; Nziguheba, G.; Waswa, B.S.; Njoroge, S.; Kabambe, V.; Iwuafor, E.; Kibunja, C.; Esilaba, A.O.; Coulibaly, A. Maize response to macronutrients and potential for profitability in sub-Saharan Africa. Nutr. Cycl. Agroecosyst. 2016, 105, 171–181. [Google Scholar] [CrossRef]
  71. Zingore, S. Maize productivity and response to fertilizer use as affected by soil fertility variability, manure application, and cropping system. Better Crops 2011, 95, 4–6. [Google Scholar]
  72. Ngetich, F.K.; Shisanya, C.A.; Mugwe, J.; Mucheru-Muna, M.; Mugendi, D. The potential of organic and inorganic nutrient sources in sub-Saharan African crop farming systems. In Soil Fertility Improvement and Integrated Nutrient Management–A Global Perspective; Intech: Rijeka, Croatia, 2011; p. 135. [Google Scholar]
Figure 1. Distributions of the study sites according to their respective response clusters to the NPK amendments in Bungoma-Southwest and Busia-North regions of western Kenya. C1 = Cluster 1 indicating a site that responded well to all the three amendments (NPK2, NPK3 and NPK4) C2 = Cluster 2 indicating a site that responded well to only NPK3 amendment. C3 = Cluster 3 indicating a site that poorly responded to all the three amendments. NPK2 = N, P, K, Ca, Cu and Zn (inorganic and organic), NPK3 = N, P, K, Ca, Cu and Zn (inorganic), NPK4 = N, P, K, Cu and Zn (inorganic).
Agronomy 08 00049 g001
Figure 2. Actual (bars) and a long-term mean monthly rainfall (dotted lines) for each region. A rainy season indicates a time period between crop planting and harvesting. Long rains start in March and end in July while the short rains spread between September and December. Actual = rainfall data recorded during the study period. Long-term = data acquired from the nearest meteorological station.
Agronomy 08 00049 g002
Figure 3. Variability of maize response to the different fertilizer treatments in Bungoma-Southwest and Busia-North. Control = without fertilizer application, NPK1 = N, P and K (Inorganic), NPK2 = N, P, K, Ca, Cu (Inorganic and Organic), NPK3 = N, P, K, Ca, Cu and Zn (Inorganic), NPK4 = N, P, K, Cu and Zn (Inorganic). Different letters indicate significant differences (p ≤ 0.05) among the treatments while same letters indicate the opposite.
Agronomy 08 00049 g003
Figure 4. Maize response to various N, P and K fertilizer treatments as categorized in different clusters following the K-means clustering criterion. A response is defined by ≥2 t ha1 yield increase above control. Error bars represent standard errors of differences between the means for each cluster. Control = without fertilizer application, NPK1 = N, P and K (Inorganic), NPK2 = N, P, K, Ca, Cu and Zn (Inorganic and Organic), NPK3 = N, P, K, Ca, Cu and Zn (Inorganic), NPK4 = N, P, K, Cu and Zn (Inorganic). Cluster 1 = response to all the three NPK amendments (NPK2, NPK3, NPK4), Cluster 2 = response to only one NPK amendment (NPK3), Cluster 3 = poor responsive response to all three NPK amendments.
Agronomy 08 00049 g004
Figure 5. Classification and regression tree (CART) model showing the effect of soil available P and maize agronomic responses (clusters) on profitability of N, P and K fertilizer use. White boxes are splitting nodes while the VCR means are splitting values. Gray shaded boxes are terminal nodes. NPK1 = standard N, P and K fertilizer, NPK2, NPK3, NPK4 = NPK amendments, Cluster 1 = response to all the three NPK amendments, Cluster 2 = response to only NPK3 amendment and Cluster 3 = poor response to all the three NPK amendments.
Agronomy 08 00049 g005
Table 1. Location and physical characteristics of experimental sites.
Region# SiteSoil TypeElevation (masl)Slope (%)Effective Soil Depth (cm)Textural ClassAvailable P (mg kg−1)Total N (%)Exchangeable K (cmolc kg−1)
Bungoma-Southwest
1Stagnic Luvisols1297>585+Sandy Loam18.470.090.06
2Plinthic Acrisols1300<538Sandy Loam13.980.100.35
3Gleyic Cambisols1364<550Sandy Loam6.990.100.40
4Gleyic Acrisols1287<585+Sandy Loam4.720.070.20
5Ferric Alisols1270<587Sandy Loam3.900.130.13
6Eutric Cambisols1270<5110+Sandy Loam27.480.080.16
7Eutric Cambisols1293<5120Loamy Sand5.040.100.19
8Eutric Cambisols1292<5120Loamy Sand6.990.110.18
9Cambic Arenosols1295<5110Sandy Clay 2.930.060.11
Busia-North
1Eutric Planosols1194<5100+Loam5.310.110.11
2Gleyic Arenosols1219<5100+Loamy sand5.200.070.13
3Gleyic Arenosols1201<570+Loamy sand5.200.050.18
4Gleyic Arenosols1202<570Loamy sand5.200.030.16
5Luvic Arenosols1215<5100+Loamy sand9.430.050.16
6Ferric Cambisols1317590+Loamy sand18.860.050.51
7Plinthic Lixisols1330585Sandy Loam6.020.080.12
8Plinthic Acrisols1270<538Loamy sand2.440.070.51
9Plinithic Acrisols13995130Loamy Sand2.890.030.36
masl = meters above sea level.
Table 2. Fertilizer treatments implemented for rehabilitating poorly responsive soils in western Kenya during the long (LR) and short (SR) rains of 2015.
TreatmentNutrient Added (kg ha−1)
NPKCaZnCuSource
Control------No nutrient added
NPK11003060---Urea, TSP, MOP
NPK21003060160.30.2FYM, Urea, TSP
NPK310030601633Mavuno, Zn and Cu oxides
NPK41003060-33Urea, TSP, MOP, Zn and Cu oxides
TSP = Triple superphosphate, MOP = Muriate of potash, FYM = Farmyard manure, Mavuno = blended fertilizer used to provide N, P, K and Ca for treatment NPK3. NPK1 = N, P and K (inorganic), NPK2 = N, P, K, Ca, Cu and Zn (inorganic and organic), NPK3 = N, P, K, Ca, Cu and Zn (inorganic), NPK4 = N, P, K, Cu and Zn (inorganic).
Table 3. Fertilizer cost for maize grain production during the long and short rains of 2015.
Fertilizer Cost ($ kg −1)
TreatmentLRSRAverage Cost
Control0.000.000.00
NPK11.761.501.63
NPK22.642.312.48
NPK32.241.962.10
NPK42.111.811.96
Control = without fertilizer, NPK1 = N, P and K (inorganic), NPK2 = N, P, K, Ca, Cu and Zn (inorganic and organic), NPK3 = N, P, K, Ca, Cu and Zn (inorganic), NPK4 = N, P, K, Cu and Zn (inorganic), LR = long rains and SR = short rains. Average cost = mean fertilizer cost of the two seasons. During the long rains (LR), a kilo of each nutrient source costed $0.78 (TSP), $0.62 (Urea), $0.77(MOP), $0.75 (Mavuno), $3.8 (Zinc oxide), $14 (Copper oxide) and $0.06 (FYM). For short rains (SR), a kilo of each nutrient source costed $0.63 (TSP), $0.51 (Urea), $0.67 (MOP), $0.67 (Mavuno), $3.4 (Zinc oxide), $12.5 (Copper oxide) and $0.05 (FYM).
Table 4. Maize grain yield as affected by fertilizer application and season for two regions in western Kenya.
Bungoma-SouthwestBusia North
LRSRMean (Site)LRSRMean (Site)Mean (Season and Site)
Treatmentt ha−1
Control2.221.271.752.310.781.551.65
NPK13.582.623.103.241.732.492.79
NPK23.723.243.464.262.313.293.38
NPK34.493.584.043.862.293.083.56
NPK43.823.323.574.182.213.203.38
Mean (Season)3.572.803.183.571.862.722.95
SED Treatment0.13 **
SED Season0.08 **
SED Regionns
SED Treatment × Region0.32 *
SED Season × Region0.29 **
SED Treatment × Seasonns
SED Season × Region × sitens
Control = without fertilizer application, NPK1 = N, P and K (Inorganic), NPK2 = N, P, K, Ca, Cu (Inorganic and Organic), NPK3 = N, P, K, Ca, Cu and Zn (Inorganic), NPK4 = N, P, K, Cu and Zn (Inorganic), LR = long rains, SR = short rains, SED = standard error of difference, * significant at p ≤ 0.05, ** significant at p ≤ 0.01, ns = not significant.
Table 5. Ear leaf nutrients influencing allocation of various sites to specific agronomic response cluster.
Cluster 1Cluster 2Cluster 3
Macronutrient (%)
N2.37 (1.82, 2.91)2.27 (1.82, 2.91)2.32 (2.07, 2.59) a
P0.22 (0.18, 0.26)0.23 (0.18, 0.30) a0.22 (0.18, 0.25)
K1.88 (1.50, 2.17)1.88 (1.54, 2.21) a1.75 (1.56, 1.88)
S0.15 (0.12, 0.17)0.14 (0.11, 0.16) b0.13 (0.11, 0.15) b
Ca0.46 (0.33, 0.61)0.44 (0.34, 0.56)0.48 (0.38, 0.54) a
Mg0.13 (0.09, 0.16)0.11 (0.08, 0.14) b0.12 (0.10, 0.15) b
Micronutrient (mg kg−1)
B4.90 (3.86, 6.85)4.93 (3.86, 6.85)4.51 (3.85, 5.01) b
Cu9.19 (6.68, 13.23)8.11 (5.97, 10.39) b7.86 (5.86, 9.98) b
Zn15.91 (12.35, 20.52)16.22 (13.28, 20.58) a15.67 (12.95, 17.94).
Numbers are mean nutrient contents with the corresponding minimum and maximum values in brackets to indicate the range. Based on multinomial logit analysis, letter ‘a’ indicates that the corresponding nutrient content should be decreased, while letter ‘b’ show those that should be increased in order to move a site from clusters 2 and 3 to Cluster 1. Cluster 1 = response to all the three NPK amendments, Cluster 2 = response to one of three NPK amendments and Cluster 3 = poor response to all the three NPK amendments.
Table 6. Selected soil characteristics of the derived maize response clusters.
UnitsCluster 1Cluster 2Cluster 3
pH (H2O) 5.59 (5.15, 6.01)5.69 (5.50, 6.06)5.56 (5.30, 5.90)
Available Pmg kg−16.45 (2.44, 18.37)6.91 (2.93, 13.98) *17.18 (5.20, 27.48) *
Total N%0.09 (0.03, 0.13)0.07 (0.05, 0.10)0.05 (0.03, 0.08)
Organic C %0.80 (0.04, 1.72)0.95 (0.50, 1.60)1.02 (0.48, 1.98)
Effective CECcmolc kg−14.10 (-0.37, 8.53)3.52 (1.31, 7.19)1.42 (-0.49, 3.07)
Exch. Kcmolc kg−10.23 (0.06, 0.51)0.19 (0.11, 0.35) 0.28 (0.16, 0.51)
Exch. Cacmolc kg−12.80 (0.81, 5.75)2.43 (1.43, 3,7)1.61 (0.77, 2.36)
Exch. Mgcmolc kg−10.58 (0.14, 1.25)0. 74 (0.26, 1.72)0.49 (0.13, 0.88)
Sand%71 (46, 87)71. (52, 83)82 (79, 85)
Clay%11 (4, 21)13 (3, 37)7 (3, 12)
Numbers are means with minimum and maximum values in brackets. * significant at p ≤ 0.05. All others are not significant. Cluster 1 = response to all the three NPK amendments, Cluster 2 = response to one of three NPK amendments and Cluster 3 = poor response to all the three NPK amendments.
Table 7. Correlation of soil available P and ear leaf nutrients influencing allocation of sites to clusters, 2 and 3.
Soil Available P
Ear Leaf NutrientCluster 2Cluster 3
N0.390.59 *
P0.79 ***0.19
K0.57 **−0.08
S0.56 **−0.39
Ca−0.060.62 *
Mg−0.01−0.01
B0.25−0.32
Cu0.160.91 ***
Zn0.230.07
Numbers are correlation coefficients, * significant at p ≤ 0.05, ** significant at p ≤ 0.01, *** significant at p ≤ 0.001. All others are not significant. Cluster 2 = response to one of three NPK amendments and Cluster 3 = poor response to all the three NPK amendments.

