Assessment of Genetic Diversity in Opuntia spp. Portuguese Populations Using SSR Molecular Markers


1
Instituto Politécnico de Castelo Branco, Escola Superior Agrária, 6001-909 Castelo Branco, Portugal
2
Centro de Biotecnologia de Plantas da Beira Interior, Escola Superior Agrária de Castelo Branco, 6001-909 Castelo Branco, Portugal
3
Centro de Recursos Naturais, Ambiente e Sociedade (CERNAS-IPCB), Bencanta, 3045-601 Coimbra, Portugal
4
Forest Research Centre, School of Agriculture, University of Lisbon, Tapada da Ajuda, 1349-017 Lisbon, Portugal
*
Author to whom correspondence should be addressed.
Agronomy 2018, 8(4), 55; https://0-doi-org.brum.beds.ac.uk/10.3390/agronomy8040055
Submission received: 27 March 2018
/
Revised: 13 April 2018
/
Accepted: 16 April 2018
/
Published: 20 April 2018
Abstract
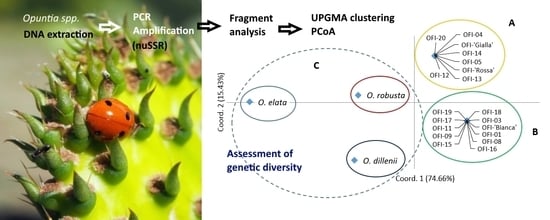
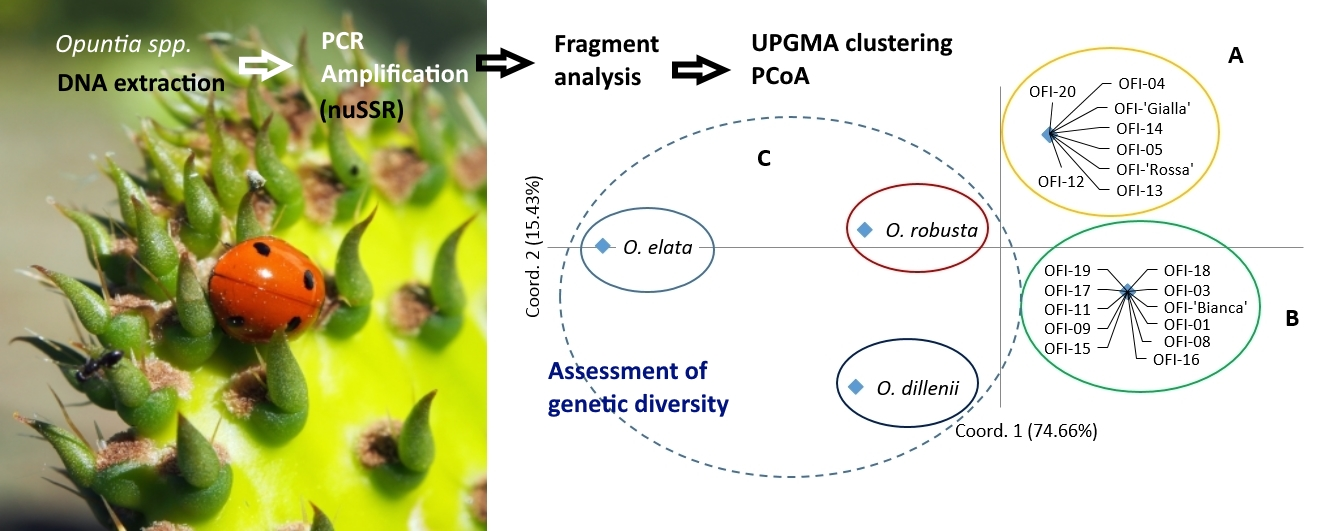
:The Opuntia spp., most likely few individuals, were introduced in the Iberian Peninsula in the beginning of the 16th century, after the discovery of America, spreading afterwards throughout the Mediterranean basin. We analysed, for the first time, the genetic diversity in a set of 19 Portuguese Opuntia spp. populations from the species O. ficus-indica, O. elata, O. dillenii and O. robusta using nuclear microsatellite (nuSSR) markers. The Italian cultivars ‘Bianca’, ‘Gialla’ and ‘Rossa’ were included in the study for comparison purposes. The nuSSR amplifications produced from five to 16 alleles, with an average of 9.2 alleles per primer pair, and average polymorphism information content of 0.71. The estimated Dice coefficient among populations varied from 0.26 to 1.0, indicating high interspecific genetic diversity but low genetic diversity at the intraspecific level. The hierarchical clustering analysis revealed four major groups that clearly separated the four Opuntia species. Among the O. ficus-indica populations, two sub-clusters were found, one including the white pulp fruits (with cv. Bianca) and the other with the orange pulp ones and including the cv. Gialla, the cv. Rossa, and one pale yellow pulp population. No genetic differences were found between the inermis form, O. ficus-indica f. ficus-indica, and the rewilded spiny one, O. ficus-indica f. amyclaea. The dendrogram indicated that the clustering pattern was unrelated to geographical origin. The results revealed a low level of genetic diversity among the Portuguese populations of O. ficus-indica.
1. Introduction
The genus Opuntia is in the family Cactaceae (subfamily Opuntioideae, tribe Opuntieae). The most widespread and economically important species is Opuntia ficus-indica (L.) Miller (OFI), with the domestication centre localised in central Mexico [1]. The genus Opuntia (Cactaceae) was likely introduced in the Iberian Peninsula after the discovery of the Americas between the end of the 15th and beginning of the 16th centuries, later spreading throughout the Mediterranean basin [2,3]. The Opuntia spp. has minimal soil and water requirements, and the O. ficus-indica, in particular is sought to be an alternative for the Mediterranean region agricultural economy. In this region, the high temperatures and the lack of rain during summer, together with decreasing temperatures in autumn limited the multiplication from seed and favoured the asexual reproduction of O. ficus-indica species [4]. Portugal has the following Opuntia species: O. ficus-indica (L.) Miller, O. dillenii (Ker-Gawler) Haw, O. robusta Wendl and O. elata Link & Otto ex Salm-Dick. Opuntia ficus-indica has two forms, the inermis, typical form, O. ficus-indica f. ficus-indica (L.) Miller, and the rewilded spiny one, O. ficus-indica f. amyclaea (Ten.) Schelle.
Plant genetic resources play an important role in the improvement of wild and cultivated plants. Among the molecular markers, microsatellites are widely used in germplasm diversity evaluation, phylogenetic and evolutionary studies and genome mapping [5]. The Cactaceae present some peculiarities regarding molecular marker studies. Firstly, the high amounts of polysaccharides and secondary metabolites in cacti makes DNA isolation notoriously difficult [6,7]. Additionally, these contaminants inhibit the action of restriction enzymes and Taq polymerases [8]. Secondly, polyploidy is a usual situation throughout the tribe Opuntieae, which presents some drawbacks in the analysis of codominant markers, such as microsatellites (SSR). Diploids (2n = 2x = 22) are uncommon in this tribe according the reported chromosome counts [9]. Polyploid taxa within Opuntia spp. range from triploid (2n = 3x = 33) to octoploid (2n = 8x = 88), and many species have multiple ploidy levels [9,10]. The ploidy level of the studied species is unclear, since the information from the literature lacks concordance, particularly in the case of O. dillenii (2n = 12, 22, 26, 36, 40, 44, 66), O. elata (2n = 22, 44) and O. robusta (2n = 22, 44, 66, 88) [9]. The ploidy level of cultivated O. ficus-indica populations is 2n = 88 [11,12]. However, penta, hexa, hepta and diploid levels were also reported in this species, depending on the population origin [9].
Until now, few studies have been conducted to identify genomic microsatellites and to develop markers in Opuntia spp. Helsen et al. [13] developed 16 SSR markers from O. echios, and Erre et al. [14] obtained ten SSR markers from O. ficus-indica. Helsen et al. [15] used the SSRs markers previously obtained to distinguish between two morphologically distinct O. echios botanical varieties (echios and gigantea). The level of intraspecific genetic diversity among O. ficus-indica cultivated varieties and some related species from Mexico and the Mediterranean region, was investigated by Caruso et al. [16] using the same set of primers. Samah et al. [17] used 13 SSR molecular markers previously developed [13,14] to study the genetic diversity of Mexican Opuntia germplasm with agronomic and economic importance.
To our knowledge, no molecular-based studies have been conducted with Portuguese populations of Opuntia spp., and therefore, the genetic diversity and the populations’ structure are unknown. The objectives of this study were to (i) evaluate the genetic relationships among populations of different Opuntia species; (ii) assess the molecular diversity of Portuguese O. ficus-indica populations; and (iii) compare their relationships with three improved O. ficus-indica Italian cultivars.
2. Materials and Methods
2.1. Plant Material and DNA Extraction
The accessions studied were from four Opuntia species, O. ficus-indica, O. elata, O. dillenii, and O. robusta, collected from several places throughout Portugal and established in a provenance trial at the Escola Superior Agrária de Castelo Branco (ESACB) (Table 1). A total of 19 populations each containing 15 individuals were analysed. The Italian cultivars ‘Bianca’, ‘Gialla’ and ‘Rossa’ were used for comparison purposes, composed by 15 genotypes each cultivar.
The DNA was extracted from fifteen plants in each population from a 100 mg of freshly sampled chlorenchyma tissue. The DNeasy® Plant Mini Kit (Qiagen, Hilden, Germany) was used in the DNA extraction with slight modifications, namely in the incubation time and in the centrifugation speed, duration, and intensity. For samples with high content of mucilage (samples from O. elata and O. dillenii), a lysis process with CTAB and SDS and the combination of this improved lysis with the DNeasy® Plant Mini Kit were used. The lysis buffer supplied with the DNeasy® Plant Mini Kit was replaced with 700 µL of CTAB lysis buffer, 50 μL of 0.2 M SDS and 4 µL of RNase A. A step to remove proteins was performed by adding chloroform:isoamyl alcohol (24:1), with an extra centrifugation at 10,000 rpm for 10 min, conducted after the kit buffer was used for this purpose (Buffer AP2). Afterwards, the lysate was pipetted into a QIAshredder spin column placed in a 2 mL collection tube, and the remaining steps of the standard protocol of the kit were followed.
The extraction products were dissolved in 75 µL of TE buffer to maximise overall DNA yield. DNA yield was determined by spectrophotometry (mySPEC VWR®), whereas DNA purity was estimated according the A260/A280 ratio. DNA was also quantified by visual comparison with lambda DNA samples on GreenSafe premium (Nzytech, Lisbon, Portugal) stained agarose 0.8% gels and documented with the Micro Doc gel documentation system (Cleaver Scientific, Warwickshire, UK).
2.2. Microsatellite Genotyping
The genomic DNA was amplified using fifteen nuclear microsatellite (nuSSR) markers selected from two primer sets, the OPUNTIA [13] and the OPUFIC [14] developed for the species O. echios and O. ficus-indica, respectively, as previously referred (Table S1). The fifteen nuSSRs were previously tested in ten populations (OFI-01, OFI-04, OFI-08, OFI-12, OFI cv. Bianca, OFI cv. Gialla, OFI-cv. Rossa, O. dillenii, O. elata and O. robusta, Table 1) collected from the four-studied species, with the aim of searching for polymorphisms and understand the allelic patterns at each locus.
The amplifications with the OPUNTIA set of primers were conducted in 10 µL of total reaction volume containing 5–15 ng of genomic DNA, 1 U Supreme NZYTaq 2× Colourless Master Mix® separate MgCl2 (Nzytech), 2 mM MgCl2, and 0.2 μM of each primer (Table S1). The amplifications were performed on a UNO96 Gradient thermocycler (VWR®) programmed with an initial denaturation step of 10 min at 95 °C, followed by 35 amplification cycles composed of denaturation (1 min at 95 °C), annealing (1 min at optimal annealing temperature for each pair, see Table S1) and polymerising (1 min at 72 °C). A final extension step was conducted for 10 min at 72 °C, after the amplification cycles.
The OPUFIC amplifications were conducted in a total reaction volume of 10 µL containing 5–15 ng of genomic DNA, 0.8 U Supreme NZYTaq 2× Colourless Master Mix® separate MgCl2 (Nzytech), 2 mM MgCl2, and 0.2 μM of each primer. The amplifications were performed in the same thermocycler programmed with an initial denaturation step for 10 min at 95 °C, followed by 35 amplification cycles composed of denaturation (30 s at 95 °C), annealing (30 s at optimal annealing temperature for each pair, see Table S1) and polymerising (30 s at 72 °C). After the amplification cycles, a final extension step was conducted for 10 min at 72 °C.
The forward primers were 6-FAM fluorescently labelled, and amplifications were conducted separately for each primer pair. An aliquot of 1.0 µL of PCR product of each primer pair was mixed with 10 µL of formamide and 0.2 µL of ROX-500 size standard. Genotyping was performed with an ABI 3730xl DNA Analyser (Applied Biosystems, Foster City, CA, USA), and the fragment analysis was performed using Gene-Marker® 1.5 Software (SoftGenetics, State College, PA, USA) and the data manually scored.
2.3. Data Analyses
Despite the microsatellite codominance, we followed the approach previously used in polyploids [16,18] and the SSR peaks were scored as dominant loci to circumvent the polyploidy and to obtain the data for conventional analysis software. Hence, the pattern of SSR peaks observed at each locus was recorded as a qualitative character for the presence (1) or absence (0) and a binary matrix was created.
The number of alleles and number of rare alleles (alleles with a frequency less than 5%) were calculated for each locus. The primer discriminatory power was evaluated by the polymorphic information content (PIC) and marker index (MI). The PIC was calculated according to:
where Pi and Pj are the population frequency of the ith and jth allele, respectively. The marker index was calculated as , and the effective multiplex ratio (EMR) was calculated as:
where np is the number of polymorphic loci, and n is the total loci number.
A matrix to evaluate pairwise genetic similarity between accessions was calculated based on the Dice similarity coefficient, which is a band-sharing-based method, using the SIMQUAL NTSYS-pc Version 2.21q subprogram [19]. The cluster analysis was performed using the unweighted pair group arithmetic mean method (UPGMA) in the SAHN NTSYSpc subprogram. The UPGMA tree topology was verified by comparing the original genetic distance matrix with the cophenetic matrixes obtained from the corresponding dendrograms using the Mantel matrix-correspondence test [20] and bootstrap analysis with 1000 permutations.
The Nei’s genetic distance matrix obtained with the AFLP-SURV 1.0 software [21] was used to perform a Principal Coordinate Analysis (PCoA) using the GenAlEx 6.501 software [22,23], and the first two principal coordinates were plotted to indicate the multilateral genetic relationships between them.
The genetic structure was further explored with a hierarchical analysis of molecular variance (AMOVA) [24] using the Arlequin 3.5 software [25]. The groups were defined based on the PCoA clustering. Variance components and Φ statistics were estimated for each locus and then combined to produce a synthetic estimator of the among groups differentiation, the Φct statistic. The significance values were computed by a permutation test from 1000 permuted matrices.
3. Results
3.1. Microsatellite Genotyping
We have tested 10 populations from the four-studied species with 15 SSR primer pairs, and we discarded the 9 OPUFIC primer pairs because the information obtained was redundant compared with the OPUNTIA primers, providing no additional information about the genotyped individuals. The 6 OPUNTIA primers gave reliable, readable, and reproducible profiles and therefore were used to study the genetic variability and to obtain the DNA fingerprint of the 22 Opuntia spp. populations. In each studied population, the 15 individuals genotyped had the same SSR profile for each of the 6 pairs of primers and no genetic variation was detected within populations.
A total of 55 alleles were detected among the populations studied, ranging from 6 (OA3) to 16 (OA12), with a mean of 9.2 alleles per marker (Table 2). Twenty-four were rare alleles, representing 43.6% of the total full set of alleles.
3.2. Genetic Relationships and Diversity Patterns
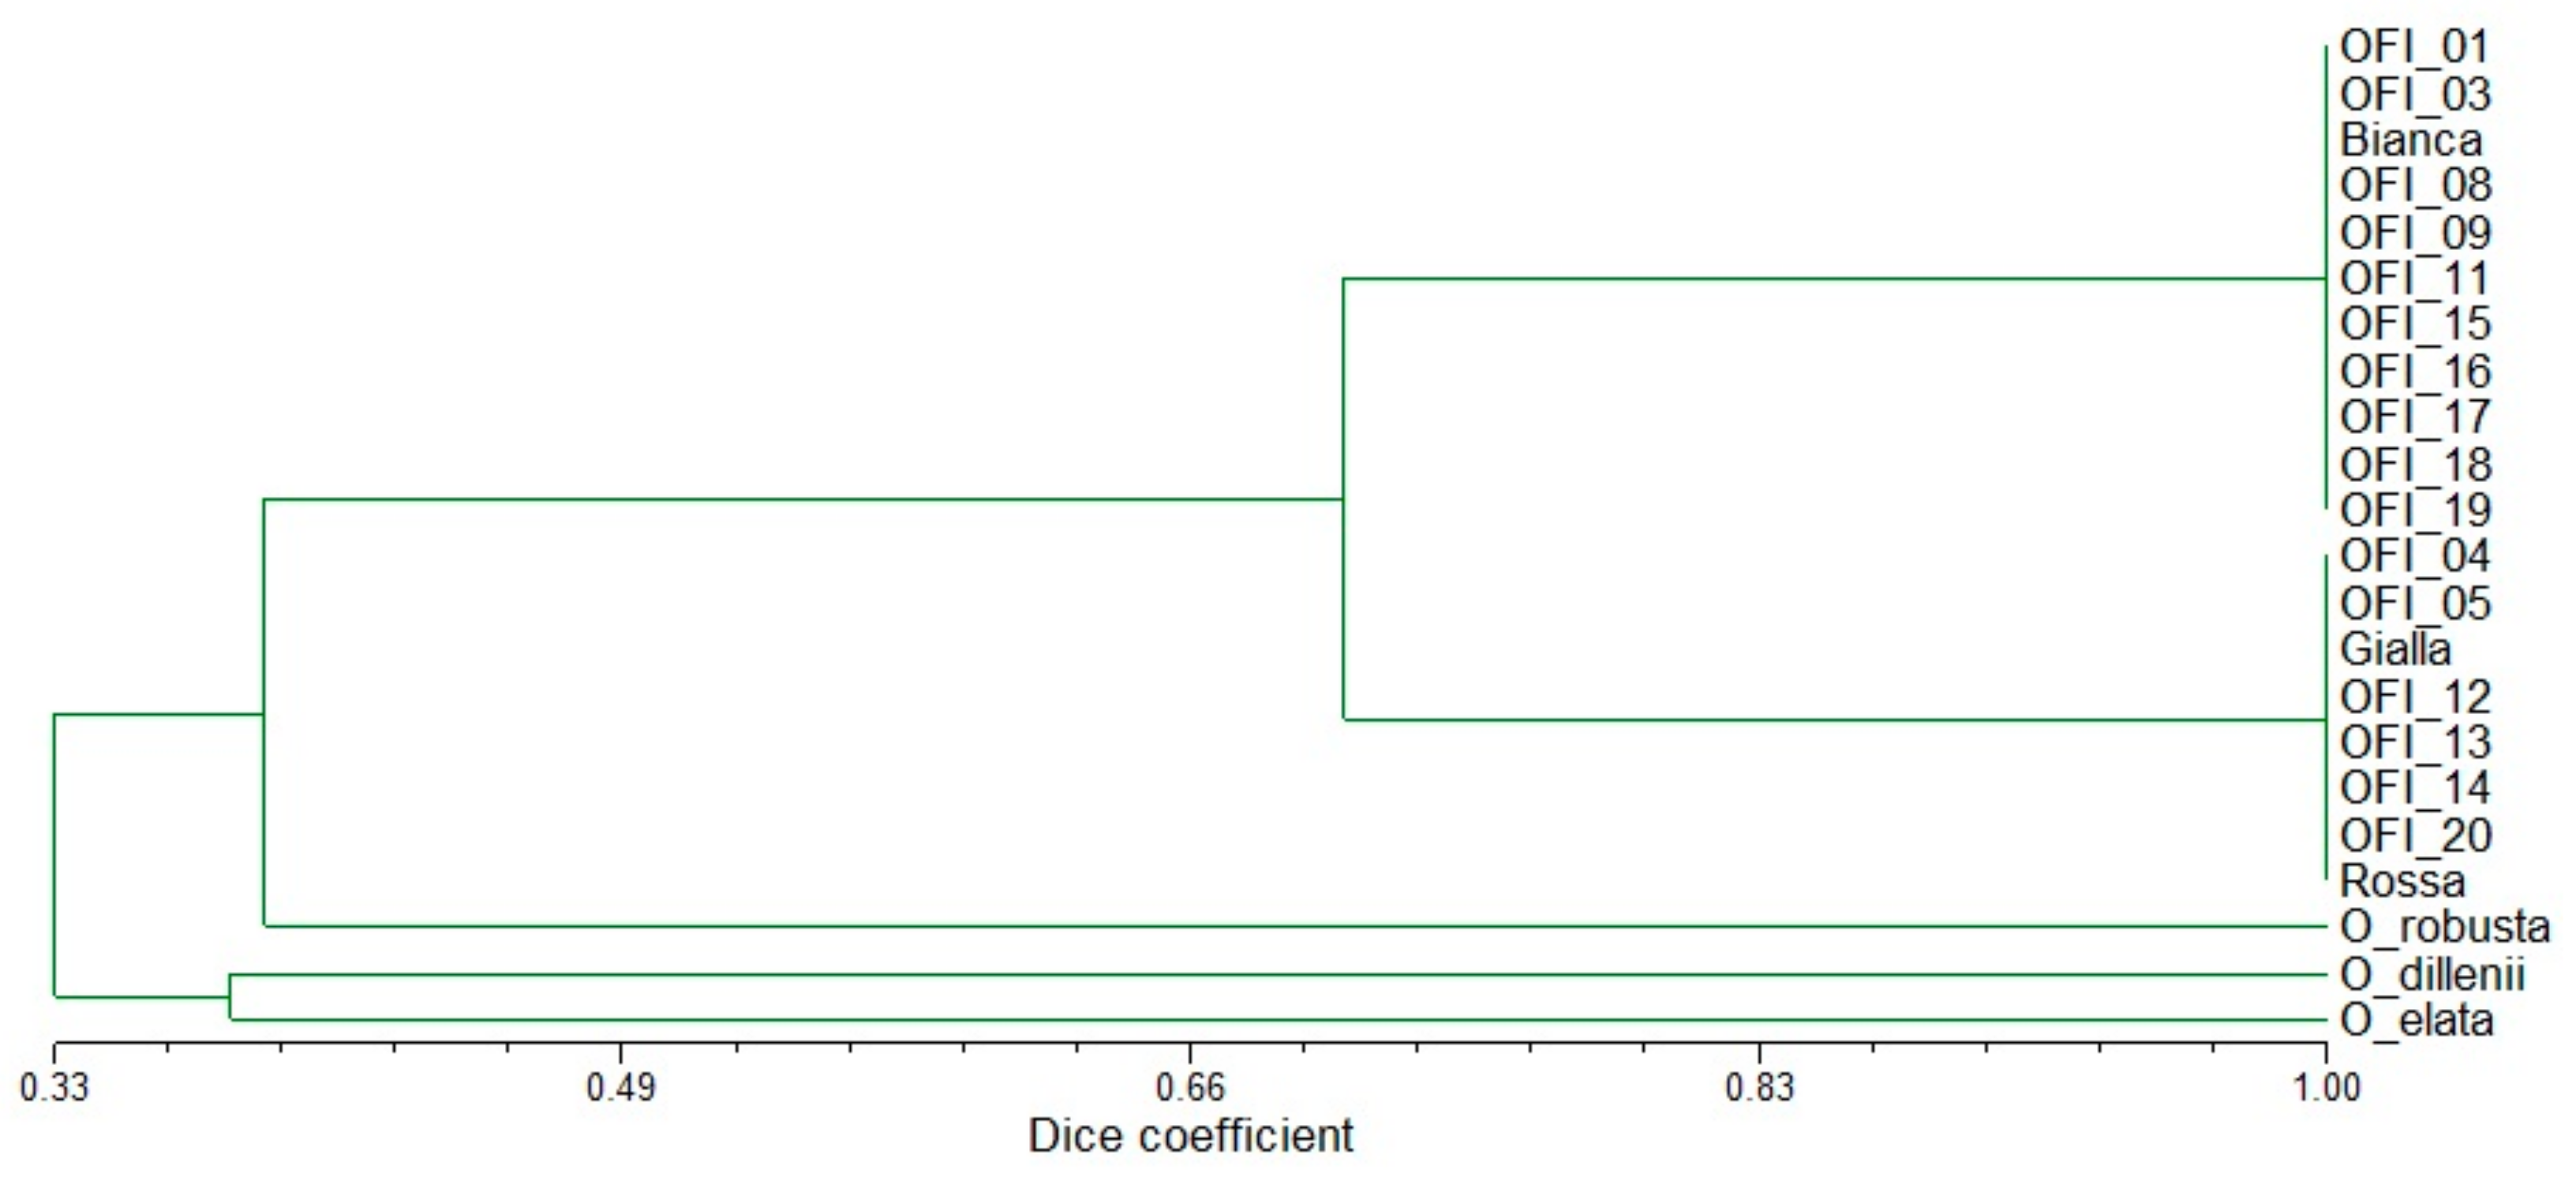
A genetic similarity matrix based on the Dice coefficient was obtained with the microsatellite data (Table S2). This matrix was used to group all accessions using UPGMA. The tree topology tested with a Mantel test showed a very high correlation (r = 0.995; P < 0.001). The estimated Dice coefficient among populations varied from 0.255 (the most distant accessions were O. elata and the set of white pulp OFI populations) to 1.0 (the white pulp OFI populations were similar to one another, as well as the orange pulp OFI populations), indicating high interspecific genetic diversity but low genetic diversity at the intraspecific level (Table S2). These relationships were supported by the cluster analysis (Figure 1).
The hierarchical clustering analysis revealed four major clusters, and the four Opuntia species were clearly separated from one another (Figure 1). Three branches included the accessions representing each of the species O. dillenii, O. elata and O. robusta. The fourth and larger group included the O. ficus-indica populations and cultivars. Among the O. ficus-indica populations only two sub-clusters were found: one contained the white pulp fruits (including cv. Bianca) and the population OFI-01 (which corresponded to the spinescent form amyclaea), and the other contained the orange pulp fruits (including cv. Gialla), the cv. Rossa, and one population with pale yellow pulp (OFI-04) (Figure 1). The distribution of genotypes in the dendrogram indicated that the clustering pattern was unrelated to geographical origin.
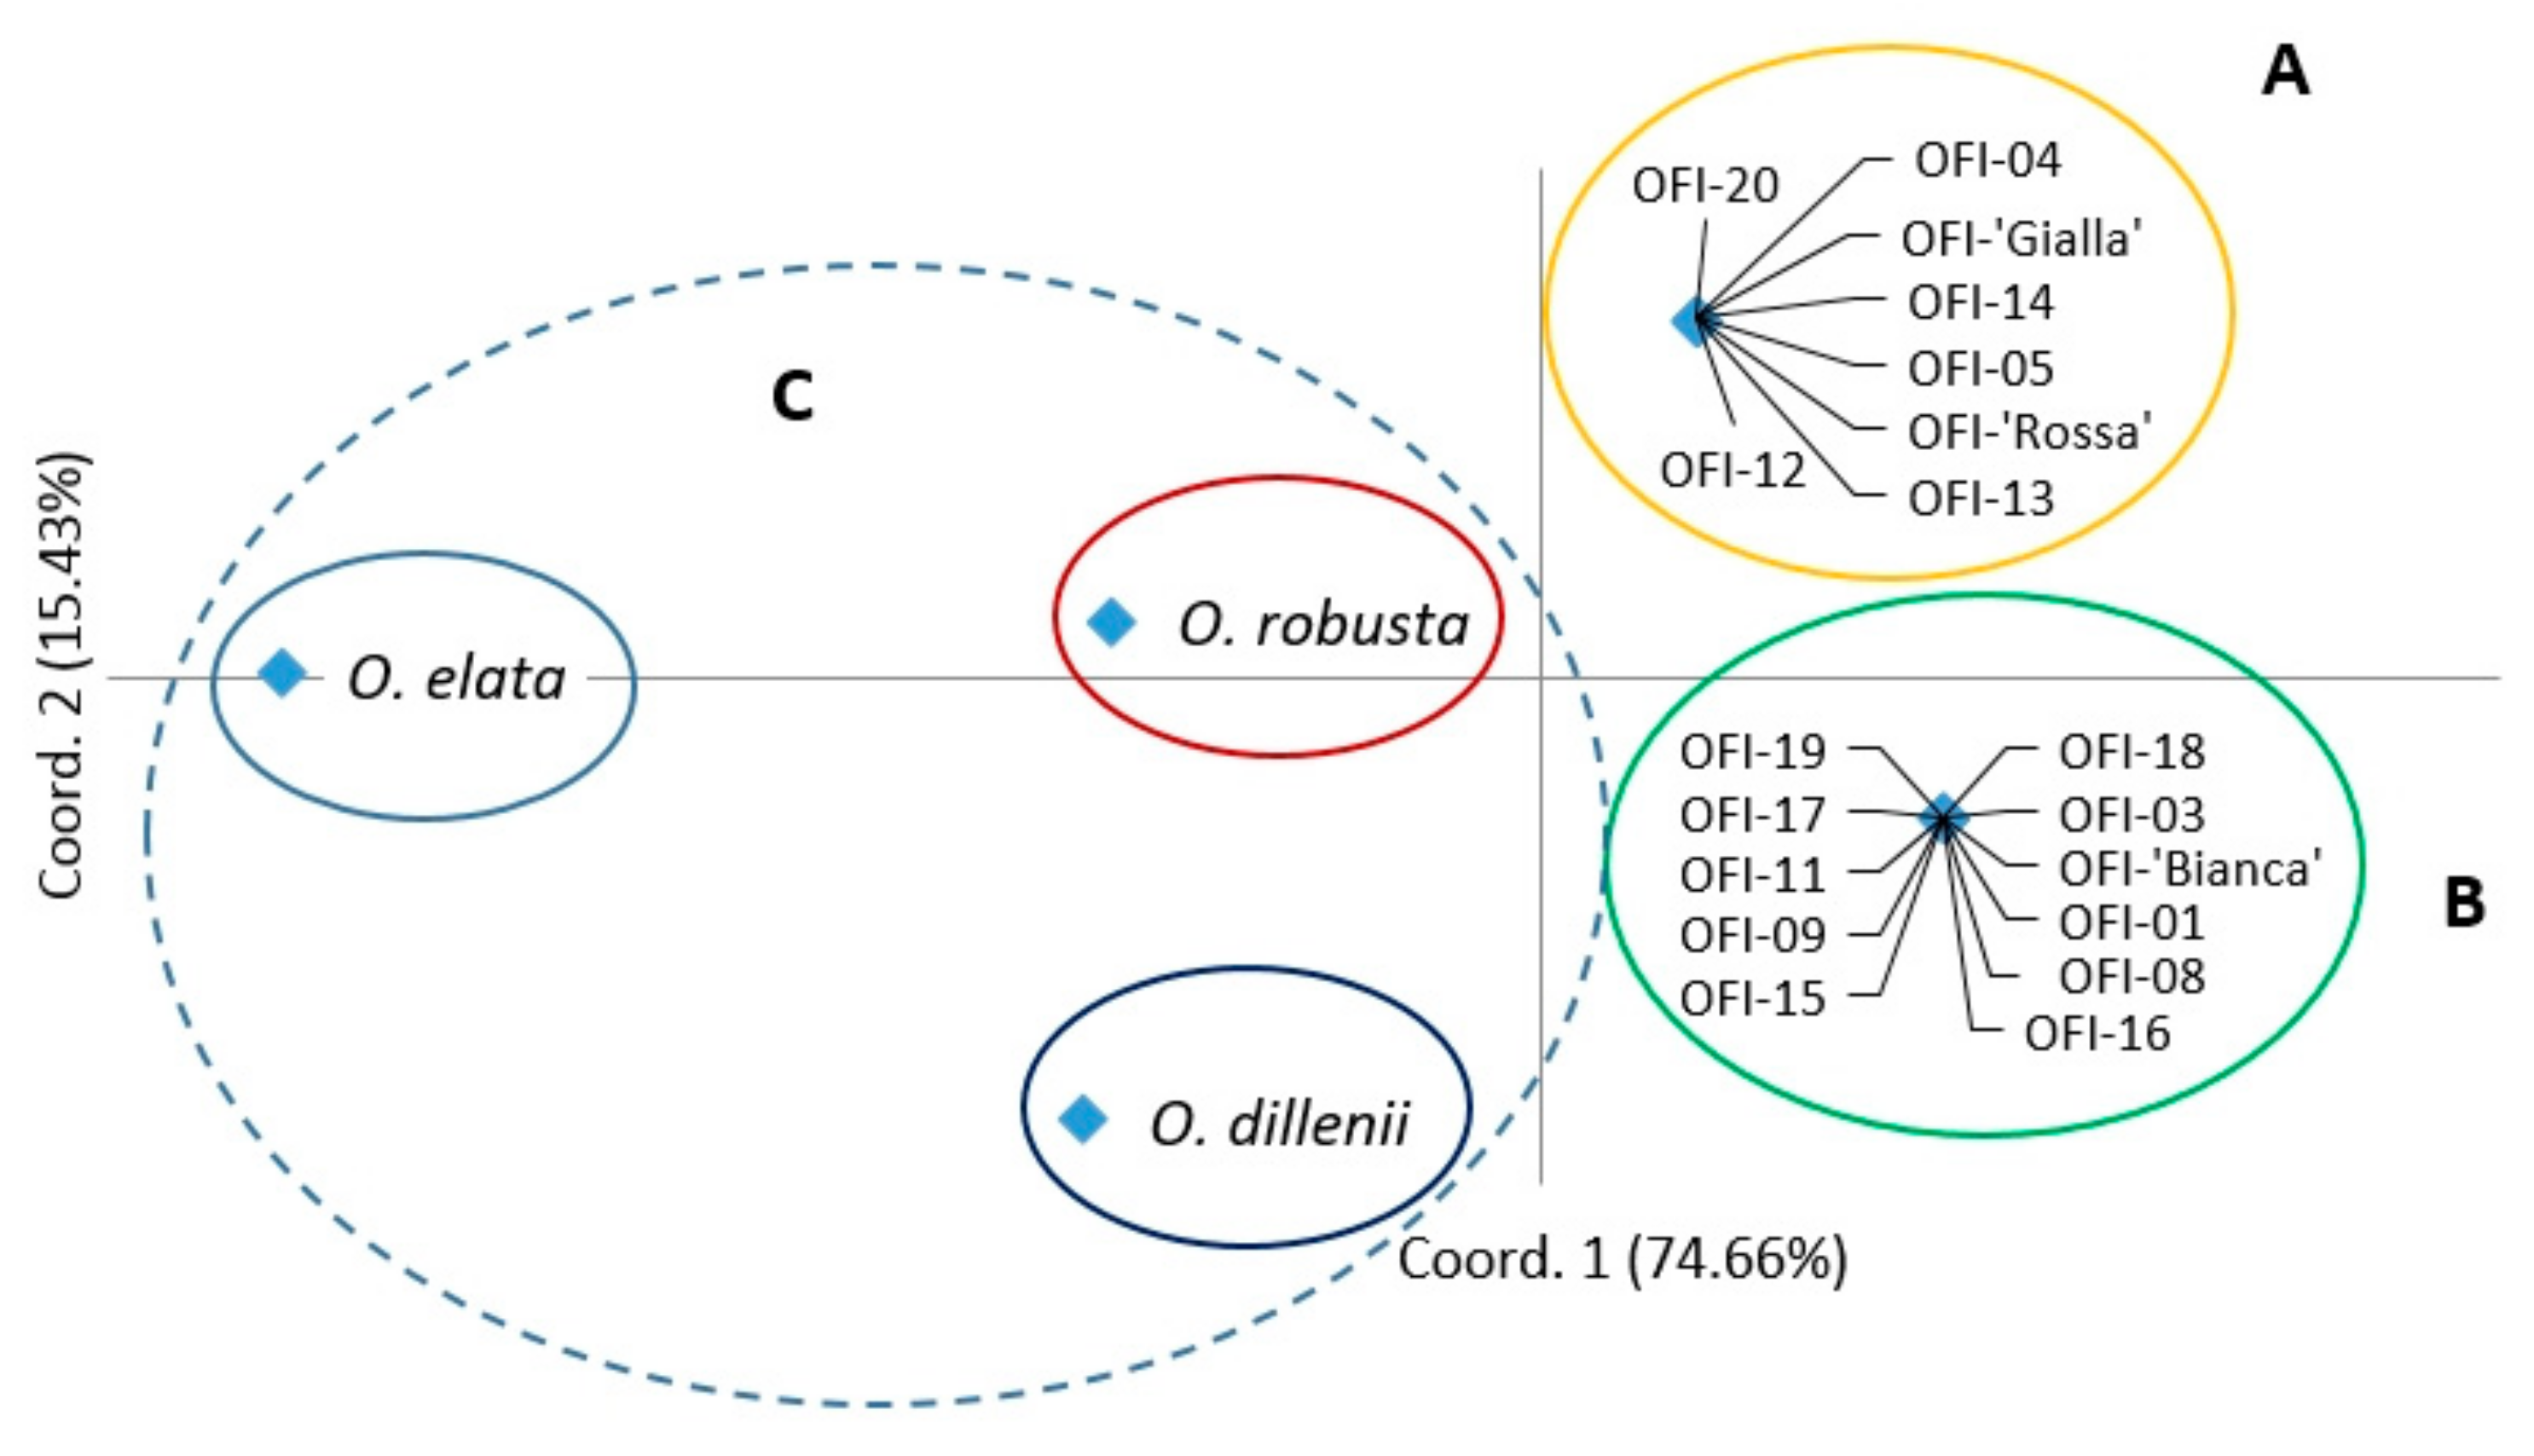
In the two-dimensional PCoA plot, the Opuntia spp. populations were divided into five groups, similar to the UPGMA dendrogram pattern (Figure 2). The first and second principal axes explained 74.66% and 15.43% of the total molecular variation observed, respectively. The species O. elata and O. robusta were separated from the other species on axis 1, and O. dillenii was separated from the other species on axis 2 (Figure 2). The O. ficus-indica populations were distributed into two groups, which corresponded to the two sub-clusters obtained in the hierarchical clustering analysis.
With the hierarchical AMOVA, we estimated the variance components and genetic variation among accessions within groups and among groups. In this test, the hierarchy was based on the three groups defined with the PCoA. The first (A) and second group (B) included the O. ficus-indica populations, and the third group (C) contained the three unique populations of the species O. dillenii, O. elata, and O. robusta (Figure 2). The AMOVA specified that 87% of the genetic differentiation was found among groups (P < 0.0001; Φct = 0.87; Table S3). However, the variation was low among populations within groups, and no variation occurred within populations.
4. Discussion
The genetic diversity of 19 Portuguese Opuntia spp. populations and three Italian cultivars was assessed using the 6 SSR markers designed from the Galapagos O. echios [13] and tested by in another Opuntia species. A unique microsatellite pattern was found for the different species studied, though clearly discriminating at the species level. Among the O. ficus-indica populations, two sub-clusters were identified, one including the white pulp fruits (with cv. Bianca) and the other with the orange pulp fruits, including the cv. Gialla, the cv. Rossa, and one pale yellow pulp population (OFI-04). However, at the intrapopulation level, the microsatellite pattern over loci was the same, and the individuals could not be distinguished, suggesting that they could be recent vegetative clones. The results revealed a low level of genetic diversity among the Portuguese populations of O. ficus-indica and the Italian cultivars.
The spinescent O. ficus-indica f. amyclaea (OFI-01) had the same microsatellite fingerprint as that of the O. ficus-indica f. ficus-indica spineless populations, and the clustering did not reflect the spinescence character. Caruso et al. [16] reached similar conclusions in a previous study of the level of intraspecific genetic diversity among O. ficus-indica cultivated varieties and some related species. These authors obtained results from a cluster analysis that clearly diverge from the current taxonomy, which classifies several Opuntia species based on morphological parameters such as the presence/absence of spines.
The markers used in this study are putatively neutral and they are unable to reflect morphological characteristics, which are influenced by the environment and are under selection, because they are products of transcription or translation, although they can provide estimates about genetic diversity [26].
This study represents the first report on the population structure and genetic diversity of Portuguese Opuntia populations accessed by SSR markers. The results obtained with the six SSR markers revealed a narrow genetic base of diversity among the O. ficus-indica accessions. Our results are consistent with previous studies; generally, high levels of diversity are found among the Mexican cultivated genotypes, whereas most of the spineless accessions collected in other countries, primarily in the Mediterranean region, have a very narrow genetic base [16]. Similarly, using microsatellites, lower genetic diversity was found in the Portuguese landrace of the species Eucalyptus globulus Labill., introduced during the 19th century, than that found in the native species [27].
In the Mediterranean Basin, some Opuntia spp. (primarily O. ficus-indica Mill.) were introduced five centuries ago from their areas of origin, and the cactus pear was so well-suited to the environmental conditions that they rapidly became naturalised. However, on the Iberian Peninsula, O. ficus-indica rarely expands by seed germination because of thermal and hygrometric conditions, which are seldom optimal for reproduction [4,28]. Although the occurrence of apomixis is possible in O. ficus-indica [29], the absence of intrapopulation variability that we found supports the predominance of asexual propagation and the absence of natural multiplication by seed germination.
Opuntia ficus-indica areas of occurrence are related to human activity and its propagation is maintained by asexual reproduction [28]. Opuntia ficus-indica is found on roadsides and paths due to typical ruderal behaviour and is cultivated for edible fruit production and hedge establishment. In some areas, the cactus is abundant in places with steep slopes on which the cladodes break off and easily root, forming conspicuous patches [30]. In the Mediterranean region, naturalised populations of Opuntia spp. show a lower genetic heterogeneity than that of the areas of origin. The occurrence of cleistogamy and polyembryony, in addition to absence of precipitation during summer and decreasing temperatures in autumn, are barriers to seed germination, and as a result the extend of genetic variability is limited [31].
The selected primers successfully amplified fragments all the genotypes, due, probably, to the high degree of cross-transferability among the studied species. Known primers are not likely to amplify the same locus across related taxa unless the flanking regions in which priming sites are located are highly conserved [32], which typically occurs in closely related species [33]. Similarly, a high degree of cross-transferability among various species of the genus Opuntia was showed by Samah et al. [17] with the set of primers developed for O. echios [13] and O. ficus-indica [14]. This could be explained by the rapid and recent burst of diversification of extant species may have occurred in the genus Opuntia, resulting in a poorly resolved phylogeny, similarly to the speciation in the genus Inga (Fabaceae), a classic example of a recent radiation [34].
The genetic diversity within the Portuguese population was inexistent, in accordance with the results from another study [35] were phenotypic variability is also absent in plant robustness, form of the cladodes, the spines occurrence and span, corolla dye, flesh colour and time for fruit maturity.
5. Conclusions
Climate change is expected to affect deeply the Mediterranean region in the near future. The cactus pear due to its morphological and physiological characteristics has minimal soil and water requirements and represents an alternative for the Mediterranean region agricultural economy by make important food-security contributions for people and livestock.
The molecular characterisation of populations could assist plant breeders with a better knowledge of the existing genetic variability. The collection, characterisation and evaluation of Opuntia spp. germplasm from native and naturalised populations, together with plant breeding efforts, are required to develop new cultivars both for fodder and fruit production.
In this study nuSSR markers revealed a low level of intraspecific genetic diversity among Portuguese O. ficus-indica populations. However, genetic variability in plants is essential for genetic improvement by providing options for the breeders to develop new cultivars. Therefore, the introduction of germplasm and landraces from the centre of origin and domestication, in addition to selected spineless genotypes from other regions, are required to increase the genetic variability of the Portuguese O. ficus-indica populations.
Supplementary Materials
The following are available online at https://0-www-mdpi-com.brum.beds.ac.uk/2073-4395/8/4/55/s1, Table S1: Marker code, primer sequences, repeat unit, and annealing temperature of the six OPUNTIA and the nine OPUFIC primers used in this study, Table S2: Dice similarity coefficient for Opuntia spp. populations, Table S3: Analysis of molecular variance (AMOVA) of the Opuntia spp. accessions, considering the entire data set clustered in three groups (A, B and C), according to the PCoA analysis. SS = sum of squared deviation; df = degrees of freedom; and P = level of probability of obtaining a more extreme component estimate by chance alone.
Acknowledgments
We acknowledge the CERNAS-IPCB and the Forest Research Centre that are funded by Foundation for Science and Technology (Portugal) with the grants UID/AMB/00681/2013 and UID/AGR/00239/2013, respectively. The Foundation for Science and Technology (Portugal) SFRH/BSAB/113895/2015 scholarship funded MMR.
Author Contributions
Carlos M.G. Reis and Maria Margarida Ribeiro conceived and designed the experiments and accomplished the data analysis; Carlos M.G. Reis and Joana Raimundo performed the experiment; Carlos M.G. Reis wrote the manuscript. Maria Margarida Ribeiro supervised the research work and reviewed the manuscript.
Conflicts of Interest
The authors declare no conflict of interest.
References
- Griffith, M.P. The origins of an important cactus crop, Opuntia ficus-indica (Cactaceae): New molecular evidence. Am. J. Bot. 2004, 91, 1915–1921. [Google Scholar] [CrossRef] [PubMed]
- Barbera, G.; Carimi, F.; Inglese, P. Past and present role of the Indian-fig prickly-pear (Opuntia ficus-indica (L.) Miller, Cactaceae) in the Agriculture of Sicily. Econ. Bot. 1992, 46, 10–20. [Google Scholar] [CrossRef]
- Anderson, E. The Cactus Family; Timber Press: Portland, OR, USA, 2001; p. 776. [Google Scholar]
- Nieddu, G.; Chessa, I. Distribution of phenotipic characters within a seedling population from Opuntia ficus-indica (cv. “Gialla”). Acta Hortic. 1997, 438, 37–40. [Google Scholar] [CrossRef]
- Kalia, R.K.; Rai, M.K.; Kalia, S.; Singh, R.; Dhawan, A.K. Microsatellite markers: An overview of the recent progress in plants. Euphytica 2011, 177, 309–334. [Google Scholar] [CrossRef]
- De Cruz, M.; Ramirez, F.; Hernandez, H. DNA isolation and amplification from cacti. Plant Mol. Biol. Report. 1997, 15, 319–325. [Google Scholar] [CrossRef]
- Mondragon-Jacobo, C.; Doudareva, N.; Bordelon, B.P. DNA extraction from several cacti. HortScience 2000, 35, 1124–1126. [Google Scholar]
- Pandey, R.N.; Adams, R.P.; Flournoy, L.E. Inhibition of random amplified polymorphic DNAs (RAPDs) by plant polysaccharides. Plant Mol. Biol. Report. 1996, 14, 17–22. [Google Scholar] [CrossRef]
- Majure, L.C.; Puente, R.; Pinkava, D.J. Miscellaneous chromosome numbers in Opuntieae Dc. (Cactaceae) with a compilation of counts for the group. Haseltonia 2012, 18, 67–78. [Google Scholar] [CrossRef]
- Pinkava, D. On the evolution of the North American Opuntioideae. In Studies in the Opuntioideae (Cactaceae), 1st ed.; Hunt, N., Taylor, D.R., Eds.; DH Books: Hong Kong, China, 2002; pp. 59–98. [Google Scholar]
- Pinkava, D.J.; McLeod, M.G.; McGill, L.A.; Brown, R.C. Chromosome numbers in some cacti of Western North America II. Brittonia 1973, 25, 2–9. [Google Scholar] [CrossRef]
- Segura, S.; Scheinvar, L.; Olalde, G.; Leblanc, O.; Filardo, S.; Muratalla, A.; Gallegos, C.; Flores, C. Genome sizes and ploidy levels in Mexican cactus pear species Opuntia (Tourn.) Mill. series Streptacanthae Britton et Rose, Leucotrichae DC., Heliabravoanae Scheinvar and Robustae Britton et Rose. Genet. Resour. Crop Evol. 2007, 54, 1033–1041. [Google Scholar] [CrossRef]
- Helsen, P.; Verdyck, P.; Tye, A.; Desender, K.; Van Houtte, N.; Van Dongen, S. Primer note: Isolation and characterization of polymorphic microsatellite markers in Galapagos prickly pear (Opuntia) cactus species. Mol. Ecol. Notes 2006, 7, 454–456. [Google Scholar] [CrossRef]
- Erre, P.; Nieddu, G.; Chessa, I. Identification of microsatellite loci in Opuntia spp. and their characterization in cultivars and species. Acta Hortic. 2011, 28, 327–332. [Google Scholar] [CrossRef]
- Helsen, P.; Verdyck, P.; Tye, A.; Van Dongen, S. Low levels of genetic differentiation between Opuntia echios varieties on Santa Cruz (Galapagos). Plant Syst. Evol. 2009, 279, 1–10. [Google Scholar] [CrossRef]
- Caruso, M.; Currò, S.; Las Casas, G.; La Malfa, S.; Gentile, A. Microsatellite markers help to assess genetic diversity among Opuntia ficus-indica cultivated genotypes and their relation with related species. Plant Syst. Evol. 2010, 290, 85–97. [Google Scholar] [CrossRef]
- Samah, S.; De Teodoro Pardo, C.V.; Serrato Cruz, M.A.; Valadez-Moctezuma, E. Genetic diversity, genotype discrimination, and population structure of Mexican Opuntia sp., determined by SSR markers. Plant Mol. Biol. Report. 2016, 34, 146–159. [Google Scholar] [CrossRef]
- López-Vinyallonga, S.; Soriano, I.; Susanna, A.; Montserra, J.M.; Roquet, C.; Garcia-Jacas, N. The polyploid series of the Achillea millefolium aggregate in the Iberian Peninsula investigated using microsatellites. PLoS ONE 2015, 10, e0129861. [Google Scholar] [CrossRef] [PubMed] [Green Version]
- Rohlf, F.J. NTSY-SPC Numerical Taxonomy System; Exter Software: New York, NY, USA, 2002. [Google Scholar]
- Mantel, N.A. The detection of disease clustering and a generalized regression approach. Cancer Res. 1967, 27, 209–220. [Google Scholar] [PubMed]
- Vekemans, X. AFLP-SURV 1.0; Distributed by the author: Laboratoire de Génétique et Ecologie Végétale; Université Libre de Bruxelles: Brussels, Belgium, 2002. [Google Scholar]
- Peakall, R.; Smouse, P.E. Genalex 6: Genetic analysis in Excel. Population genetic software for teaching and research. Mol. Ecol. Notes 2005, 6, 288–295. [Google Scholar] [CrossRef]
- Peakall, R.; Smouse, P.E. GenAlEx 6.5: Genetic analysis in Excel. Population genetic software for teaching and research—An update. Bioinformatics 2012, 28, 2537–2539. [Google Scholar] [CrossRef] [PubMed]
- Excoffier, L.; Smouse, P.E.; Quattro, J.M. Analysis of molecular variance inferred from metric distances among DNA haplotypes: Application to human mitochondrial DNA restriction data. Genetics 1992, 131, 479–491. [Google Scholar] [PubMed]
- Laurent, E.; Lischer, H.E.L. Arlequin suite ver 3.5: A new series of programs to perform population genetics analyses under Linux and Windows. Mol. Ecol. Resour. 2010, 10, 564–567. [Google Scholar]
- Kirk, H.; Freeland, J.R. Applications and Implications of Neutral versus Non-neutral Markers in Molecular Ecology. Int. J. Mol. Sci. 2011, 12, 3966–3988. [Google Scholar] [CrossRef] [PubMed]
- Freeman, J.S.; Marques, C.M.P.; Carocha, V.; Borralho, N.; Potts, B.M.; Vaillancourt, R.E. Origins and diversity of the Portuguese Landrace of Eucalyptus globulus. Ann. For. Sci. 2007, 64, 639–647. [Google Scholar] [CrossRef]
- Blasco, M.; Angulo, M.J.; Cristina, I. Difference in the invasive potential of Opuntia genus inhabiting the south of Iberian Peninsula. Acta Hortic. 2015, 1067, 67–74. [Google Scholar] [CrossRef]
- Mondragon-Jacobo, C. Verification of the apomictic origin of cactus pear (Opuntia spp. Cactaceae) seedlings of open pollinated and crosses from Central Mexico. JPACD 2001, 4, 49–56. [Google Scholar]
- Erre, P.; Chessa, I.; Nieddu, G.; Jones, P.G. Diversity and spatial distribution of Opuntia spp. in the Mediterranean Basin. J. Arid Environ. 2009, 73, 1058–1066. [Google Scholar] [CrossRef]
- Chessa, G.; Nieddu, I. Investigations on variability in the genus Opuntia as fruit crop for genetic improvement. Acta Hortic. 2002, 575, 345–353. [Google Scholar] [CrossRef]
- Ellegren, H. Polymerase-Chain-Reaction (PCR) analysis of microsatellites: A new approach to studies of genetic relationships in birds. Auk 1992, 109, 886–895. [Google Scholar] [CrossRef]
- Kijas, J.M.H.; Fowler, J.C.S.; Thomas, M.R. An evaluation of sequence tagged microsatellite site markers for genetic analysis within Citrus and related species. Genome 1995, 38, 349–355. [Google Scholar] [CrossRef] [PubMed]
- Richardson, J.E.; Pennington, R.T.; Pennington, T.D.; Hollingsworth, P.M. Rapid diversification of a species-rich genus of neotropical rain forest trees. Science 2001, 293, 2242–2245. [Google Scholar] [CrossRef] [PubMed]
- Reis, C.M.G.; Gazarini, L.C.; Fonseca, T.F.; Ribeiro, M.M. Above-ground biomass estimation of Opuntia ficus-indica (L.) Mill. for forage crop in a Meditterranean environment by using non-destructive methods. Exp. Agric. 2018, 54, 227–242. [Google Scholar] [CrossRef]
Figure 1.
Dendrogram of the 22 Opuntia spp. populations obtained from SSR markers based on Dice coefficient and using the unweighted pair group arithmetic mean method (UPGMA) as the clustering method.
Figure 1.
Dendrogram of the 22 Opuntia spp. populations obtained from SSR markers based on Dice coefficient and using the unweighted pair group arithmetic mean method (UPGMA) as the clustering method.

Figure 2.
Principal coordinates analysis (PCoA) based on Nei’s genetic distances among the 22 Opuntia spp. populations. OFI–Opuntia ficus-indica.
Figure 2.
Principal coordinates analysis (PCoA) based on Nei’s genetic distances among the 22 Opuntia spp. populations. OFI–Opuntia ficus-indica.


Table 1.
Identification, pulp colour and origin of the studied Opuntia spp. populations.
| Population | Pulp Colour | Origin | Altitude (m) | Geographic Coordinates | |
|---|---|---|---|---|---|
| Latitude | Longitude | ||||
| OFI-01 a | White | Alcochete | 25 | 38°43′32.14″ N | 8°57′58.22″ W |
| OFI-03 | White | Cascais | 185 | 38°45′23.18″ N | 9°27′38.48″ W |
| OFI-04 | Pale yellow | Portalegre | 372 | 39°16′22.45″ N | 7°26′13.12″ W |
| OFI-05 | Orange | Arronches | 293 | 39°5′21.06″ N | 7°12′7.05″ W |
| OFI-08 | White | Melides | 29 | 38°8′28.91″ N | 8°44′14.28″ W |
| OFI-09 | White | Santo André | 25 | 38°4′38.13″ N | 8°46′38.08″ W |
| OFI-11 | White | Albufeira | 61 | 37°5′23.33″ N | 8°17′27.03″ W |
| OFI-12 | Orange | Cacela-a-Velha | 20 | 37°9′22.50″ N | 7°32′47.98″ W |
| OFI-13 | Orange | Monforte da Beira | 260 | 39°45′8.34″ N | 7°16′54.83″ W |
| OFI-14 | Orange | Idanha-a-Velha | 275 | 39°59′57.30″ N | 7°9′3.51″ W |
| OFI-15 | White | Ponte de Sor | 125 | 39°16′15.45″ N | 8°0′44.72″ W |
| OFI-16 | White | Coruche | 76 | 38°54′40.93″ N | 8°37′17.00″ W |
| OFI-17 | White | Castelo Branco | 402 | 39°48′58.84″ N | 7°29′37.85″ W |
| OFI-18 | White | Reg. Monsaraz | 223 | 38°27′27.04″ N | 7°39′21.77″ W |
| OFI-19 | White | Alvega | 105 | 39°27′15.96″ N | 8°3′51.88″ W |
| OFI-20 | Orange | Madeira | 116 | 32°38′54.18″ N | 16°57′46.38″ W |
| OFI, cv. Bianca | White | Italy | -- | -- | -- |
| OFI, cv. Gialla | Orange | Italy | -- | -- | -- |
| OFI, cv. Rossa | Red | Italy | -- | -- | -- |
| O. robusta | Red | Castelo Branco | 365 | 39°49′17.00″ N | 7°27′41.00″ W |
| O. dillenii | Purple | Lagos | 48 | 37°8′42.24″ N | 8°40′33.42″ W |
| O. elata | Purple | S. J. Pesqueira | 450 | 41°9′5.83″ N | 7°22′5.43″ W |
OFI–Opuntia ficus-indica, OFI-01 a–Opuntia ficus-indica f. amyclaea.
Table 2.
Number of alleles (Na), alleles per individual, number of rare alleles, polymorphic information content (PIC), and marker index (MI) values for the 6 SSR primer pairs studied.
Table 2.
Number of alleles (Na), alleles per individual, number of rare alleles, polymorphic information content (PIC), and marker index (MI) values for the 6 SSR primer pairs studied.
| Marker | Na | Alleles Per Individual | No. of Rare Alleles * | PIC (Average) | MI |
|---|---|---|---|---|---|
| OA3 | 6 | 2–3 | 3 | 0.635 | 3.808 |
| OA5 | 8 | 2–4 | 4 | 0.738 | 5.903 |
| OA9 | 10 | 2–5 | 5 | 0.495 | 4.948 |
| OA11 | 5 | 2–5 | 1 | 0.705 | 3.524 |
| OA12 | 16 | 3–7 | 7 | 0.882 | 14.106 |
| OA13 | 10 | 2–5 | 4 | 0.812 | 8.120 |
* Number of rare alleles refers to alleles with a frequency less than 5%.
© 2018 by the authors. Licensee MDPI, Basel, Switzerland. This article is an open access article distributed under the terms and conditions of the Creative Commons Attribution (CC BY) license (http://creativecommons.org/licenses/by/4.0/).
Share and Cite
MDPI and ACS Style
Reis, C.M.G.; Raimundo, J.; Ribeiro, M.M. Assessment of Genetic Diversity in Opuntia spp. Portuguese Populations Using SSR Molecular Markers. Agronomy 2018, 8, 55. https://0-doi-org.brum.beds.ac.uk/10.3390/agronomy8040055
AMA Style
Reis CMG, Raimundo J, Ribeiro MM. Assessment of Genetic Diversity in Opuntia spp. Portuguese Populations Using SSR Molecular Markers. Agronomy. 2018; 8(4):55. https://0-doi-org.brum.beds.ac.uk/10.3390/agronomy8040055
Chicago/Turabian StyleReis, Carlos M. G., Joana Raimundo, and Maria Margarida Ribeiro. 2018. "Assessment of Genetic Diversity in Opuntia spp. Portuguese Populations Using SSR Molecular Markers" Agronomy 8, no. 4: 55. https://0-doi-org.brum.beds.ac.uk/10.3390/agronomy8040055
Note that from the first issue of 2016, this journal uses article numbers instead of page numbers. See further details here.