Article

Visual Symptoms, Vegetative Growth, and Mineral Concentration in Fig Tree (Ficus carica L.) Under Macronutrient Deficiencies

by
Carlos Alberto Garza-Alonso
1,
Emilio Olivares-Sáenz
1,*,
Adriana Gutiérrez-Díez
1,
Rigoberto E. Vázquez-Alvarado
1 and
Alfredo López-Jiménez
2
1
Facultad de Agronomía, Universidad Autónoma de Nuevo León, General Escobedo 66050, Mexico
2
Recursos Genéticos y Productividad-Fruticultura, Colegio de Postgraduados, Texcoco 56230, Mexico
*
Author to whom correspondence should be addressed.
Submission received: 4 October 2019 / Revised: 11 November 2019 / Accepted: 15 November 2019 / Published: 22 November 2019
(This article belongs to the Special Issue Mineral Nutrition of Fruit Trees)

Abstract

:
The common fig is an edible fruit which is appreciated for its organoleptic characteristics and high commercial value. Several factors, including mineral nutrition, affect fig production. Macronutrients fulfill specific functions in the metabolism of plants, affecting some functions when they are at low levels. So, in the present investigation, the visual symptoms of nitrogen, phosphorus, potassium, calcium, and magnesium deficiencies were identified and characterized, as well as their effects on vegetative growth and the concentration of minerals in fig tree tissues, using the missing element technique in a controlled hydroponic system. N was the element that most affected vegetative growth, causing smaller stem diameter, leaf area, and dry weight. Treatments without P and K followed. In addition, significant differences were found in the mineral concentration in leaf, stem, and root, with various interactions of antagonism and synergism observed according to the absence of each element.

1. Introduction

Ficus carica is among the species of the genus Ficus which are widely distributed around the world, whose edible fruit is appreciated for its organoleptic characteristics and high commercial value. Figs are rich in carbohydrates, minerals, and bioactive compounds, among other properties. In addition, some compounds can be found in the leaves [1]. Several studies suggest that fig tree leaves can lower blood sugar levels and total cholesterol, and increase antioxidant levels [2]. Globally, the harvested area and volume of fig production have remained constant in recent years, with the main producers being Turkey, Egypt, Morocco, Algeria, and Iran [3]. In some countries, such as Mexico, fig cultivation has shown an upward trend, with an average annual growth rate of 6% in terms of harvested area and 13% of production volume [3]. The area harvested in Mexico in 2017 was 1440 ha, with an average yield of 5.6 t ha−1 [4]. However, under greenhouse conditions, yields greater than 100 t ha−1 have been reported [5].
Physical, chemical, and biological factors can influence crop development, including plant nutrition. Nutrients play an essential and specific role in plants. When one of these elements is not present in adequate amounts, its deficiency in tissues promotes changes in the metabolism of the plant, affecting vegetative growth.
Using the missing element technique, it is possible to study the effect of the absence of some elements. This method consists of preparing a complete nutritional solution without adding the element to be analyzed [6]. Globally, numerous studies have been carried out on nutritional deficiencies in crops such as cereals, vegetables, and fruit trees, as well as in forest plants of ornamental importance [7,8,9,10,11], where significant differences were found in response to nutritional deficiencies.
Worldwide, few research papers on fig nutrition have appeared. Some experiments have been based on the effects of the essential elements in the plant, but little has been said about their nutritional deficiencies and their relation to vegetative growth, vigor, production, and fruit quality. In addition, the visual symptoms of deficiency of some elements are unknown.
Based on the above, in the present investigation, the visual symptoms of nutritional deficiencies of the fig tree, as well as the effect on vegetative growth and mineral concentration, were studied.

2. Materials and Methods

2.1. Establishment of the Experiment

The present investigation was carried out at Universidad Autónoma de Nuevo León, with a geographic location of 25°47′07′′ North latitude, 100°17′03′′ West longitude, and an altitude of 479 masl [12]. The climate of the region is semiarid, with rainfall of 550 mm and an average annual temperature of 23 °C [13]. The experiment was carried out in a greenhouse, with a surface area of 1000 m2, a height of 4.5 m in the lateral gutters, and the highest part at 7 m. During the study period, the average temperature and relative humidity of the greenhouse were 25 °C and 70%, respectively. The missing element technique was used to induce nutritional deficiencies in plants. Nutrient solutions were prepared without the element that was intended to observe its effects [6]. The substrate used was pearlite, an inert material with a neutral pH and no mineral nutrient content [14]. The plants (“Adriatic” cultivar) were provided by the nursery of native plants of the Facultad de Agronomía UANL; they were 6 months old and had an average height of 20 cm.
Nineteen-liter pots were used with one plant each, tutored to a single stem. Before potting the plants, the root system was washed with distilled water to remove any remaining of soil, substrate, or other impurities. Water was applied using an automatic irrigation system with timers. Eight irrigation impulses of 60 mL each were applied per pot, using 50 L containers with the nutrient solutions of each treatment. The experiment was established on September 10, 2018, carrying out the collection of data from September 24 of the same year to April 22, 2019 (details in Section 2.4).

2.2. Treatments

The treatments evaluated in the present investigation were: Complete nutrient solution (Control); Solution without nitrogen (-N); Solution without phosphorus (-P); Solution without potassium (-K); Solution without calcium (-Ca), and Solution without magnesium (-Mg). Treatments were evaluated using a completely randomized design with four replications. The complete nutrient solution was prepared using the Hewitt solution (Table 1), which was evaluated in fig trees by Sevil et al. [15] under similar environmental conditions, finding good results. The balance of nutrient solution to maintain ionic strength in macronutrient deficiency treatments was calculated using different concentrations of mineral salts to balance the sum of anions and cations in nutrient solutions. The fertilizer sources were KNO3, KH2PO4, MgSO4, Ca (NO3)2, K2SO4, CaSO4, NH4H2PO4, NH4NO3, H3PO4, and HNO3. The final pH of the nutrient solution was 6.5.
The water used for the preparation of the nutrient solutions had an electrical conductivity of 0.05 dS m−1. The water was analyzed chemically, not finding minerals that would affect the investigation. Micronutrients Fe, Mn, B, Cu, Zn, and Mo were supplied in chelated form using the commercial product Ultrasol® micromix (SQM, Chile). The chelated forms were DTPA for Fe, EDTA for Mn, Zn, and Cu; B and Mo were applied as inorganic salts.

2.3. Visual Symptoms of Macronutrient Deficiency

For the identification and characterization of the visual symptoms of macronutrient deficiencies, the color charts for plant tissues of Munsell (Munsell Color, Grand Rapids, MI, USA) were used to identify the specific colors in the case of chlorosis and tissue necrosis.

2.4. Vegetative Growth Evaluation

The vegetative growth data were taken at weekly intervals throughout the study period, performing the readings at the same time. The variables evaluated were:
1. Number of leaves: A count of the fully expanded leaves was made. 2. Stem elongation: This measure was taken using the methodology proposed by Muñoz [16], which consists of marking the raffia of the tutoring at different time intervals and measuring growth. 3. Distance of internodes: The distance of each internode of the plant was obtained and the average was calculated. 4. Leaf area: For this variable, the width of the leaf was measured in its broadest part. With the obtained data, the leaf area was estimated using the regression model proposed by Giaccone et al. [17] for the cultivation of fig trees, applying it on each leaf and doing the summation to obtain the total leaf area of the plant. 5. Stem diameter: This variable was measured directly using a digital vernier. The part of the stem was marked to take the readings at the same point, i.e., 30 cm from the base.
At the end of the experiment, the following variables were determined:
1. Relative chlorophyll content: The relative chlorophyll content expressed in SPAD units was measured using the portable SPAD-502 from Minolta (Konica Minolta, Osaka, Japan). SPAD units were measured in three strata of the plant (Low stratum: First leaves of stem base; Mid stratum: Leaves at mid zone of stem; High stratum: Leaves of the highest part of stem. 2. Dry weight: The dry weight of the plant was determined, considering the root, stem, and leaves. The samples were placed in a Yamato model DX602C drying oven (Yamato Scientific America, Santa Clara, CA, USA) at a temperature of 60 °C for three days. The resulting matter was weighed on a digital scale. 3. Mineral concentration of root, stem and leaves (details in Section 2.5).

2.5. Minerals Determination

The concentrations of nitrogen (N), phosphorus (P), potassium (K), calcium (Ca), magnesium (Mg), iron (Fe), boron (B), manganese (Mn), zinc (Zn), and copper (Cu) were determined in root, stem, and leaves. Dry samples (0.5 g) were crushed for acid digestion in a mixture of HNO3:HClO4 (2:1 mL) and 2 mL of H2O2 30%, according to the methodology proposed by Alcántar and Sandoval [18]. The N was quantified using the micro-Kjeldahl method according to the methodology of Bremmer [19]. The concentrations of P, K, Ca, Mg, Fe, B, Mn, Zn, and Cu were determined using an Agilent model 725-ES coupled plasma induction atomic emission spectrometer (ICP-AES) (Agilent Technologies, Santa Clara, CA, USA).

2.6. Statistical Analysis

Growth data were analyzed using a completely randomized design with four repetitions (n = 4). The comparison of means was carried out by the Tukey method (p < 0.05). Regarding the statistical analysis of the number of leaves and leaf area, data were divided into two time periods: from October 8 to December 3, 2018 (Period 1), and from February 25 to April 22, 2019 (Period 2), corresponding to the beginning and end of the experiment, with the objective of observing the effects of nutritional deficiency on foliar senescence over time. For the analysis of root, stem, and leaf nutrients, the experimental design mentioned above was considered, using three repetitions (n = 3). All statistical analyses were performed with the SPSS Statistics 21 software (IBM Corp., Armonk, NY, USA).

3. Results and Discussion

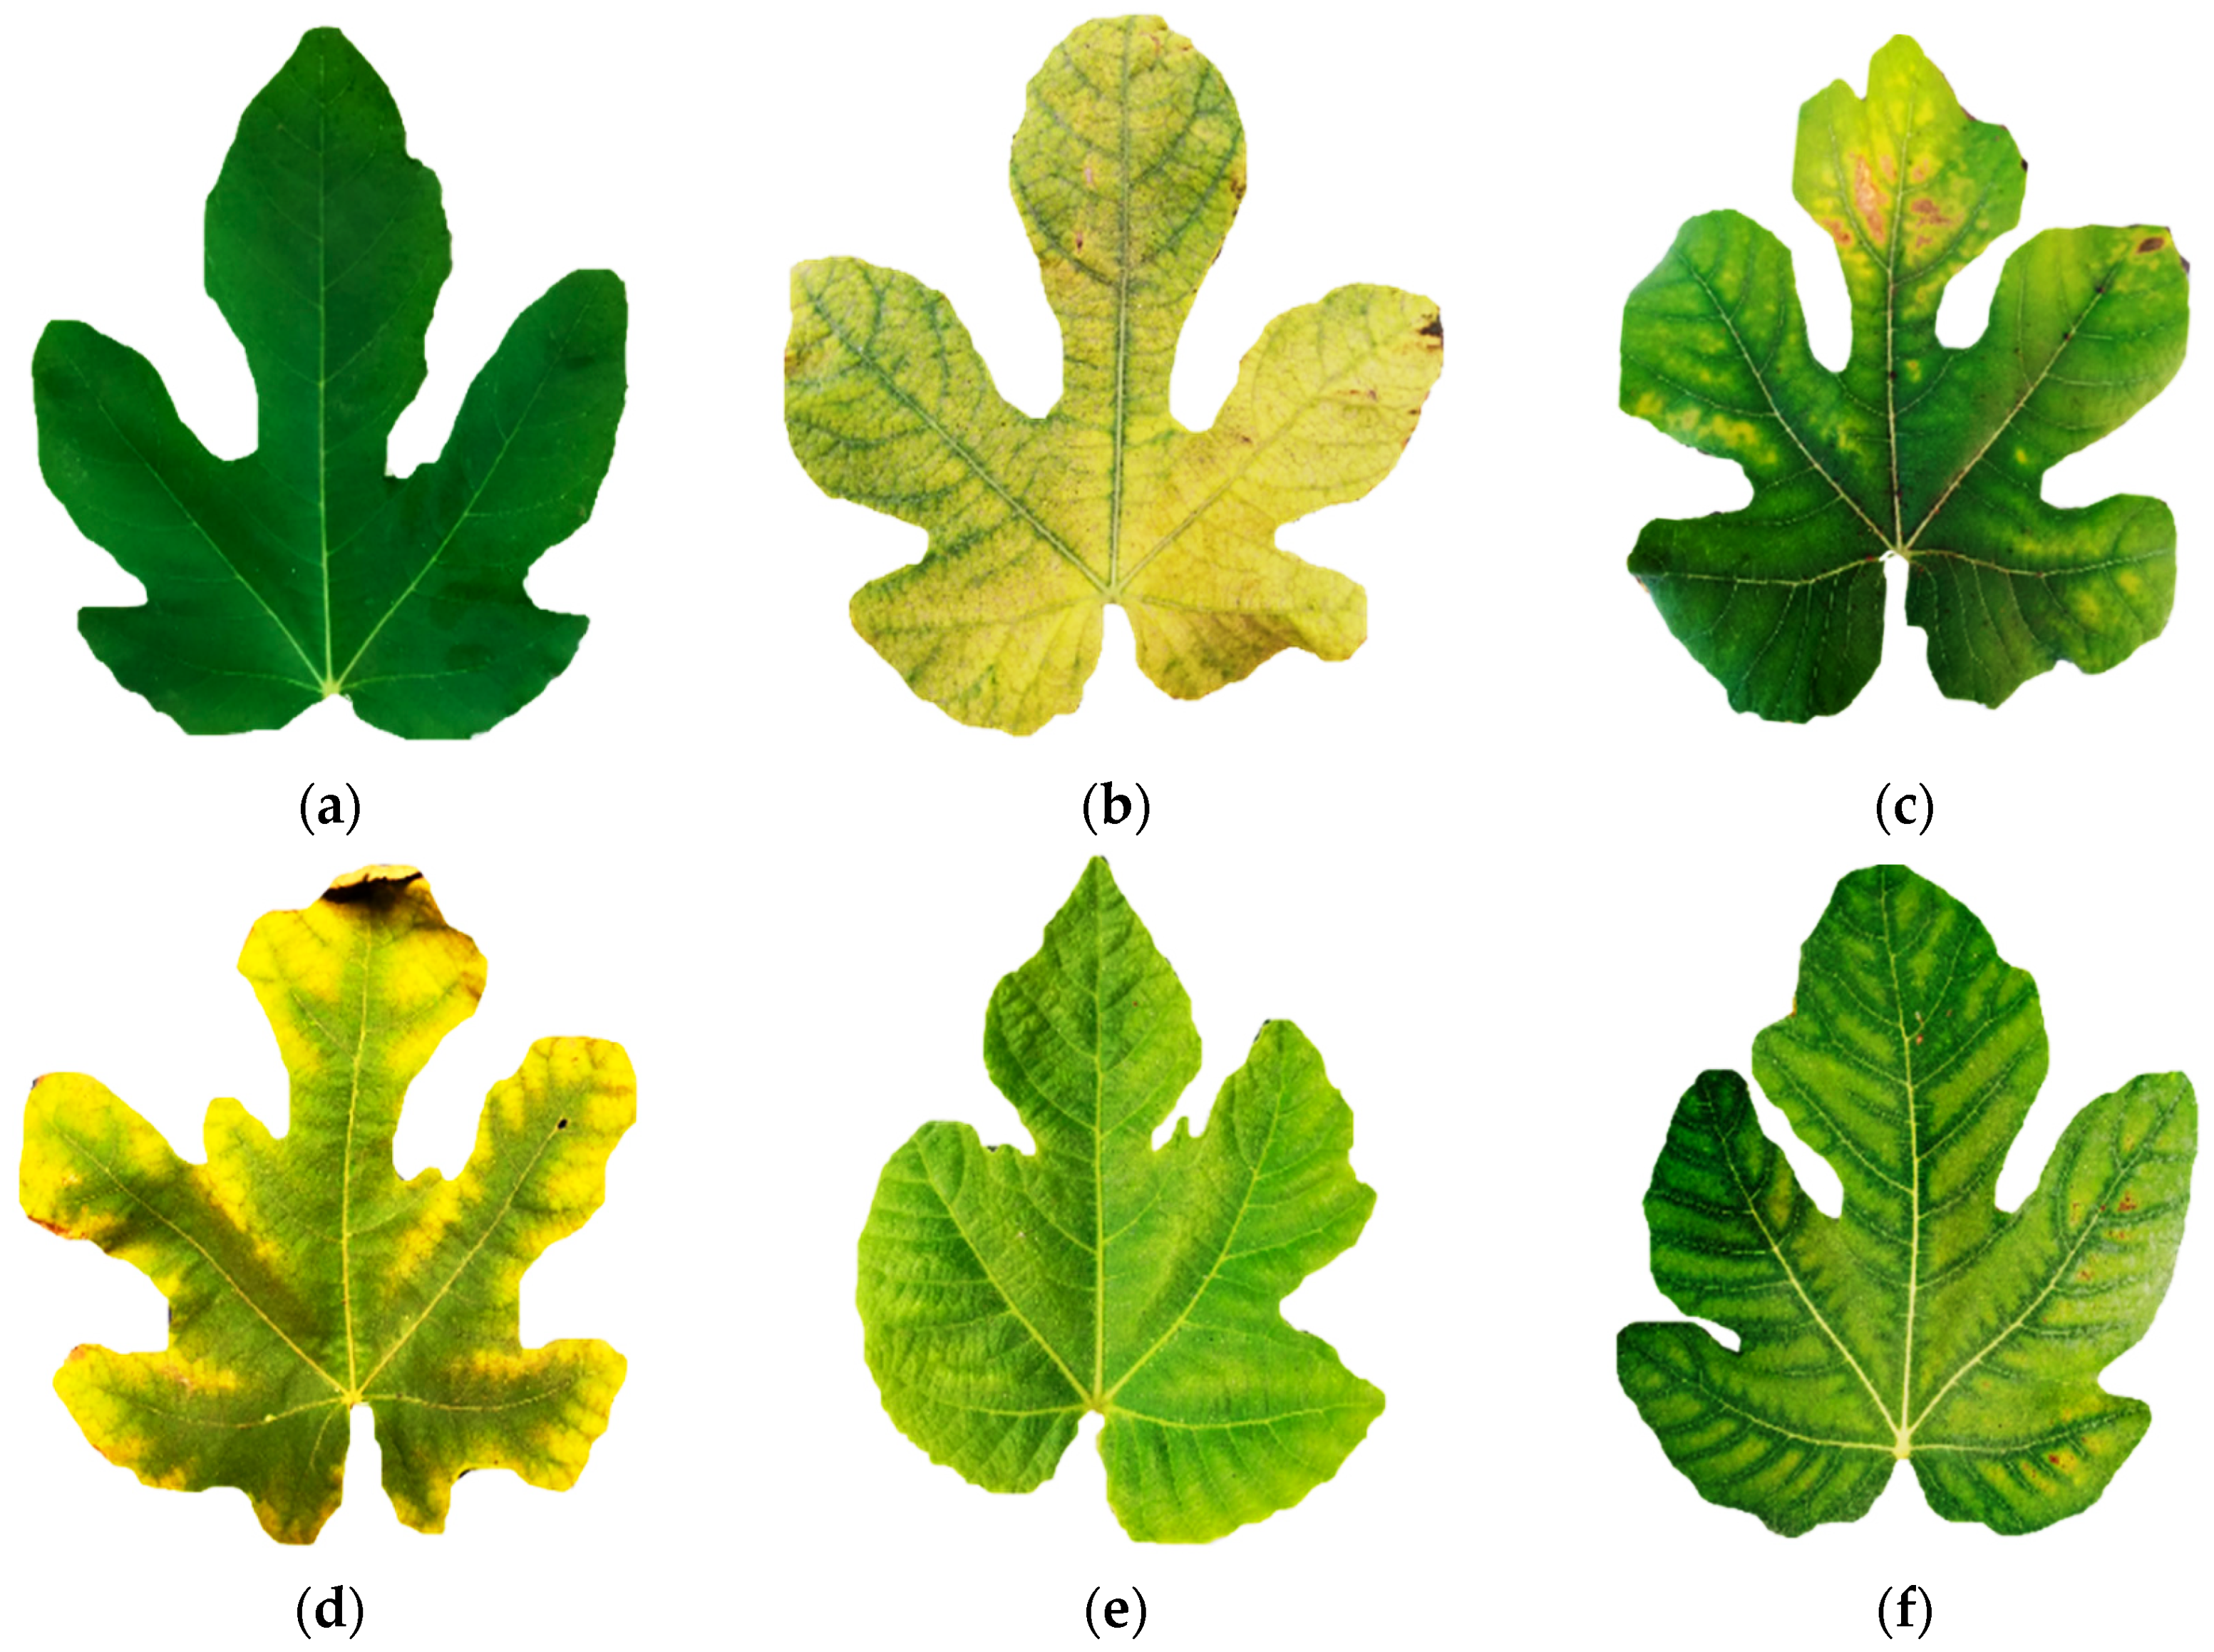
3.1. Visual Symptoms of Macronutrient Deficiencies

3.1.1. N Deficiency

A deficiency of N was observed 75 days after the establishment of the experiment, in the mature leaves of the lower part of the stem. Symptoms started with chlorosis on the edge of the left central lobe of the leaf, which spread along the leaf and advanced towards the midrib. After a few days, the same behavior was observed in the right central lobe of the leaf, accelerating the senescence of the leaf; in some cases, total chlorosis and detachment occurred. The observed chlorosis corresponds to the 5Y 8/8 color of the Munsell charts for plant tissues (Figure 1b).

3.1.2. P Deficiency

Visual symptoms were observed 120 days after the establishment of the experiment. The P deficiency started with intense green coloration on mature leaves, similar to the 7.5 G and 3/4 color of the Munsell charts for plant tissues. Subsequently, chlorotic sections were observed in the same leaves, without following a defined pattern, as in the case of N. This chlorosis progressed gradually over time to necrosis, starting in the central lobe and, to a lesser extent, the right and left middle lobes. Like N, P is a mobile element in the plant, so deficiency symptoms appeared in mature leaves (Figure 1c).

3.1.3. K Deficiency

A deficiency of K was observed 105 days after the establishment of the experiment, manifesting as chlorosis in the margins of the leaf, which progressed gradually towards the ribs of all the lobes, with a green band appearing close to the ribs. Subsequently, the green band was reduced as the chlorosis progressed towards the central vein of the lobes, starting a necrosis at the edges of the leaf, similar to the 2.5 YR 4/4 color of the Munsell charts for plant tissues. The chlorosis observed in the margins of the leaf occurs in a similar way in other crops. Like the N and P, K is a mobile element in the plant, so deficiencies occurred in the mature leaves of the lower part of the stem (Figure 1d).

3.1.4. Ca Deficiency

A deficiency of Ca was observed 113 days after the establishment of the experiment. Unlike N, P, and K, Ca is a non-mobile element in the plant; therefore, deficiency symptoms occur in new leaves. In this work, Ca deficiency was observed as general chlorosis on younger leaves, similar to the 5Y 8/8 color of the Munsell charts for plant tissues. In addition, a marked deformity of the leaf lobes was found, compared with the treatment with the complete solution (Figure 1e).

3.1.5. Mg Deficiency

A deficiency of Mg was observed 94 days after the establishment of the experiment. Mg, like N, P, and K, is a mobile element in the plant, so deficiency symptoms first appeared in mature leaves. Compared to N, in the present investigation, Mg deficiency did not appear initially in the leaf of the lowest part of the plant, but in the third and fourth mature leaves from the base of the stem. The deficiency of Mg appeared as interventional chlorosis, and manifested initially in the central part of the lateral lobes, being observed as a green band near the ribs of the lobes which then extended between the secondary veins. This chlorosis corresponds to the 2.5 GY 8/8-8/10 color of the Munsell charts for plant tissues. The ribs retained the green color from the base of the leaf to the apices of each of the lobes. These symptoms have been described in other crops (Figure 1f). K deficiency in advanced stages can be confused with Mg deficiency. However, when there is a deficiency of Mg, the ribs remain completely green in the area of the petiole until the apices of each of the lobes. In the case of K, all margins of the leaf will present chlorosis, including the section of the ribs that go through that edge.

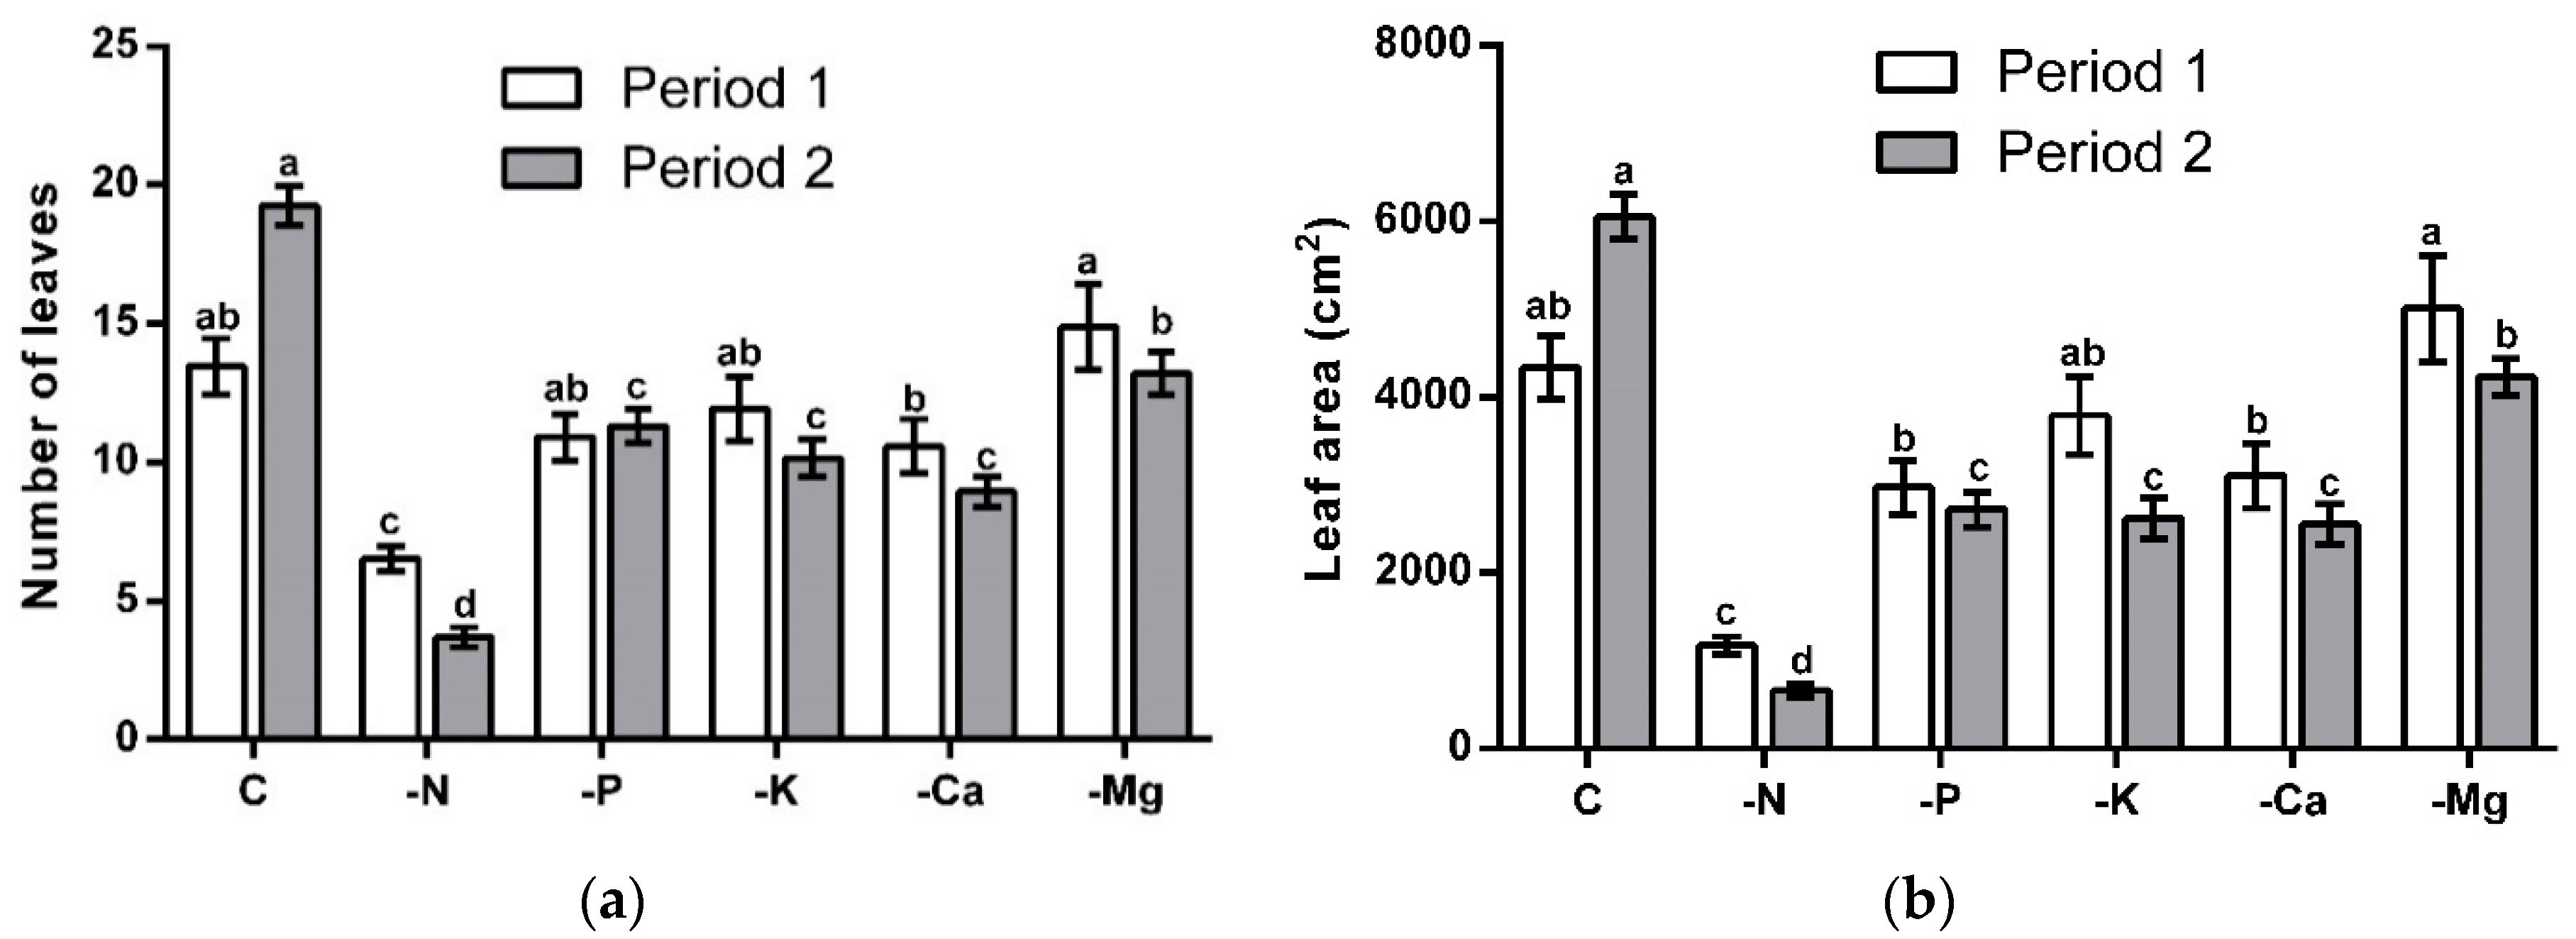
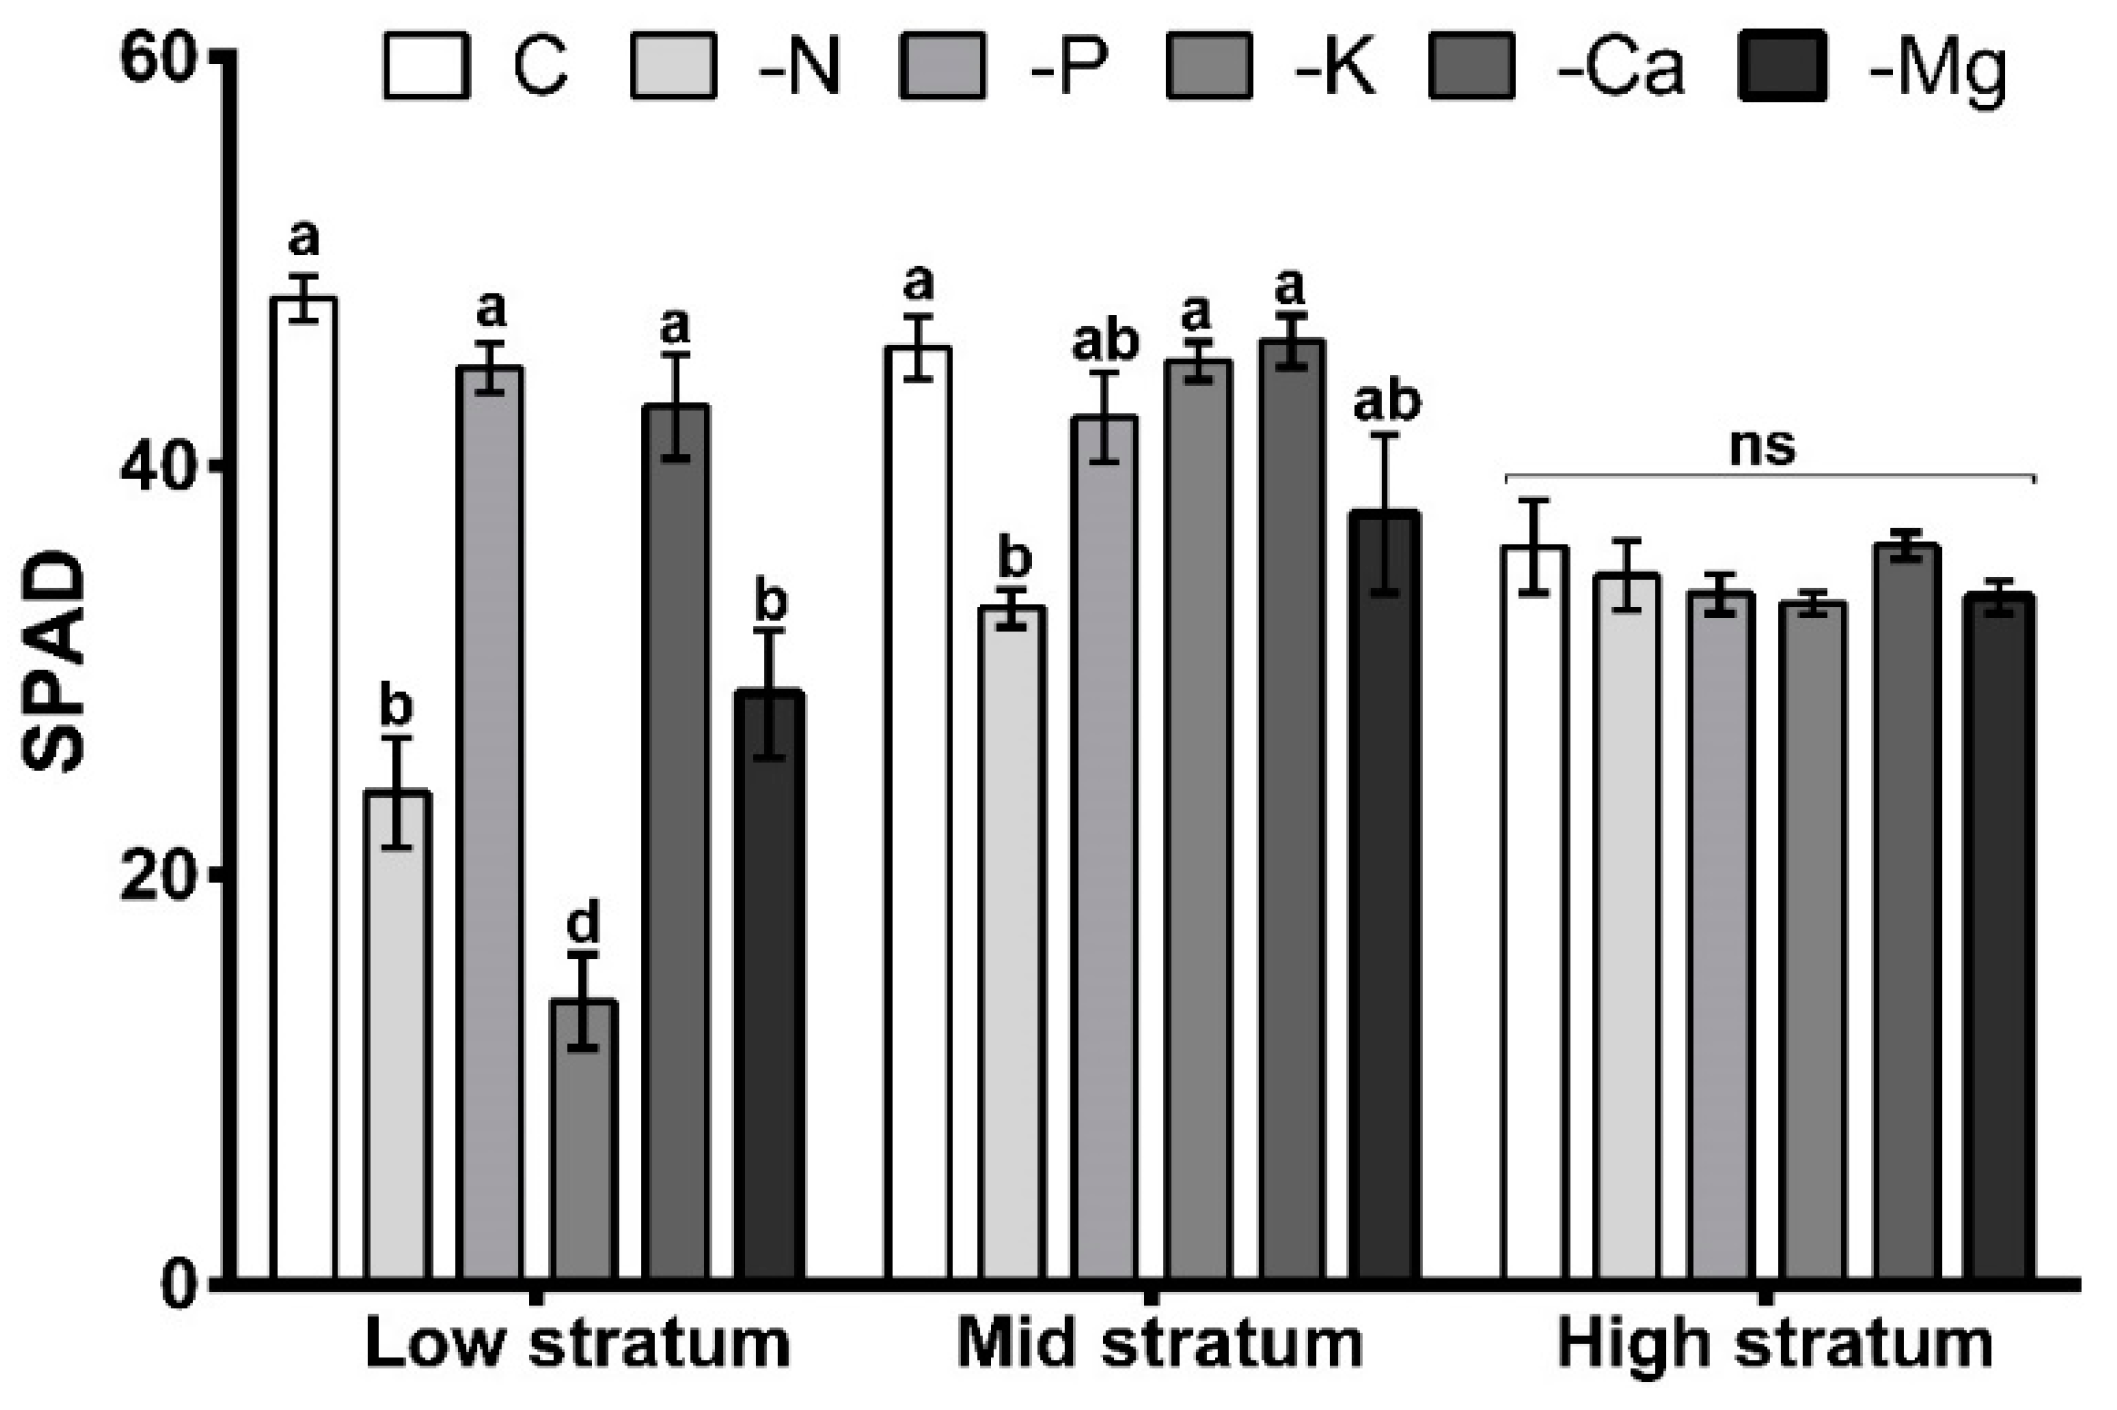
3.2. Vegetative Growth

The analysis of variance registered a significant difference (p < 0.05) among treatments for all variables. Nitrogen was the missing element that most affected the growth of fig trees, with the lowest values in stem elongation and diameter, plant height, and internode length, as well as lower values in dry weight of root, stem, and leaves (Table 2).
Nitrogen is the mineral that is found in the greatest amounts in plant tissues; it is about 1 to 5% of the total dry matter of the plant, fulfilling important functions as a constituent of proteins, nucleic acids, chlorophyll, coenzymes, phytohormones, and secondary metabolites [20]. The above explains the results found in the present investigation. In most crops, N deficiency causes reduced plant growth [7,8,9,10,11].
Following N, deficiencies of P and Ca equally affected the vegetative growth of all the variables evaluated (Table 2). P is an important compound of nucleic acids, nucleotides, and phospholipids, and an important part of ATP, while Ca is an important element for the formation of the cell wall and membrane, a cofactor of several enzymes involved in the hydrolysis of ATP and phospholipids, as well as a secondary messenger in the metabolic regulation of plants [21,22]. Ca is an important element for elongation and cell division, secondary messenger, enzyme activator, and meristem development, according to Karthika et al. [23]. The above explains the effects of the deficiency of this element in the vegetative growth of the plant.
Regarding the K deficiency, the analysis of variance did not find significant differences with respect to the complete solution in this period of study for the variables of stem elongation, plant height, and internode length. However, K affected the diameter of the stem, number of leaves, and the leaf area of the plant. K has an important function in the regulation of osmotic pressure and cellular turgor, so a deficiency of this element has a negative influence on the general metabolism of the plant [24]. Regarding the treatment with Mg deficiency, the analysis of variance did not find significant differences in all the growth variables. Romheld [25] mentioned that in the early stages of nutrient deficiency, plants do not express visual symptoms or effects on vegetative growth, which would explain why no significant difference was found of this treatment compared with the complete nutrient solution.
On the other hand, the deficiency of N significantly affected the number of leaves and the leaf area for period 1. However, the deficiency of N, P, K, Ca, and Mg affected the aforementioned variables in period 2, showing lower values with respect to control (Figure 2). The above is explained due to the mobilization of nutrients (N, P, K, and Mg) towards the apical points to ensure the survival of the plant, causing a reduction in the number of leaves due to senescence, with fewer leaves causing a smaller foliar area. Treatments with nutritional deficiency negatively affected the number and leaf area in the following order: -N > -Ca > -K > -P > -Mg. Although in this investigation the treatment with -Mg showed the least effect, a decrease in the values of these variables was observed over time. The process of foliar senescence due to Mg deficiency was widely explained by Tanoi and Kobayashi [26], which is similar for the other mobile elements in the plant, such as N, P, and K.
Regarding the chlorophyll content in the leaves, the analysis of variance identified specific differences in the lower stratum of plants. Treatment with lower values of SPAD units was -K, followed by -N and -Mg, without finding a significant difference between -P, -Ca, and the complete nutrient solution. The low chlorophyll contents in the -N, -K, and -Mg treatments are explained by the decomposition of the chloroplasts due to the degradation of chlorophyll and Rubisco during the process of translocation of these elements to the apical parts of the plant [27]. Regarding the mid-stratum of the plant, significant differences were also found, with a similar tendency to the lower stratum, although with numerically-higher values, where the -N treatment resulted in the lowest values of SPAD units, followed by the -Mg treatment. On the other hand, for the high stratum, the analysis of variance found no specific differences between the treatments (Figure 3).
The results of the relative chlorophyll content coincide with those reported in other experiments with macronutrient deficiencies in Capsicum annuum L. [28] and Coffea arabica L. plants [7].

3.3. Mineral Concentration

The concentrations of N, P, K, Ca, and Mg were negatively affected in all vegetative organs for each of their respective treatments (-N, -P, -K, -Ca, and -Mg), which was expected in advance (Table 3).
In the case of foliar N, no significant differences were found between the complete solution and the treatments -P, -K, -Ca, and -Mg, presenting the same trend in the case of the concentration of N in the root. On the other hand, the highest concentration of N in the stem was found in the treatment -Ca. Furthermore, no differences were found in this organ between the complete solution and the other treatments (Table 3).
For P concentration, higher values were observed in the treatment with N deficiency (Table 3), which can be explained because the absence of the NO3 favored a greater absorption and accumulation of the H2PO4 to maintain the balance of plant loads [22]. On the other hand, no significant statistical difference was found in the content of P in the leaves between the -P treatment and the control; however, the lowest values of this element were found in the root and stem. The above can be explained because the plants translocated the P from the root and stem towards the leaves as a mechanism to continue with the growth, but due to the little vegetative growth observed in the -P treatment, the content of that element accumulated in the leaves, which resulted in statistical equality with respect to control.
The accumulation of K in the leaves did not show a significant difference between the -N, -P, -Ca, and -Mg treatments, while some important differences were found in stem and root, such as a greater accumulation of K in the treatment with deficiency of Mg (Table 3). The interaction of the K+ and Mg++ ions has been explained by various authors [29,30,31], and has been demonstrated in different plants, such as Cymbopogon citratus (DC.) Stapf. [32], Saccharum officinarum L. [33], Piper hispidinervum C. DC. [34], Swietenia macrophylla King. [35] and Heliconia psittacorum L. f. [36], which matches the results found in our investigation. Guo et al. [31] mention that K+ competes with Mg++ for apoplast binding sites, and possibly competes for transporters; therefore, the high concentration of K in stems and roots in the treatment -Mg could be due to higher binding sites in the apoplast and more available transports.
On the other hand, the concentration of Ca in the fig leaves was negatively affected in all treatments with respect to the control solution, without finding significant differences in stem and root (Table 3). In the case of Mg, a higher concentration was found in the -K treatment (Table 3), which is explained again with the effect of interaction K+/Mg++ [29,30,31]. On the other hand, the Mg concentration was negatively affected in the -N treatment (Table 3). Mg is part of the chlorophyll molecule, as is N [21], which explains the decrease in Mg concentration by decreasing the chlorophyll content due to the absence of N.
Regarding the concentrations of micronutrients in the different vegetative organs of the fig tree, the analysis of variance found significant differences in most of the elements. In general, lower concentrations of Fe, B, Mn, Zn, and Cu were found in the -N treatment, which can be explained by the poor vegetative growth of the plants established in the absence of this element (Table 4).
Mengel and Kirkby [22] explained that plants tend to accumulate greater amounts of micronutrients when there is a greater vegetative growth, so the lower the vegetative growth, the lower the concentration of elements. In addition, root growth decreased significantly in the treatment with the absence of N (Table 2), so that at a lower radical growth, the absorption of micronutrients decreases.
On the other hand, high concentrations of Mn were found in the -K and -Ca treatments in all vegetative organs, as well as high levels of Fe in the treatment -K (Table 4). The above can be explained by the antagonism of the ions in the rhizosphere and the access to the plant due to the charges of the cations mentioned above.
In the case of Cu, a significant increase in stem was found for treatments -N, -P, and -K, with respect to control (Table 4). The above can be attributed to the so-called “dilution effect”, i.e., that some elements are concentrated in greater quantity when there is less dry matter (as in the case of plants established under N, P, and K deficiency), while plants with greater growth will have better-distributed minerals and in less concentration. This effect is widely described by Mengel and Kirkby [22].
On the other hand, the highest concentration of Cu in the root was found in the -N treatment (Table 4). According to Rodríguez et al. [37], Cu++ accesses the plant mainly by mass flow, a process that depends directly on the transpiration of the plant to favor transport by xylem and distribution to the aerial part. The plants established under N deficiency had lower vegetative growth, including number of leaves and leaf area, which caused less respiration and, therefore, low mobilization of solutes in the xylem. This effect led to the accumulation of Cu in the root system of plants. Regarding Zn concentrations, no significant differences were found (Table 4).
There are few studies on the mineral content in different vegetative parts of the fig tree in which differences can be found in the concentrations of the aforementioned elements in several fig tree cultivars. (“Calimyrna” [38], “Pellejo duro” [39], “Conadria” [40], and “Nezahualcóyotl” [41]), so it’s difficult to select reference values. However, in most cases, macro and micronutrient concentrations similar to those found in the present investigation were reported.

4. Conclusions

The fig plants showed specific visual symptoms in the absence of each element. N most affected the vegetative growth of the fig tree, followed by P, K, and Ca; in addition, N, K, and Mg decreased the chlorophyll content in the lower stratum of plants. The absence of some elements caused a greater accumulation of other ions in the different tissues of the plant due to interactions of antagonism and synergism.

Author Contributions

C.A.G.-A.: Conceptualization, investigation, methodology and writing original draft; E.O.-S.: Conceptualization, funding acquisition, methodology, project administration and writing original draft; A.G.-D.: Supervision, visualization, review and editing draft; R.E.V.-A.: Supervision, visualization, review and editing draft; A.L.-J.: Supervision, visualization, review and editing draft.

Funding

The Article Processing Charges was founded by Programa de Apoyo a la Publicación Científica en Revistas Indexadas en el Journal Citation Reports from Universidad Autónoma de Nuevo León.

Acknowledgments

C.A.G.-A. acknowledges the master scholarship given by Consejo Nacional de Ciencia y Tecnología (CONACyT), México and Centro de Agricultura Protegida, Facultad de Agronomía, Universidad Autónoma de Nuevo León.

Conflicts of Interest

The authors declare no conflict of interest.

References

  1. Agricultural Research Service, United States Department of Agriculture (USDA). Food Composition Databases. Available online: https://ndb.nal.usda.gov/ndb/search/list (accessed on 10 September 2019).
  2. Deepa, P.; Sowndhararajan, K.; Kim, S.; Park, S.J. A role of Ficus species in the management of diabetes mellitus: A review. J. Ethnopharmacol. 2018, 215, 210–232. [Google Scholar] [CrossRef] [PubMed]
  3. Food and Agriculture Organization (FAO). Statistical Yearbook. Agricultural Production. Available online: http://www.fao.org/faostat/es/#data/QC (accessed on 12 September 2019).
  4. Servicio de Información Agroalimentaria y Pesquera (SIAP). Available online: https://www.gob.mx/siap/acciones-y-programas/produccion-agricola-33119 (accessed on 10 September 2019).
  5. Mendoza, C.V.M.; Vargas, C.J.M.; Calderón, Z.G.; Mendoza, C.M.C.; Santacruz, V.A. Intensive production systems of Fig (Ficus carica L.) under greenhouse conditions. Exp. Agric. 2017, 3, 339–350. [Google Scholar] [CrossRef]
  6. Kathpalia, R.; Bhatla, S.C. Plant Mineral Nutrition. In Plant Physiology, Development and Metabolism; Bhatla, S.C., Lal, M.A., Eds.; Springer: Berlin/Heidelberg, Germany, 2018; pp. 37–81. [Google Scholar] [CrossRef]
  7. Alves, F.R.; Montes, N.B.M.; Almeida, H.; Mello, P.R. Growth and nutritional disorders of coffee cultivated in nutrient solutions with suppressed macronutrients. J. Plant Nutr. 2016, 11, 1578–1588. [Google Scholar] [CrossRef]
  8. Alves, F.R.; Montes, N.B.M.; Almeida, H.; Mello, P.R. Growth and nutritional disorders of eggplant cultivated in nutrients solutions with suppressed macronutrients. J. Plant Nutr. 2015, 7, 1097–1109. [Google Scholar] [CrossRef]
  9. Chen, L.; Zeng, J.; Xu, D.; Zhao, Z.; Guo, J. Macronutrient deficiency symptoms in Betula alnoides seedlings. Jour. Trop. For. Sci. 2010, 4, 403–413. [Google Scholar]
  10. Dussán, S.L.; Villegas, D.A.; Miranda, D. Efecto de la deficiencia de N, P, K, Mg, Ca y B sobre la acumulación y distribución de la masa seca en plantas de guayaba (Psidium guajava L.) var. ICA Palmira II en fase de vivero. Rev. Colom. Cienc. Hortic. 2016, 1, 40–52. [Google Scholar] [CrossRef]
  11. Mota, R.M.J.; Rocha, P.L.G. Physical and Quality Characteristics of Jupi Pineapple Fruits on Macronutrient and Boron Deficiency. Nat. Res. 2014, 8, 359–366. [Google Scholar] [CrossRef]
  12. Instituto Nacional de Estadística y Geografía (INEGI). Mapa Digital de México V6.3. Available online: http://gaia.inegi.org.mx/mdm6/?coordinates= (accessed on 10 September 2019).
  13. Servicio Meteorológico Nacional. Available online: https://smn.conagua.gob.mx/es/climatologia/informacion-climatologica/normales-climatologicas-por-estado (accessed on 12 September 2019).
  14. Papadopoulos, A.P.; Bar-Tal, A.; Silber, A.; Saha, U.K.; Raviv, K. Inorganic and synthetic organic components of soilless culture and potting mixes. In Soilless Culture, Theory and Practices; Raviv, M., Lieth, J.H., Eds.; Elsevier: Amsterdam, NL, USA, 2008; pp. 505–543. ISBN 978-0-444-52975-6. [Google Scholar]
  15. Sevil, K.S.; Ertan, E.; Seferoglu, S. Effect of different nutrient solution formulations on morphological and biochemical characteristics of nursery fig trees grown in substrate culture. Sci. Hort. 2007, 2, 20–27. [Google Scholar] [CrossRef]
  16. Muñoz, R.J.J. Manejo del cultivo de tomate en invernadero. In Manual de Producción de Tomate en Invernadero; Castellanos, J.Z., Ed.; Intagri: Celaya/México City, Mexico, 2009; pp. 45–92. ISBN 978-607-95302-0-4. [Google Scholar]
  17. Giaccone, M.; Pannico, A.; Scognamiglio, C.; Rivera, M.; Cirillo, C.; Rouphael, Y.; Pascale, S.; Basile, B. Regression model for leaf area estimation in Ficus carica L. Acta Hort. 2017, 1163, 163–168. [Google Scholar] [CrossRef]
  18. Alcántar, G.G.; Sandoval, V.M. Handbook Chemical Analysis of Vegetal Tissue, Especial Publication No. 10; Mexican Society of Soil Science: Chapingo, Mexico, 1999. (In Spanish) [Google Scholar]
  19. Bremner, J.M. Total nitrogen. In Methods for Soil Analysis. Part 2. Chemical and Microbiological Properties; Norman, A.G., Ed.; American Society of Agronomy Inc.: Madison, WI, USA, 1965; pp. 1149–1178. [Google Scholar]
  20. Hawkesford, M.; Horst, W.; Kichey, T.; Lambers, H.; Schjoerring, J.; Skrumsager, I.; White, P. Functions of macronutrients. In Marschner’s Mineral Nutrition of Higher Plants, 3rd ed.; Marschner, H., Ed.; Academic Press: London, UK, 2012; pp. 135–189. [Google Scholar] [CrossRef]
  21. Taiz, L.; Zeiger, E.; Moller, I.M.; Murphy, A. Plant Physiology and Development, 6th ed.; Sinauer Associates: Sunderland, MA, USA, 2014; ISBN 978-1-60535-255-8. [Google Scholar]
  22. Mengel, K.; Kirkby, E.A.; Kosegarten, H.; Appel, T. Principles of Plant Nutrition, 5th ed.; Springer: Berlin/Heidelberg, Germany, 2001. [Google Scholar] [CrossRef]
  23. Karthika, K.S.; Rashmi, I.; Parvathi, M.S. Biological functions, uptake and transport of essential nutrients in relation to plant growth. In Plant Nutrients and Abiotic Stress Tolerance; Hasanuzzaman, M., Fujita, M., Oku, H., Nahar, K., Hawrylak, B., Eds.; Springer: Berlin/Heidelberg, Germany, 2018; pp. 1–49. [Google Scholar] [CrossRef]
  24. Alcántar, G.G.; Trejo, T.L.I.; Fernández, P.L.; Rodríguez, M.M. Elementos esenciales. In Nutrición de Cultivos, 2nd ed.; Alcántar, G.G.L.I., Trejo, T.Y.F.C., Gómez, M., Eds.; Colegio de Postgraduados: México City, Mexico, 2016; p. 2355. ISBN 978-607-715-324-5. [Google Scholar]
  25. Romheld, V. Diagnosis of deficiency and toxicity of nutrients. In Marschner’s Mineral Nutrition of Higher Plants, 3rd ed; Marschner, H., Ed.; Academic Press: London, UK, 2012; pp. 299–312. [Google Scholar] [CrossRef]
  26. Tanoi, K.; Kobayashi, N. Leaf senescence by magnesium deficiency. Plants 2015, 4, 756–772. [Google Scholar] [CrossRef]
  27. Engels, C.; Kirkby, E.; White, P. Mineral Nutrition, Yield and Source-Sink Relationships. In Marschner’s Mineral Nutrition of Higher Plants, 3rd ed.; Marschner, H., Ed.; Academic Press: London, UK, 2012; pp. 85–133. [Google Scholar] [CrossRef]
  28. Soares, S.M.P.; Mendoca, F.M.S.; Cesar, S.P.; Cordeiro, A.J.C.; Silva, J.T. Capsicum annuum var. Annuum under macronutrients and boron deficiencies: Leaf content and visual symptomps. J. Plant Nutr. 2019, 5, 417–427. [Google Scholar] [CrossRef]
  29. White, P.J. Ion uptake mechanisms of individual cells and roots: Short-distance transport. In Marschner’s Mineral Nutrition of Higher Plants, 3rd ed.; Marschner, H., Ed.; Academic Press: London, UK, 2012; pp. 7–47. [Google Scholar] [CrossRef]
  30. Farhat, N.; Elkhouni, A.; Zorrig, W.; Smaoui, A.; Abdelly, C.; Rabhi, M. Effects of magnesium deficiency on photosynthesis and carbohydrate partitioning. Acta Physiol. Plant. 2016, 145. [Google Scholar] [CrossRef]
  31. Guo, W.; Nazim, H.; Liang, Z.; Yang, D. Magnesium deficiency in plants: An urgent problem. Crop. J. 2016, 2, 83–91. [Google Scholar] [CrossRef]
  32. Lima, T.C.; Freitas, M.S.M.; Mendonça, L.V.P.; Gonçalves, Y.D.S.; Pereira, J.A.P.; Lima, K.F. Visual symptoms of macronutrient and boron deficiency in Cymbopogon citratus. J. Plant Nutr. 2019, 13, 1430–1438. [Google Scholar] [CrossRef]
  33. Rhodes, R.; Miles, N.; Charles, H.J. Interactions between potassium, calcium and magnesium in sugarcane grown on two contrasting soils in South Africa. Field Crop. Res. 2018, 225, 1–11. [Google Scholar] [CrossRef]
  34. Veígas, I.D.J.M.; Sousa, G.O.D.; Silva, A.F.D.; Carvalho, J.G.D.; Lima, M.M. Mineral composition and visual symptoms of nutrients deficiencies in long pepper plants (Piper hispidinervum C. DC.). Acta Amazon. 2013, 1, 43–50. [Google Scholar] [CrossRef]
  35. Veígas, I.J.M.; Silva, L.A.K.; Silva, R.M.F.; Morais, C.R.L.; Capucho, F.D.A.; Oliveira, N.C.F.; Oliveira, C.H.E.; Silva, G.E.M.; Ruffeil, A.G.A.; Poliana, S.S. Visual symptoms and growth parameters linked to deficiency of macronutrients in young Swietenia macrophylla plants. J. Food Agric. Environ. 2012, 1, 937–940. [Google Scholar] [CrossRef]
  36. Ribeiro, C.A.C.; Gomes, W.L.; Loges, V.; Arruda, C.M.F.; Souza, A.F.A. Macronutrients deficiency in Heliconia psittacorum × Heliconia spathocircinata ‘Golden Torch’. Rev. Ciência Agron. 2015, 2, 258–265. [Google Scholar] [CrossRef]
  37. Rodríguez, M.M.N.; Tejo, T.L.I.; Alcántar, G.G. Acceso, absorción y transporte nutrimental. In Nutrición de Cultivos, 2nd ed.; Alcántar, G.G.L.I., Trejo, T.Y.F.C., Gómez, M., Eds.; Colegio de Postgraduados: México City, Mexico, 2016; pp. 153–182. ISBN 978-607-715-324-5. [Google Scholar]
  38. Brown, P. Seasonal variations in fig (Ficus carica L.) leaf nutrient concentrations. HortScience 1994, 8, 871–873. [Google Scholar] [CrossRef]
  39. Moreno, D.A.; Pulgar, G.; Víllora, G.; Romero, L. Nutritional diagnosis of fig tree leaves. J. Plant Nutr. 1998, 12, 2579–2588. [Google Scholar] [CrossRef]
  40. Sun, R.; Sun, L.; Jia, M. Analysis of psoralen and mineral elements in the leaves of different fig (Ficus carica L.) cultivars. Acta Hort. 2017, 1173, 293–296. [Google Scholar] [CrossRef]
  41. Mendoza, C.V.M.; Pineda, P.J.; Vargas, C.J.M.; Hernández, A.E. Nutrition of fig (Ficus carica L.) under hydroponics and greenhouse conditions. J. Plant Nutr. 2019, 11, 1350–1365. [Google Scholar] [CrossRef]
Figure 1. Visual symptoms of macronutrient deficiency in fig tree leaves. (a) Control; (b) N deficiency; (c) P deficiency; (d) K deficiency; (e) Ca deficiency; (f) Mg deficiency.
Agronomy 09 00787 g001
Figure 2. Effect of macronutrient deficiency on the number of leaves (a) and leaf area (b) in two periods. Different letters between the columns for each period indicate significant difference (Tukey, p < 0.05). The lines on the bars indicate the standard error of the mean. n = 4.
Agronomy 09 00787 g002
Figure 3. Relative content of chlorophyll, expressed in SPAD units in the low, medium, and high strata of fig tree plants. Different letters between the columns for each stratum indicate significant difference (Tukey, p < 0.05). ns, not significant. The lines on the bars indicate the standard error of the mean. n = 4.
Agronomy 09 00787 g003
Table 1. Nutrient solution used in the experiment.
MacronutrientsMicronutrients
Elementmmol L−1 Elementmg L−1
N12Fe2.8
P1.3Mn0.55
K4B0.54
Ca4Cu0.064
Mg1.5Zn0.065
S1.5Mo0.048
Table 2. Vegetative growth of fig tree plants under macronutrient deficiency.
TreatmentS.E. (cm week−1)P.H. (cm)S.D. (mm)I.L. (cm)Dry Weight
RootsStemLeaves
Control6.47 a102.4 ab13.72 b3.34 a121.1 a114.1 a 87.46 a
-N1.15 b35.08 d8.40 d1.39 c27.47 c23.03 b10.93 c
-P4.05 ab74.88 c11.81 c2.64 ab66.27 bc70.00 ab53.56 b
-K5.70 a96.84 b12.58 c3.19 ab44.37 bc109.9 a55.20 b
-Ca3.28 ab69.31 c11.63 c2.30 bc54.47 bc66.93 ab36.10 bc
-Mg5.64 a111.0 a14.94 a3.37 a81.14 ab70.26 ab55.86 b
S.E. = Stem Elongation; P.H. = Plant Height; S.D. = Stem Diameter; I.L. = Internodes Length. Different letters in each column indicate significant difference (Tukey, p < 0.05) n = 4.
Table 3. Content of N, P, K, Ca, and Mg in leaf, stem a root of fig tree plants with macronutrient deficiency.
TreatmentConcentration (%)
NPKCaMg
Leaf
Control2.54 a0.16 c1.7 a2.90 a0.48 b
-N1.68 b0.31 ab1.6 a2.05 b0.32 bc
-P2.98 a0.22 bc1.38 a2.17 b0.47 b
-K2.77 a0.32 a0.22 b2.33 ab0.99 a
-Ca2.95 a0.21 bc1.47 a2.01 b0.49 b
-Mg2.67 a0.22 bc1.62 a2.18 b0.26 c
Stem
Control1.65 b0.22 a0.65 bc0.65 ab0.25 ab
-N0.82 c0.27 a0.54 cd0.68 ab0.19 c
-P1.30 b0.13 b0.70 b0.71 ab0.22 bc
-K1.52 b0.29 a0.26 e0.77 a0.23 abc
-Ca2.18 a0.28 a0.46 d0.56 b0.28 a
-Mg1.48 b0.26 a0.84 a0.78 a0.20 bc
Root
Control2.46 ns0.51 b0.97 ab1.43 a0.38 a
-N1.92 ns0.49 b0.74 cd1.14 ab0.25 b
-P2.26 ns0.23 c0.88 bc1.41 a0.39 a
-K2.24 ns0.52 b0.28 e1.17 ab0.28 b
-Ca2.44 ns0.58 b0.68 d0.65 b0.29 b
-Mg2.06 ns0.86 a1.12 a1.35 a0.22 b
Different letters between columns for each part of plant indicate significant difference (Tukey, p < 0.05) n = 3.
Table 4. Content of Fe, B, Mn, Zn, and Cu in leaf, stem a root of fig tree plants with macronutrient deficiency.
TreatmentConcentration (mg kg−1 DW)
FeBMnZnCu
Leaf
Control914.2 a151.5 ab148.9 b45.15 a6.16 ab
-N456.5 b143.7 ab92.59 b28.93 b4.47 c
-P600.6 ab105.7 b107.9 b38.15 ab6.85 a
-K497.3 b111.7 b253.4 a34.51 ab5.17 bc
-Ca660.0 ab175.4 a275.5 a43.84 a4.80 bc
-Mg655.7 a126.6 ab130.3 b36.71 ab4.77 bc
Stem
Control118.1 b23.66 ns31.85 bc9.66 ab2.84 cd
-N112.9 b23.85 ns14.04 d8.71 b4.47 a
-P96.15 b25.55 ns16.32 cd12.37 a3.73 ab
-K205.4 a25.39 ns65.81 a10.84 ab4.08 a
-Ca156.6 ab25.58 ns80.50 a11.75 ab2.30 d
-Mg157.9 ab29.95 ns34.96 b9.66 ab3.15 bc
Root
Control1135.1 ns40.70 a103.4 cd30.09 ns18.78 bc
-N1377.8 ns21.95 b56.86 cd44.03 ns33.45 a
-P1061.1 ns38.46 a39.86 d42.83 ns27.36 ab
-K1434.3 ns29.61 ab221.8 a39.47 ns28.26 ab
-Ca1263.4 ns29.88 ab191.4 ab47.88 ns20.33 bc
-Mg890.3 ns30.58 ab131.9 bc34.97 ns13.73 c
Different letters between columns for each part of plant indicate significant difference. (Tukey, p < 0.05) n = 3.

