Article

Genotype-Environment Interaction: Trade-Offs between the Agronomic Performance and Stability of Dual-Purpose Sorghum (Sorghum bicolor L. Moench) Genotypes in Senegal

1
Institut Sénégalais de Recherches Agricoles (ISRA), Centre National de Recherches Agronomiques (CNRA) de Bambey, Bambey BP 53, Senegal
2
Centre d’Etude Régional pour l’Amélioration de l’Adaptation à la Sécheresse (CERAAS), Route de Khombole, Thiès BP 3320, Senegal
3
AGAP, Univ de Montpellier MUSE, CIRAD, INRA, 34090 Montpellier SupAgro, France
4
International Center for Agricultural Research for Development (CIRAD), UMR AGAP, Bobo-Dioulasso, Burkina Faso
5
Institut de l’Environnement et de la Recherche Agricole (INERA), Bobo Dioulasso 01 BP 910, Burkina Faso
6
International Crops Research Institute for Semi-Arid Tropics (ICRISAT), Bamako BP 320, Mali
7
Institut Togolais de Recherche Agronomique (ITRA), Lomé B.P. 1163, Togo
8
Département de Biologie Végétale, Université Cheikh Anta Diop de Dakar (UCAD), Dakar Fann BP 5005, Senegal
9
Unité Mixte de Recherche Internationale Environnement, Santé, Sociétés (UMI 3189 ESS), Université Cheikh Anta Diop de Dakar (UCAD), Dakar Fann BP 5005, Senegal
10
International center for agricultural research for development (CIRAD), Ampandrianomby BP853, Antananarivo 101, Madagascar
*
Authors to whom correspondence should be addressed.
Submission received: 27 August 2019 / Revised: 20 November 2019 / Accepted: 21 November 2019 / Published: 10 December 2019

Abstract

:
Introducing sorghum (Sorghum bicolor L. Moench) genotypes into new environments is necessary for expanding the production of food and fuel, but these efforts are complicated by significant genotype × environment interactions that can reduce their effectiveness. This study set out to thoroughly analyze genotype × environment interactions and assess trade-offs between the agronomic performance and the stability of grain and biomass yields of ten contrasting genotypes under Sudano-Sahelian conditions. Experiments were carried out in a randomized complete block design with four replicates. They were conducted from 2013 to 2016 in Bambey, Sinthiou Malem and Nioro du Rip in Senegal. The joint analysis of variance revealed a highly significant effect (p < 0.0001) of genotypes (G), environments (E) and G × E interaction. Most genotypes showed specific adaptations. The best grain yields were obtained by the Nieleni and Fadda hybrids, while the improved varieties IS15401 and SK5912 were best for biomass production. An Additive Main effect and Multiplicative Interaction (AMMI) analysis showed that good grain yields were associated with environments having good soil fertility and good rainfall, while biomass yields were more influenced by the sowing date and rainfall. Similarly, we were able to confirm for our 10 sorghum genotypes that yield stability was generally associated with low performance, except for the Nieleni and Fadda hybrids, which performed well for grain and biomass production regardless of the environment. The Senegalese control genotype, 621B, showed particular susceptibility to growing conditions (soil), but remained very productive (more than 3 tons per hectare) under good agro-pedological conditions. These results lead us to recommend the Fadda and Nieleni hybrids for the entire study region, while 621B can also be recommended, but only for highly specific environments with good soils.

1. Introduction

Sorghum (Sorghum bicolor (L.) Moench) is one of the main cereals grown in arid and semi-arid tropical regions [1]. Sorghum is well-adapted to warm regions and, given its plasticity, is able to grow in both temperate and tropical regions. With a global production of about 68.9 million tons in 2015, from around 49.9 million hectares, sorghum ranks fifth in cereal production after maize, wheat, rice and barley [2]. It is mainly used for animal feed in most developed countries, but in Africa and India it is a staple food for millions of people [3]. In addition, sorghum is one of the most important crops that can be used for bioethanol production [4]. In Senegal, after pearl millet and maize, sorghum is the third most important dryland cereal crop, with an estimated total area of more than 221,329 ha for a national production of 225,865 tons and a mean yield of 1,020 kg ha−1 [5]. Sorghum production is essential for subsistence agriculture [6]. However, its production comes up against several constraints that lead to low yields, such as irregularities in rainfall distribution exacerbated by climate change, low soil fertility and sandy soils, and various crop diseases and pests [7].
Food security initiatives in Senegal include introducing new sorghum genotypes adapted to different soil and climate environments. However, when genotypes are evaluated for recommendation, a common problem arises: the high variability of their productivity from year to year and from environment to environment. Such variability creates difficulty in determining which genotypes can be recommended, so it deserves careful consideration. The different responses of a genotype in different environments are known as genotype × environment interaction (G × E). Understanding G × E interaction will help to (1) identify genotypes with a stable performance in fairly diverse growing conditions, and (2) match specific genotypes to specific environments [8].
Several statistical methods have been developed to characterize the effect of G × E interactions of genotypes and to predict phenotypic responses to environmental changes. However, statistical methods for characterizing stability are generally not able to provide an accurate and complete response model for this interaction [9], as the genotypic response to environmental variation is multivariate, while most stability indices have a univariate response [10]. Other methods have therefore been developed to explore G × E interaction models. Of these, the AMMI is a robust multivariate method for multi-environmental trials [11]. The additive main effect and multiplicative interaction (AMMI) method combines an analysis of variance (ANOVA) and a principal component analysis (PCA) in a unified approach that can be used to analyze multi-location trials [12,13,14]. The ANOVA studies the main effects of genotypes and environments and the principal component analysis (PCA) then focuses on the non-additive part of the model representing interaction (G × E). AMMI provides the G × E interaction sum of squares with a minimum number of degrees of freedom. In addition, AMMI concurrently quantifies the contribution of each genotype and environment to G × E interaction, and provides an easy graphical interpretation of the results using a biplot technique to classify genotypes and environments together [12,15]. This technique can therefore be used to identify productive genotypes with wide adaptability and mega-environments, and to delimit environments in which genotypes have specific adaptability [14,15,16].
The objective of this study was to: (1) analyze the genotype × environment interactions, adaptability and stability of 10 sorghum genotypes in several environments in Senegal using the AMMI method, and (2) identify genotypes that performed well in terms of grain and/or biomass yield (i.e., dual-purpose: food and feed).

2. Materials and Methods

2.1. Study Sites

The experiments were conducted during the rainy seasons in 2013, 2014, 2015 and 2016 at three locations in Senegal: the research stations in Sinthiou Malem (in 2013, 2014, 2015 and 2016), Bambey (in 2013) and Nioro du Rip (in 2015). The characteristics of the different sites are given in Table 1. Figure 1 shows the rainfall and temperature in the three locations over the trial period. Bambey is subject to a typical Sahelian climate characterized by a long 8 to 9-month dry season and a 3 to 4-month rainy season. Rainfall varies greatly from one year to another. The dominant soils are sandy with a very low water retention capacity of 80 to 100 mm m−1 [17,18,19]. The Nioro du Rip and Sinthiou Malem stations are located at the interface between the Sahel and Sudanese zones. They benefit from a 4 to 5-month rainy season that is wetter than in Bambey. They are also characterized by strong inter-annual variability. The soils remain predominantly sandy but have slightly higher clay and silt contents, with a water retention capacity ranging from 90 to 120 mm.m−1 [20,21,22].

2.2. Plant Material

The plant material consisted of ten genotypes from various regions of West and Central Africa, each of which was known to perform well in its area of origin. They were selected to make up a contrasting sample in terms of crop cycle duration (each adapted to its target region), morphology (height, stem diameter in particular), structural characteristics (lignin, cellulose), and grain and biomass production. The characteristics of these ten genotypes are presented in Table 2.

2.3. Trial Management

Tillage at each site consisted of cross plowing with discs (depth about 25 cm) followed by harrowing. The seeds were treated with Granox (a combination of captafol-benomyl and carbofuran). Sowing was always carried out after a good rain event (Table 1). Crops were sown in hills with 5-6 seeds per hole, with 0.80 m spacing between rows and 0.20 m spacing between the hills along each row (i.e., planting density of 62,500 hills ha−1). Around 15 days after emergence, the plots were thinned to one plant per hill. Mineral fertilizers were applied according to the research institute recommendation in Senegal: 150 kg ha−1 of N-P-K (15-10-10) at sowing or emergence, and 100 kg ha−1 urea applied twice, 50 kg ha−1 just after thinning and 50 kg ha−1 during vegetative growth. Weeding, pesticide and insecticide treatments (Decis and Dimethoate), and protection against birds, were provided as required to minimize the impact on crop growth and grain loss. Anti-erosion bunds were installed around the trials to limit runoff.

2.4. Experimental Design and Data Collection

All the trials were laid out in the same Randomized Complete Blocks design with four replicates (randomization was different from one trial to another), each containing the ten genotypes. This gave a total of 40 plots per trial. Each plot consisted of 7 rows of 40 hills, occupying an area of 44.8 m2 (5.6 m × 8 m). At physiological maturity, plants were sampled from a well delimited 3.36 m2 (3 rows × 7 hills) sub–plot to assess biomass (leaves and stems) and grain yields. Biomass dry weight was determined after air–drying in a greenhouse, followed by 48 h in an oven at 65 °C, and grain dry weight after panicle threshing. Grain and dry biomass yields were calculated in kg ha−1.

2.5. Data Analysis

An initial analysis of variance was performed for each environment – defined in this study as an experimental situation, i.e., a site–year–seedling–date combination (11 in total), to verify the existence of differences between genotypes. Subsequently, a combined analysis of variance was conducted, considering the effect of the genotype and the environment as fixed, according to the following statistical model:
Y i j k = μ + G i + E j + B k ( E j ) + ( G E ) i j + ε i j k
where Yijk represents the ith genotype in the jth environment and the kth block; µ is the overall mean; Bk (Ej) corresponds to the block within the jth environment and in the kth block; Gi is the effect of the ith genotype; Ej is the effect of the jth environment; (GE)ij is the effect of interaction of the ith genotype with the jth environment; and εijk is the effect of experimental error. The homogeneity between residual variances was tested using Bartlett’s test [23].
Lastly, adaptability and phenotypic stability analyses were performed by the AMMI method as described in Zobel et al. [12] using the following statistical model:
Y i j = μ + g i + e j + k = n n λ k   α i k y j k + r i j + ε i j
where Yij is the mean response of genotype i in environment j; μ is the overall mean; gi is the fixed effect of genotype i (i = 1, 2, … g); ej is the fixed effect of environment j (j = 1, 2, … e); εij is the average experimental error; G × E interaction is represented by the factors; λk is a unique value of the kth interaction principal component axis (IPCA), (k = 1, 2, … p, where p is the maximum number of estimable main components), αik is a singular value for the ith genotype in the kth IPCA, yjk is a unique value of the jth environment in the kth IPCA; rij is the error for G × E interaction.
The sum of squares for G × E interaction was divided into n singular axes or main components of interaction (IPCA), which described the standard portion (ANOVA), with each axis corresponding to an AMMI model. Generally, when G × E interactions are significant, AMMI models with one or two main axes (AMMI1 and AMMI2 models respectively) are the most commonly used because of their simplicity in biplot graph representations. Biplot graph interpretation is based on the variation of the additive main effects (genotype and environment) and the multiplier effect of G × E interaction. According to Zobel et al. [12], for the AMMI2 graph, genotypes that have low scores on IPCA1 (first interaction principal component axis) or IPCA2 (second interaction principal component axis) or both, contribute little to the interaction. This indicates a general adaptation. On the other hand, those with high scores, be it positive or negative, have strong interactions and are specifically adapted to the environment that has the same sign score.
To identify genotypes showing the best trade–offs between grain and biomass yield (dual–purpose potential), genotype performance was compared to the overall mean in a scatterplot via the IPO index described below:
I P O = Y i j Y ¯ Y ¯
where IPO = potential index of a given genotype i for grain (or biomass) yield for a given environment j; Yij = grain (or biomass) yield of a given genotype i for a given environment j; Y ¯ = Overall mean grain (or biomass) yield (all environments and genotypes included). Thus, for a given environment j, a positive IPO (IPO > 0) of a genotype i for grain or biomass yield indicates the good potential of this genotype i for this environment j. Conversely if the IPO of a genotype i is negative for grain or biomass yield, it indicates poor potential for grain or biomass, respectively. Positive (or negative) IPO values for a given genotype i for both grain and biomass yield will therefore indicate good (or poor) dual–purpose potential. Principal component analysis (PCA) associated with a Hierarchical clustering analysis were performed for the characterization of the study environments. All statistical analyses were performed using R version 3.2 software [24].

3. Results

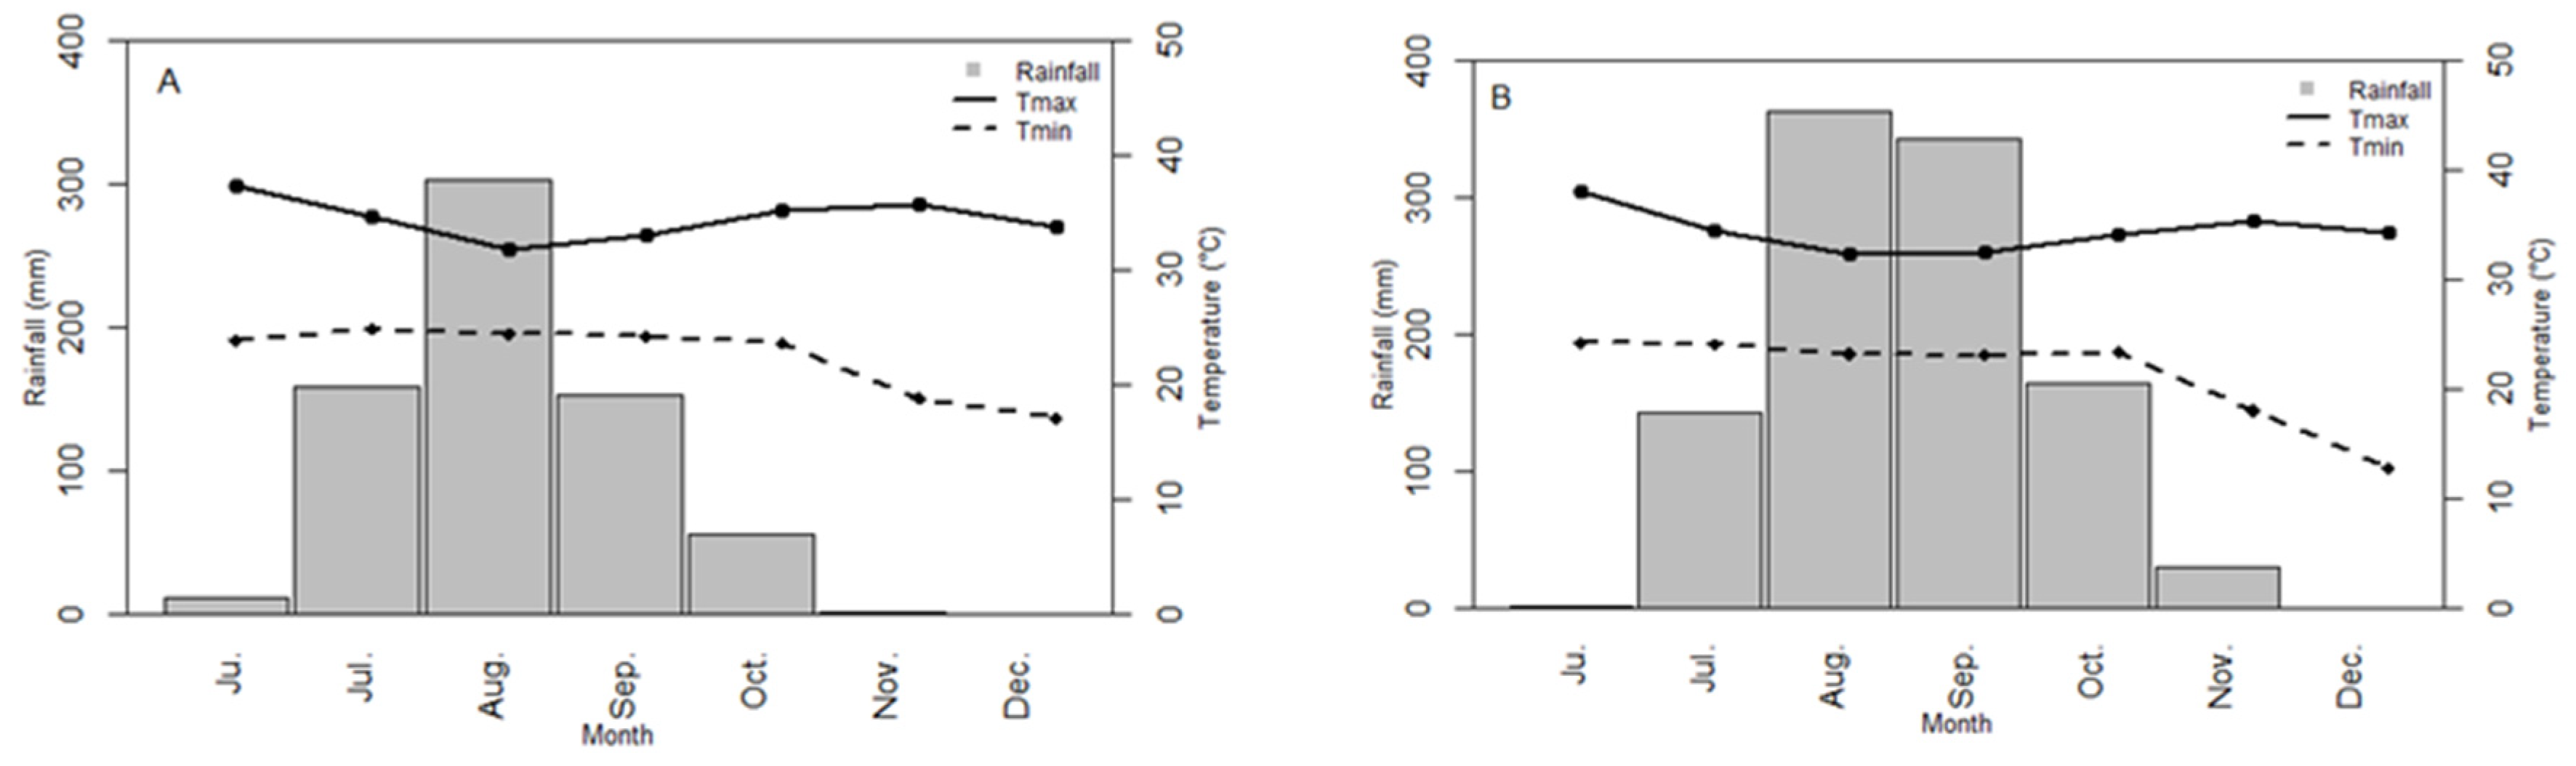
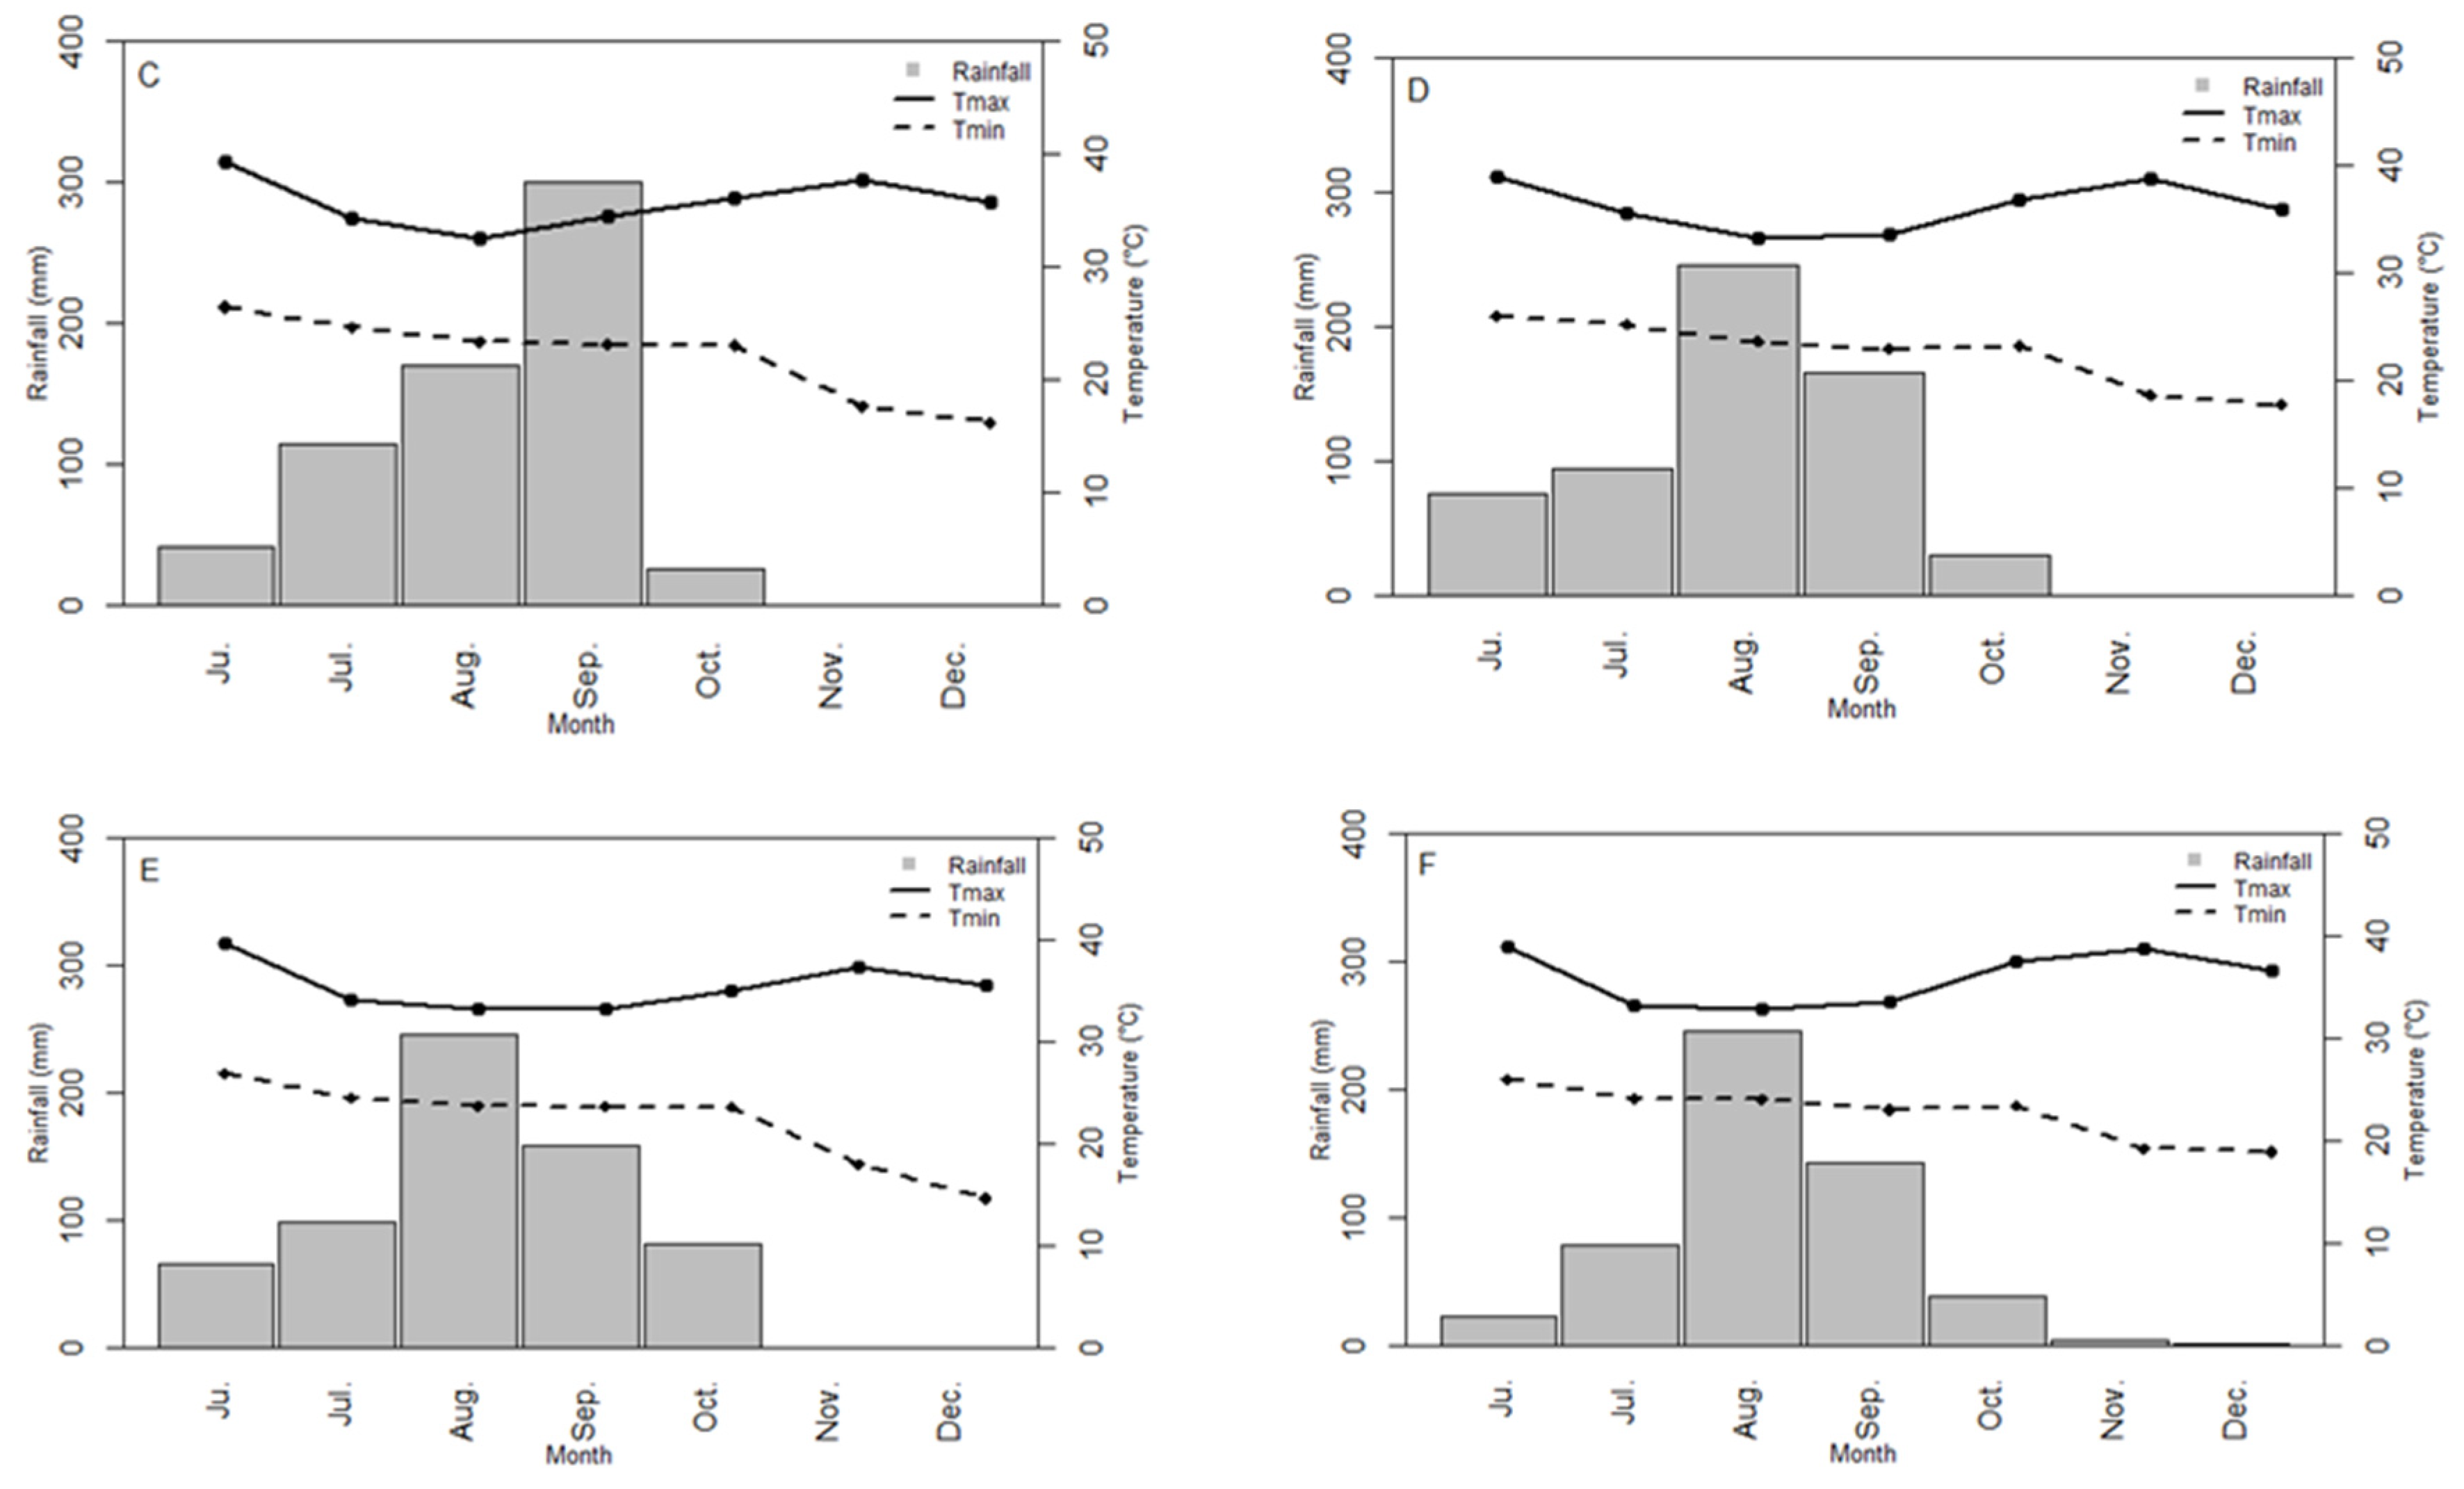
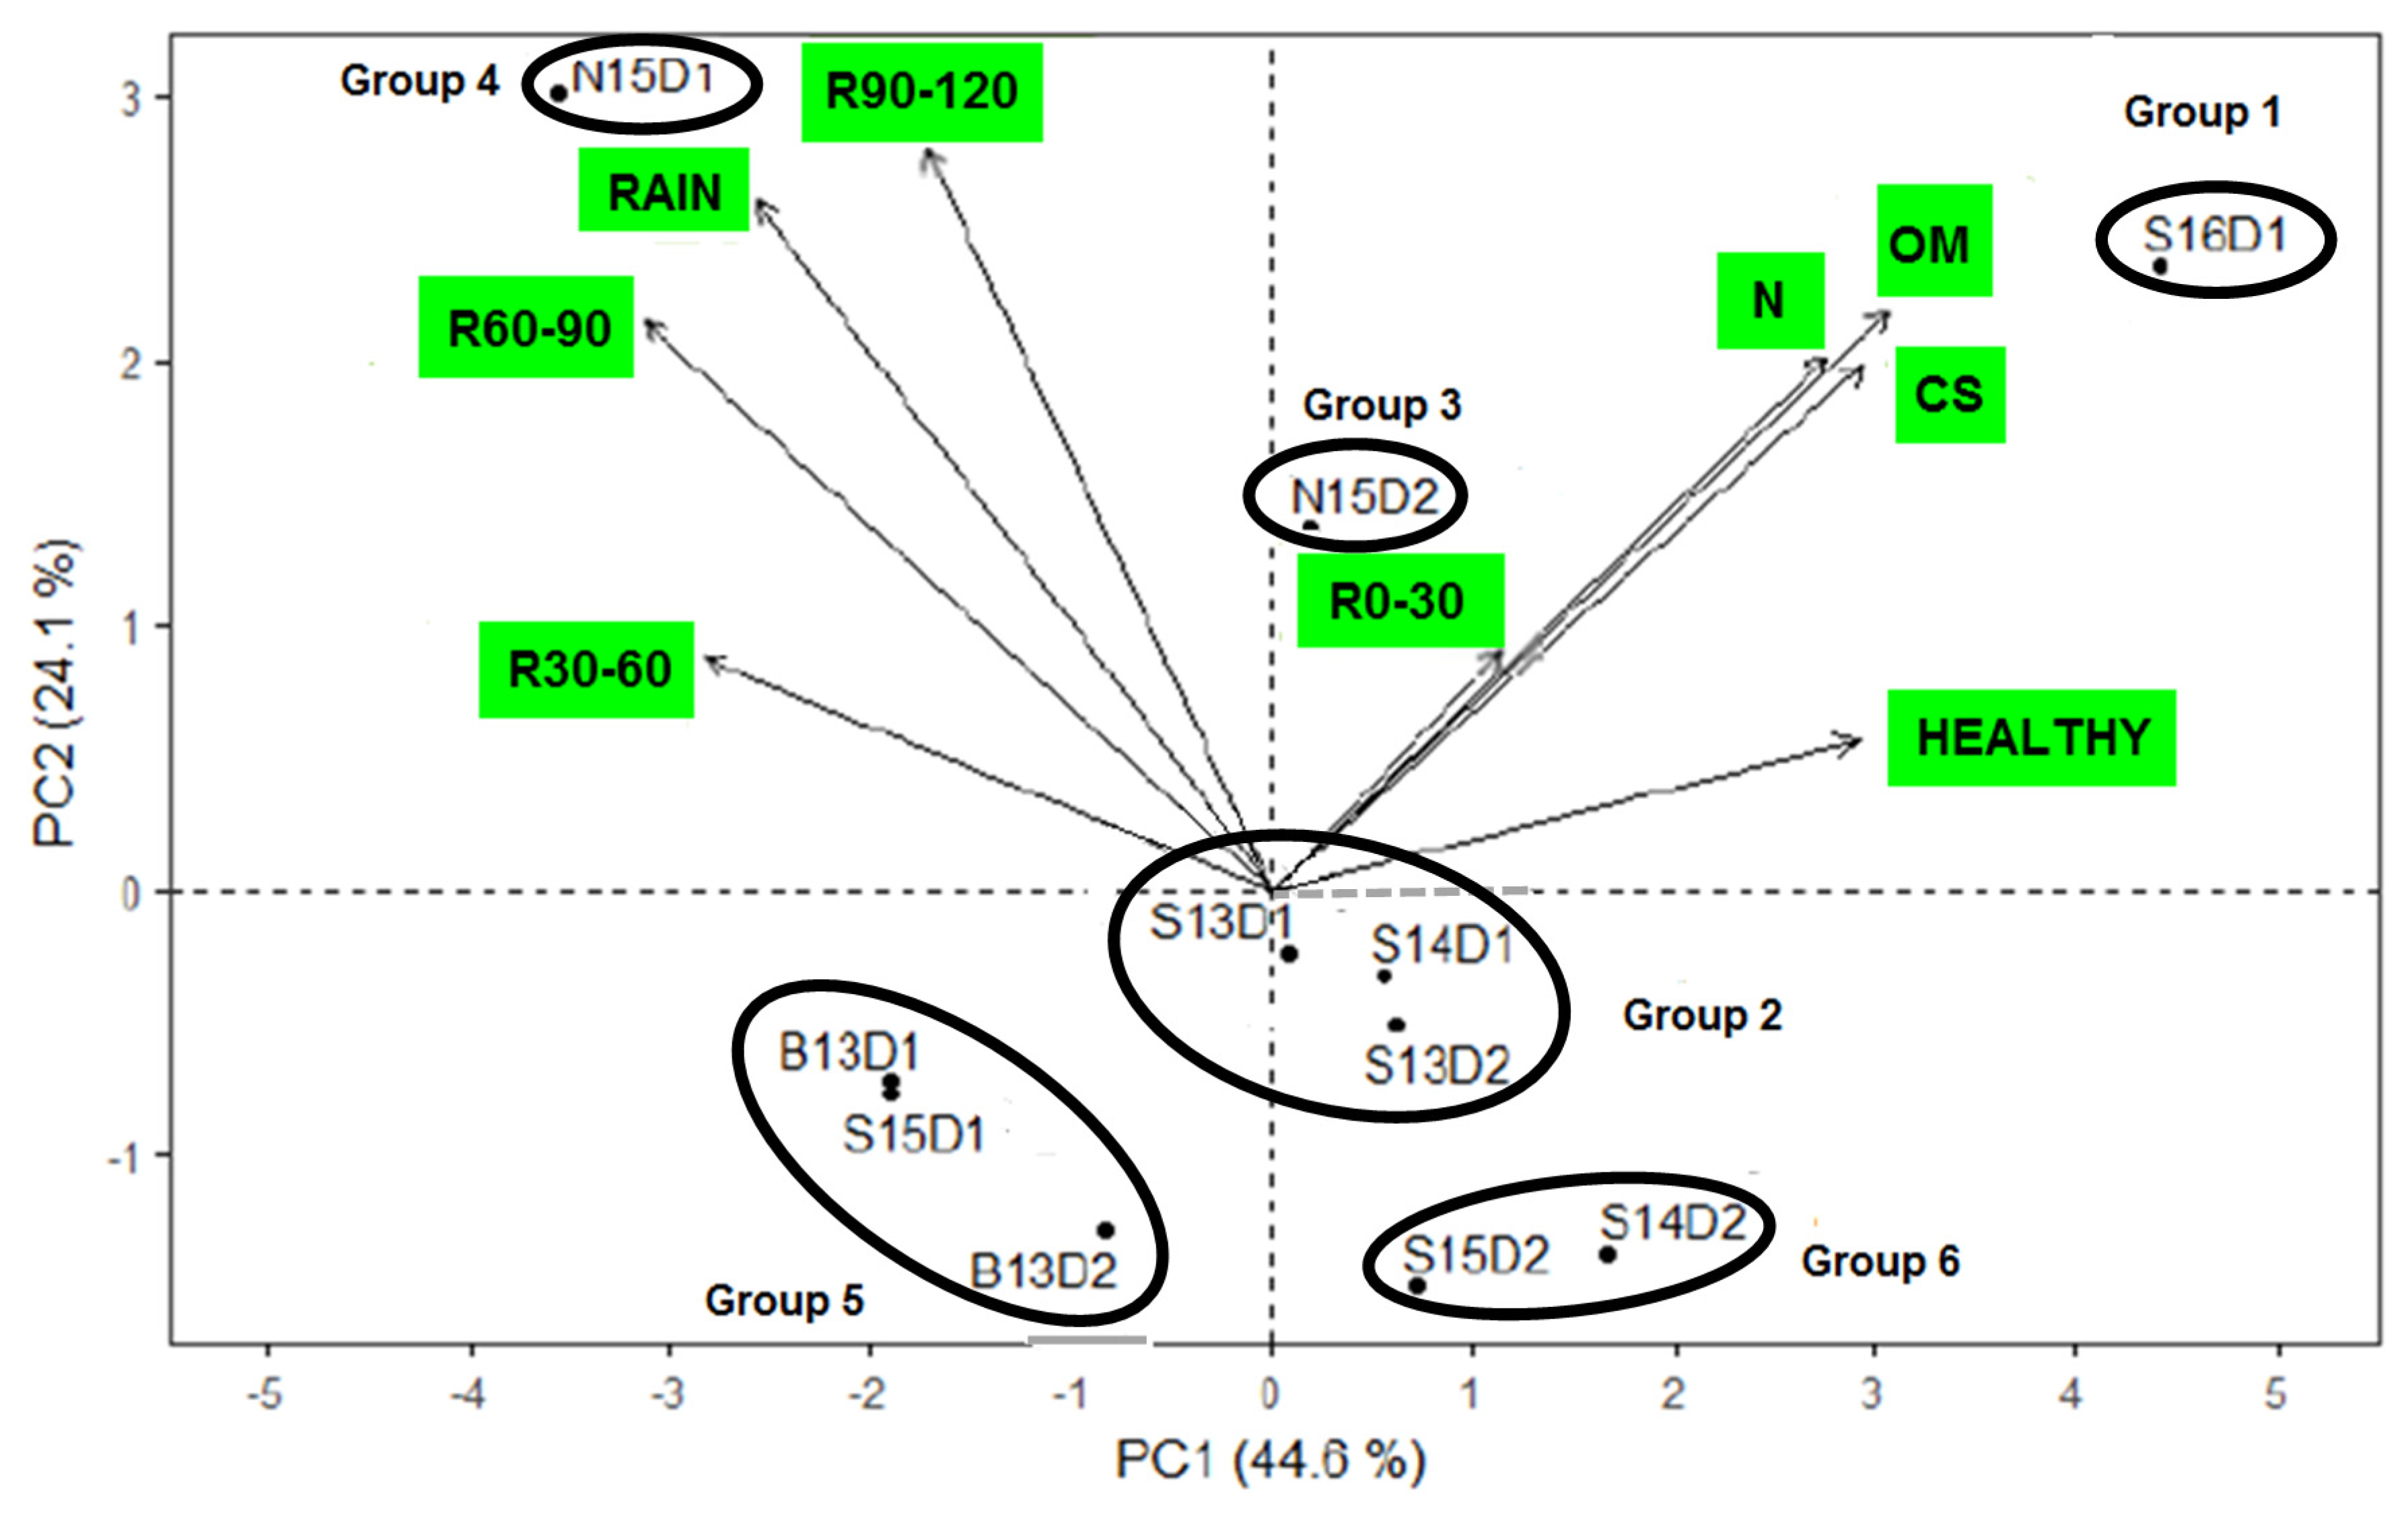
3.1. Environment Characterization

The environments were characterized by quantitative and qualitative indicators of soil fertility, rainfall distribution during the growing cycle and the overall presence of diseases (chlorosis and plant necrosis causing heterogeneity in the field) (Table 1). The values of the indicators for each environment were summarized through a principal component analysis: this showed that 68.7 % of the initial information provided was returned (Figure 2). The PC1 axis tends to be correlated to soil fertility and the presence of diseases and the PC2 axis tends to be correlated to certain rainfall variables. The environments studied could be classed in six groups according to the two axes, PC1 and PC2:
Group 1: environments characterized by very good soil fertility, an absence of disease and low overall rainfall, but well distributed. Only S16D1 belonged to this group
Group 2: environments with relatively good soil fertility and almost no disease, and high rainfall. Only N15D2 belonged to this group
Group 3: characterized by very humid environments throughout the cycle, low soil fertility and the presence of diseases at a moderate level. Only N15D1 belonged to this group;
Group 4: environments characterized by good total rainfall, an early end of rainfall, relatively good soil fertility and an absence of disease. This group included environments S13D1, S13D2 and S14D1
Group 5: environments with many constraints: very low soil fertility, high disease occurrence and low rainfall at the end of the cycle. Environments B13D1, B13D2 and S15D1 belonged to this group
Group 6: this group was characterized by low soil fertility, low rainfall during the cycle, low rainfall accumulation at the end of the cycle, but a lower disease occurrence compared to group 5. This group included environments S14D2 and S15D2.

3.2. Effects of Genotypes, Environments and Genotype × Environment Interactions

The results of the combined ANOVA and of the AMMI are presented in Table 3. The genotype, environment and G × E interaction effects were significant for grain and biomass yields (p < 0.001). The mean grain yield of the genotypes ranged from 2018 kg ha−1 (Nieleni) to 807 kg ha−1 (SK5912). The genotypes performed differently in all the environments, except Fadda and Nieleni, which performed relatively better in all environments (Figure 3). Three genotypes had a higher mean yield than the overall mean (1454 kg ha−1): Nieleni, Fadda and Pablo, with yields of 2018 kg ha−1, 1833 kg ha−1, and 1615 kg ha−1, respectively. The three genotypes with the poorest performance were F2–20, Grinkan and SK5912, with mean grain yields of 1333 kg ha−1, 1281 kg ha−1 and 807 kg ha−1, respectively. Mean grain yields across the environments (Table 4) ranged from 530 kg ha−1 (B13D2) to 2313 kg ha−1 (S16D1). Six of the eleven environments exceeded the overall mean: S16D1 (2313 kg ha−1), N15D2 (1,766 kg ha−1), S13D1 (1714 kg ha−1), S14D1 (1696 kg ha−1), N15D1 (1610 kg ha−1) and S13D2 (1570 kg ha−1).
With respect to biomass yield, mean yields per genotype ranged from 10,478 kg ha−1 (IS15401) to 4384 kg ha−1 (621B). The genotypes performed differently in all the environments, except IS15401 and SK5912, which performed relatively better in all the environments (Figure 4). Three out of the ten genotypes had a higher mean yield than the overall mean (6954 kg ha−1): IS15401, SK5912 and Fadda, with respective values of 10,364 kg ha−1, 10,115 kg ha−1 and 7995 kg ha−1. Mean yields across the environments ranged from 9536 kg ha−1 (B13D2) to 4923 kg ha−1 (S15D2). Five environments exceeded the overall mean: B13D2, S14D1, B13D1, S16D1 and N15D1, with respective yields of 9533 kg ha−1, 9129 kg ha−1, 8055 kg ha−1, 7852 kg ha−1 and 7660 kg ha−1 (Table 5).
The AMMI analysis of variance of ten genotypes tested in eleven environments for grain yield showed that the main effect of genotypes and environments accounted for 17.9% and 39.6% of the variation respectively, and the G × E interaction effect amounted to 33.8%. For biomass yield, 36.7%, 21.2% and 28.8% of the total sum of squares were attributed to genotype, environment and G × E interaction effects, respectively. For the decomposition of the G × E interaction according to the AMMI model, the analysis showed that the first two main components of the interaction were significant (Table 4) for both yields. The first two main components explained 60.3% and 76.2% respectively of the sum of squares for grain and biomass yields (IPCA1 and IPCA2). These results indicated that genotype and environment scores on the first two main components of the interaction explained almost all of the interaction that occurred in the data matrix.

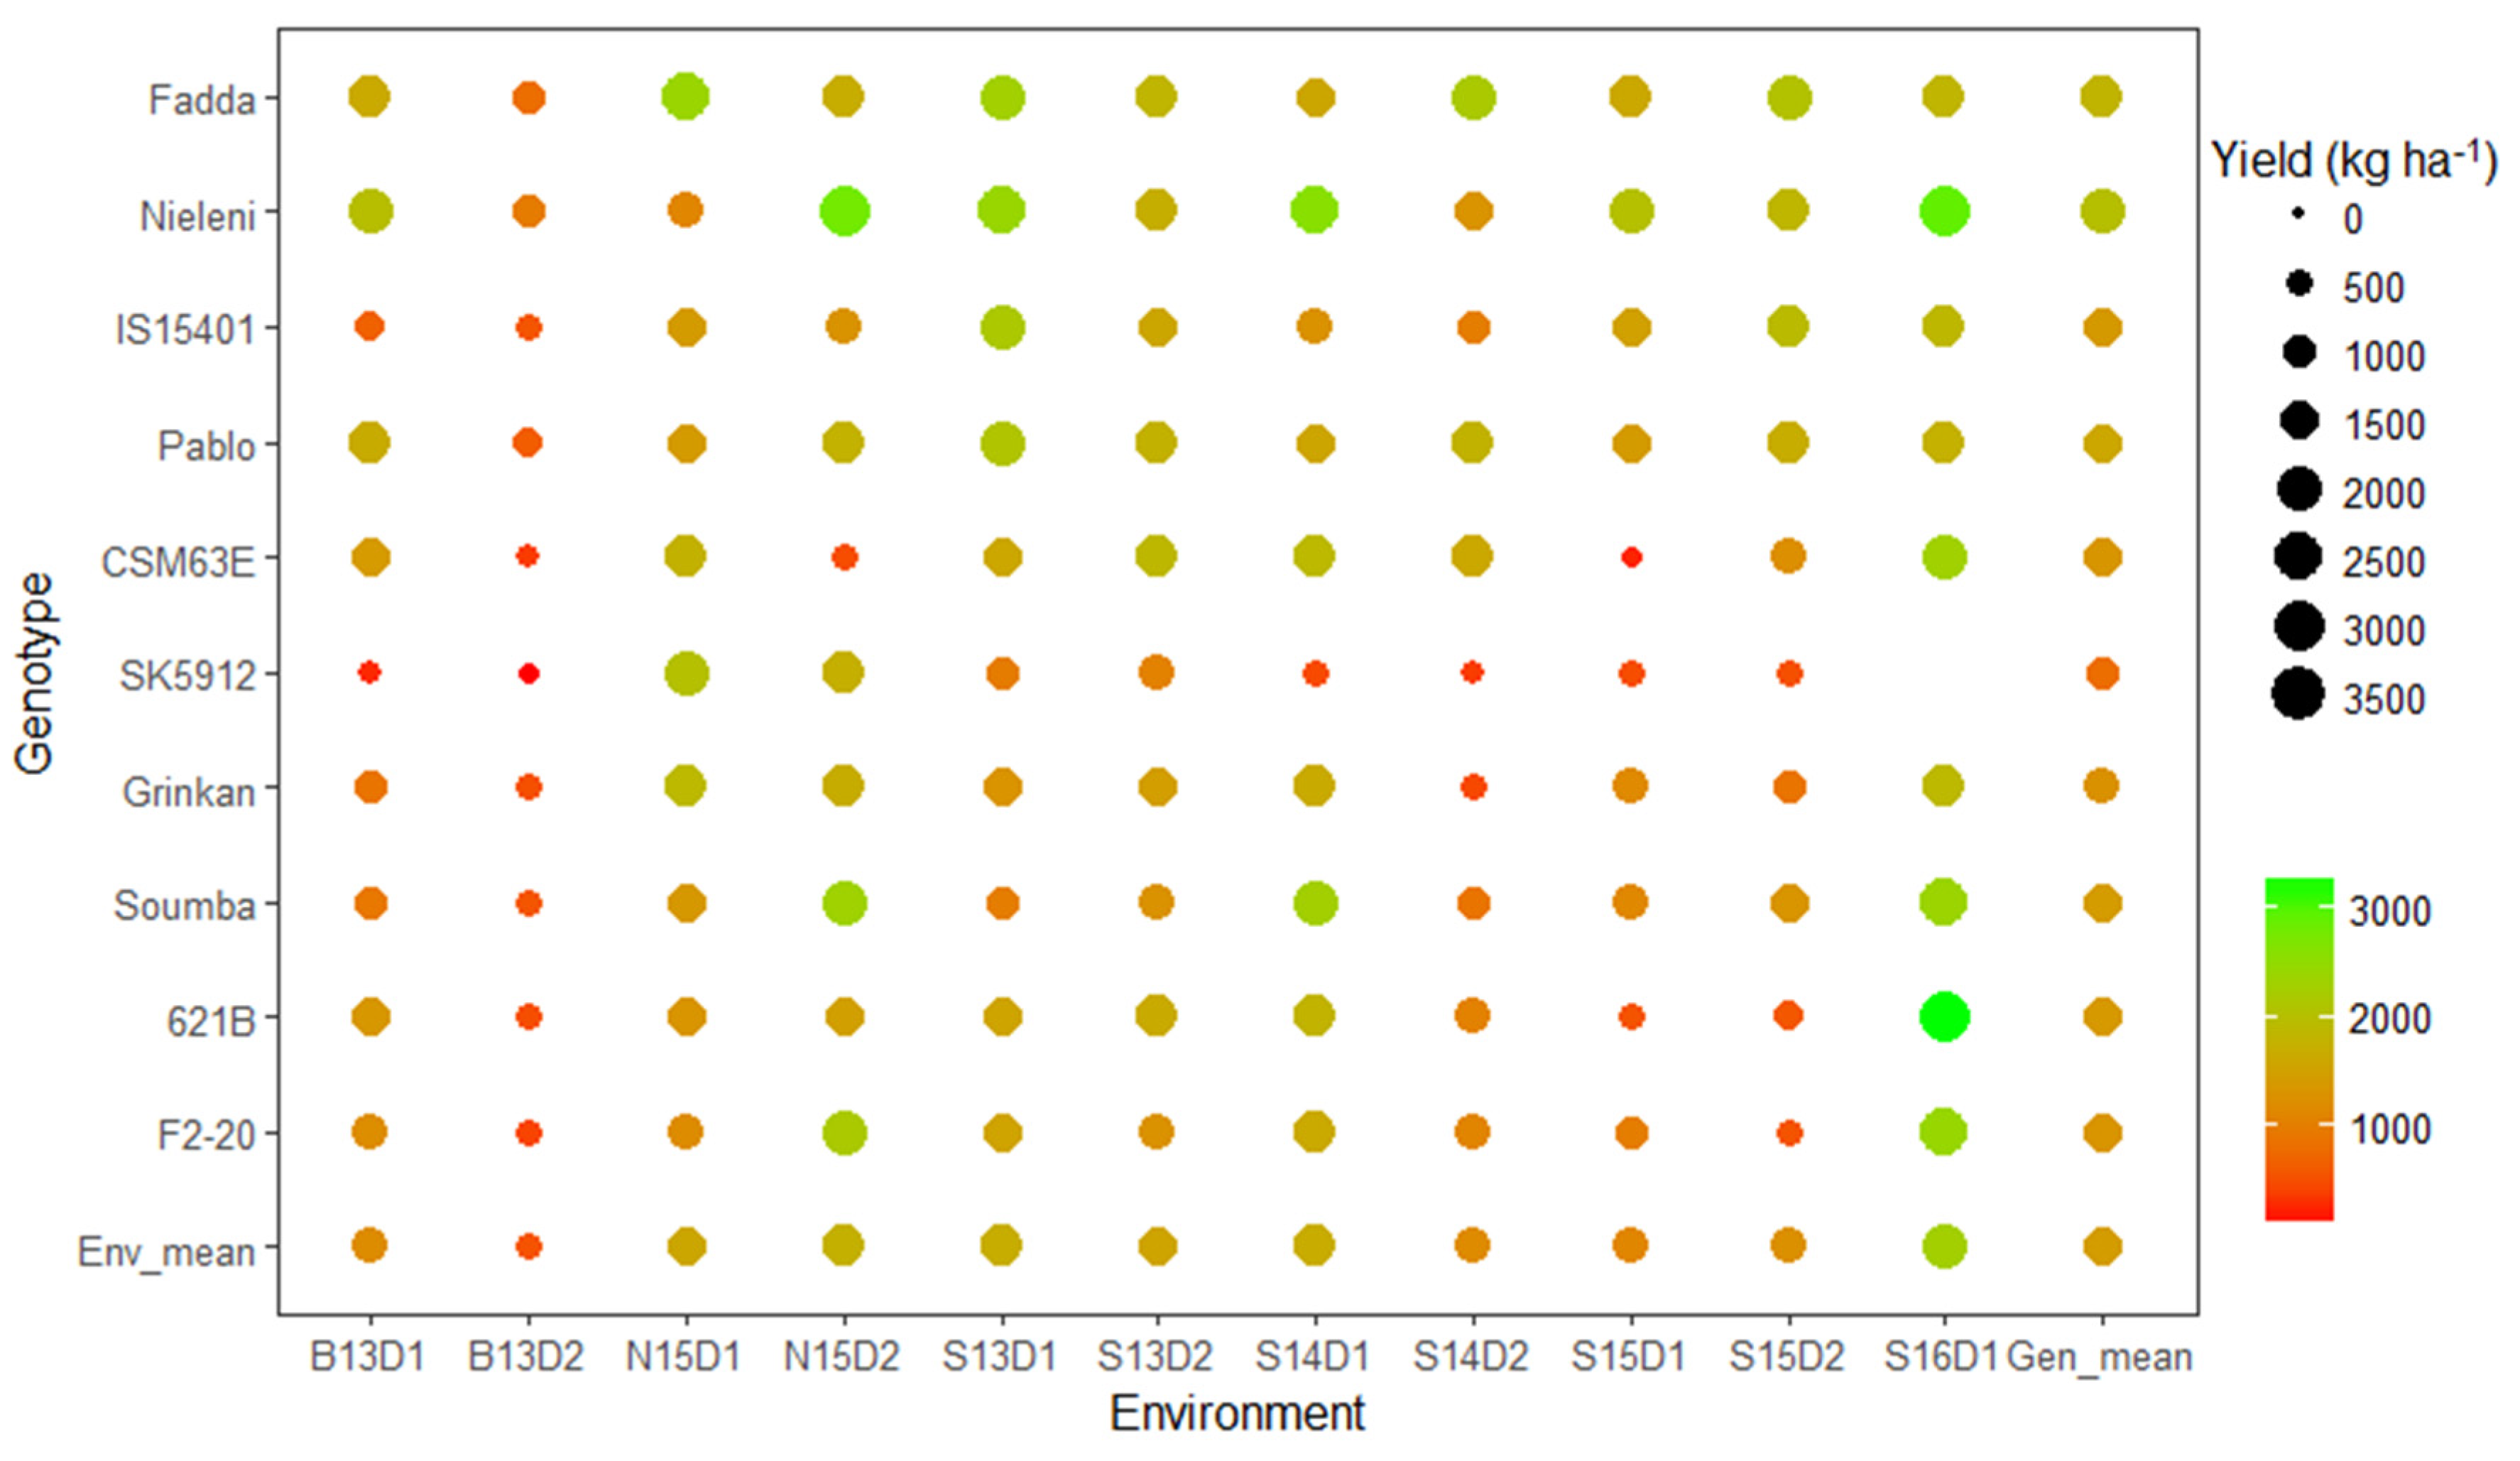
3.3. Which Genotype(s) for Which Environment(s)?

The AMMI2 biplot graph for grain yield shows that the S16D1, N15D1 and N15D2 environments best discriminated against the performance of the different genotypes evaluated because of their high score. They significantly contributed to interaction (Figure 5). However, the mean yields for these environments were among the highest, indicating that they were environments that were conducive to achieving high yields. The main reason for these high yields in these cited environments was the relatively high soil fertility (S16D1; group 1 in the characterization of environments; see Figure 2), or good rainfall associated with relatively good soil fertility (cases of N15D1 and N15D2, belonging to groups 2 and 3 respectively). Similarly, environments S15D1, S15D2 and S14D2 were discriminating, but produced the lowest grain yields. They were characterized by low soil fertility, high disease occurrence (S15D1), and low rainfall at the end of the cycle (S14D2). However, B13D2 contributed significantly less to interaction and was the main factor contributing to the phenotypic stability of these genotypes (Figure 5). This environment had one of the lowest mean grain yields because of its high disease occurrence, low soil fertility and low rainfall at the end of the cycle.
Due to their position along both axes (scores close to zero), Grinkan and SK5912 were the most stable genotypes, but with the lowest yield. In contrast, genotypes 621B, Soumba, F2–20, IS15401 and CSM63E were very unstable due to their values far from the origin of the IPCA axis, with grain yields lower than the overall mean. Lastly, the Fadda, Nieleni and Pablo genotypes were also found to be unstable, but displayed high grain yields. Genotypes and environments close to each other in the biplot had positive associations, indicating specific adaptation. For instance, genotypes 621B and Nieleni had specific adaptations for the S16D1 and N15D2 environments, respectively. Likewise, S14D1 was found to be a suitable environment for Soumba and F2–20, S15D2 for genotypes IS15401 and Fadda, and lastly N15D1 for genotype CSM63E (Figure 5).
For biomass yield, environments B13D1, B13D2, S14D1 and N15D1, all with yields above the overall mean, contributed significantly to interaction, as indicated by values far from the origin of the IPCA axis (Figure 6). These environments were characterized by early sowing dates, with relatively good soil fertility (S14D1) and a very long and well–distributed rainy season (N15D1) conducive to biomass production (note that late cycle stress in B13D2 did not affect biomass production). Environments S13D2 and S15D1, very close together on the biplot (Figure 6), influenced genotypes in the same way, all with biomass yields lower than the overall mean. These environments were characterized by an early end to the season (S13D2) and low soil fertility, and the presence of disease (S15D1) affecting biomass production. In contrast, S13D1, S16D1 and N15D2 showed a smaller contribution to G × E interaction. These environments were the main contributors to the phenotypic stability of the genotypes (Figure 6). In addition, these environments recorded distinct levels of performance: above the overall mean for S16D1, close to the overall mean for S13D1, and below the overall mean for N15D2. In these environments, there was no occurrence of disease and relatively good soil fertility.
Due to their positions located near the origin of the biplot, some genotypes can be considered as stable (i.e., Soumba), or unstable with specific adaptations (i.e., IS15401, SK5912 and Fadda, F2–20, Nieleni and Pablo). Of these genotypes, IS15401, SK5912 and Fadda showed yields higher than the overall mean. SK5912 and Fadda displayed specific adaptation to environment B13D1. Likewise, N15D1 was found to be a suitable environment for F2–20, S14D1 for IS1540, and S15D1 and S13D2 for Nieleni and Pablo. On the other hand, IS15401 and SK5912 proved to be very poorly adapted to environments S15D1, S15D2, S13D2 and S14D2 (Figure 6). These environments were characterized by low fertility (except S14D2), high disease occurrence (especially S15D1), late sowing, and low rainfall at the end of the cycle (S14D2).
In general, the Fadda, Nieleni, IS15401, F2–20 and Pablo genotypes were very unstable for both grain and biomass yield. These genotypes showed specific adaptations to the Sinthiou Malem and Nioro du Rip environments for grain, and especially to the environments sown on date 1 for biomass yield. Of these genotypes, Fadda, Nieleni, IS15401 and Pablo were generally successful for both grain and biomass yield. The Soumba and Grinkan genotypes were stable across environments, but did not produce well.

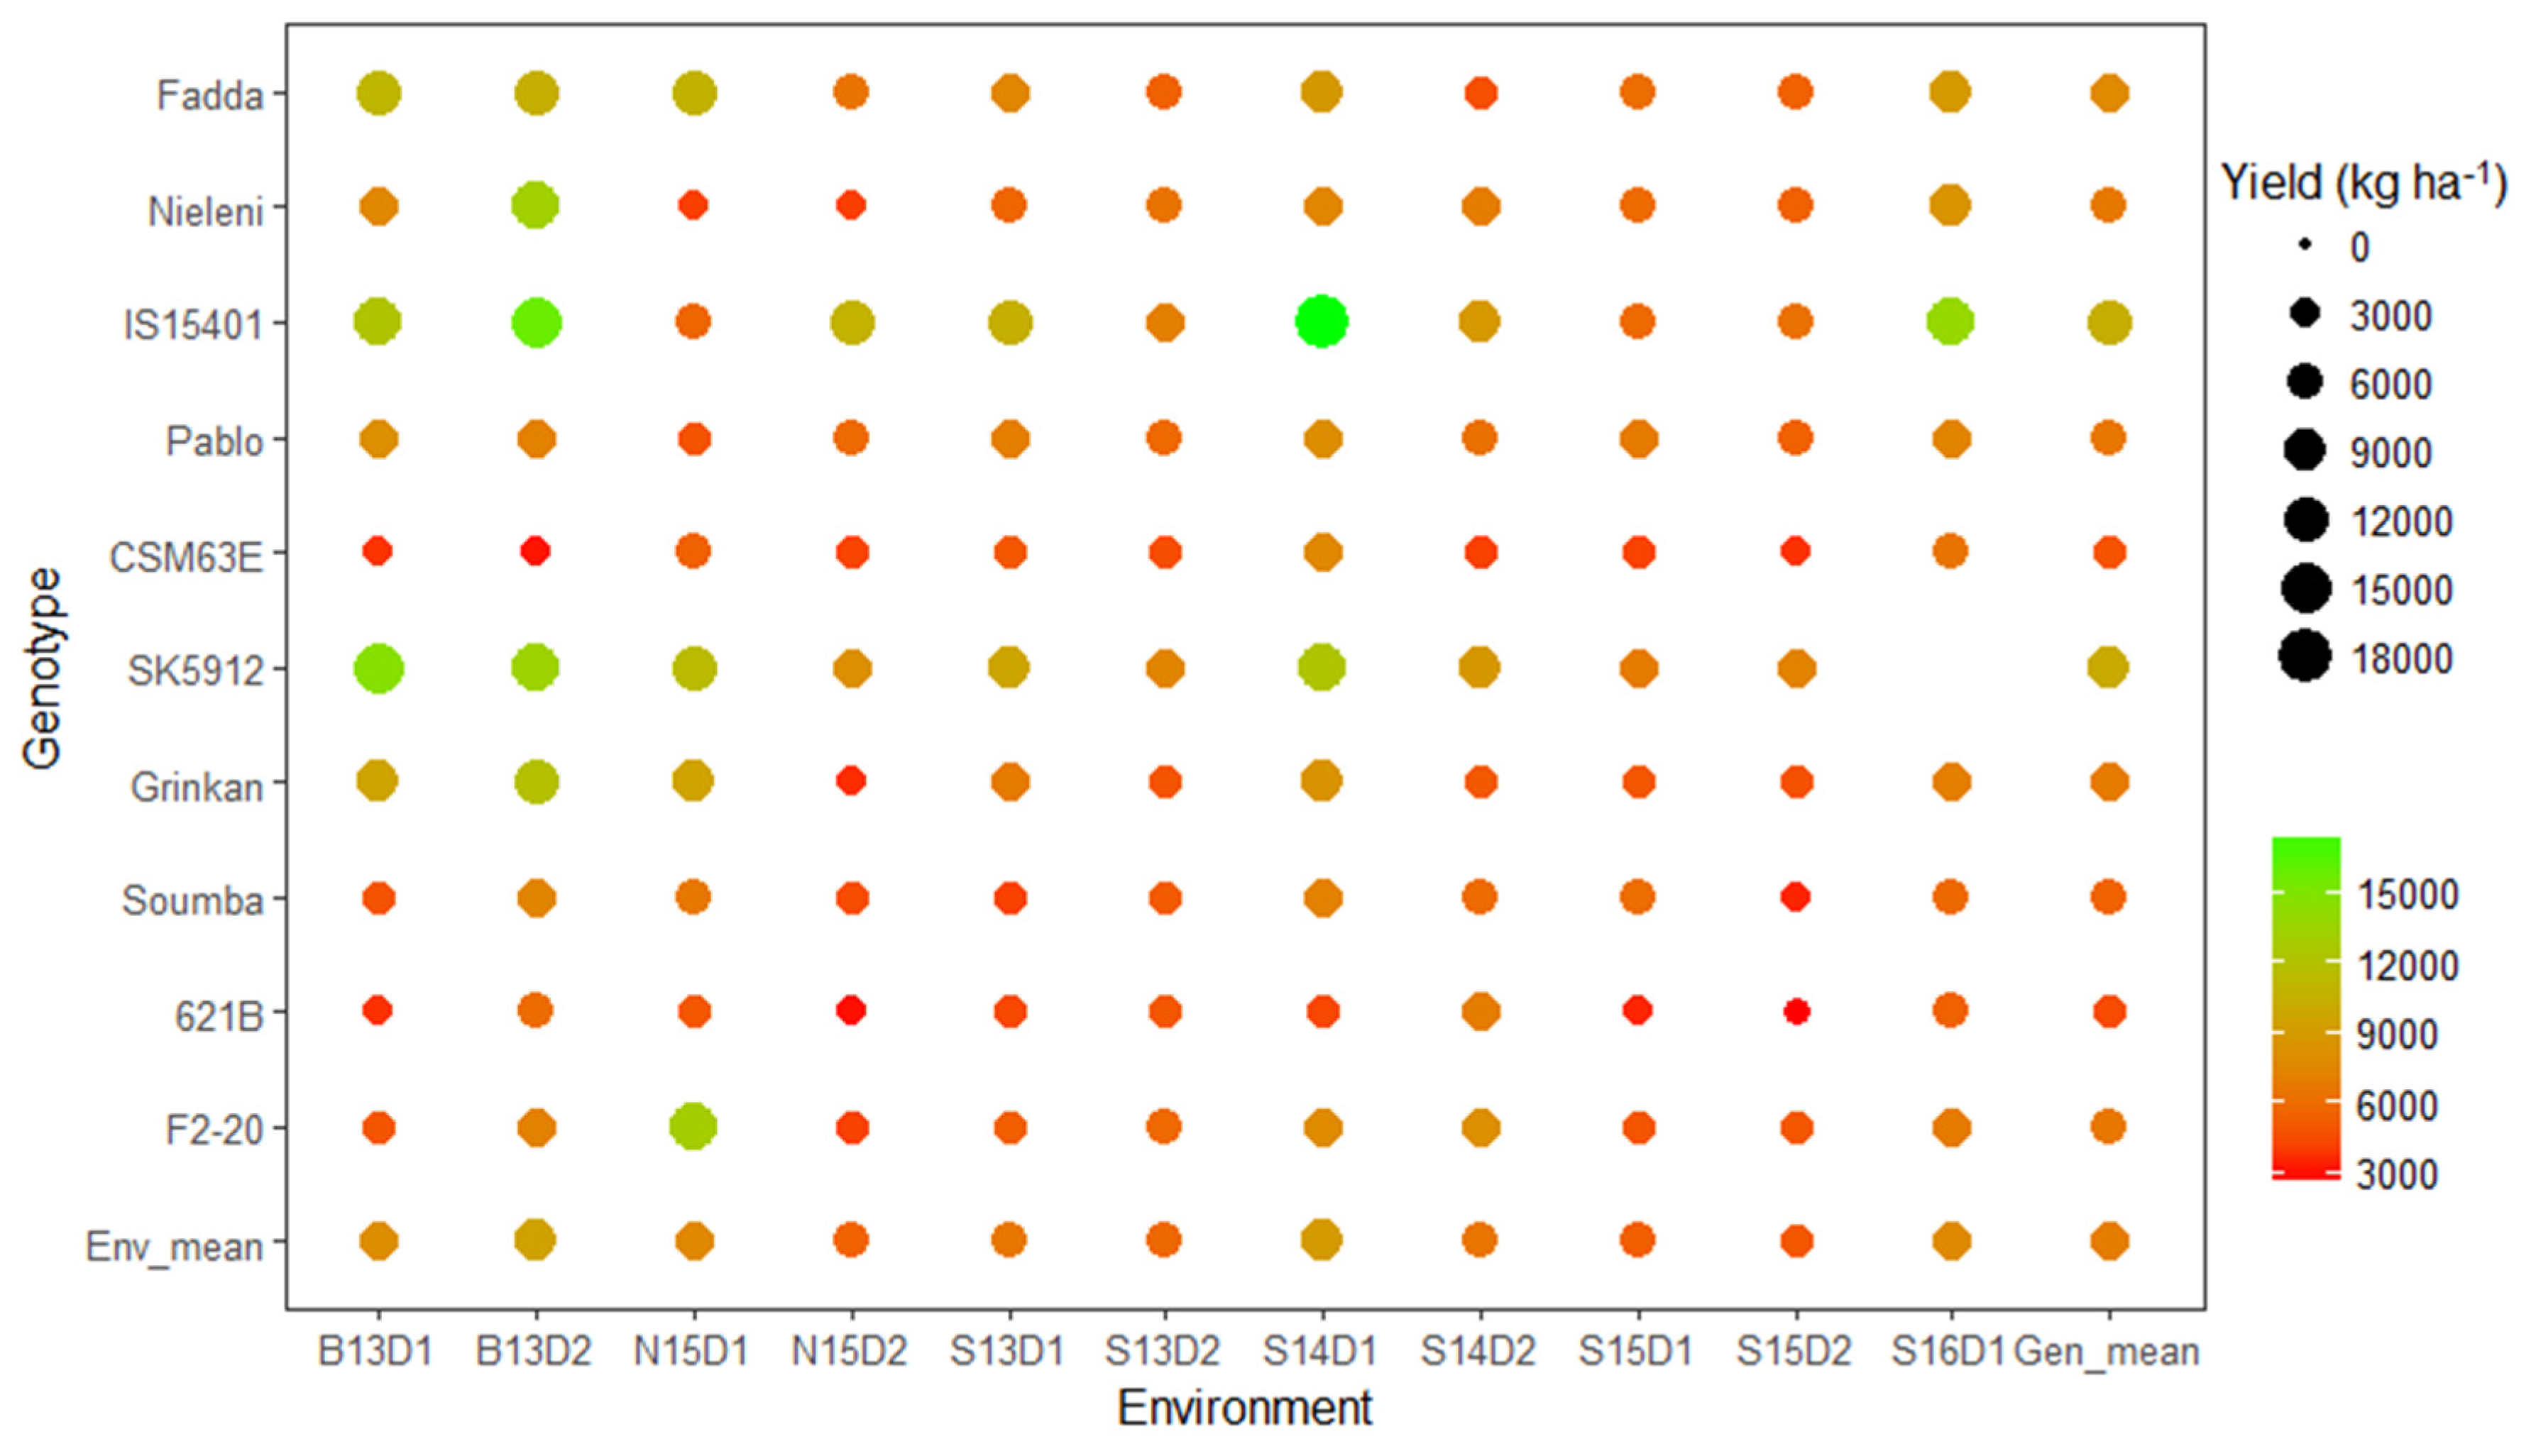
3.4. Which Genotype(s) Showed Dual–Purpose Potential?

The dual–purpose potential indices for grain and biomass production in the eleven study environments for the ten genotypes are shown in Figure 7. Regardless of the environment (excluding B13D2), five genotypes had consistently higher indices for grain (Fadda, Nieleni and Pablo) or for biomass (IS15401 and SK5912). Supporting this result, these five genotypes also showed higher mean yields for grain and/or biomass production according to the AMMI analysis (Figure 3 and Figure 4). Moreover, of these genotypes Fadda was the one that combined the best grain and biomass production in the most numerous environments. For dual–purpose potential, Fadda was therefore well positioned (in the upper right quadrant) in five environments, Nieleni and Pablo in three environments, and IS15401 in two environments. It should be noted that all the environments where these genotypes expressed dual–purpose potential were sown early (i.e., date 1).
For grain yield, Fadda ranked well (upper quadrants in Figure 7) in ten environments, Nieleni in eight, Pablo and CSM63E in six, and IS15401 in four. For biomass, SK5912 performed well (the right–hand side quadrants of the figures) in nine environments, IS15401 in seven environments, Fadda in six environments and Nieleni and Pablo in four environments.
Some other genotypes, such as CSM63E, Grinkan, Soumba, 621B and F2–20, all with mean grain and biomass yields lower than the overall mean, all showed poor dual–purpose potential (lower–left quadrant) in several environments. This was particularly true for Soumba and 621B in half of the environments. They were stable and inefficient for biomass production (Figure 4) and never demonstrated dual–purpose potential in any of the 11 environments. The environments in which they performed poorly for dual production were mostly late sowing (date 2) and belonged to groups of environments affected by stress to which these genotypes were susceptible: N15D1 for group 3, S13D2 for group 4, B13D1, B13D2 and S15D1 for group 5, and S14D2 and S15D2 for group 6 (Figure 2).

4. Discussion

The joint analysis of variance showed differences in sorghum performance due to environments (greater for grain), genotypes (greater for biomass) and G × E interactions. This indicates that these genotypes responded differently to environments, thereby confirming phenotypic diversity among the genotypes assessed. These results are in agreement with previous findings on sorghum [25,26,27,28]. In general, yields were higher for sowing date 1 than for sowing date 2, showing the potential importance of a longer cycle time and the existence of a photoperiod response of several of the sorghums studied, as already demonstrated in West Africa [29]. Further, it also highlights the importance of the choice of genotypes if the main objective is to obtain biomass, and of the environments if it is to obtain grain.
The low grain yield observed in Bambey in 2013 (B13D1 and B13D2), and Sinthiou Malem in 2014 (S14D2) could be explained by, among other things, the particularly sandy nature of the soil and by a high occurrence of diseases and/or deficiencies (signs observed but not clearly identified), constraints to which the 621B, Grinkan, Soumba and F2–20 genotypes were more susceptible than the others. It should be noted that these four genotypes are all caudatum, which are improved genotypes introduced into national sorghum breeding programs and which are known to be less hardy than guinea when edaphic conditions are not ideal [30]. For the Bambey trials, water stress at the end of the cycle (due to problems with the irrigation system) also occurred. This might explain the very low yield of SK5912 (very late maturing variety), as this early end of the rainy season might have aggravated the effects of the constraints mentioned above.

4.1. Which Genotype(s) for Which Environment(s)?

Various multiparametric models for measuring the stability of genotype performance across environments are available in the literature. Currently, the most widely used model is AMMI [31,32,33], which involves both an ANOVA and a principal component analysis (PCA) to decompose G × E interaction. The ability to identify genotypes with a stable performance and genotypes showing specific adaptations to specific environments is a major advantage of the AMMI method over other commonly used methods [34].
In this study, two genotypes (Grinkan and SK5912) for grain and two genotypes for biomass (Soumba and Grinkan) were identified as being generally more stable according to this model, but they also showed yields below the mean across different environments. These results support those of Menad et al. [35], who stated that the stability of yields is independent of their values, and that high–yielding genotypes are generally relatively unstable. They also confirm Yan and Hunt’s [36] conclusions that global stability is not necessarily a positive factor and is only desirable when it combines a high mean yield. In addition, the AMMI analysis also revealed for grain that genotypes 621B, F2–20, Fadda and CSM63E were close to environments S16D1, S14D1, S15D2 and N15D1, respectively. For biomass, genotypes IS15401 and SK5912 were close to environments S14D1 and B13D1, respectively, indicating specific adaptations. In contrast, IS15401 and SK5912 proved to be very poorly adapted to environments S15D1, S15D2, S13D2 and S14D2.
The specific adaptation of 621B to environment S16D1 might be explained by the good agro–pedological conditions that this environment benefited from. Thus, 621B was found to be particularly susceptible to growing conditions, particularly soil conditions. This result agrees with previous results [37]. The specific adaptation of IS15401 to environment S14D1 may have been due to both the rather early sowing date and the good agro–pedological conditions, which allowed this genotype to perform better despite low rainfall. The adaptation of SK5912 to B13D1 might be explained by the early sowing date and the fact that the diseases that affected the other genotypes (Figure 2) did not affect its biomass production. The poor adaptation of IS15401 and SK5912 to S15D1 and S14D2 for biomass production might have been due on the one hand to low fertility and the occurrence of diseases in S15D1, which attacked these genotypes, and on the other hand to late sowing and low rainfall at the end of the cycle observed in S14D2. In general, the differences in performance of our genotypes across our studied environments could be attributed to the type of soil (i.e., texture, with all genotypes performing better in clay–textured soils containing more organic matter), rainfall, their genetic nature and biotic constraints. These factors affected grain and biomass yields to different degrees. These results demonstrate that strategic choices must be made by breeders in the introduction of new sorghum genotypes. Breeders need to select specific lines according to their local environment and desired character.

4.2. Choice of Genotypes with Dual–Purpose Potential

The selection of genotypes showing a good trade–off between grain and biomass production, based on a comparison with the overall mean performance of the ten genotypes, revealed that the hybrids Fadda and Nieleni had the greatest dual–purpose potential followed by Pablo, then IS15401, which was relatively unstable for both grain and biomass production and therefore with specific adaptation. Fadda and Nieleni were identified as being particularly suitable for dual–purpose use in 5 and 3 environments, respectively, while Pablo and IS15401 were identified in 2 environments each (Figure 7). In addition, Nieleni appeared to be a poor producer of grains or biomass in only 3 and 6 environments, respectively. Fadda was found to be a poor producer of grains or biomass in only 1 and 5 environments, respectively. In contrast, Soumba and 621B showed poor grain and biomass production in half of the environments.
The higher dual–purpose potential of the three hybrids (Fadda, Nieleni and Pablo) definitely came from their genetic background, as already demonstrated for grain in Mali [38]. The added–value of this study was to study biomass production too, and to thus further recommend the two highest–yielding genotypes (Fadda and Nieleni) for both grain and biomass yield (dual–purpose) in our experimental zones (Sinthiou Malem and Nioro du Rip) with normal (early) sowing dates. However, it will also be important to investigate the good forage quality of these genotypes, with the hypothesis that Nieleni, a caudatum sorghum, will out–perform the Fadda genotype.
The results also showed that the dual–purpose potential of the genotypes was mainly expressed in environments with early sowing dates (date 1). Environments with late sowing dates tended to reduce biomass and grain production and were therefore not suitable for dual–purpose genotypes. These findings confirmed the merits of early sowing to improve the dual–purpose potential of genotypes. Similar results showing the beneficial effect of early sowing on sorghum performance in terms of biomass and/or grain production in different hot and dry growing environments in Asia, America and Africa were obtained by [39,40,41,42]. However, the last authors [42] did not find any significant effect of the sowing date on grain yield due to bird attacks that occurred in their experiments.

5. Conclusions

In this study, the AMMI model showed that grain and biomass yields were strongly influenced by genotypes, environments and genotype x environment interaction. The different environments resulted in different responses from the genotypes, with most of them displaying environmental adaptation. Soil fertility and rainfall during the experiment were major factors explaining the variation in genotype responses. Nieleni and Fadda had the highest grain yields, while IS15401 and SK5912 had the highest biomass yields. This study also showed that genotypes with good phenotypic stability performed poorly. The study found that out of the genotypes studied, those with the greatest dual–purpose potential were Nieleni and Fadda. An early sowing date was found to be beneficial for the expression of dual–purpose potential. In addition, the results indicated that Nieleni, Fadda, Pablo had the highest overall mean in terms of grain, whether the growing conditions were good or bad. This result is in line with those of various authors regarding the “superiority” of hybrids. Meanwhile, the Senegalese control genotype 621B appeared to have very good potential (being able to produce more than 3 tons per hectare under good agro–pedological conditions, such as those of S16D1), but it was particularly susceptible to growing conditions, particularly soil conditions. Hence, the AMMI statistical model showed its merits as a tool to help recommend sorghum genotypes: the Fadda and Nieleni varieties appeared to be the best genotypes for dual–purpose use in our study area. However, to gain a better understanding of these differences in genotypic performance depending on the environment (G × E interaction), further studies are needed to relate these results to the other phenology, morphology and growth characteristics of these genotypes, to explain in greater detail their phenotypic plasticity. In addition, future biochemistry and molecular biology analysis would be of great value to better understand the differences in genotypic performance depending on the environment; especially differences among grain type genotypes and biomass type genotypes.

Author Contributions

Conceptualization, M.N., M.A., N.C. and B.M.; methodology, M.N., M.A., and B.M.; software, M.N.; validation, M.A., B.M. and A.G.; formal analysis, M.N., K.K.G., M.A. and B.M.; investigation, M.N., K.K.G. and B.M.; resources, M.N., M.A., B.M. and N.C.; data curation, M.N., M.A. and B.M.; writing—original draft preparation, M.N.; writing—review and editing, M.A., B.M., K.K.G. and A.G.; visualization, M.A. and B.M.; supervision, M.A., B.M. and A.G.; project administration, B.M and M.A; funding acquisition, B.M. and M.A.

Funding

This work constitutes part of doctoral research studies and was conducted with the financial support of the West Africa Agricultural Productivity Program for Senegal (WAAPP–Senegal).

Acknowledgments

The authors thank Mbaye Sarr Diop, Mamadou Sonko, Abdou Faye, Ibrahima Ndong, Massiré Badji, Bounama Mbengue, Yagouba Diao, Jean Gabriel Diatta and Thierno Ndiaye for their invaluable help and cooperation in the laboratory and field work.

Conflicts of Interest

The authors declare no conflict of interest.

References

  1. Djè, Y.; Heuertz, M.; Ater, M.; Lefebvre, C.; Vekemans, X. Évaluation de la diversité morphologique des variétés traditionnelles de sorgho du Nord–ouest du Maroc. Biotechnol. Agron. Soc. Environ. 2007, 11, 30–40. [Google Scholar]
  2. FAOSTAT 2015. Statistiques des Données Année 2015; United Nations Food and Agriculture Organization: Rome, Italy, 2015. [Google Scholar]
  3. Agrama, H.A.; Tuinstra, M.R. La diversité phylogénétique et les relations entre le sorgho adhésions à l’aide SSR et RAPD. Afr. J. Biotechnol. 2003, 2, 334–340. [Google Scholar] [CrossRef] [Green Version]
  4. Reddy, B.V.S.; Kumar, A.A.; Reddy, P.S.; Elangovan, M. Sorghum germplasm: Diversity and utilization. In Sorghum Genetic Enhancement: Research Process, Dissemination and Impacts; International Crops Research Institute for the Semi-Arid Tropics: Patancheru, Andhra Pradesh, India, 2008; pp. 153–169. [Google Scholar]
  5. ANSD (Agence Nationale de la Statistique et de la Démographie). Bulletin Mensuel des Statistiques Economiques de 2018; Division des Statistiques Economiques Ministère de l’Economie, des Finances et du Plan: Dakar, Sénégal, 2018; p. 109. [Google Scholar]
  6. Ba, K.; Tine, E.; Destain, J.; Cissé, N.; Thonart, P. Étude comparative des composés phénoliques, du pouvoir antioxydant de différentes variétés de sorgho sénégalais et des enzymes amylolytiques de leur malt. Biotechnol. Agron. Soc. Environ. 2010, 14, 131–139. [Google Scholar]
  7. Seguin, B.; Soussana, J.F. Emissions de Gaz à Effet de Serre et Changement Climatique: Causes et Conséquences Observées Pour L’agriculture et L’élevage. Courrierde L’environnement de l’INRA 2008, 55, 79–91. [Google Scholar]
  8. Cruz, C.D.; Regazzi, A.J. Biometrical Models Applied to Plant Breeding; Editora UFV: Viçosa, Brazil, 1997; p. 390. [Google Scholar]
  9. Holhs, T. Analysis of genotype environment interactions. S. Afr. J. Sci. 1995, 91, 121–124. [Google Scholar]
  10. Crossa, J. Statistical analyses of multilocation trials. Adv. Agron. 1990, 44, 55–85. [Google Scholar]
  11. Romagosa, I.; Fox, P.N. Genotype x environment interaction and adaptation. In Plant Breeding; Springer: Dordrecht, The Netherlands, 1993; pp. 373–390. ISBN 9401046654. [Google Scholar]
  12. Zobel, R.W.; Wright, M.W.; Gauch, H.G. Statistical analysis of a yield trial. Agron. J. 1988, 80, 388–393. [Google Scholar] [CrossRef]
  13. Crossa, J.; Gauch, H.G.; Zobel, R.W. Additive main effect and multiplicative interaction analysis of two international maize cultivar trials. Crop. Sci. 1990, 30, 493–500. [Google Scholar] [CrossRef]
  14. Gauch, H.G.; Zobel, R.W. AMMI analysis of yield trials. In Genotype by Environment Interaction; Kang, M.S., Gauch, H.G., Eds.; CRC Press: Boca Raton, FL, USA, 1996; pp. 85–122. [Google Scholar]
  15. Kempton, R.A. The use of biplots in interpreting variety by environment interactions. J. Agric. Sci. 1984, 103, 123–135. [Google Scholar] [CrossRef]
  16. Ferreira, D.F.; Demétrio, C.G.B.; Manly, B.F.J.; Machado, A.A.; Vencovsky, R. Statistical models in agriculture: Biometrical methods for evaluating phenotypic stability in plant breeding. Cerne 2006, 12, 373–388. [Google Scholar]
  17. Vachaud, G.; Dancette, C.; Sonko, S.; Thony, J.L. Méthode de caractérisation hydrodynamique d’un sol non saturé: Application à deux types de sols du Sénégal. Ann. Agron. 1978, 29, 1–36. [Google Scholar]
  18. Hamon, G. Mise en Œuvre et Critique des Méthodes de Caractérisation Hydrodynamique de la Zone non Saturée du sol. Application Aux Sols de Culture du Sénégal. Ph.D. Thesis, Instut de Mécanique, Grenoble, France, 1980. [Google Scholar]
  19. Imberno, J. Variabilité Spatiale des Caractéristiques Hydrodynamiques d’un sol du Sénégal. Application au Calcul d’un Bilan Sous Culture. Ph.D. Thesis, USMG et Institut National Polytechnique de Grenoble, Grenoble, France, 1981. [Google Scholar]
  20. Hamon, G. Caractérisation Hydrodynamique in situ d’un sol de Culture en Moyenne Casamance; Institut Sénégalais de Recherches Agricoles: Djibélor, Sénégal, 1978. [Google Scholar]
  21. Baret, F. Caractérisation Hydrodynamique d’un Sol de la Région de Nioro; Institut Sénégalais de Recherches Agricoles (ISRA): Dakar, Sénégal, 1980. [Google Scholar]
  22. Valet, S. Bilan Hydrique sous Cultures Dans les Essais Travail du Sol en Sols Sableux (Nioro) et en Sols Sablo-Argileux (Thysse); Institut Sénégalais de Recherches Agricoles: Kaolack, Sénégal, 1984; p. 16. [Google Scholar]
  23. Bartlett, M.S. Properties of sufficiency and statistical tests. Proc. R. Stat. Soc. Ser. A 1937, 160, 268–282. [Google Scholar]
  24. R Development Core Team. R: A Language and Environment for Statistical Computing; R Foundation for Statistical Computing: Vienna, Austria, 2015. [Google Scholar]
  25. Almeida Filho, J.E.; Tardin, F.D.; Daher, R.F.; Barbé, T.C.; Paula, C.M.; Cardoso, M.J.; Godinho, V.P.C. Stability and adaptability of grain sorghum hybrids in the off-season. Genet. Mol. Res. 2014, 13, 7626–7635. [Google Scholar] [CrossRef] [PubMed]
  26. Ndiaye, M.; Adam, M.; Muller, B.; Guisse, A.; Cissé, N. Performances agronomiques et stabilité phénotypique de génotypes de Sorgho (Sorghum bicolor (L.) Moench) au Sénégal: Une étude des interactions génotypes-environnement. Appl. Biosci. 2018, 125, 12617–12629. [Google Scholar]
  27. Ganyo, K.K.; Muller, B.; Gaglo, E.K.; Guisse, A.; Cissé, N. Optimisation du NPK et urée basée sur les informations climatiques pour accroitre la production du sorgho en zones soudano-sahéliennes du Sénégal. Appl. Biosci. 2018, 131, 13293–13307. [Google Scholar] [CrossRef] [Green Version]
  28. Showemimo, F.A.; Echekwu, C.A.; Yeye, M.Y. Genotype x environment interaction in Sorghum trials and their implication for future variety evaluation in Sorghum growing areas of northern Nigeria. Plant Sci. 2000, 1, 24–31. [Google Scholar]
  29. Kouressy, M.; Dingkuhn, M.; Vaksmann, M.; Heinemann, A.B. Adaptation to diverse semi–arid environments of sorghum genotypes having different plant type and sensitivity to photoperiod. Agric. For. Meteorol. 2008, 148, 357–371. [Google Scholar] [CrossRef]
  30. Bazile, D.; Dembélé, S.; Soumaré, M.; Dembele, D. Utilisation de la diversité variétale du sorgho pour valoriser la diversité des sols au Mali. Cah. Agric. 2008, 17, 86–94. [Google Scholar] [CrossRef]
  31. Raton, F.L.; Gauch, H.G. Statistical Analysis of Regional Yield Trials. AMMI Analysis of Factorial Designs; Elsevier: New York, NY, USA, 1992. [Google Scholar]
  32. Raju, B.M.K. Study of AMMI model and its biplots. J. Ind. Soc. Agric. Stat. 2002, 55, 297–322. [Google Scholar]
  33. Zali, H.; Farshadfar, E.; Sabaghpour, S.H.; Karimizadeh, R. Evaluation of genotype × environment interaction in chickpea using measures of stability from AMMI model. Ann. Biol. Res. 2012, 3, 3126–3136. [Google Scholar]
  34. Silva Filho, J.L.; Morello, C.L.; Farias, F.J.C.; Lamas, F.M. Comparação de métodos para avaliar a adaptabilidade eestabilidade produtiva em algodoeiro. Pesqui. Agropecuária Bras. 2008, 43, 349–355. [Google Scholar] [CrossRef]
  35. Menad, A.; Meziani, N.; Bouzerzour, H.; Benmahammad, A. Analyse de l’interaction génotype x milieux du rendement de l’orge (Hordeum vulgare L.): Application des modèles AMMI et la régression conjointe. Nat. Biotechnol. 2010, 5, 99–106. [Google Scholar]
  36. Yan, W.; Hunt, L.A. Biplot analysis of multi-environment trial data. In Kang MS: Quantitative Genetics, Genomics and Plant Breeding; Louisiana State University: Baton Rouge, LA, USA, 2002; pp. 289–304. [Google Scholar]
  37. Ganyo, K.K. Etude et Modélisation des Réponses de Variétés de Sorgho (Sorghum bicolor (L.) Moench) à des Stratégies Contrastées D’apports D’intrants. Ph.D. Thesis, Université Cheikh Anta Diop, Dakar, Senegal, 2019. [Google Scholar]
  38. Rattunde, H.F.W.; Weltzien, E.; Diallo, B.; Diallo, A.G.; Sidibe, M.; Touré, A.O.; Rathore, A.; Das, R.R.; Leiser, W.L.; Touré, A. Yield of photoperiod–sensitive sorghum hybrids based on guinea–race germplasm under farmers’ field conditions in Mali. Crop. Sci. 2013, 53, 1–8. [Google Scholar] [CrossRef] [Green Version]
  39. Voigt, J.; Botha, P.R.; Gerber, H.S. The effect of planting date on the dry matter production of annual forage sorghum hybrids and hybrid millet cultivars. Grassroots Newsl. Grassl. Soc. S. Afr. 2008, 8, 18–24. [Google Scholar]
  40. Erickson, J.E.; Helsel, Z.R.; Woodard, K.R.; Vendramini, J.M.B.; Wang, Y.; Sollenberger, L.E.; Gilbert, R.A. Planting date affects biomass and Brix of sweet sorghum grown for biofuel across Florida. Agron. J. 2011, 103, 1827–1833. [Google Scholar] [CrossRef]
  41. Reddi, S.G.; Janawade, A.D.; Palled, Y.B. Influence of sowing dates on growth, grain and ethanol yield and economics. Int. J. Agric. Sci. Vet. Med. 2013, 1, 12–17. [Google Scholar]
  42. Gutjahr, S.; Vaksmann, M.; Dingkuhn, M.; Thera, K.; Trouche, G.; Braconnier, S.; Luquet, D. Grain, sugar and biomass accumulation in tropical sorghums. I. Trade-offs and effects of phenological plasticity. Funct. Plant Biol. 2013, 40, 342–354. [Google Scholar]
Figure 1. Rainfall and minimum and maximum temperatures at Bambey 2013 (A), Nioro du Rip 2015 (B) and Sinthiou Malem 2013 (C), 2014 (D), 2015 (E) and 2016 (F). Jun = June, Jul = July, Aug = August, Sep = September, Oct = October, Nov = November, Dec = December.
Agronomy 09 00867 g001aAgronomy 09 00867 g001b
Figure 2. Principal component analysis (PCA) of the characteristics of the environments studied. The environments and indicators are explained in Table 1.
Agronomy 09 00867 g002
Figure 3. Mean grain yield (mean of replications) (kg ha−1) of each of the ten genotypes in each of the eleven environments studied and values of the genotypic, environmental and overall means. (B13D1 = sowing date 1 Bambey, B13D2 = sowing date 2 Bambey, S13D1 = sowing date 1 Sinthiou Malem, S13D2 = sowing date 2 Sinthiou Malem, S14D1 = sowing date 1 Sinthiou Malem, S14D2 = sowing date 2 Sinthiou Malem, S14D1= sowing date 1 Sinthiou Malem, S15D2 = sowing date 2 Sinthiou Malem, S16D1= sowing date 1 Sinthiou Malem, N15D1= sowing date 1 Nioro du Rip, N15D2 = sowing date 2 Nioro Rip. Figures 13, 14, 15 and 16 correspond to the years 2013, 2014, 2015 and 2016. Gen. mean = genotypic mean, Env. mean = environmental mean).
Agronomy 09 00867 g003
Figure 4. Mean biomass yield (mean of replications) (kg ha−1) of each of the ten genotypes in each of the eleven environments studied and values of the genotypic, environmental and overall means.
Agronomy 09 00867 g004
Figure 5. AMMI biplot of grain yield for the ten sorghum genotypes and eleven environments studied.
Agronomy 09 00867 g005
Figure 6. AMMI biplot of biomass yields for the ten sorghum genotypes and eleven environments studied (B13D1 = Sowing date 1 Bambey, B13D2 = sowing date 2 Bambey, S13D1 = sowing date 1 Sinthiou Malem, S13D2 = sowing date 2 Sinthiou Malem, S14D1 = sowing date 1 Sinthiou Malem, S14D2 = sowing date 2 Sinthiou Malem, S14D1 = sowing date 1 Sinthiou Malem, S15D2 = sowing date 2 Sinthiou Malem, S16D1 = sowing date 1 Sinthiou Malem, N15D1 = sowing date 1 Nioro du Rip, N15D2 = sowing date 2 Nioro Rip).
Agronomy 09 00867 g006
Figure 7. Potential index for dual production of the ten genotypes across the eleven study environments. (The dotted lines represent the lines of equations x = 0 and y = 0).
Agronomy 09 00867 g007
Table 1. Main characteristics of the different trial sites.
EnvironmentZoneCodeCoordinatesAlt (m)Soil Type *SAN (%)CS (%)N (%)OM (%)Rain (mm)R0–30 (mm)R30–60 (mm)R60–90 (mm)R90–120 (mm)Tmin (°C)Tmax (°C)Healthy **Sowing DatePrevio-uscrop
Sowing 1/2013BBYB13D114°42′N
16°29′W
20Sandy94.26.60.153.164418035211032333.9207/17/2013Fallow
Sowing 2/2013BBYB13D2 Sandy94.26.60.153.156625325656122.833.9307/31/2013Fallow
Sowing 1/2013SINS13D113°49′N
13°55′W
23Sandy-silty89.411.60.214.357514636559621.435.3507/25/2013Fallow
Sowing 2/2013SINS13D2 Sandy-silty89.411.60.214.353618330646121.235.4508/06/2013Fallow
Sowing 1/2014SINS14D1 Sandy91.210.20.175.7488158213883122.235.7407/17/2014Peanut
Sowing 2/2014SINS14D2 Sandy90.99.70.174.537719015631122.135.6508/06/2014Peanut
Sowing 1/2015SINS15D1 Sandy93.76.30.323.5505522591534321.834.7207/09/2015Peanut
Sowing 2/2015SINS15D2 Sandy93.26.80.333.845525915544221.234.9408/08/2015Peanut
Sowing 1/2016SINS16D1 Sandy-silty84.115.90.5510.6447230155243822.535.6507/25/2016Fallow
Sowing 1/2015NION15D113°45′N
15°45′W
45Sandy92.47.60.313.594319636126112620.633.8307/16/2015Cowpea
Sowing 2/2015NION15D2 Sandy-silty87.013.00.436.1747329273145019.733.8408/13/2015Fallow
BBY = Bambey, SIN = Sinthiou Malem, NIO=Nioro du Rip, Alt = Altitude, SAN = Sand, CS = Clay + Silt. * Classification according to the USDA method based on average data over the 0–30 cm horizon; R0–30 = total rainfall between 0 and 30 days after sowing, R30-60 total rainfall between 30 and 60 days after sowing, R60–90 = total rainfall between 60 and 90 days after sowing, R90–120 = total rainfall between 90 and 120 days after sowing, ** = score given to a given environment according to disease level: the favorable situation takes the score 5 (absence of disease) and the unfavorable situation the score 1 (strong presence of disease). Rain = total rainfall during the trial.
Table 2. Main characteristics of the ten genotypes studied.
GenotypeCodeTypePhotoperiod-SensitivityCycle DurationIsohyetsPurposePlant HeightYield PotentialPanicle ShapeOthersOrigin
FaddaG1Guinea (Hybride)Moderate110 days700–1000 mmGrain–biomass2–3 m4.5 t/haSemi–looseTolerant: mold, anthracnoseMali, IER/ICRISAT selection, pedigree 02–SB–F5DT–12A xLata.
NieleniG2Caudatum (Hybride)Low100 days700–800 mmGrain3 m4 t/haSemi–compactTolerant: mold, anthracnoseMali, IER/ICRISAT selection
IS15401G3GuineaHigh120 days900–1200 mmBiomass4–4.5 m2 t/haSemi–compactResistant: mold, striga and midgesCameroon, IER/ICRISAT selection
PabloG4Guinea (Hybride)Moderate110 days700–1000 mmBiomass4 m4 t/haLooseTolerant: mold, anthracnoseMali, IER/ICRISAT selection, pedigree FambeA x Lata.
CSM63EG5GuineaLow90 days600–1000 mmGrain4 m2 t/haLooseTolerant: diseases and insectsMali, traditional variety
SK5912G6CaudatumHigh110 days700–900 mmBiomass2 m2.5–3.5 t/haSemi–compactTolerant: mold, anthracnoseNigeria
GrinkanG7CaudatumNo110 days500–800 mmGrain–biomass1.2 m4 t/haSemi–compactResistant: midges, insectsMali, ICRISAT selection
SoumbaG8CaudatumLow100 days600–1000 mmGrain–biomass2.5 m2.5 t/haSemi–compactTolerant: diseases and, insects, strigaMali
621BG9CaudatumNo90 days600–900 mmGrain1.75 m2.5–3 t/haSemi–compactMold resistantSenegal, ISRA selection, pedigree CE 151–262 xSarvato–1
F2–20G10CaudatumLow110 days600–900 mmGrain2.1m3– 5.3 t/haSemi–compactResistant: mold, strigaSenegal, ISRA selection, pedigree (MN1056 × 68–20) x 7410–195–1
Table 3. Summary of the combined analysis of variance and decomposition of G × E interaction according to AMMI.
Source of VariationGrain (kg ha−1)Biomass (kg ha−1)
DFMean SquareTSS Explained (%)DFMean SquareTSS Explained (%)
Genotype (G)93,990,633 ***17.99178,164,830 ***36.7
Environment (E)107,936,033 ***39.61092,439,498 ***21.2
Blocks (E)33523,880 ***8.63317,553,265 ***13.3
Interaction (G × E)89759,922 ***33.88914,146,802 ***28.8
IPCA1181,371,515 ***36.61832,487,030 ***52
IPCA2161,117,060 ***26.51617,004,129 ***24.2
IPCA3141,011,953 ***211410,009,335 *12.5
IPCA412396,0667124,671,5805
1PCA510386,3345.7103,398,7723
Error289231,846 2874,711,029
DF = degrees of freedom; ***, * = significant at 0.1%and 5%, respectively; TSS = total sum of squares.
Table 4. Mean grain yield (kg ha−1) of ten genotypes grown at eleven environments.
GenotypeEnvironmentGenotypic Mean
B13D1B13D2N15D1N15D2S13D1S13D2S14D1S14D2S15D1S15D2S16D1
Fadda16628042417171923291855160422061634207718571833
Nieleni20119721122282424451742262613262049187129462018
IS154016655541431131021821608129710081524195818831402
Pablo16886241432179621111786159218061435171617801615
CSM63E142334617914781628189519391634232124723451360
SK5912252151205017549921071459358477503807
Grinkan88850219291707132314751677441117188119051281
Soumba931553138123651016130123079001149133924121443
621B136749113421503156616651810106453357232331392
F2–201223409120722051549130216581110101253624531333
Mean12115301610176617141570169711921122127023131454
Table 5. Mean biomass yield (kg ha−1) of ten genotypes grown at eleven environments.
GenotypeEnvironmentGenotypic Mean
B13D1B13D2N15D1N15D2S13D1S13D2S14D1S14D2S15D1S15D2S16D1
Fadda11,11110,54610,85764967571540910,50849666056544789727995
Nieleni766713,3223990400456176473814172775895536085096784
IS1540112,31515,989565510,80310,611715117,0778211584162761407310364
Pablo813771984712585571095775872859826822543174606655
CSM63E364330515376313449264529765038424129359164604576
SK591214,80613,62311,59181569827748011,87087836867733210,115
Grinkan967512,0209638348968704812829552974882468270946860
Soumba475674976669448340345109719657185991329058205459
621B358159554969300343004889425868293308288854134379
F2–204863721913,140406152615791756876024833493168706558
Mean805595367660534866135742912964315426492378526954

