Potential and Actual Water Savings through Improved Irrigation Scheduling in Small-Scale Vegetable Production

School of Agricultural, Forest and Food Sciences HAFL, Bern University of Applied Sciences, Laenggasse 85, CH-3052 Zollikofen, Switzerland
*
Author to whom correspondence should be addressed.
Agronomy 2019, 9(12), 888; https://0-doi-org.brum.beds.ac.uk/10.3390/agronomy9120888
Submission received: 15 October 2019
/
Revised: 8 November 2019
/
Accepted: 25 November 2019
/
Published: 14 December 2019
(This article belongs to the Special Issue Increasing Agricultural Water Productivity in a Changing Environment)
Abstract
:Appropriate irrigation scheduling for efficient water use is often a challenge for small-scale farmers using drip irrigation. In a trial with 12 farmers in Sébaco, Nicaragua, two tools to facilitate irrigation scheduling were tested: the Water Chart (a table indicating required irrigation doses) and tensiometers. The study aimed at evaluating if and to what extent simple tools can reduce irrigation water use and improve water productivity in drip-irrigated vegetable (beetroot; Beta vulgaris L.) production compared with the farmers’ usual practice. Irrigation water use was substantially reduced (around 20%) when farmers irrigated according to the tools. However, farmers did not fully adhere to the tool guidance, probably because they feared that their crop would not get sufficient water. Thus they still over-irrigated their crop: between 38% and 88% more water than recommended was used during the treatment period, resulting in 91% to 139% higher water use than required over the entire growing cycle. Water productivity of beetroot production was, therefore, much lower (around 3 kg/m3) than what can be achieved under comparable conditions, although yields were decent. Differences in crop yield and water productivity among treatments were not significant. The simplified Water Chart was not sufficiently understandable to farmers (and technicians), whereas tensiometers were better perceived, although they do not provide any indication on how much water to apply. We conclude that innovations such as drip irrigation or improved irrigation scheduling have to be appropriately introduced, e.g., by taking sufficient time to co-produce a common understanding about the technologies and their possible usefulness, and by ensuring adequate follow-up support.
1. Introduction
Small-scale irrigation can improve food security and nutrition, raise incomes, reduce poverty, and enhance rural livelihoods of poor farmers in the Global South [1,2]. Particularly in view of climate change (e.g., increased variability of precipitation), diversification of farming through irrigated cash crop production may reduce risks and increase resilience of rural populations [1]. Numerous initiatives, therefore, promote small-scale irrigation of high-value crops and the use of water-efficient irrigation technologies such as drip-irrigation systems. Since fresh water is limited and agriculture globally uses more than two thirds of all accessible fresh water resources, technologies with the potential to reduce irrigation water use (such as drip irrigation) and proper irrigation management are greatly needed [3].
However, determining amounts and frequency of irrigation often represents a serious challenge for farmers, particularly for small-scale producers in developing countries who are shifting to drip irrigation [4,5,6,7,8]. Without access to adequate support, technologies and tools, farmers tend to over-irrigate, and the benefits of “efficient” irrigation technologies, such as drip irrigation, can be compromised considerably.
The reasons for over-irrigation with drip systems are manifold: On the one hand, farmers’ perceptions and their (comprehensible and often rational) ways of thinking may render irrigation management less efficient than possible [9]. On the other hand, technical issues relating to drip irrigation systems may (further) hamper the efficient use of the technology [4]. Small-scale farmers in developing countries rarely know how much water their crops require, and they often do not know how much water they are applying. Simple tools to indicate irrigation requirements of crops according to species and growth stage as well as climatic conditions might thus contribute to more efficient water use in agricultural production and possibly reduce work load and energy use and costs. Irrigation scheduling can be based on irrigation calendars, plant indicators, soil moisture assessments, or water balance calculations that consider climatic parameters influencing crop water use. Tools facilitating irrigation scheduling may, therefore, be based on any of these aforementioned scheduling approaches or combinations thereof.
Such tools and technologies already exist, such as the “Water Chart” (or Water Wheel or Drip Planner Chart), a table indicating required irrigation doses. We tested the suitability of the Water Chart and low-cost tensiometers for irrigation scheduling in Nicaragua. The objective of this study was to assess and evaluate if and to what extent simple tools facilitating irrigation scheduling can reduce irrigation water use and improve water productivity in drip-irrigated vegetable (beetroot) production compared with the farmers’ usual practice. The study not only considered technical aspects but also examined farmers’ perceptions and reasons for their behavior.
2. Materials and Methods
In a trial near Sébaco, Nicaragua, two tools to facilitate irrigation scheduling were tested: the Water Chart and tensiometers. The trial was carried out with 12 farmers of AGROFOR, a farmers’ organization supporting small-scale vegetable producers, in the villages Las Tunas, Apompua and La China, approximately 6 km south of Sébaco, Nicaragua. The farms are located on Mollisols in the Sébaco valley [10], a fertile plain in the Nicaraguan interior, known for rice and vegetable production. Farmers were already experienced in commercial irrigated vegetable production and expected to have access to irrigation water during the trial period in the dry season (mid-January to mid-May 2016). Each farmer had to irrigate three banks of beetroot according to three randomly allocated irrigation schedules:
- irrigation scheduling according to the Water Chart;
- irrigation scheduling according to tensiometer readings; and
- irrigation according to the farmers’ experience and knowledge (as they usually do).
2.1. Water Chart
The Water Chart is a table indicating how much irrigation water to apply at pre-defined intervals according to pre-calculated values (Figure 1). Calculations are based on climate data and crop factors (Kc) as described by Allen et al. [11]. The tool is an adaptation of the “Drip Planner Chart” developed by iDE and Wageningen University [12] based on the “Water Wheel” designed by iDE [13,14]. Considering the experiences of Mupfiga [15] and Yakami [16] with the “Drip Planner Chart”, the method was simplified by merging the development and mid-season stages (using the Kc values of the mid-season stage). Thus, only required irrigation water quantities for initial, mid, and late crop growth stages were provided to reduce the amount of information on the chart. Irrigation recommendations were based on average climate data of Managua airport (ClimWat 2.0) [17] and on Kc values and length of crop growth stages from Allen et al. [11], considering the area irrigated by one emitter. The chart assumes 70% irrigation efficiency and an emitter spacing of 0.2 × 0.3 m. To determine the amount of water applied through the drip irrigation system, a device was developed to indicate water application depth by measuring the amount of water applied through one emitter (Figure 2). This water application depth gauge was made of a cylinder buried in the soil that captured the water of one emitter, and was equipped with a graded stick on a floater. One of these devices was installed in each Water Chart treatment at an emitter with an average emitter flow of the lateral on which a water meter was installed. Before irrigating, farmers had to empty the cylinder; during irrigation it would capture the water and the floater would raise the stick with the scale. The farmers were instructed to stop irrigation as soon as the relevant value (number of dL irrigation water per emitter) read from the Water Chart was visible on the scale. Together with the Water Chart the farmer could thus irrigate according to the crop water requirement.
2.2. Tensiometers
Low-cost, self-made tensiometers made from polyvinyl chloride (PVC) tubes with a porous ceramic cup at the bottom, equipped with a screw-in manometer (vacuum gauge) ranging from 0 to 1000 mbar were used in the trial (design by Seecon GmbH). The threshold for irrigation of beetroot was assumed to be 400–500 mbar (e.g., [18,19]); to be on the safe side we set it at 350 mbar. The original display of the manometer was covered with a customized display indicating three ranges: “enough water”; “irrigate” (350–500 mbar); and “water lacking” (Figure 3). The colors and range names were deliberately chosen to be as neutral as possible and giving the farmers confidence not to irrigate before the threshold. Project and AGROFOR field staff installed two tensiometers with the tip of the porous cup at a depth of 0.2 m, approximately 0.4 m apart at each trial farm in the tensiometer treatment. The tensiometers were located close to the lateral of the drip-irrigation system between two emitters. Before installation the tensiometers were soaked in water for some hours. Installation was done before sowing into the dry soil.
2.3. Experimental Setup
Treatment plots (banks) were 8 m long and 1 m wide (Figure 4). All treatments were installed side by side on flat terrain, and treatment allocation was randomized. The same main tube fed all three treatments. Water was applied using three laterals of iDEal técnologías microtube drip irrigation systems for each treatment. Each lateral could be managed individually with a valve. We installed water meters (volumetric multi-jet water meters, 1” diameter, manual reading) in the middle lateral of each treatment (i.e., we measured at each farmer three laterals out of nine used in the trial). All farmers were experienced in irrigated vegetable cultivation, but not all had used iDEal drip-irrigation systems before. The farmers managed the crop according to their knowledge and usual practice. They were frequently visited by the project staff and by AGROFOR’s technicians.
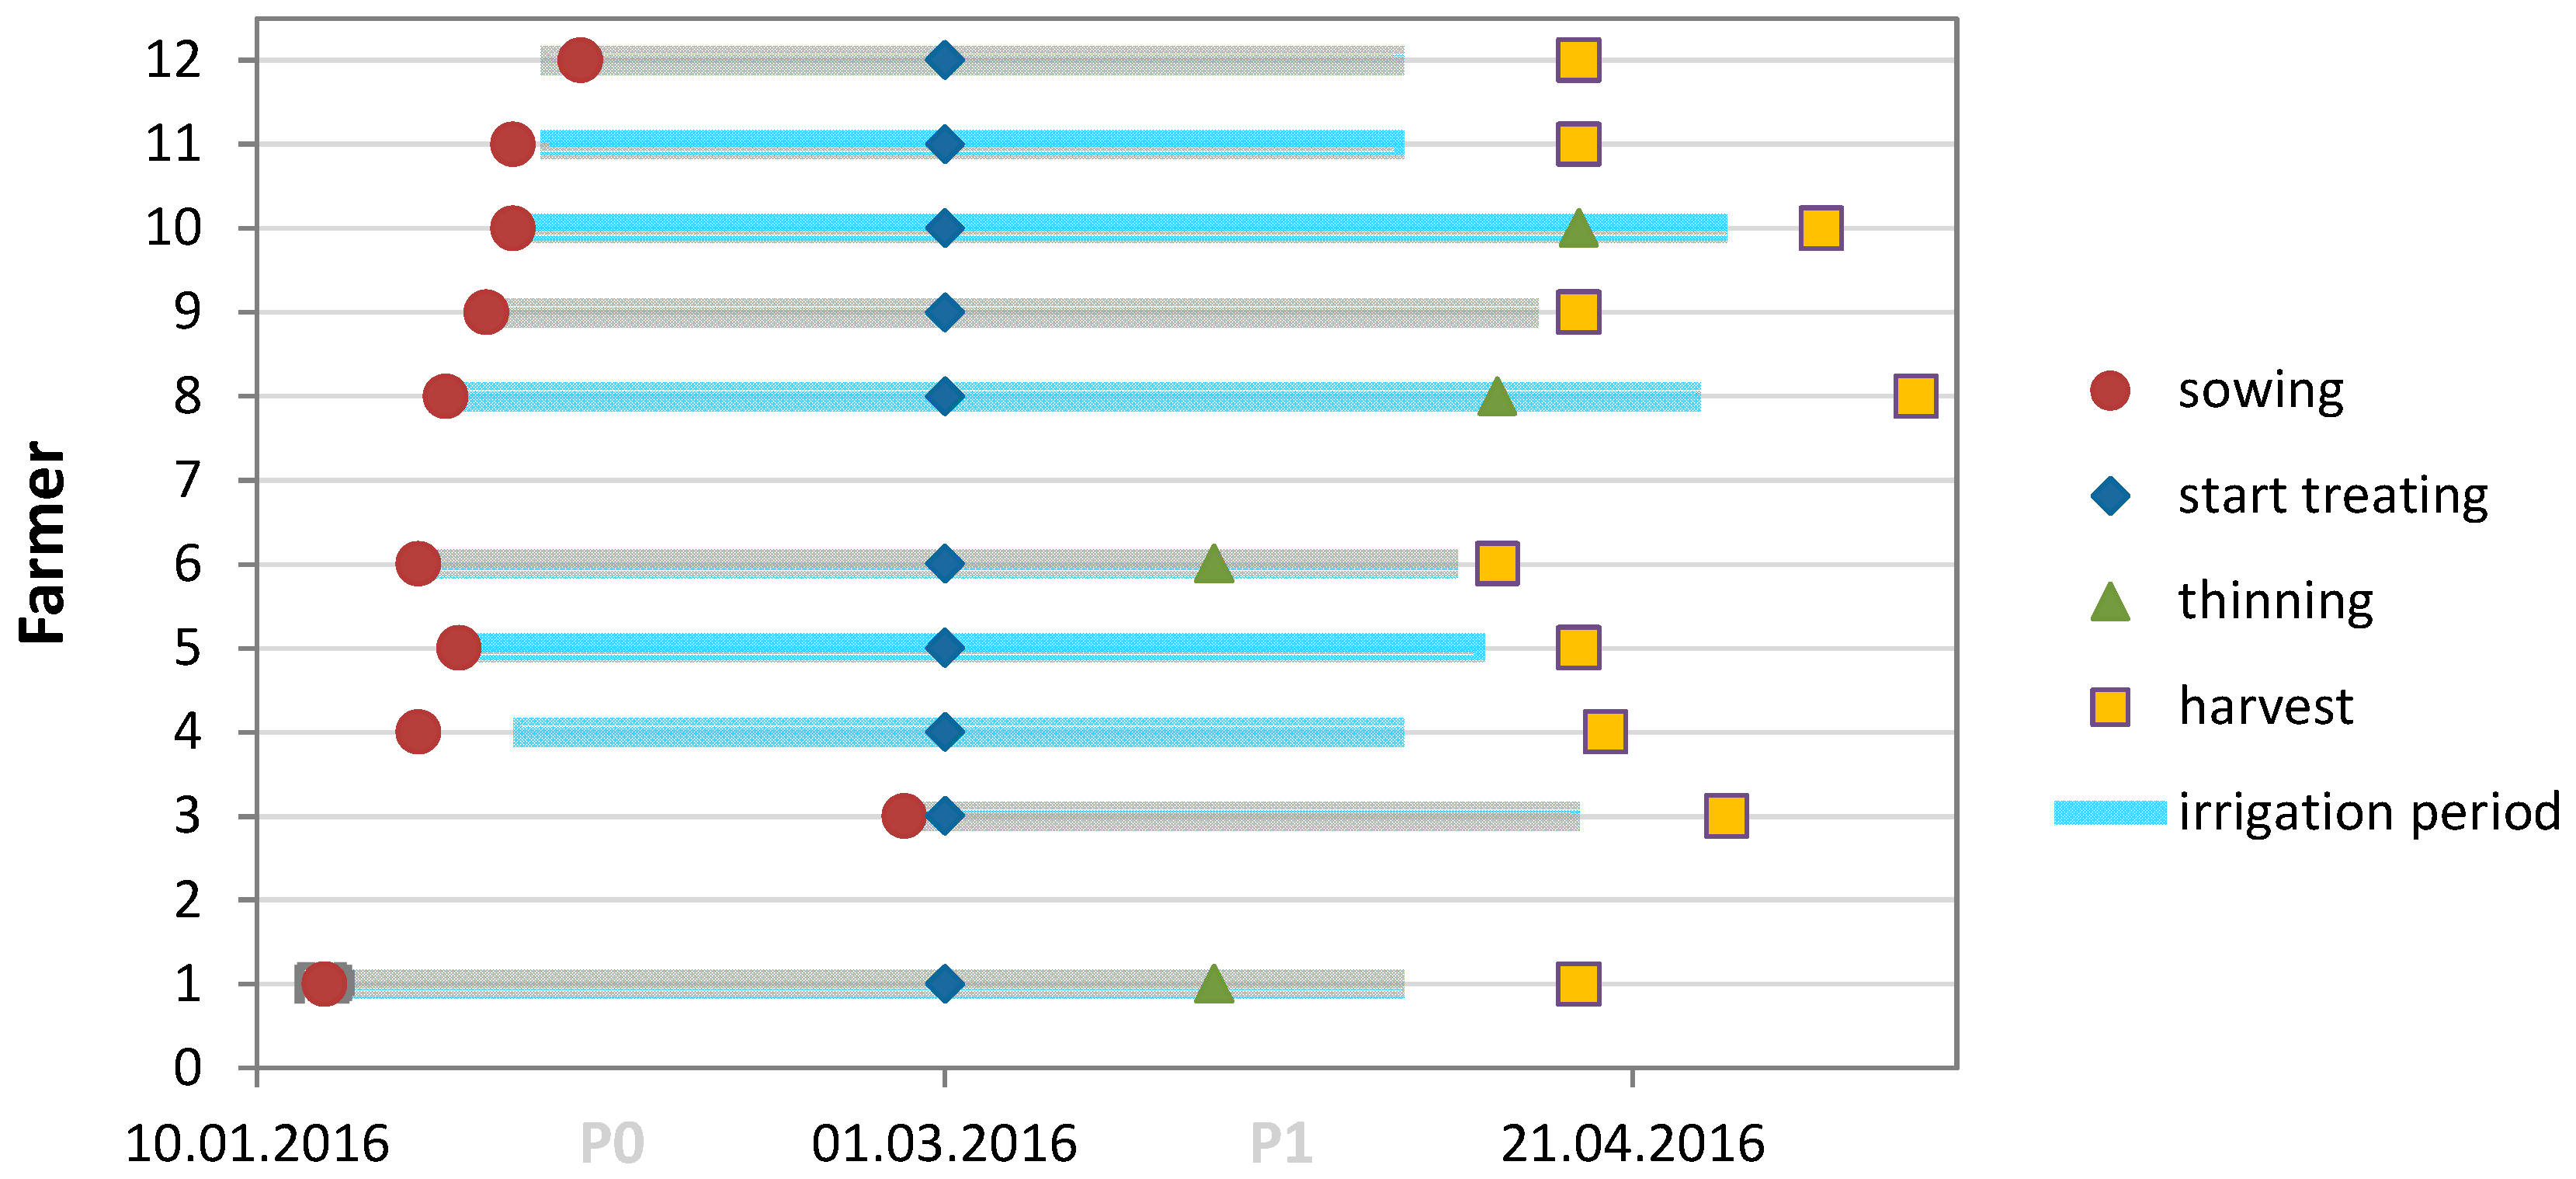
Beetroot (Beta vulgaris L. ssp. vulgaris var. conditiva Alef.) was selected (together with farmers and technicians) as a trial crop because it has a short growing cycle and can be harvested at one time (or at least over a short period). Beetroots were sown in rows at 70 plants per m2 directly in the field. Planting was supposed to be done on the same day for all treatments, however, some farmers sowed (or had to re-sow) at different dates (Figure 5). For the first weeks after sowing (P0), farmers were instructed to irrigate according to their knowledge and experience as tensiometers are only yielding useful results once roots are developed. Irrigation scheduling according to the tools started from 1 March (P1). Some farmers started to harvest the largest beetroots from 21 March to give more space to the remaining crop (see “thinning” in Figure 5). Farmer 3 replanted on 12 February and again on 27 February. Farmer 2 replanted twice but had 100% crop losses due to chickens. Farmer 7 had 100% crop loss due to negligent management. Farmers 2 and 7 were excluded from the analysis.
2.4. Irrigation and Related Calculations
Farmers were asked to record when they irrigated each treatment and for how long. Field staff visited the farmers at least once every week and recorded and photographed the values on the water meters. The total amount of irrigation water applied per treatment was calculated as water measured by the water meter installed at the middle lateral of each treatment multiplied by 3 and corrected by the number of emitters on each of the three laterals. Water productivity was defined as fresh yield (kg) per irrigation water application (m3); water productivity in terms of gross revenue per irrigation water used was not analyzed because beetroot prices dropped drastically during the trial and many farmers preferred to give the harvest away or use it as fodder rather than selling it.
Recommendations for irrigation doses were derived from the Water Chart according to the number of days elapsed since the last irrigation date. If the interval was more than three days, values from the table were summed up accordingly. For the last 14 days before final harvest it was recommended not to irrigate anymore. However, not all farmers kept to this recommendation; on average, they irrigated for the last time 10 days before harvest.
Since irrigation scheduling according to the treatments only started after 1 March, water application as well as irrigation needs and recommendations were calculated separately for P0 and P1. Crop water requirements used for comparisons with actual irrigation water applications were estimated based on CropWat version 8.0 [20] using climate data from ClimWat for Managua airport but adjusting coordinates and elevation for Sébaco. Crop parameters were adjusted for each individual farmer considering different planting and harvest dates.
2.5. Harvest and Post-Harvest Survey
The three treatments were harvested separately on the same day with field staff being present. Biomass [kg] and marketable yield [kg] of the entire cropped area (measured exactly at harvest) were recorded and beetroots counted. Using a questionnaire, farmers were interviewed after harvest to assess their perceptions of the usefulness of Water Chart and tensiometers as irrigation scheduling tools.
2.6. Statistical Analysis
Statistical analysis was performed using version 3.3.3 of the statistical software R [21] by fitting a linear mixed model from package nlme (version 3.1-129), using farmers as blocking variable. After analysis of variance, several multiple comparison tests were performed to compare treatments; significant differences were accepted at p ≤ 0.05.
3. Results
3.1. Irrigation Water Applications in the Different Treatments
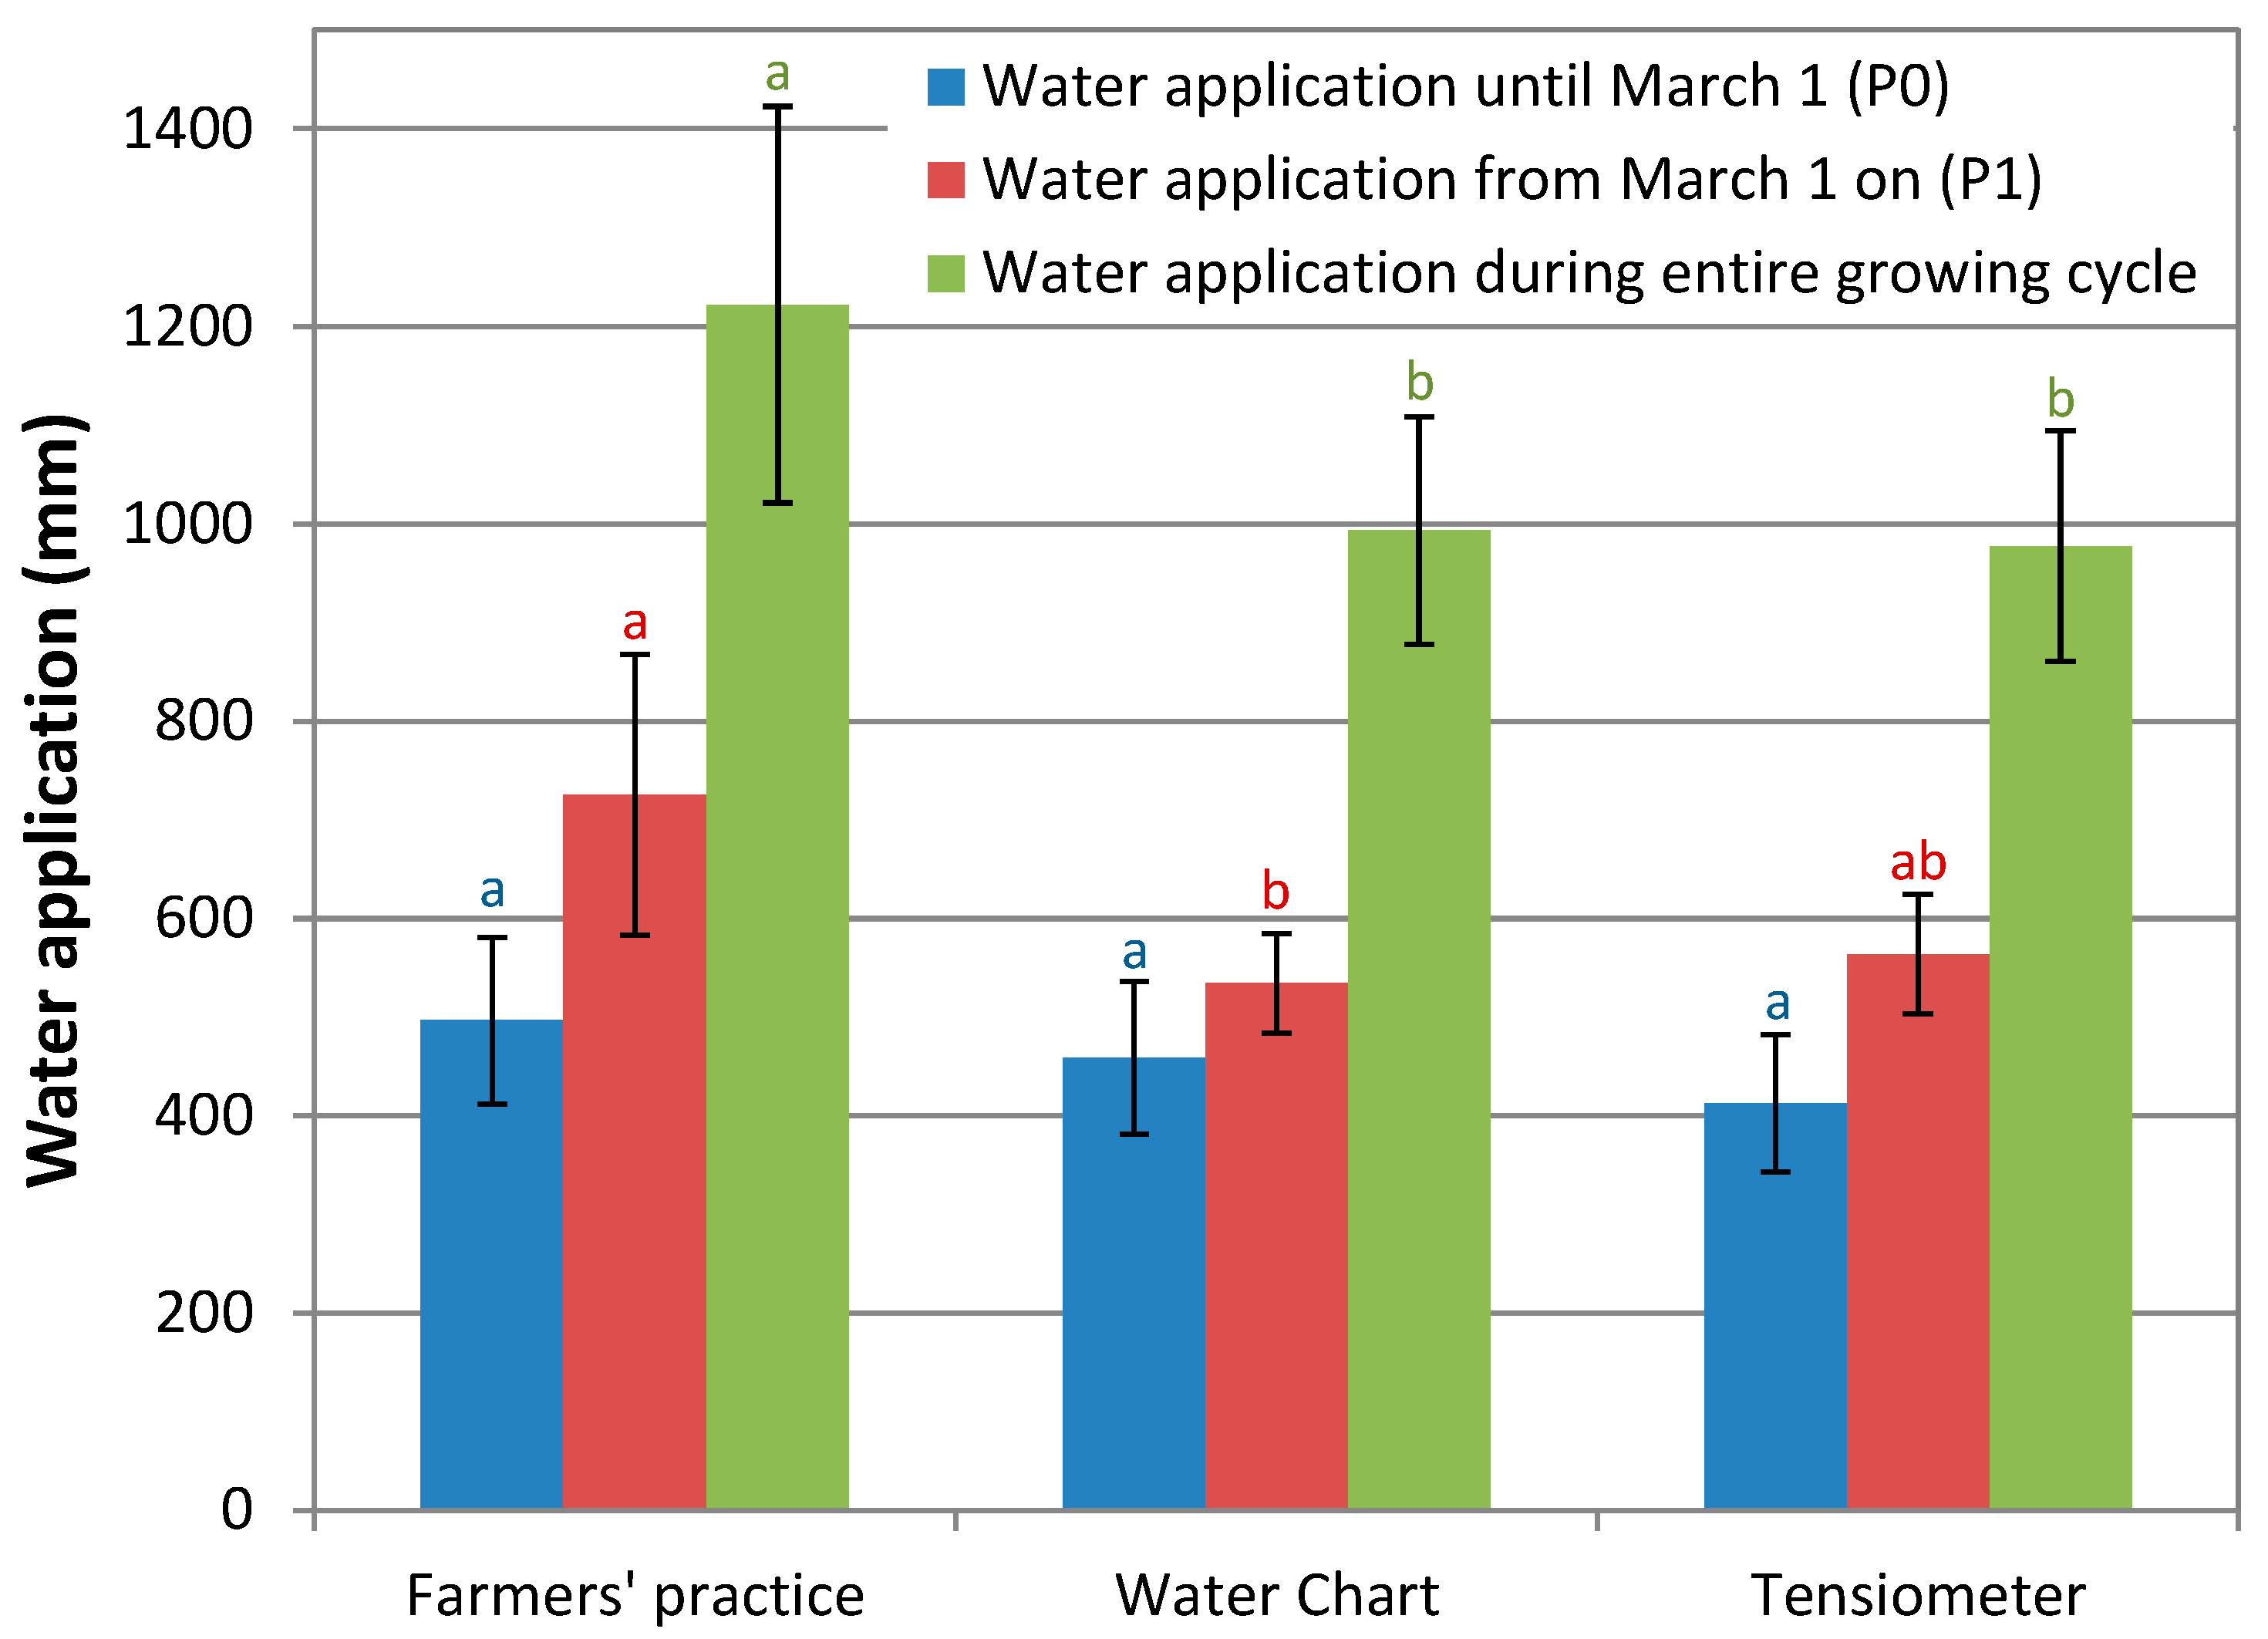
Water applications were significantly lower (p < 5%) in the two treatments where irrigation scheduling tools were applied, but there was no significant difference between the Water Chart and tensiometer treatments. Over the entire growing period, over 200 mm more water was applied under farmers’ practice than in the other treatments (Figure 6). The influence of the treatments was less clear (p = 9.1%) when only looking at P1, i.e., the period during which different irrigation schemes were applied. But differences in water application mainly originated from P1, indicating that the tools did indeed have an effect on irrigation practice. However, variability in water application was proportionally higher during P1, and thus the difference among the treatments was less significant.
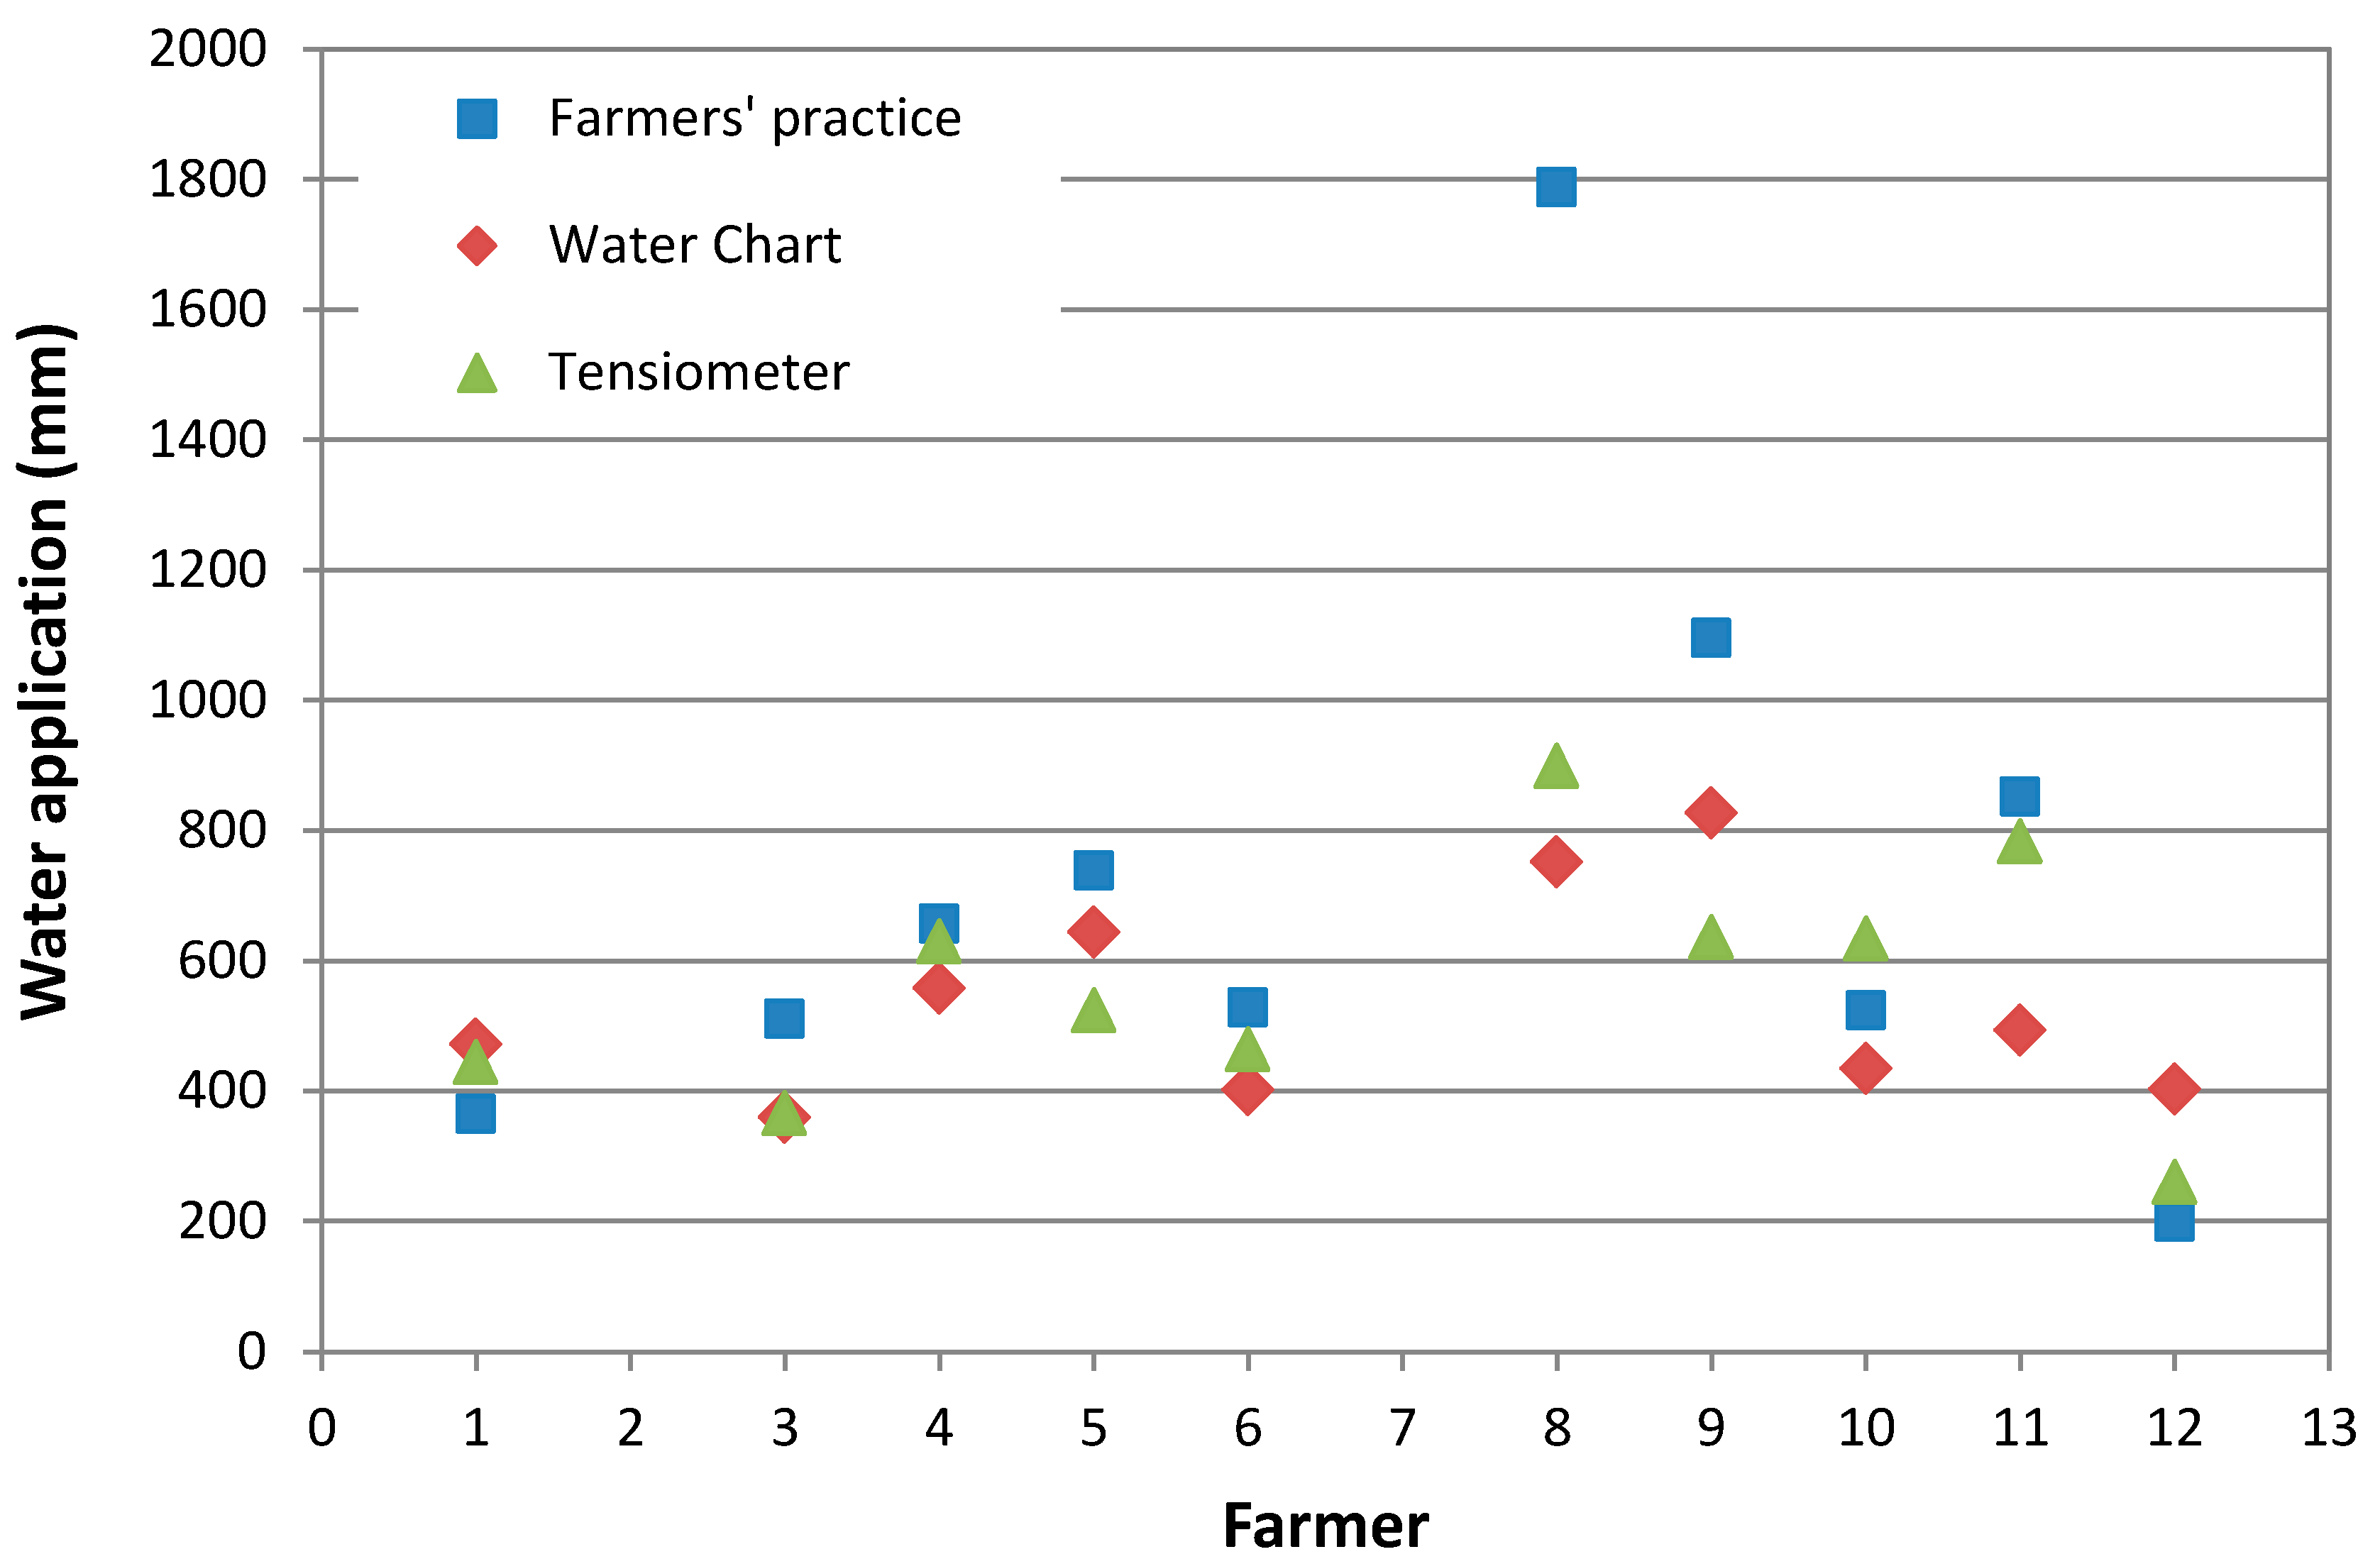
On average, farmers irrigated 1222, 993 and 977 mm in the control (farmers’ practice), Water Chart and tensiometer treatments, respectively, of which 726, 534, and 564 mm, respectively, were during P1. This is equivalent to a 19% and 20% reduction in water use in the Water Chart and tensiometer treatments compared with the control treatment over the entire growing cycle, and 26% and 22% during the period when the irrigation scheduling tools were applied (P1). There was no rain during the trial period, and one farmer (farmer 12) ran out of water. With few exceptions (mainly farmers 8, 9, and 11), irrigation water applications were similar for all treatments on individual farms (ICC = 0.56), but differed considerably among farms (Figure 7).
3.1.1. Actual Water Applications vs. Recommendations and Irrigation Requirements
The recommended irrigation dose for the Water Chart treatments of all farmers was, on average, 389 mm for period P1 (min: 270, max: 663, median: 336; values derived from the Water Chart; different values are due to different sowing and harvest dates). These 389 mm included 43% (=1/0.7) more water than the irrigation requirement for P1 (of 272 mm) calculated for the Water Chart, to account for an assumed irrigation efficiency of 70%. CropWat [20] calculated for the same period an average crop evapotranspiration of 232 mm (min: 165, max: 373, median: 208); the difference to the values indicated by the Water Chart are due to the simplifications applied for the chart (mainly combining the development and mid-season stages using the Kc values of the mid-season stage). Including the additional water to account for the assumed irrigation efficiency of 70%, farmers would have had to irrigate 331 mm according to CropWat calculations.
Comparing these recommendations for irrigation from the Water Chart and CropWat with the actual irrigation applications by the farmers during P1 (Figure 8) we note that the farmers used 38% more water than recommended by the Water Chart (62% more than calculated with CropWat) in the water chart treatment, 46% more than suggested by the Water Chart (71% more than calculated with CropWat) in the tensiometer treatment, and 88% more than recommended by the chart in the farmers’ usual practice (119% more than required according to CropWat). These figures clearly demonstrate that farmers used considerably more water than suggested and required.
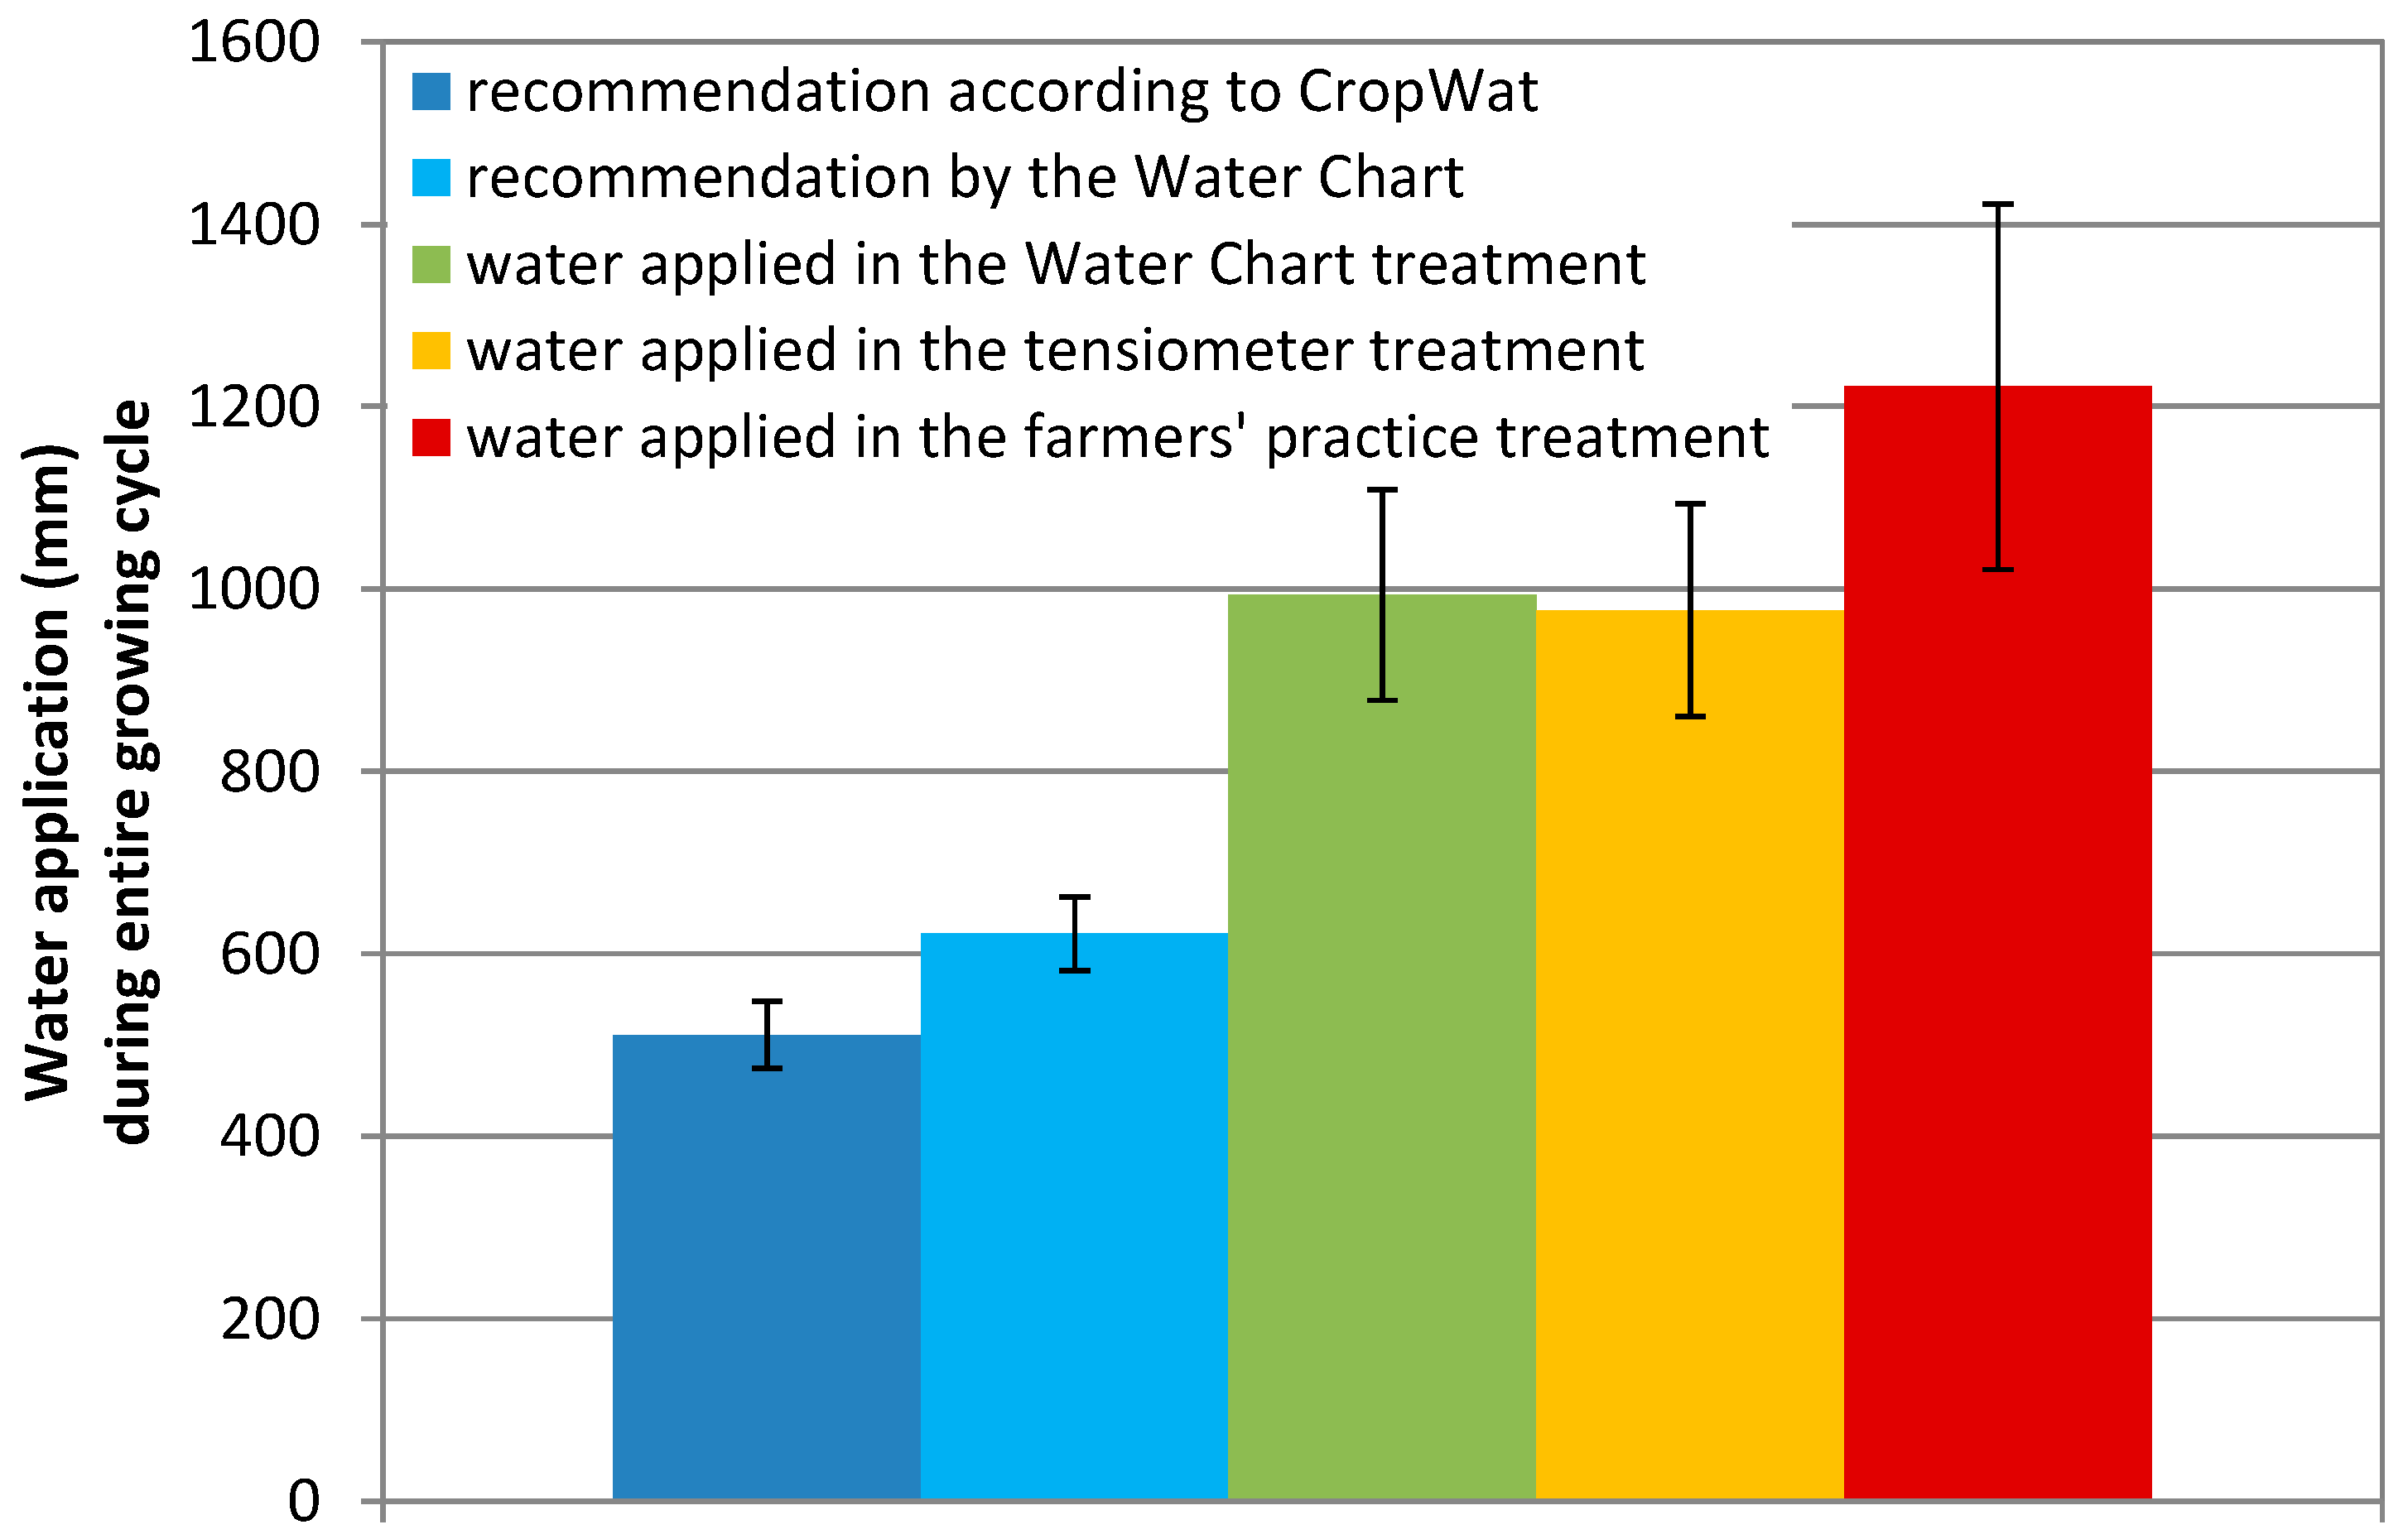
Considering the entire growing period, over-irrigation is even more striking (Figure 9): irrigated according to the farmers’ usual practice the crops received almost 2.5 times more water (1222 mm) than required (511 mm; calculation by CropWat) or twice as much as recommended by the Water Chart (622 mm). Water application in the two treatments where irrigation scheduling tools (Water Chart and tensiometer) were used was similar: 229 mm (19%) and 245 mm (20%) lower than under farmers’ practice. Still, this is 94% and 91% more water than required (as calculated by CropWat), and 60% and 57% more than suggested by the Water Chart.
3.1.2. Adherence of Farmers to Irrigation Scheduling Recommendations
The recommendations for the farmers were made to cover irrigation water requirements from the start of the treatments (from 1 March onwards) until 14 days before the final harvest (according to the recommendation by several farmers not to irrigate beetroots any more during the last 14 days before harvest). Correspondingly, also the calculations of irrigation water needs by CropWat were based on this period. For the Water Chart treatment, we instructed all farmers to continue irrigating up to 14 days before the harvest using the recommendations of the middle column of the chart, i.e., for the development/mid-season stage.
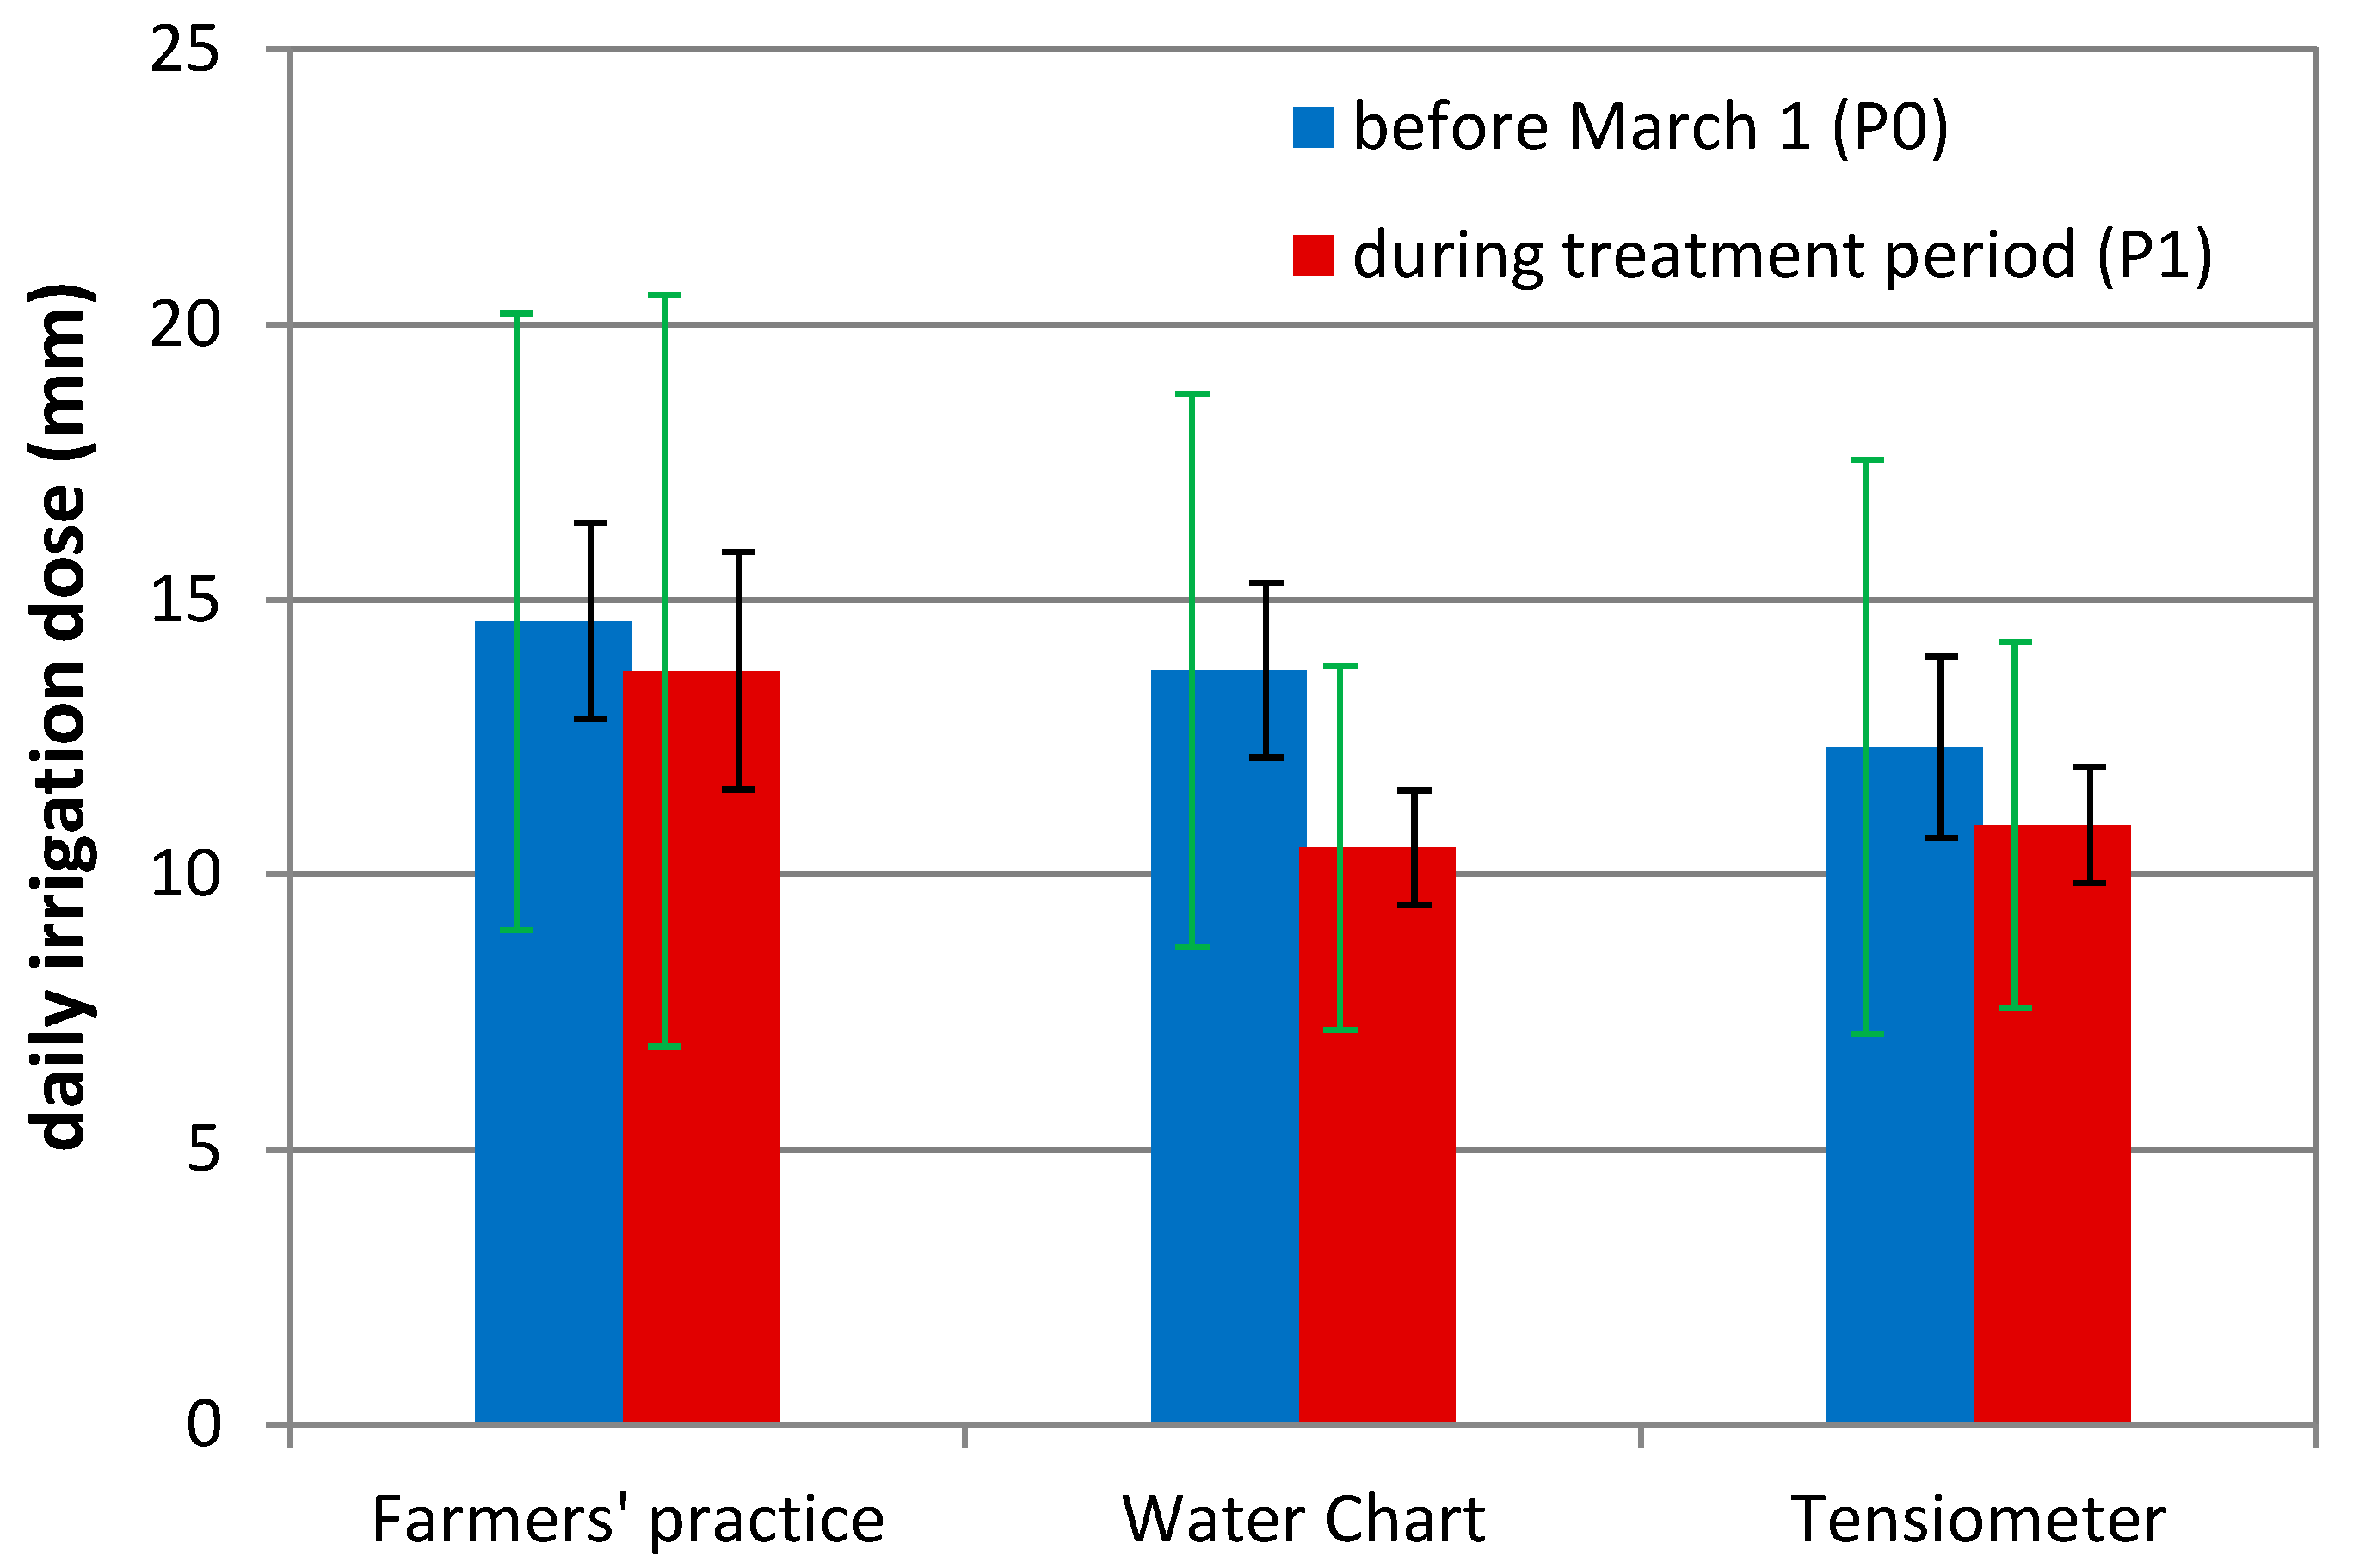
Farmers used almost 40% more water than recommended for the Water Chart treatment; this means that farmers did not fully follow the recommendations. In the final evaluation of the trial the farmers mentioned, for example: “When irrigating the tensiometer plot, I also gave a little bit to the ‘Water Chart’ plot”. Nevertheless, farmers applied significantly less water per day (average daily water application in mm) during P1 than during P0, particularly when using the irrigation scheduling tools (Figure 10). This means that the farmers did consider the recommendations at least to a certain extent.
Using the irrigation schedule guided by tensiometer readings, the farmers irrigated, on average, 977 mm during the entire growing period. This is 91% more than the irrigation requirement calculated with CropWat (which is 511 mm considering 70% irrigation efficiency) or 59% more than indicated by the Water Chart (615 mm, specifically for the Water Chart treatment). During P1, irrigation was 71% higher (564 mm) than requirements calculated with CropWat (331 mm) or 49% more than indicated by the Water Chart (380 mm, specifically for the Water Chart treatment). Four farmers mentioned that they “had to” irrigate before the tensiometer indicated it, “because plants were suffering”. One farmer reported the tensiometer was indicating irrigation too early.
In contrast to the Water Chart, tensiometers do not indicate how much water should be applied but indicate when to irrigate the crop. In the tensiometer treatment, farmers did not irrigate the crop as often as in the other treatments, but they irrigated with higher amounts than necessary. The tensiometer treatment was on average irrigated 24 times whereas the other treatments 27 times.
3.2. Crop Yields
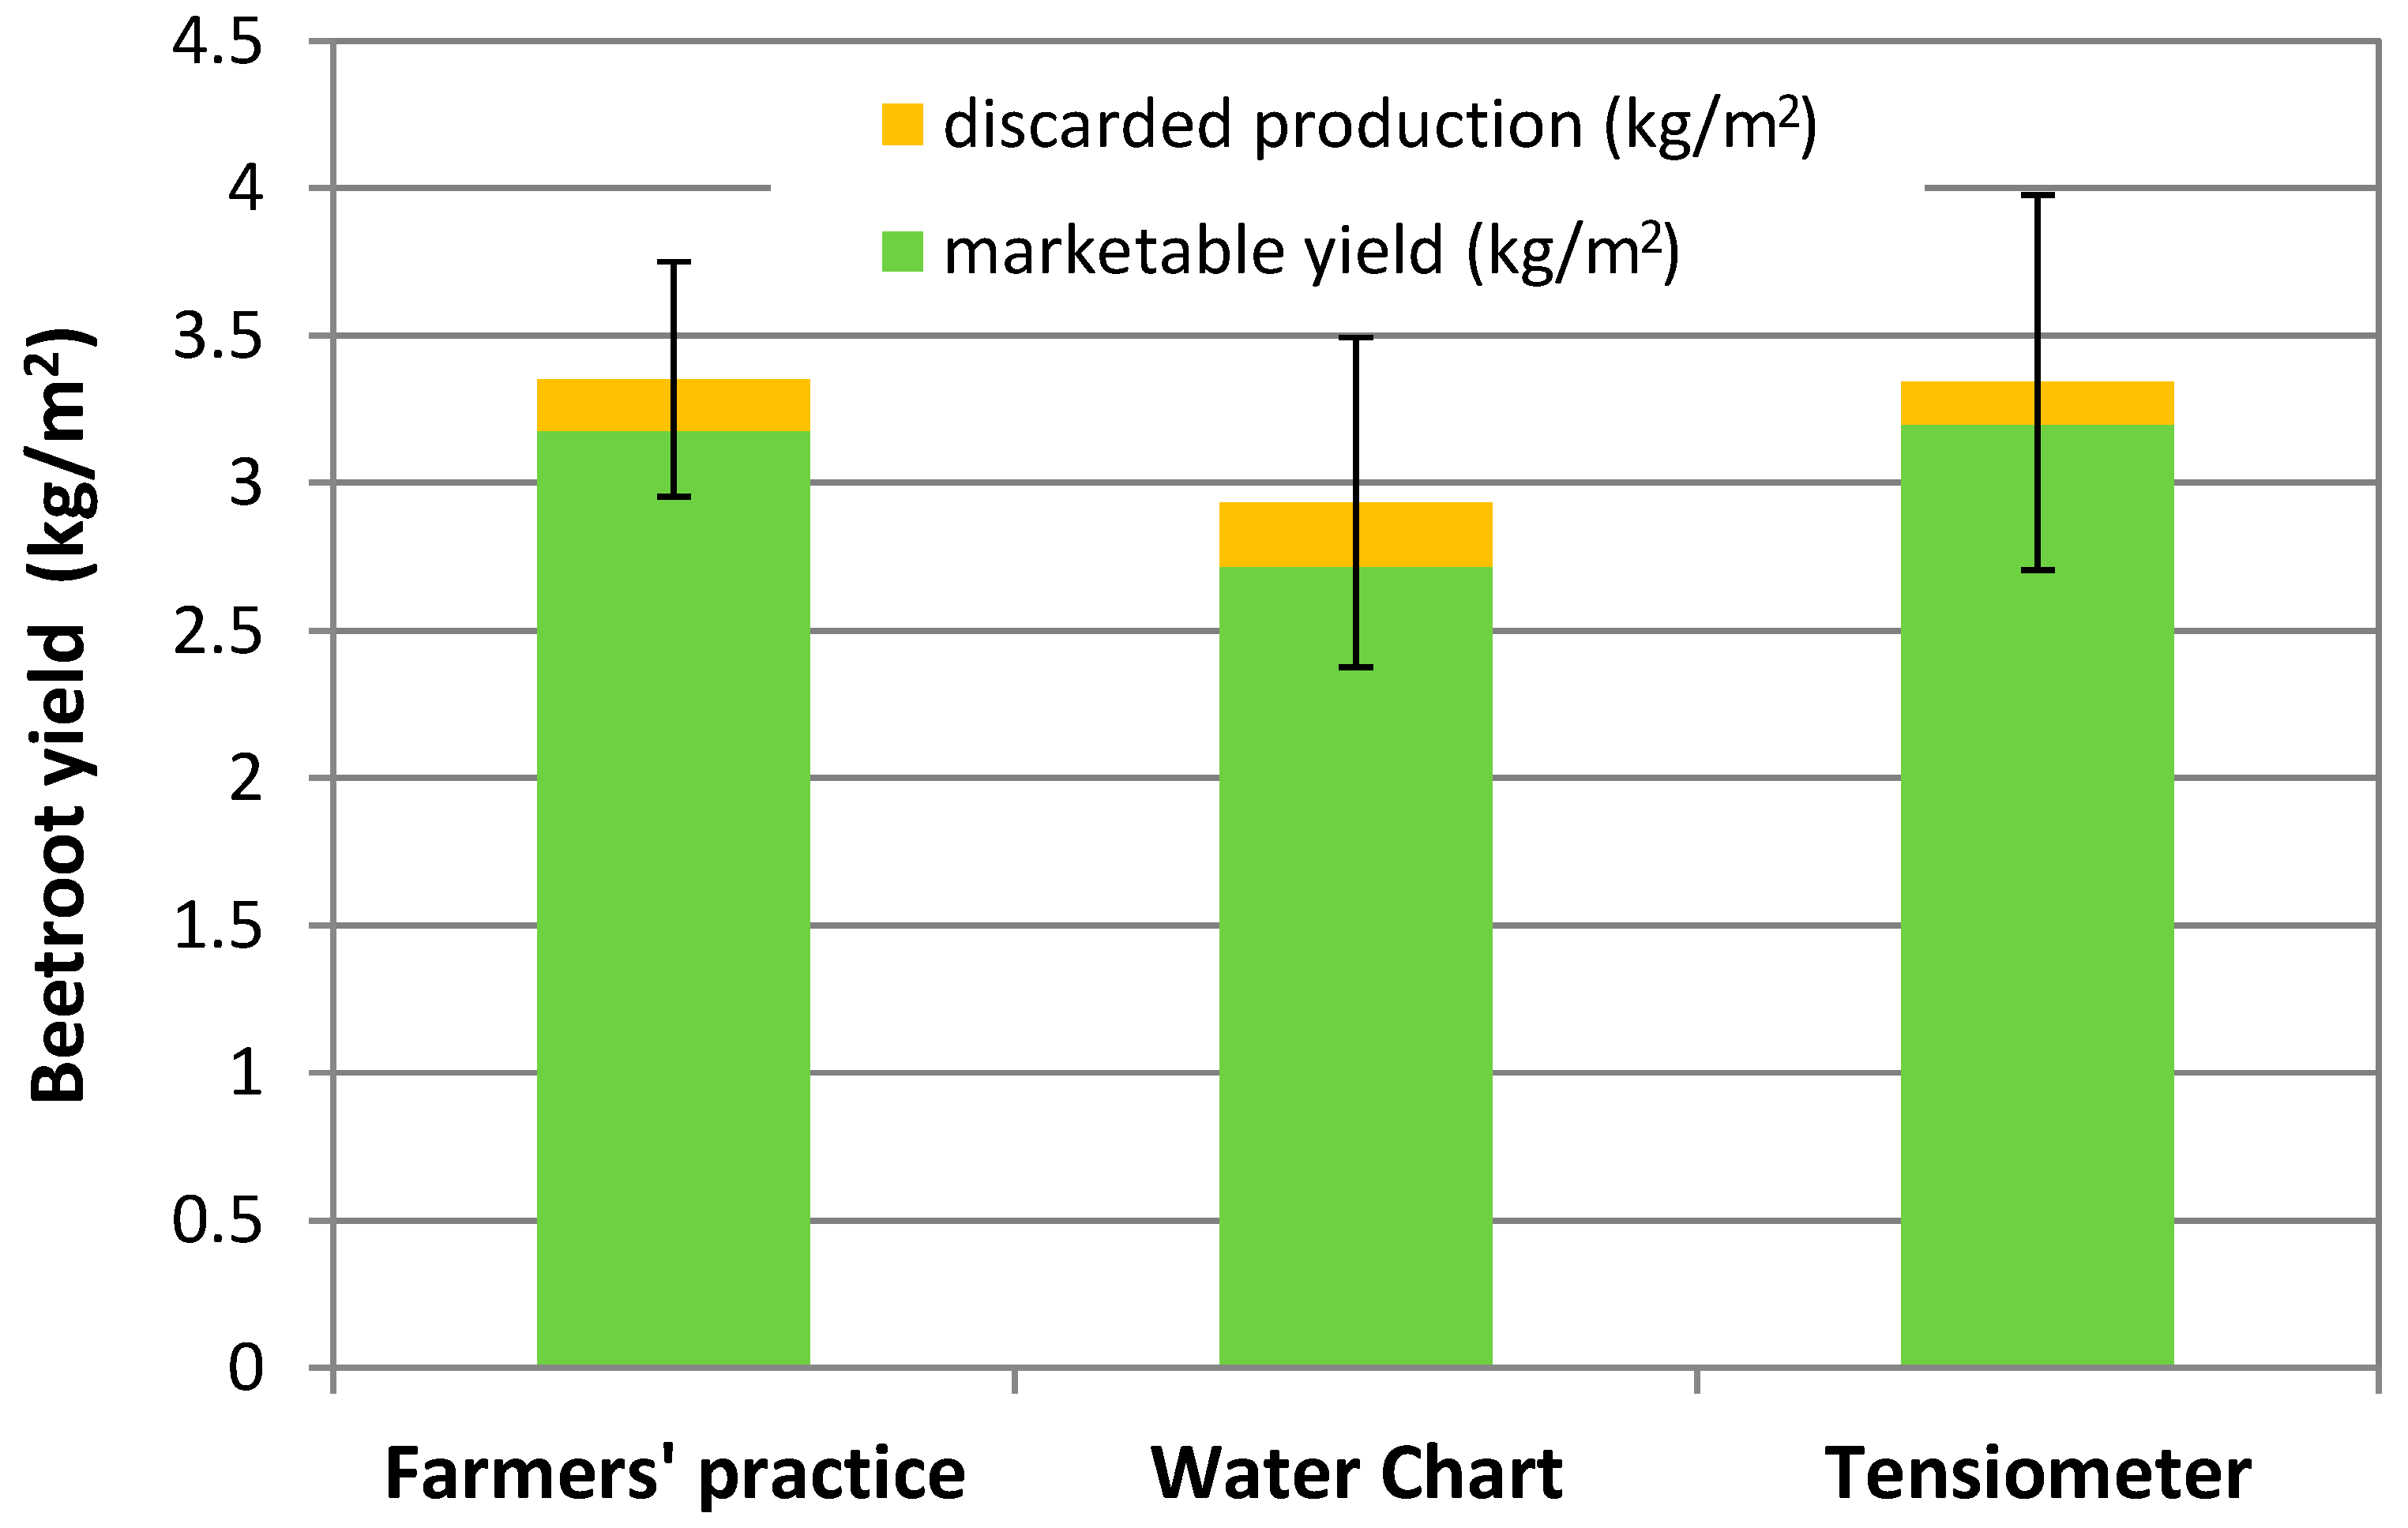
There was no significant difference (α = 5%) in crop yield among treatments, but yields in the Water Chart treatment were slightly lower than in the two other treatments. The marketable yield of 30 t/ha, on average, can be considered a good yield as it is attaining Australian levels (which are between 30 and 40 t/ha [19]) and is above “good yields” (of 25 t/ha) in South Africa [22]. However, there were significant differences among farmers with a minimum yield of 3.7 and a maximum of 74 t/ha (or 10 and 59 t/ha averaged over all three treatments). Average yields were 30 t/ha of marketable produce or 32 t/ha including discarded beets (Figure 11). Detailed analysis of numbers of harvested beets, their individual weight, or amounts of discarded beets did not offer any further explanations about possible effects of the treatments on yields.
3.3. Water Productivity
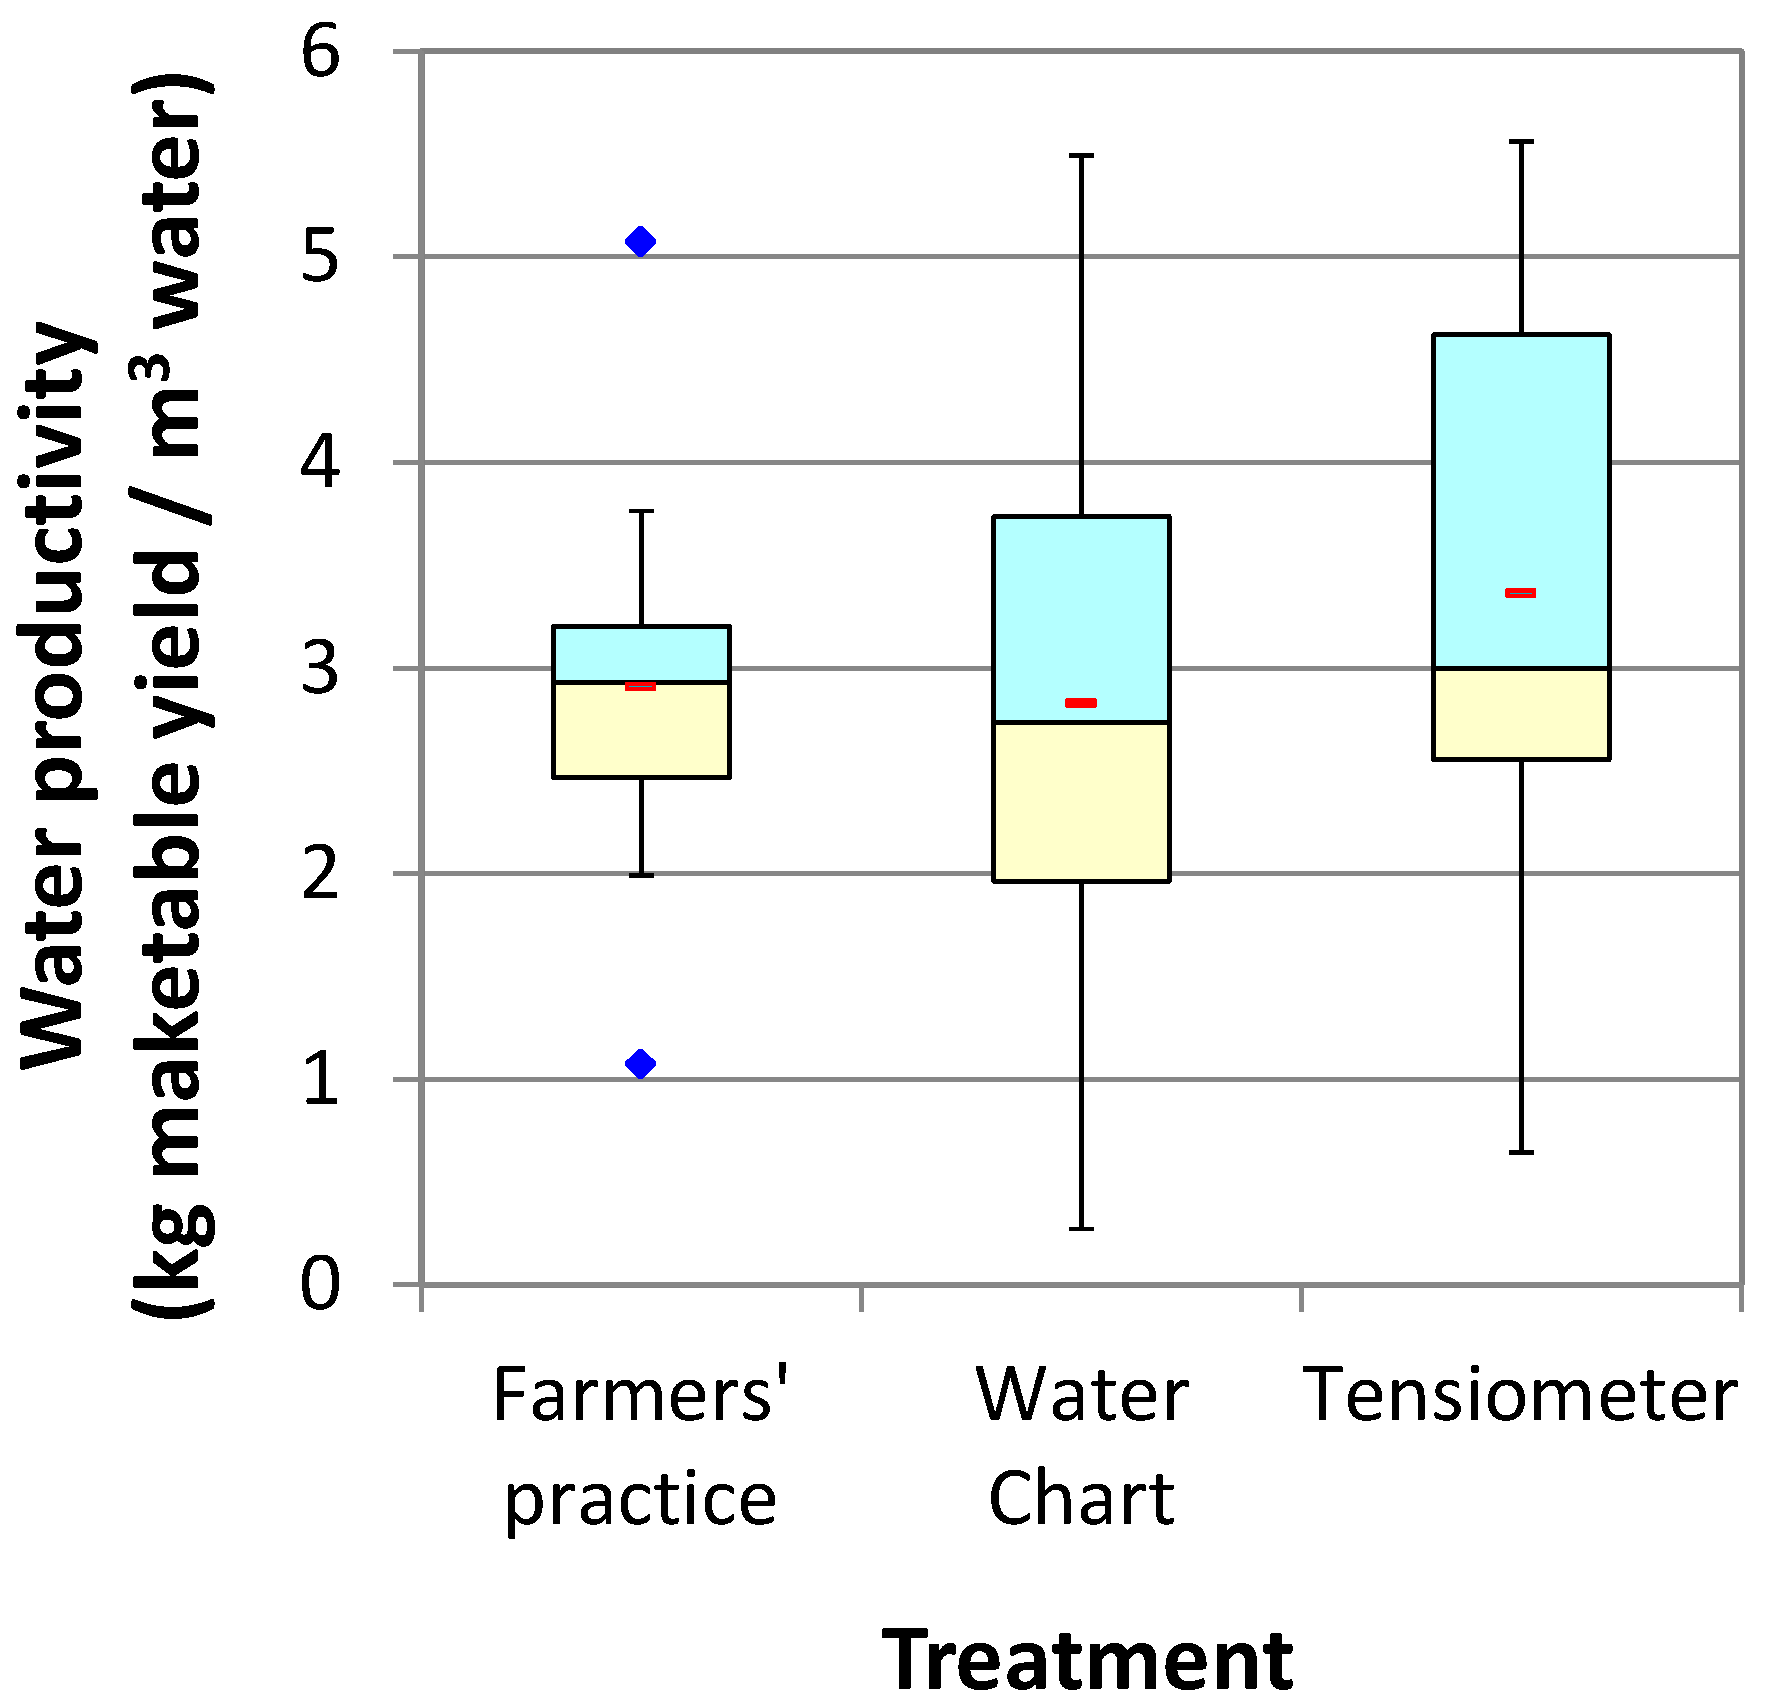
No significant differences in water productivity among treatments were detected (Figure 12). Water productivity was somewhat higher in the tensiometer treatment because irrigation water use was lower than under farmers’ practice and yields slightly higher than in the Water Chart treatment (Figure 13). There were significant differences in water productivity among farmers that can be mainly explained by differences in crop yields.
Irrigation water productivity (kg of marketable yield per m3) was 2.83, 2.91 and 3.36 kg/m3 for farmers’ practice, the Water Chart and tensiometer treatments, respectively. These values are low compared with the 8.5–16 kg/m3 found in Australia [19], 9.6 kg/m3 in South Africa [23], or 6.7 and 12.9 kg/m3 for furrow and drip-irrigated beetroot in the Southeast of Kazakhstan [24]. The low water productivity realized by our farmers in Sébaco is not due to low yields, but rather to over-use of irrigation water.
4. Discussion
4.1. Use and Perception of Irrigation Scheduling Tools
The survey after the trial has shown that farmers would be glad to have a tool that helps them in irrigation scheduling. However, they were rather analytical and critical: such a tool should be simple, not increase workload, and, according to the farmers, possibly allow them to do something else during irrigation time. However, we are not convinced that the latter is a valid argument: required irrigation time is short (a few minutes with daily irrigation) and can thus be used to check the condition of the crop (diseases, pests, etc.) or whether the irrigation system is functioning well (e.g., to check for plugged emitters).
4.1.1. Water Chart
Even our simplified chart was difficult to explain to both farmers and field staff. The final survey confirmed this: farmers kept the chart in their homes and did not take it to the field when they were irrigating. This is one reason why we recommended to farmers to only use the mid-season values of the table. Field staff thus clearly marked for each farmer on the graded stick of the water application depth gauge how much he/she should irrigate.
All water application depth gauges worked well and were functional until the end of the trial. Farmers enjoyed directly seeing in the cylinder how much water they were applying. On the other hand, they complained that with the chart and cylinder they had to stay in the field during irrigation to know when they had to stop watering, thus they were not able to do something else during this time. We had realized from the beginning that the original Water Chart (“Drip Planner Chart”) was too complicated for our farmers (as observed by [15,16]). But even the chart developed for this trial, simplified at the cost of somewhat too high recommendations regarding irrigation water applications, was not simple enough for our farmers (and even technicians). Furthermore, the use of the simplified Water Chart requires assessing emitter discharge with the specially developed water application depth gauge. Field staff had to identify an emitter with representative discharge which was not a simple task in the case of systems with variable emitter discharge, because it involves measuring several emitters and measuring the flow rate at an inlet. This is too complicated to be useful in the field, although it might be easier in the case of drip systems with less variable discharge.
Another problem with the Water Chart is that the irrigation recommendations are relying, as with every scheduling method based on the estimation of crop evapotranspiration from meteorological data and crop coefficients, on various approximations and estimates. These assumptions concern the crop (vigor or stress, growth stages, canopy, rooting depth, etc.) as well as climatic parameters that are most often not measured locally and may vary considerably at small scales. Therefore, we are convinced that tools based on measuring soil moisture are better suited for small-scale irrigation scheduling than methods based on the estimation of crop evapotranspiration from meteorological data and crop coefficients. The latter are often too complicated for small-scale farmers in developing countries (such as the Water Chart) and require up-to-date weather data that are rarely available, whereas soil moisture measurements integrate the climate and crop aspects related to evapotranspiration and provide a composite indication of the water status in the soil.
4.1.2. Tensiometers
The farmers appreciated the tensiometers more than the Water Chart with water application depth gauge. They mentioned that “seeing” how much water there is in the soil was helpful. The customized manometer display indicating just three ranges of crop water availability was well received, and even illiterate farmers seemed to have used it without problems. The farmers wanted to know how to use the tensiometers for other crops. However, due to the crop-specific irrigation thresholds the display used in the trial is only suitable for beetroot. Specific displays for different crops would have to be developed, possibly for easy stick or clip on/off the manometer. They would have to consider irrigation thresholds of the desired crops and, preferably, also indicate the crop-specific installation depth for the tensiometer. Bearing in mind the experience with the Water Chart we fear that even an ingeniously designed display for several crops (indicating specific soil suction thresholds) would be too complicated for the farmers.
Although the farmers liked the tensiometers, not all of them did fully trust in the tensiometers’ indications of when to irrigate. Certain farmers mentioned that the indications by the tensiometers were wrong: one said the tensiometer indicated too early that irrigation was required; four farmers said that the indication was too late. Some farmers are convinced that they know better—and might not always be wrong. Assessing soil moisture with tensiometers is not trivial: they have to be installed at the right depth (which may differ with crop, crop stage, soil and environmental conditions, or management), they have to be controlled and kept working (by checking on leaks and refilling water), and crop-specific thresholds for irrigation have to be considered and respected. On all farms, at least one tensiometer was still working at the end of the trial. Some tensiometers, however, had stopped functioning, probably because the lid or the screw connection of the manometer was not airtight. Tensiometers have to be installed in the root zone of the crop for giving meaningful indications (or in several depths to get a clearer picture). We placed all tensiometers so that the porous ceramic cup would be 15–20 cm below the surface, i.e., in the root zone of beetroot with the highest root density [22,25]. However, it is possible that we did not capture the main rooting zone in some cases, because rooting may be influenced by various parameters.
Some farmers stated correctly that they could not use the tensiometers directly to determine the irrigation dose, i.e., to quantify how much (or how long) to irrigate: Tensiometers do not show changes in soil moisture immediately but need some time to establish equilibrium between soil suction and the negative pressure in the tensiometer. Thus it takes some minutes after the refill point is reached until the manometer shows “sufficient water”. Irrigation water applied during this lag time can be considered as over-irrigation. Hence, while the tensiometer indicates when to irrigate, it does not provide any indication on how much water to apply (required irrigation quantity or irrigation time). Such indications would be possible if tensiometers were used in conjunction with a water retention curve which allows quantifying how much water is required at a certain soil suction to refill the pore volume to field capacity [26]. In our trial, we had told the farmers to base irrigation doses on the recommendations given by the Water Chart.
4.2. Determining Irrigation Water Quantity
Knowing correct water applications implies two issues:
- (1)
- Farmers need to know how much water should be applied once the threshold soil moisture tension for irrigation of a specific crop is reached; this depends on soil characteristics and can, as mentioned above, be determined through a soil water retention curve [27,28]. Another method to optimize irrigation depth is to monitor soil moisture at bottom of the root zone, i.e., by identifying the moment when the irrigation water front reaches a certain soil depth [29]. This approach may, however, be compromised by the lag time tensiometers have in displaying increased soil moisture.
- (2)
- Farmers have to know how much water they are actually applying (e.g., per unit time). This is not obvious: particularly when irrigating through canals and ditches (gravity systems), it is difficult to estimate water application depth. But also in drip irrigation systems without pressure-compensating emitters (as in our trial) it is challenging to know water application quantities if no water meters are installed: drip systems are often directly connected to pumps which may run at different speed; this can result in different pressure and thus different discharge. Furthermore, certain drip-irrigation systems (as the iDE systems we used in the trial) have valves installed at each lateral. If farmers operate theses valves (e.g., to reduce pressure/discharge or to irrigate as quickly as possible) discharge throughout the entire system is affected. These factors also make it almost impossible to estimate and assess irrigation depth according to irrigation time and discharge; discharge (per time) may just vary too much. Additionally, we have experienced that irrigation durations reported by farmers are inaccurate as many do not have or use watches; considering the short irrigation time required in small-scale vegetable production this may result in considerable misjudgment of water applications and thus in substantial over- or under-irrigation. For investigations on irrigation water use and water productivity such deviations are not tolerable; thus, water applications have to be measured (with water meters) in such situations.
As farmers do not “see” how much water they are applying (the soil surface does not necessarily become moistened, one of the advantages of drip irrigation) they tend to apply more water than necessary to be sure that their plants get enough water. We are convinced that once appropriate irrigation depths are identified (by estimations or assessments of soil characteristics) and farmers develop a certain experience in irrigating with tensiometers, over-irrigation could be significantly reduced. This requires, however, a solid introduction to the method of irrigating according to tensiometer measurements (possibly through co-production of knowledge and common understanding [30]) as well as proper training and coaching (which was probably not sufficient in the case of our trial/farmers; see next paragraph).
4.3. Over-Irrigation and Possible Causes
Even though our farmers claimed that they would appreciate tools facilitating irrigation scheduling, it is not clear whether they would really trust such a tool and irrigate accordingly. In our trial they did not (fully) adhere to the recommendations given through the tools. There may be various reasons for not following the recommendations: some farmers indicated, e.g., that they irrigated more than the crop required to lower the soil temperature and create more favorable conditions for the crop during the hot dry season. It seems, however, that the farmers often do not risk giving less water than they are used to applying, i.e., they neither fully trust the Water Chart, the tensiometers nor us. Irrigation water applications differed considerably among the farms but were generally similar for all three treatments on individual farms; so it is likely that certain farmers were indeed reluctant to follow the recommendations.
This attitude of the farmers confirms our observations (in Nicaragua and elsewhere) that the producers’ main interest is that their plants get sufficient water. Farmers are generally much more focused on achieving good yields than on using water efficiently, even where water is scarce. There are many constraints limiting crop productivity, which are often more difficult to overcome than applying “sufficient” water; irrigation is in the farmers’ hands and is an easy measure to “secure” good crop performance. Therefore, farmers want to be sure that their plants at least receive sufficient water. They will thus irrigate until they feel that this is achieved because this is a factor they can control better than other sub-optimal factors affecting productivity. Hence, farmers in our trial did not fully adhere to the recommendations of the irrigation scheduling tools and thus did not save as much water as would have been possible. This mindset of applying as much water as possible is particularly prevalent where water is free and only pumping costs have to be considered. Since water is perceived to be a common good, farmers are tempted to use more rather than less water for their crops, before the neighbors use it all up.
Nevertheless, we are convinced that through an appropriate introduction of innovations (such as irrigation scheduling according to soil moisture measurements) and adequate follow-up it would be possible that technologies such as drip irrigation and improved irrigation scheduling could indeed contribute to more efficient and productive water use. Although the farmers admitted that they did not fully adhere to the irrigation scheduling recommendations, water use was nevertheless reduced when farmers were using the tools. Reductions were considerable (>200 mm, namely 977 and 993 compared to 1222 mm irrigation under farmers’ practice, corresponding to a reduction of 19% and 20% over the entire growing cycle) although the high variability among farmers masked them to some extent in the statistical analysis.
However, the crop was still massively over-irrigated in all treatments: even during the trial period (P1) farmers irrigated 88%, 46% and 38% more than suggested by the Water Chart in the control (farmers’ practice), tensiometer and Water Chart treatments, respectively (corresponding to 119%, 71% and 62% more than the irrigation requirement calculated by CropWat). Over the entire growing period, farmers irrigated 139%, 91% and 94% more than required (as calculated through CropWat). This is probably mainly due to the aforementioned attitude of farmers to prioritize crop productivity over water savings and thus rather to over-water their crops.
4.4. Yields and Water Productivity
Although beetroot yields were high, the excessive water use (over-irrigation) was reflected in low water productivity. Water productivity of the beetroots produced in our trial was at 2.83 to 3.36 kg/m3, approximately one third of that reported by Tshwene and Oladele [23] for smallholder homestead food gardening in the North West province of South Africa (irrigation with watering cans/buckets or canal). Pienaar [31] initially also found low water productivity values of around 4 kg/m3 in the Limpopo Province of South Africa; with improved management (fertilization, mulching), however, water productivity of tomatoes was substantially increased in these small-scale farmers’ fields.
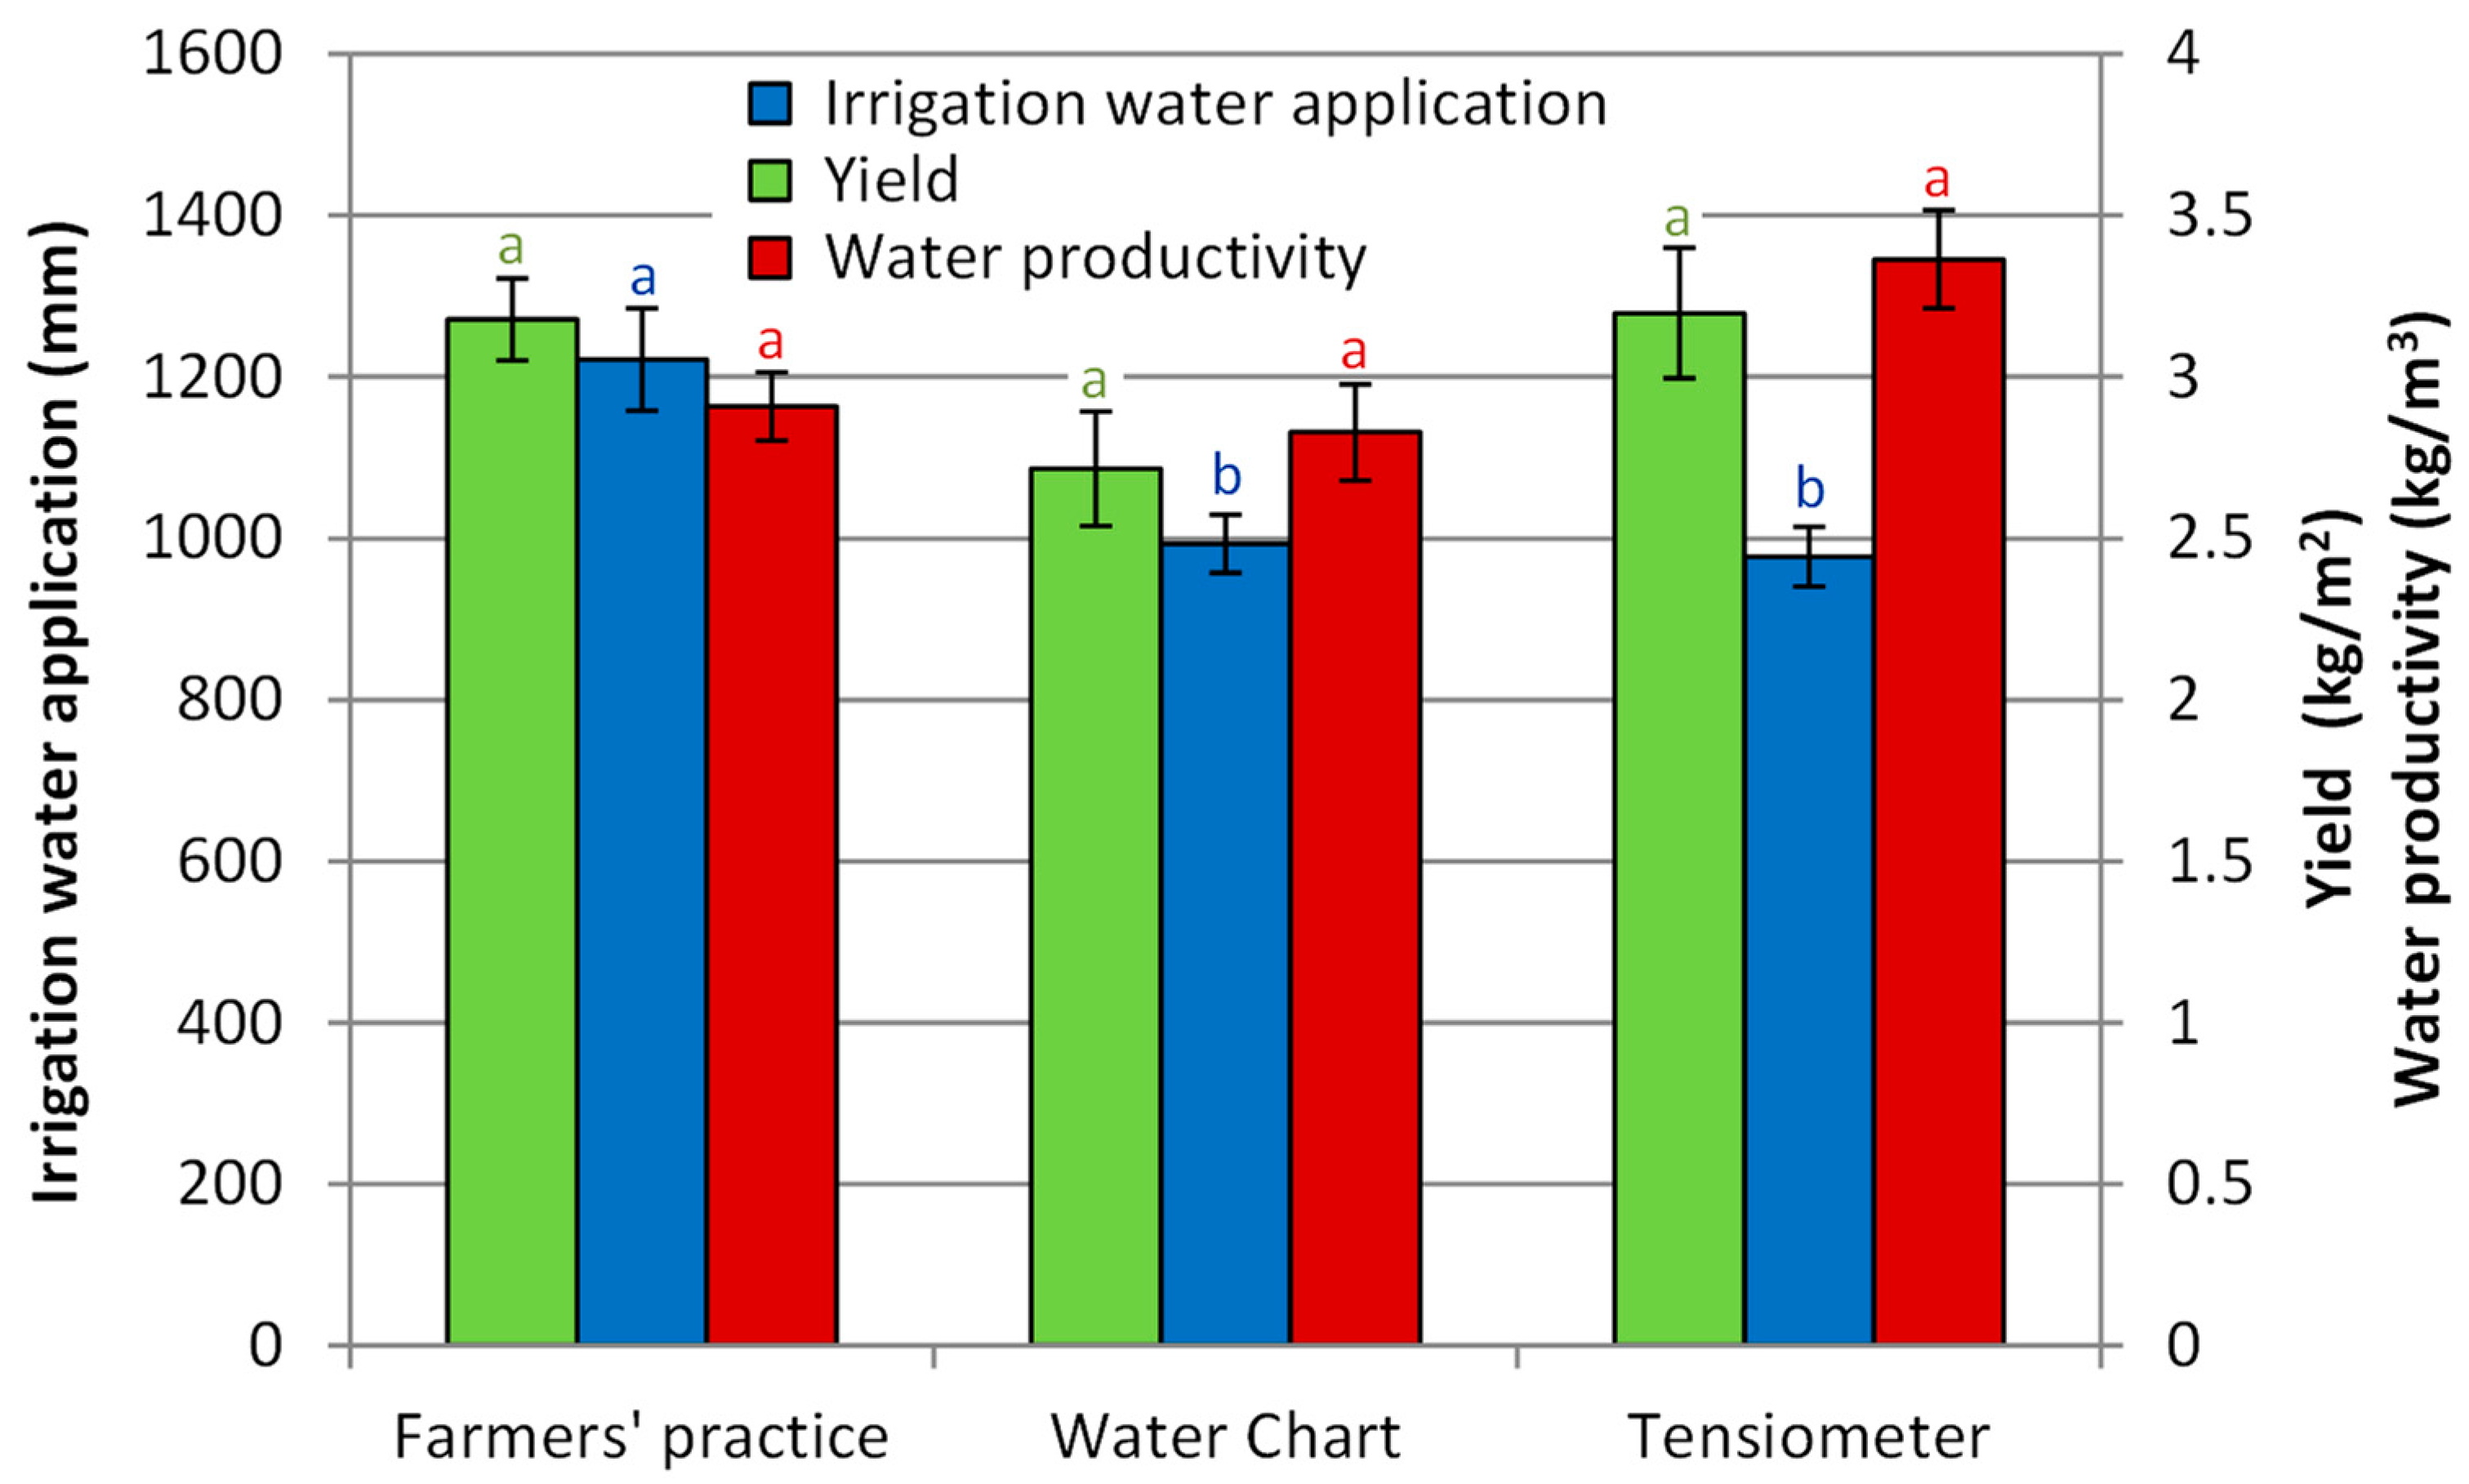
Although water use was significantly reduced when irrigation scheduling was facilitated by the Water Chart and tensiometers, water productivity was not significantly improved. Water productivity in the tensiometer treatment was slightly higher than in the other treatments, but the difference was not significant, possibly due to the small sample size and large variation. Figure 13 shows average crop yield, water application and water productivity in the three treatments. Comparing the Water Chart and tensiometer treatments demonstrates the important effect yield has on water productivity when water use is similar. By increasing yields, water productivity can be substantially enhanced, which has also been shown by Pienaar [31].
4.5. Assessment of the Trial
The results of the trial in Sébaco were clear despite the small number of farmers involved, the high variability among farmers regarding water use and yields, and certain issues that could be improved in further trials. It is actually possible that we did not detect all differences, due to our small sample size. A major deficit of the trial is that the treatment period, i.e., the duration during which the farmers were irrigating according to the recommendations through the irrigation scheduling tools, was rather short (on average 52 of a total of 85 days growing period); this was due to the need for adjusting the Water Chart (from time-based recommendations to the use of the water application measuring gauge) at the beginning of the trial. Thus, an average of 43% of all irrigation water had been applied before irrigation scheduling according to the tools was started. Since water use in the treatments with the Water Chart and the tensiometers was substantially lower than in the control treatment (i.e., farmers’ practice), it is likely that water savings would have been considerably bigger if treatments would have been imposed at an earlier stage. The implementation of all treatments on each farm might have led to a mutual interference of treatments, particularly a reduction of irrigation water applications in the control treatment (farmers’ practice). However, a corresponding analysis did not reveal any systematic reduction of irrigation water applications in the control treatments due to the recommendations of lower irrigation doses in the treatments applying the scheduling tools. Other issues to consider are: The objective of the trial was not completely clear to all farmers and this may have affected the farmers’ motivation to implement the trial accurately. Low prices for the produced beetroot may have further demotivated farmers. Since not all farmers were equally experienced in beetroot production and the use of the (iDEal) drip-irrigation systems, it is not obvious how farmers should have been irrigating “according to their experience” if they had never used an iDEal drip system before. The fact that not all farmers have started the trial at the same time because they had to reseed the crop has certainly increased the variability among famers and may thus be a reason for statistically less significant differences among treatments during the treatment period P1. Due to the small sample of farmers in the study, any attempts to derive general statements based on our results have to be put into perspective.
5. Conclusions
Tools to facilitate irrigation scheduling can considerably reduce over-irrigation and are in demand by farmers. In order that such tools are (correctly) used they must be simple enough for farmers to understand and should not increase labor requirements. However, developing tools that small-scale farmers can apply on their own remains a challenge, particularly with regard to recommendations on how much to irrigate. Tools to facilitate irrigation scheduling should not only be usable in drip irrigation but also be suited for other, more widely used irrigation methods.
Although considerable amounts of water can be saved by using irrigation scheduling tools, positive effects on water productivity are not guaranteed. There are many factors that influence crop yields and thus water productivity. The farmers’ main objective is to achieve good yields, and challenges limiting crop productivity are often more difficult to overcome than applying irrigation. Thus, farmers want to make sure that their plants at least receive sufficient water and thus are prone to over-irrigating their crops.
To avoid or overcome this attitude (which may be based on misconceptions or differing perspectives and systems of values) it is crucial that innovations and technologies such as drip irrigation or improved irrigation scheduling are appropriately introduced, e.g., by taking sufficient time to co-produce a common understanding about the technologies and their possible usefulness. Innovations and tools (as for irrigation scheduling) may actually be developed together with the target users (i.e., the farmers in our case); this creates ownership and improves understanding of the innovations. Furthermore, adequate follow-up support has to be provided so that farmers have access to help and advice in case they run into problems and have questions. In most cases it is not sufficient if this support only covers the technology concerned, but it is necessary to include also other factors that may be bottlenecks to sustainably improving productivity.
Author Contributions
Conceptualization: C.S., S.S.; Data curation: S.S.; Formal analysis: S.S., C.S.; Funding acquisition: C.S.; Investigation: S.S., C.S.; Methodology: C.S., S.S.; Project administration: C.S.; Resources: S.S., C.S.; Software; Supervision: C.S.; Validation: C.S., S.S.; Visualization: C.S., S.S.; Writing—original draft: S.S., C.S.; Writing—review and editing: C.S., S.S.
Funding
This research conducted in the framework of the “Water Tools” project was funded by the Swiss Agency for Development and Cooperation through the iDE-implemented project “Scaling up productive water, phase 2”.
Acknowledgments
We would like to thank the AGROFOR association for supporting the project with field technicians; all involved farmers for their interest and participation in the trial, and for providing their time and land; Ali Romero Gurdian for doing most of the field work and helping to organize the trial; and Nadja Schäfli, iDEal Tecnologias, and her team for providing support. Furthermore, we would like to thank Alois Müller (Secom) for letting us use his low-cost tensiometers. iDE Denver helped us with the Water Chart and COSUDE Nicaragua with the import of equipment. And thanks a lot to Lindsey Norgrove for reviewing the manuscript. Thank you all!
Conflicts of Interest
The authors declare no conflicts of interest.
Appendix A
Figure A1.
English translation of the Water Chart used during trial with beetroot in Sébaco: the chart indicates for the three main crop stages how many deciliters (dl) per emitter the farmer should irrigate in each month (calculated according to average climatic data for the region). For sunny, hot periods it was suggested to increase irrigation water amounts by 1 dL per emitter (i.e., approximately 1.67 mm; bottom of the chart). The first page gives irrigation recommendations for daily irrigation, a second page (not shown) indicates the application depth for irrigation every second and third day.

References
- Facon, T.; Mukherji, A. Small-scale irrigation: Is this the future? Paper presented at the Water Crisis and Choices. In Proceedings of the ADB and Partners Conference, ADB HQ, Manila, Philippines, 11–15 October 2010; Available online: http://publications.iwmi.org/pdf/H043372.pdf (accessed on 31 July 2019).
- Jägermeyr, J.; Gerten, D.; Schaphoff, S.; Heinke, J.; Lucht, W.; Rockström, J. Integrated crop water management might sustainably halve the global food gap. Environ. Res. Lett. 2016, 11, 25002. [Google Scholar] [CrossRef]
- Merrey, D.J.; Langan, S. Review Paper on ‘Garden Kits’ in Africa: Lessons Learned and the Potential of ImprovedWater Management; IWMI Working Paper No. 162; International Water Management Institute (IWMI): Colombo, Sri Lanka, 2014. [Google Scholar] [CrossRef] [Green Version]
- Studer, C.; Spöhel, S. Narrative Report on Activities and Findings of the Water Tools Project, BFH-HAFL and iDE. March 2017; Unpublished project report.
- Shatanawi, M.; Ferrous, A.; Mazahrh, N.; Duqqah, M. Irrigation system performance in Jordan. In Options Méditerranéennes: Serie B. Etudes et Recherches, n. 52; CIHEAM-IAMB: Bari, Italy, 2005; pp. 123–132. [Google Scholar]
- Benouniche, M.; Kuper, M.; Hammani, A.; Boesveld, H. Making the user visible: Analysing irrigation practices and farmers’ logic to explain actual drip irrigation performance. Irrig. Sci. 2014, 32, 405–420. [Google Scholar] [CrossRef]
- Van der Kooij, S.; Kuper, M.; Zwarteveen, M.; De Fraiture, C. A user-centred approach to irrigation performance: Drip irrigation in the Khrichfa area, Morocco. Water Int. 2017, 42, 794–809. [Google Scholar] [CrossRef]
- Venot, J.-P.; Kuper, M.; Zwarteveen, M.Z. (Eds.) Drip Irrigation for Agriculture: Untold Stories of Efficiency, Innovation and Development; Routledge: Abingdon, UK; New York, NY, USA, 2017; ISBN 978-0-367-24502-3. [Google Scholar]
- Yigezu, Y.A.; Ahmed, M.A.; Shideed, K.; Aw-Hassan, A.; El-Shater, T.; Al-Atwan, S. Implications of a shift in irrigation technology on resource use efficiency: A Syrian case. Agric. Syst. 2013, 118, 14–22. [Google Scholar] [CrossRef]
- Delgado Quezada, V.; Flores Meza, Y. Hydrogeological update and availability of the Sébaco valley aquifer in Nicaragua. Aqua-LAC 2018, 1, 61–74. [Google Scholar]
- Allen, R.G.; Pereira, L.S.; Raes, D.; Smith, M. Crop Evapotranspiration: Guidelines for Computing Crop Water Requirements; FAO Irrigation and Drainage Paper 56; FAO: Rome, Italy, 1998. [Google Scholar]
- Boesveld, H.; Zisengwe, L.S.; Yakami, S. Drip Planner Chart: A simple irrigation scheduling tool for smallholder drip farmers. Irrig. Drain. Syst. 2011, 25, 323–333. [Google Scholar] [CrossRef]
- Rowell, B.; Soe, M.L. Water Wheel—Water Requirement Calculators for Drip Irrigation—Concept, Design, and Construction; iDE: Yangon, Myanmar, 2009. [Google Scholar]
- Rowell, B.; Soe, M.L. Simplified Water Requirement Calculators for Fruits and Vegetables. HortTechnology 2016, 26, 530–541. [Google Scholar] [CrossRef] [Green Version]
- Mupfiga, E.T. The Farmer and the Drip Planner Chart. A User Based Evaluation of the Applicability of a Smallholder Drip Irrigation Scheduling Tool; Wageningen University: Wageningen, The Netherlands, 2011; 66p. [Google Scholar]
- Yakami, S. Evaluation of the Applicability of Drip Planner Chart for Irrigation Scheduling for the Small Micro-Drip Farmers: Assisting and Advising the Extension Work in Lalitpur District of Nepal. Master’s Thesis, Wageningen University, Wageningen, The Netherlands, 2009. [Google Scholar]
- FAO (Food and Agriculture Organization). CLIMWAT 2.0 for CROPWAT. Available online: http://www.fao.org/land-water/databases-and-software/climwat-for-cropwat/en/ (accessed on 31 July 2019).
- Growcom. Irrigating Beetroot in South Queensland. Growcom Water for Profit Resources Fact Sheet. Available online: https://www.growcom.com.au/_uploads/LWR/CB1_Beetroots.pdf (accessed on 31 July 2019).
- Christen, E.; Ayars, J.; Hornbuckle, J.; Hickey, M. Technology and Practice for Irrigation in Vegetables; NSW Department of Primary Industries: Orange, NSW, Australia, 2006; 59p.
- FAO (Food and Agriculture Organization of the United Nations). CropWat—Crop Water and Irrigation Requirements Program. Available online: http://www.fao.org/land-water/databases-and-software/cropwat (accessed on 31 July 2019).
- R (R Development Core Team). R: A Language and Environment for Statistical Computing; R Foundation for Statistical Computing: Vienna, Austria, 2017. [Google Scholar]
- KZN (KwaZulu-Natal Department of Agriculture and Rural Development). Agricultural Guidelines—Vegetable Production in Kwazulu-Natal: Beetroot. Available online: https://www.kzndard.gov.za/images/Documents/Horticulture/Veg_prod/beetroot.pdf (accessed on 31 July 2019).
- Tshwene, C.; Oladele, I. Water Use Productivity and Food Security Among Smallholder Homestead Food Gardening and Irrigation Crop Farmers in North West Province, South Africa. J. Agric. Environ. Int. Dev. 2016, 110, 73–86. [Google Scholar]
- Aitbaev, T.; Buribaeva, L.; Aitbaeva, A. Drop irrigation of potatoes and vegetable cultures in the Southeast of Kazakhstan. World Appl. Sci. J. 2013, 24, 914–919. [Google Scholar] [CrossRef]
- Kutschera, L.; Lichtenegger, E.; Sobotik, M. Wurzelatlas der Kulturpflanzen Gemäßigter Gebiete Mit Arten des Feldgemüsebaues; DLG-Verlags-GmbH: Frankfurt, Germany, 2009; ISBN 3769007085, 9783769007084. [Google Scholar]
- Kumar, D.; Shivay, Y.S. Definitional Glossary of Agricultural Terms; IK International Pvt Ltd.: Delhi, India, 2008; Volume 1, p. 314. [Google Scholar]
- Smajstrla, A.G.; Harrison, D.S.; Duran, F.X. Tensiometers for Soil Moisture Measurement and Irrigation Scheduling; Agricultural and Biological Engineering Department, Florida Cooperative Extension Service, Institute of Food and Agricultural Sciences, University of Florida: Gainesville, FL, USA, 1998; CIR487. [Google Scholar]
- Maughan, T.; Allen, L.N.; Drost, D. Soil Moisture Measurement and Sensors for Irrigation Management; Extension, Utah State University: Logan, UT, USA, 2015. [Google Scholar]
- Goodwin, I. How to Use Tensiometers. Department of Environment and Primary Industries, Melbourne, Victoria, 2000, Future Farming Systems Research, Agnote AG0298, Updated December 2009. Available online: http://agriculture.vic.gov.au/agriculture/horticulture/vegetables/vegetable-growing-and-management/how-to-use-tensiometers (accessed on 27 April 2018).
- Christinck, A.; Kaufmann, B. Facilitating change—Methodologies for collaborative learning with stakeholders. In Transdisciplinary Research and Sustainability: Collaboration, Innovation and Transformation; Padmanabhan, M., Ed.; Routledge Studies in Environment, Culture, and Society; Routledge: Abingdon, UK; New York, NY, USA, 2018; pp. 171–190. [Google Scholar] [CrossRef]
- Pienaar, C.J. Increased Water Productivity in Irrigated Tomato Production in the Smallholder Farming Community of Giyani. Master’s Thesis, Faculty of Soil Science, Stellenbosch University, Stellenbosch, South Africa, 2014. [Google Scholar]
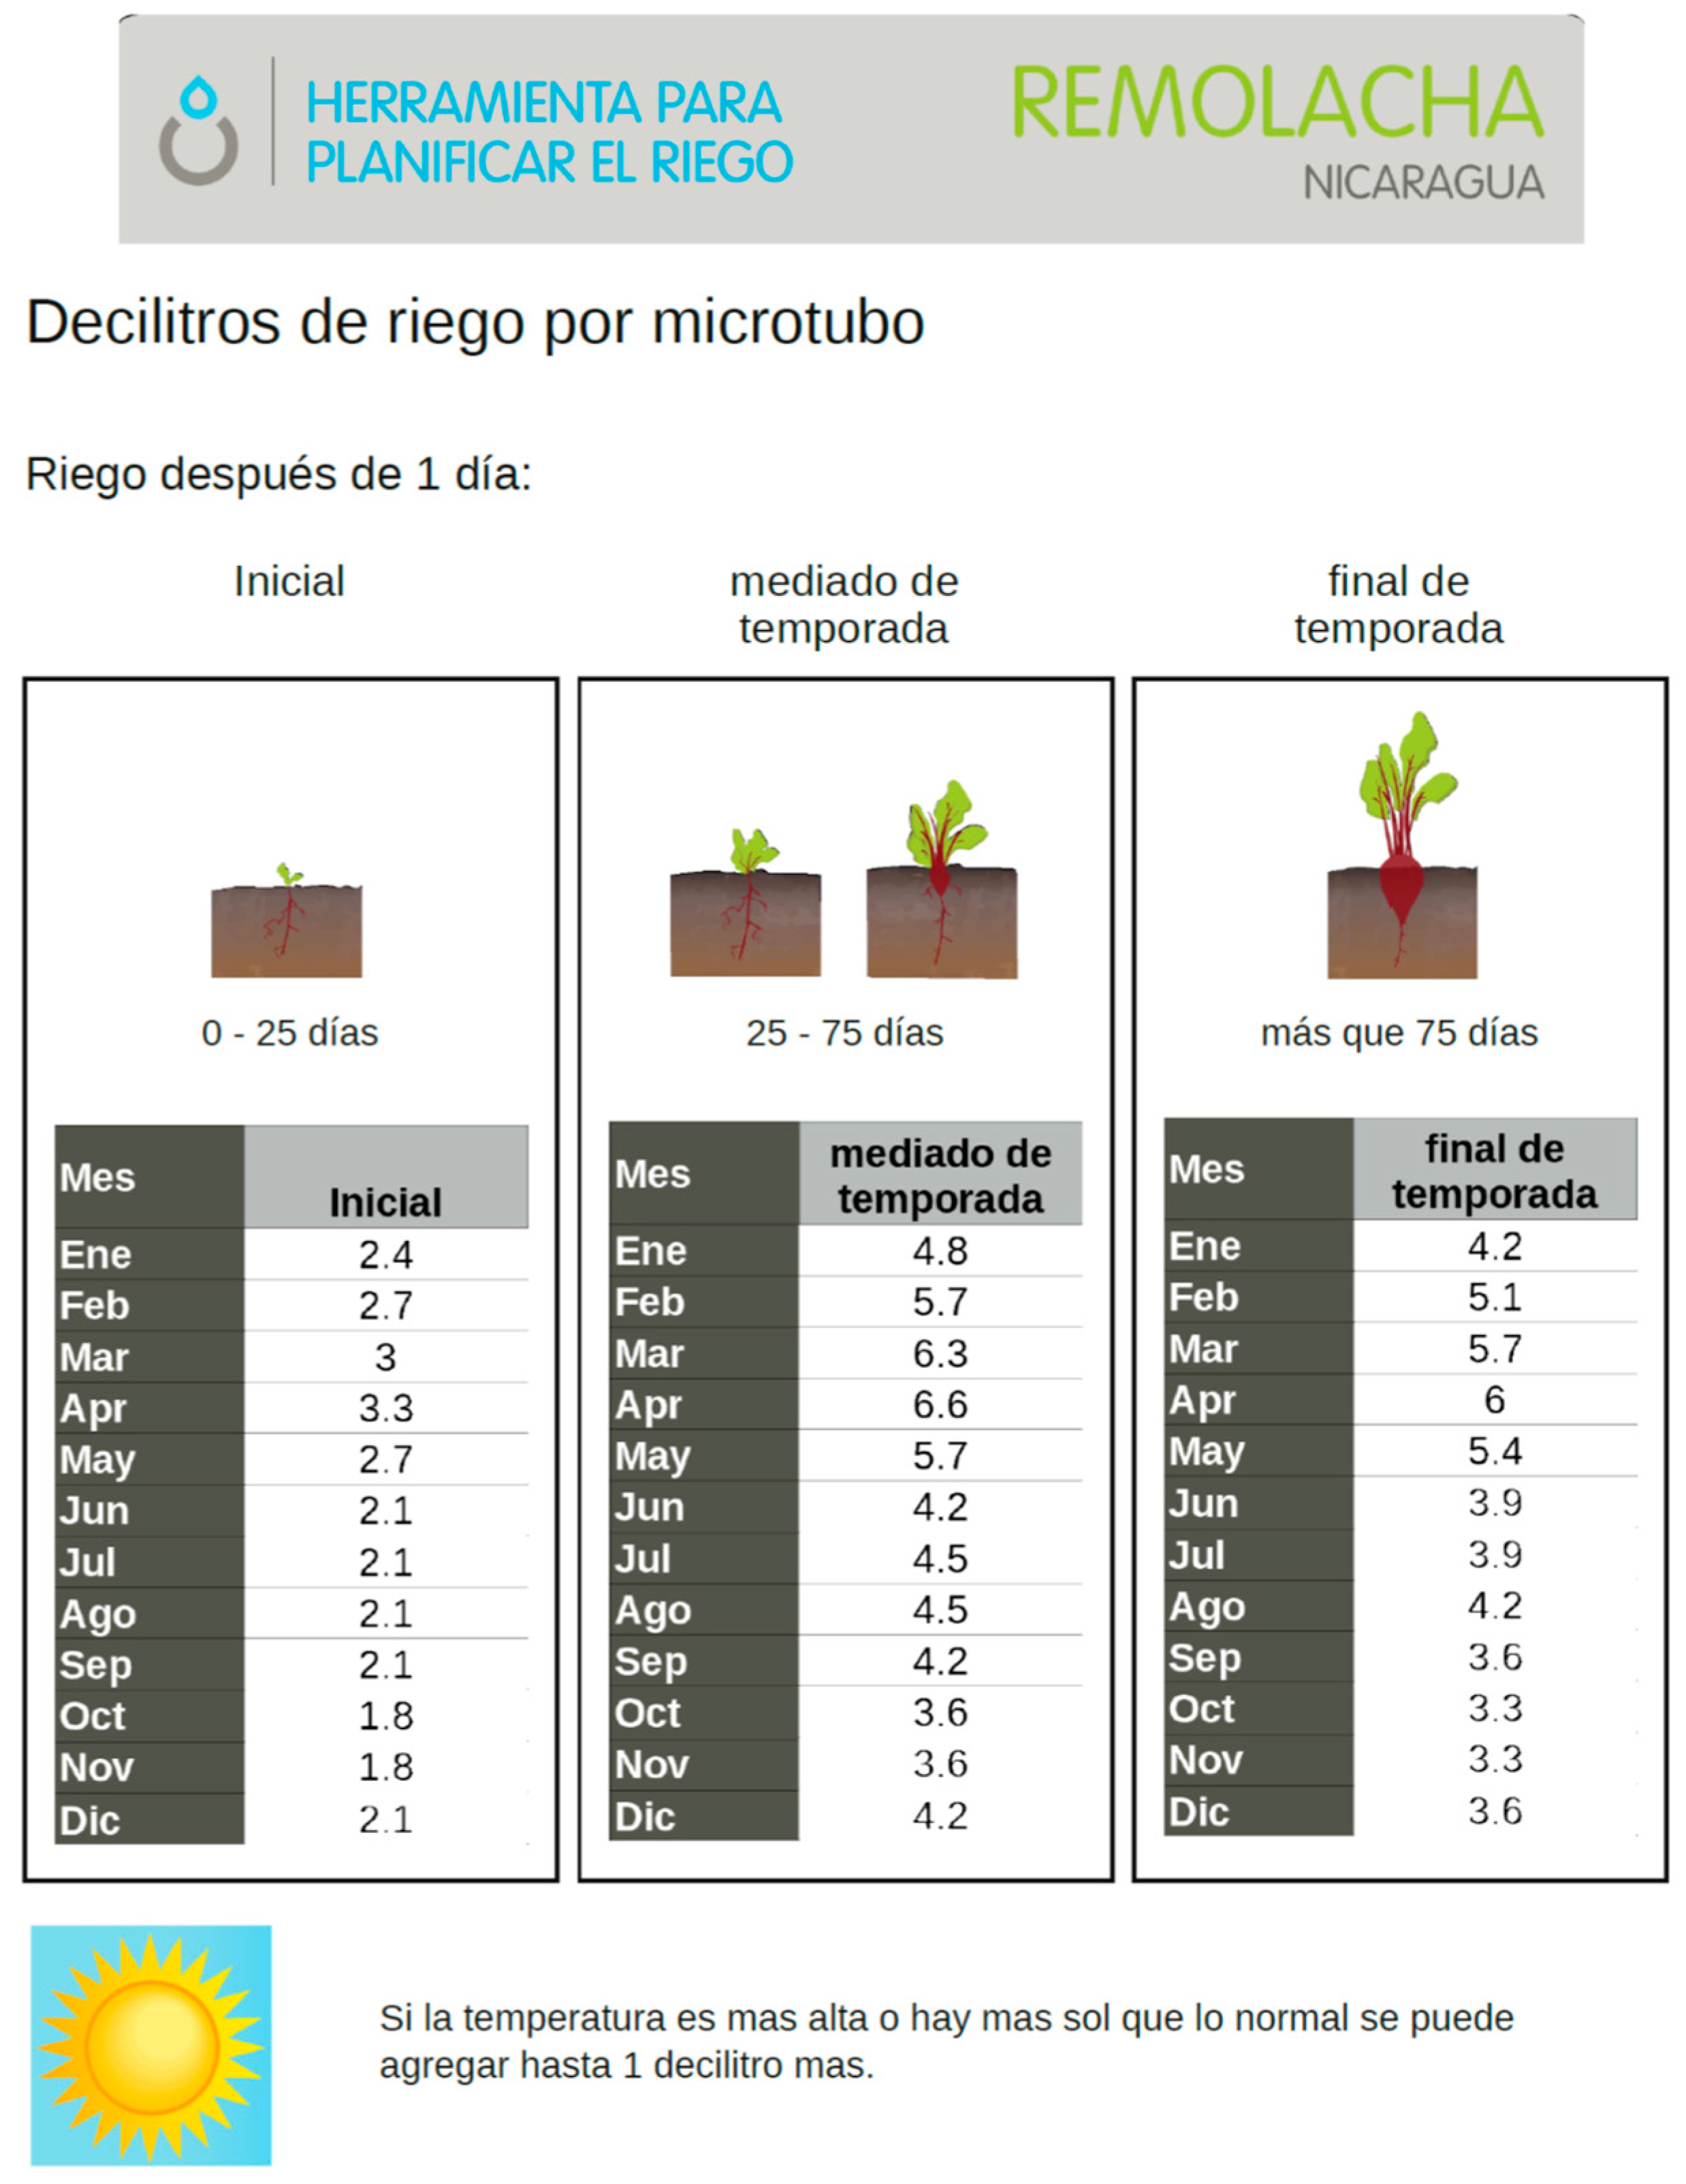
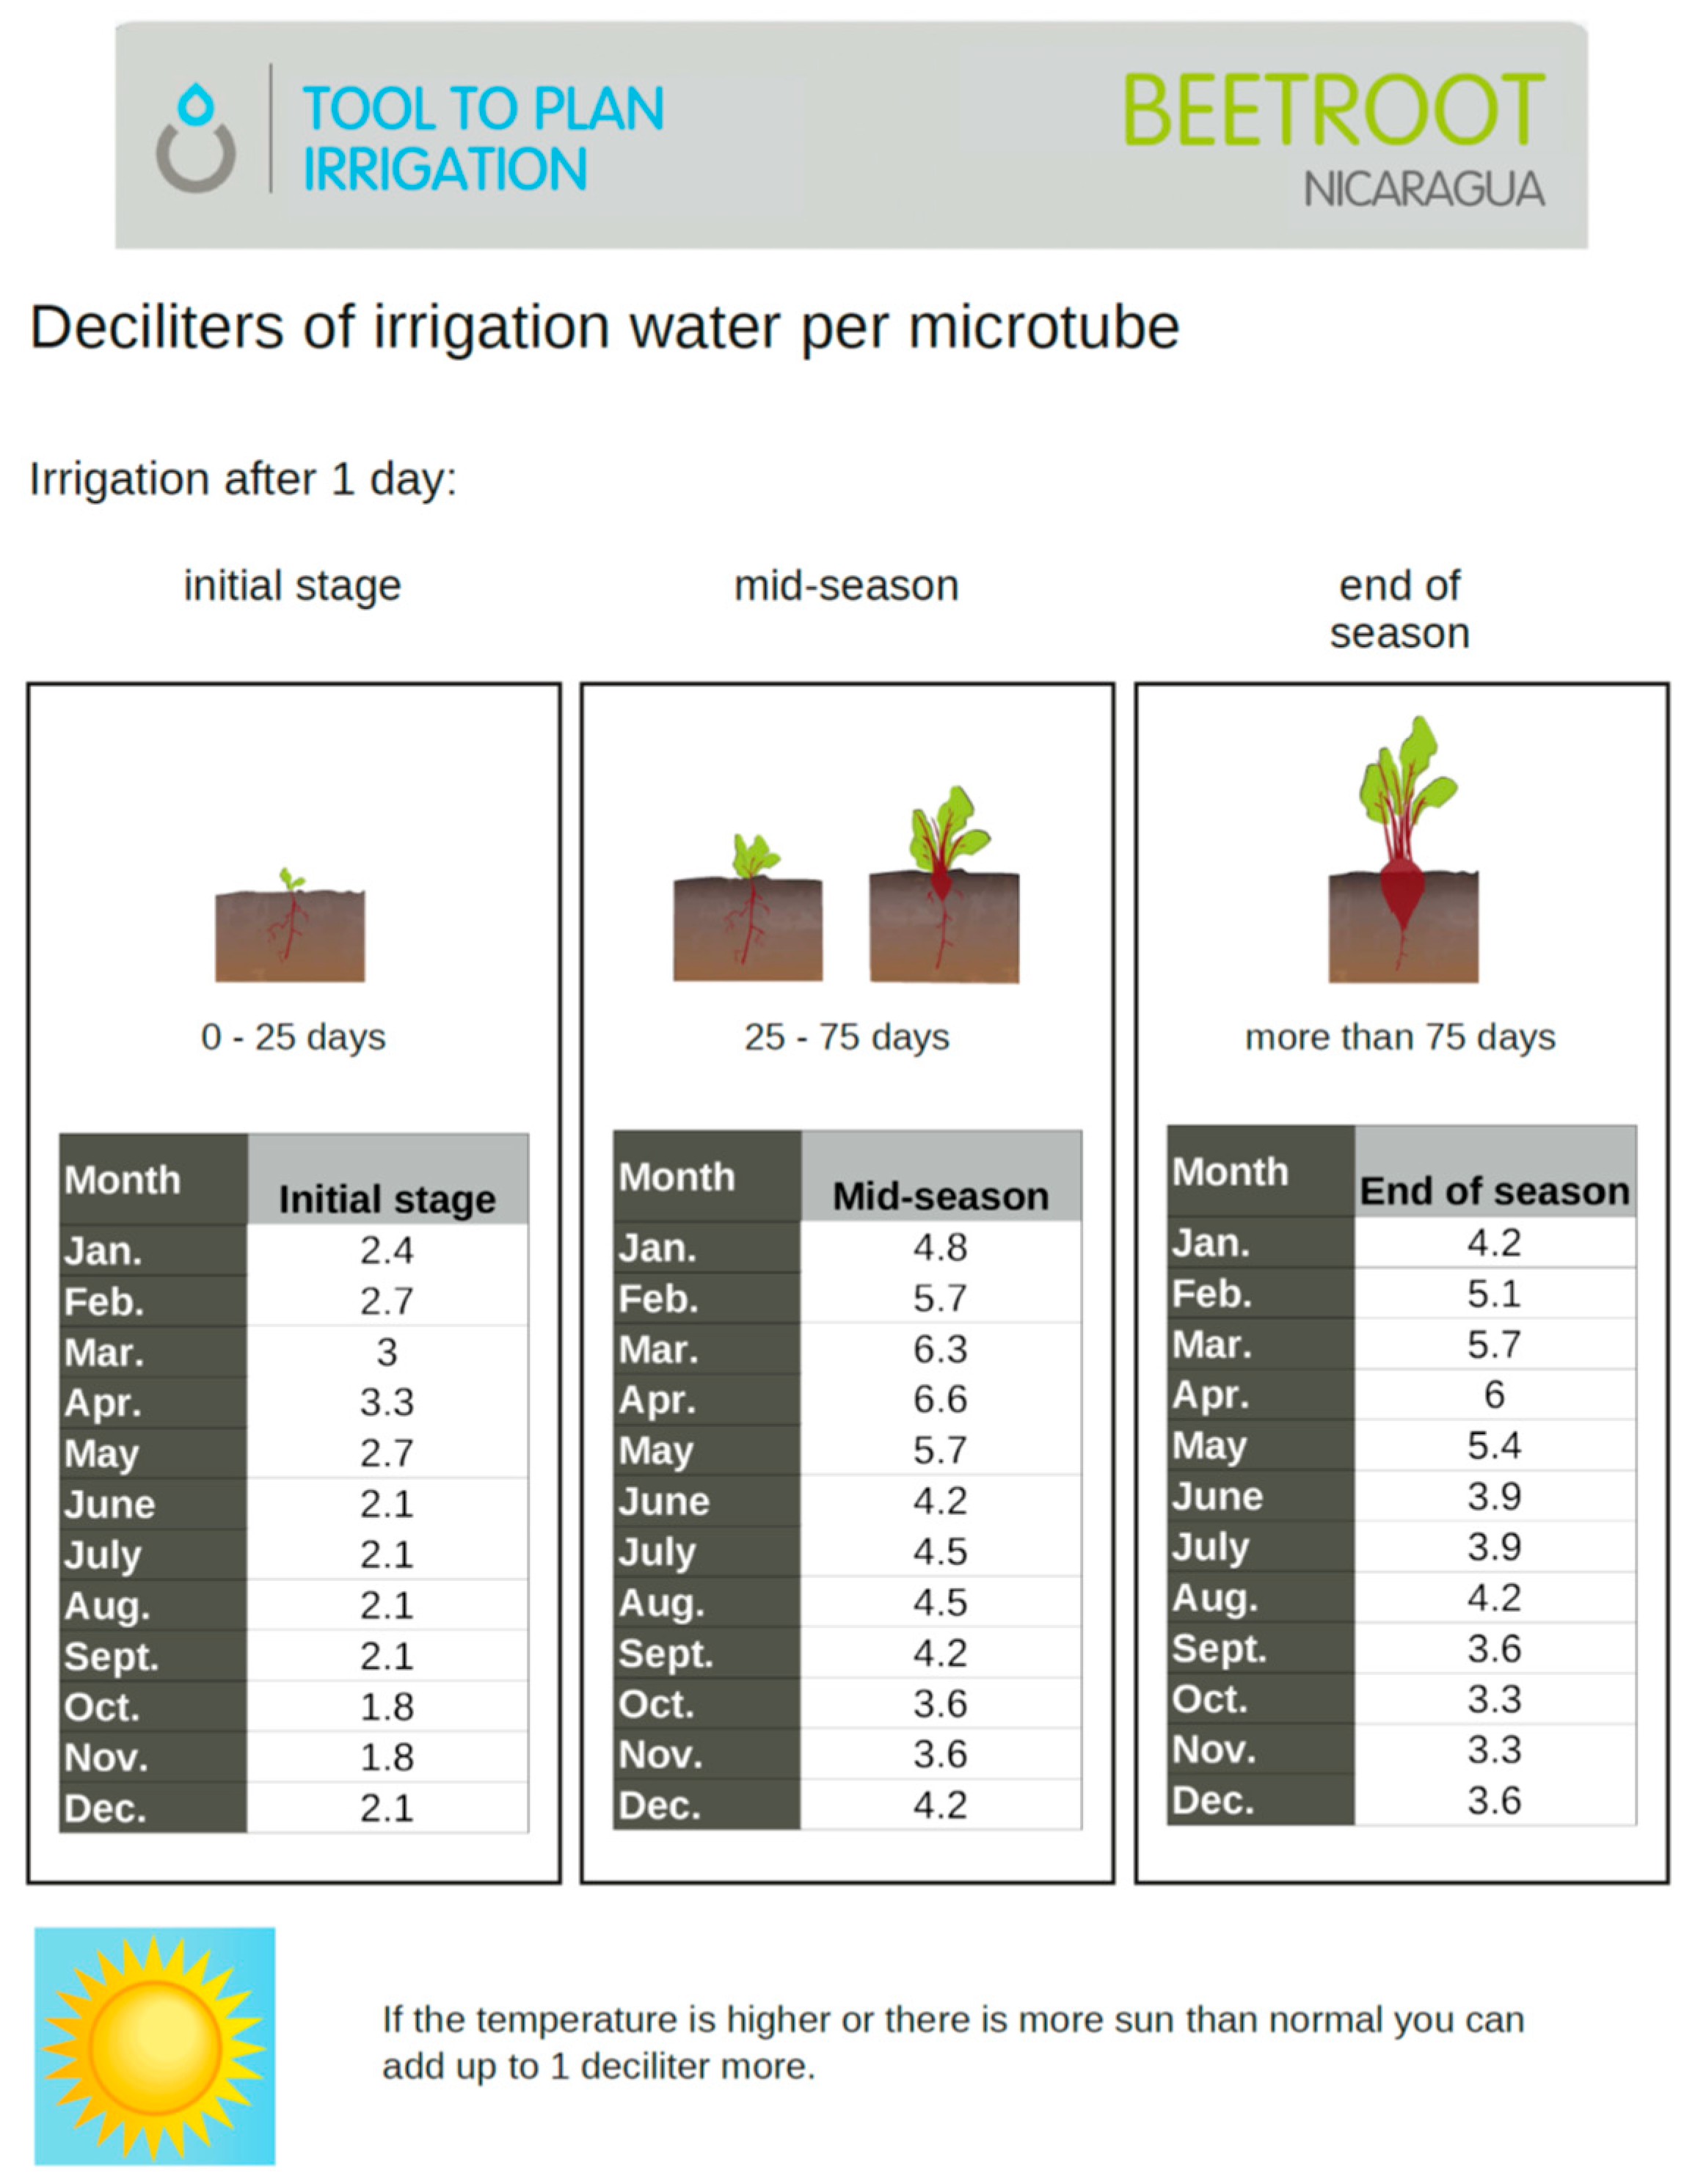
Figure 1.
Water Chart used during trial with beetroot in Sébaco: The chart indicates for the three main crop stages with how many deciliters (dL) per emitter the farmer should irrigate in each month (calculated according to average climatic data for the region). For sunny, hot periods it was suggested to increase irrigation water amounts by 1 dL per emitter (i.e., approximately 1.67 mm; bottom of the chart). The first page gives irrigation recommendations for daily irrigation, a second page (not shown) indicates the application depth for irrigation every second and third day. [An English translation of the chart is given in Appendix A.]

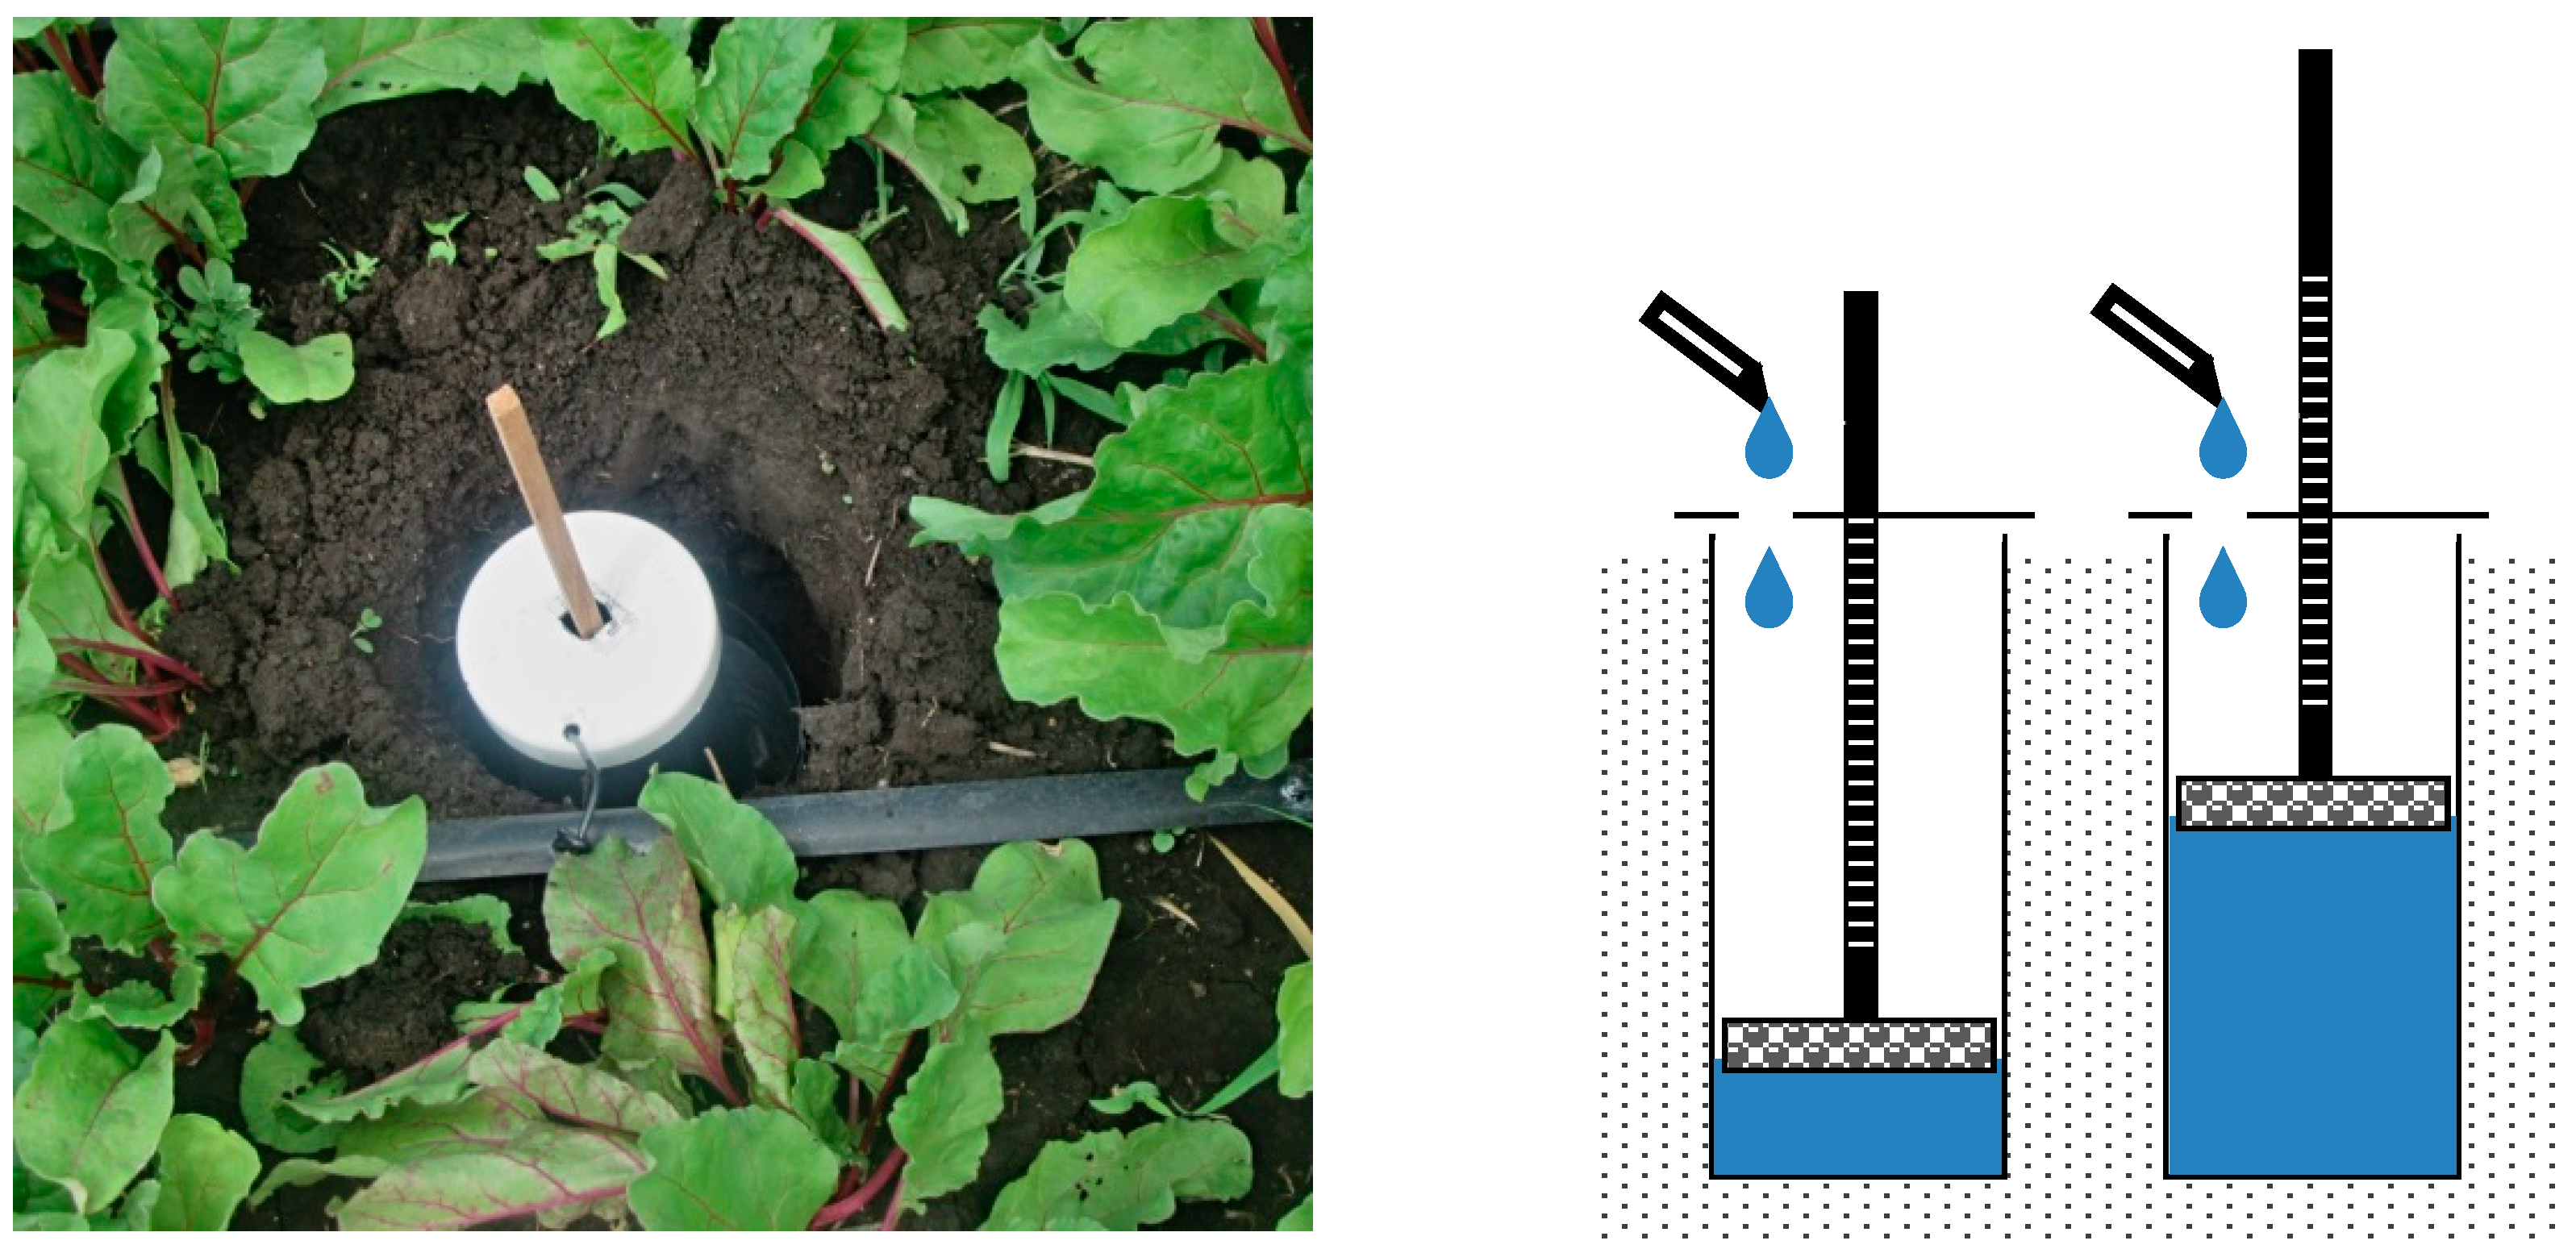
Figure 2.
Water application depth gauge used to measure irrigation water output of an emitter of a drip-irrigation system, to be used together with the Water Chart. Water from a micro-tube emitter is captured in a cylinder. The wooden stick is graduated and mounted on a floater.
Figure 2.
Water application depth gauge used to measure irrigation water output of an emitter of a drip-irrigation system, to be used together with the Water Chart. Water from a micro-tube emitter is captured in a cylinder. The wooden stick is graduated and mounted on a floater.

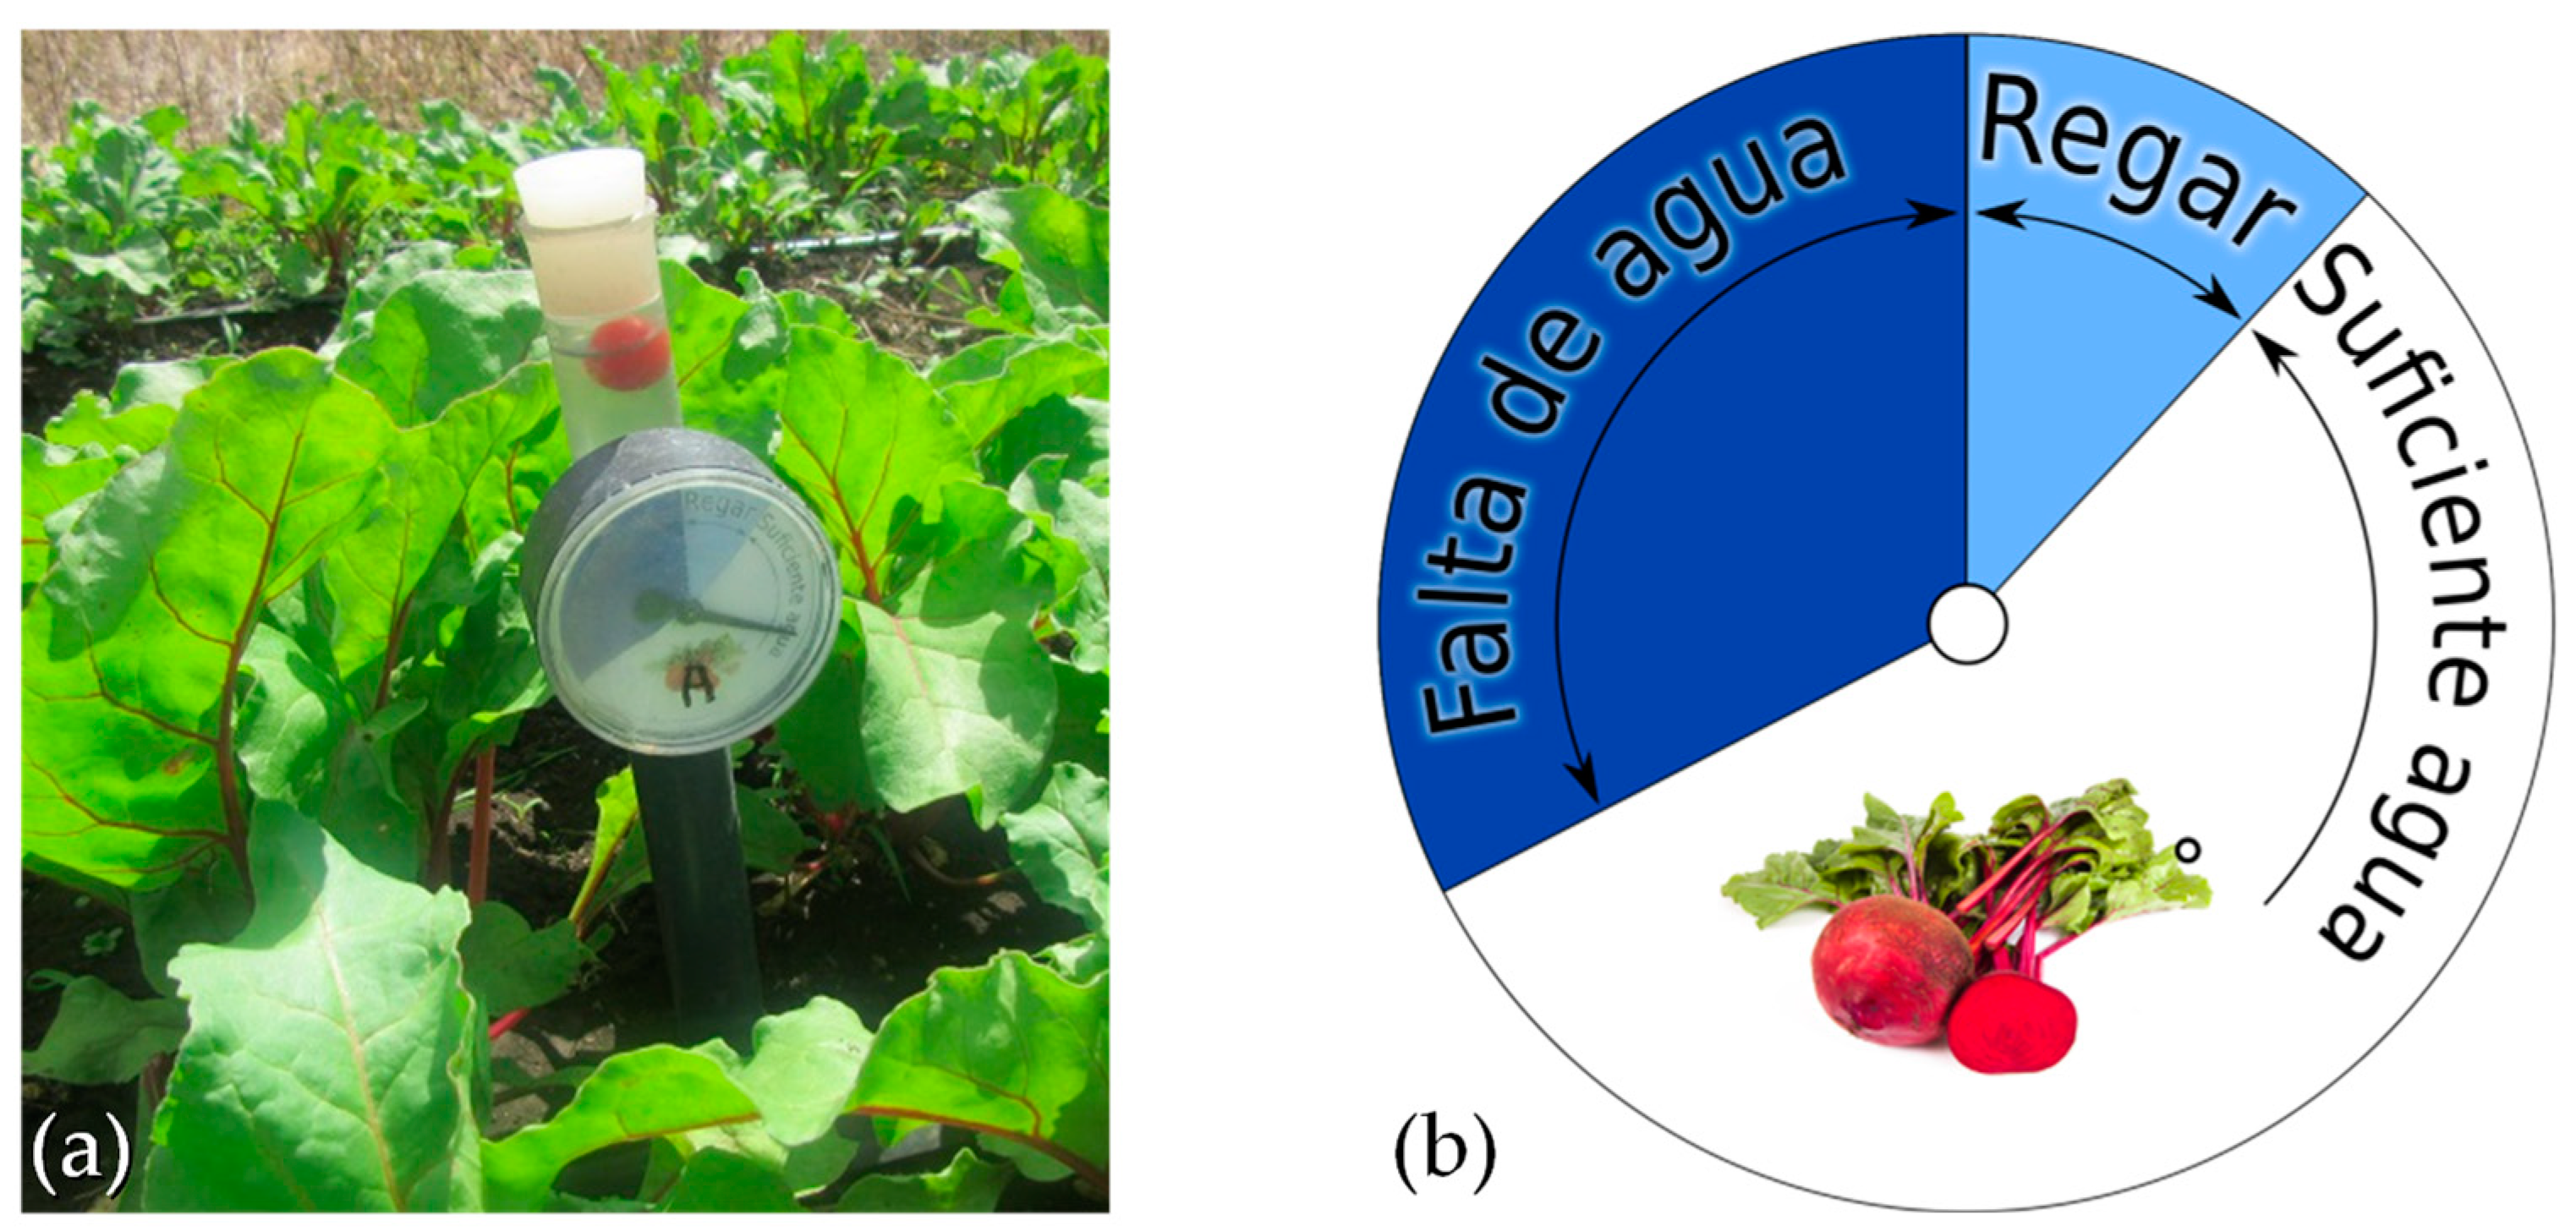
Figure 3.
(a) Custom-made tensiometer used for the Water Chart trial with beetroot in Sébaco. (b) Manometer display used for the trial; the levels indicate “enough water” (<350 mbar; “Sufficiente agua”), “irrigate” (350–500 mbar; “Regar”), and “water lacking” (>500 mbar; “Falta de agua”).
Figure 3.
(a) Custom-made tensiometer used for the Water Chart trial with beetroot in Sébaco. (b) Manometer display used for the trial; the levels indicate “enough water” (<350 mbar; “Sufficiente agua”), “irrigate” (350–500 mbar; “Regar”), and “water lacking” (>500 mbar; “Falta de agua”).

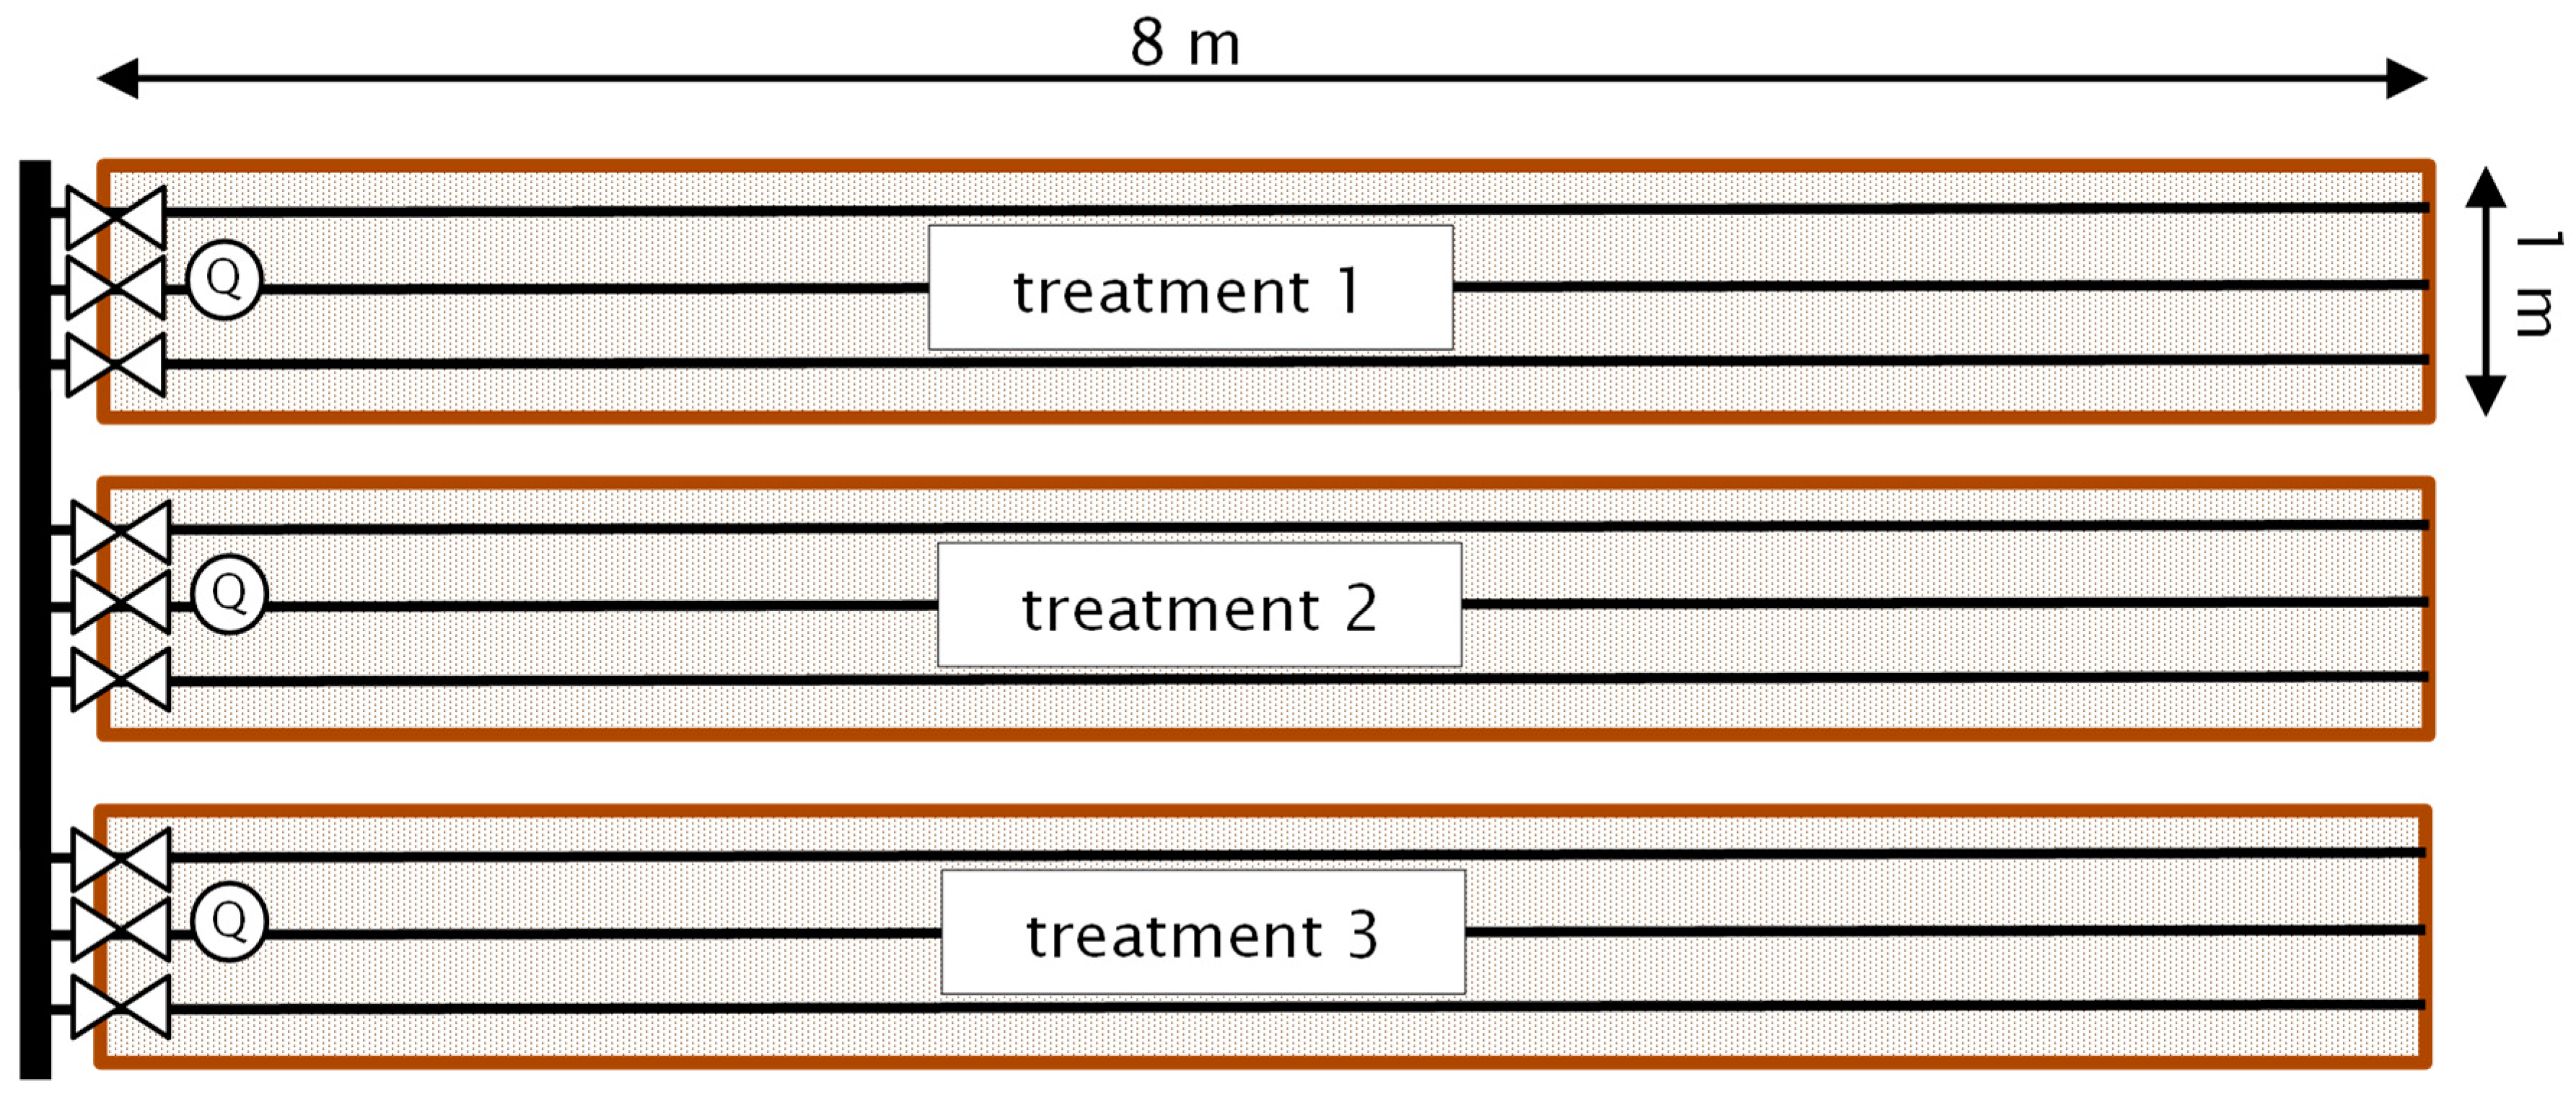
Figure 4.
Sketch of a trial repetition at one farmer: Each of the three banks of 8 × 1 m was irrigated by three laterals. Each lateral could be managed individually by a valve. On the middle lateral of each bank, irrigation water use was measured using a water meter (Q).
Figure 4.
Sketch of a trial repetition at one farmer: Each of the three banks of 8 × 1 m was irrigated by three laterals. Each lateral could be managed individually by a valve. On the middle lateral of each bank, irrigation water use was measured using a water meter (Q).

Figure 5.
Overview of important dates of the Water Chart trial in Sébaco: farmers seeded on different dates but all started treating (applying different irrigation scheduling regimes according to tensiometer readings and the Water Chart) on the same date. P0 is the period when all treatments were managed equally and P1 is the period when farmers applied different irrigation scheduling regimes. Some farmers harvested the biggest beetroots early to give the remaining plants more space (“thinning”). Farmers 2 and 7 had 100% crop loss due to chickens and poor management, respectively (n = 10).

Figure 6.
Irrigation water application (in mm) in the three treatments during trial period P0 (before launching different irrigation regimes), P1 (irrigation regime according to the tools), and over the entire growing cycle. Error bars denote standard errors of the means (n = 10). Means with the same letter in the same color show no significant differences between treatments according to Fisher’s least significant difference (LSD) test (p < 0.05).

Figure 7.
Irrigation water application in the three treatments on the different farms during the period in which irrigation scheduling tools were used (P1). The applications per treatment are similar on individual farms, but varied considerably among farms. Farmer 12 ran out of water during the trial (n = 10).

Figure 8.
Application of irrigation water in the Water Chart, tensiometer and farmers’ practice treatments during trial period P1 (irrigation regime according to the tools) as compared to the recommendation by the Water Chart and calculations of irrigation requirement by CropWat (assuming 70% irrigation efficiency). Error bars indicate standard errors of the means (n = 10).

Figure 9.
Application of irrigation water in the Water Chart, tensiometer and farmer practice treatments during the entire growing cycle as compared to the respective recommendation by the Water Chart and calculations of irrigation requirement by CropWat (assuming 70% irrigation efficiency). Error bars indicate standard errors of the means (n = 10).

Figure 10.
Water application (in mm per day) in the three irrigation scheduling treatments before and after farmers started to irrigate the treatments according to the recommendations by the tools (Water Chart and tensiometer). Green error bars indicate standard deviations, black ones the standard errors of the means (n = 10).

Figure 11.
Marketable yield and discarded production (kg/m2) of beetroot under different irrigation regimes according to farmers practice, Water Chart and tensiometer as reported by farmers during a trial in Sébaco, Nicaragua. Error bars denote standard errors of the means of marketable yield (n = 10).

Figure 12.
Water productivity (kg marketable yield per m3 irrigation water) of beetroots under different irrigation regimes according to farmers’ practice, Water Chart and tensiometer treatments in Sébaco, Nicaragua (n = 10).
Figure 12.
Water productivity (kg marketable yield per m3 irrigation water) of beetroots under different irrigation regimes according to farmers’ practice, Water Chart and tensiometer treatments in Sébaco, Nicaragua (n = 10).

Figure 13.
Water productivity (kg marketable yield per m3 irrigation water), irrigation water application over the entire growing period (mm), and crop yield (kg/m2) of beetroots under different irrigation regimes according to farmers’ practice, Water Chart and tensiometer treatments in Sébaco, Nicaragua. Error bars indicate standard errors of the means (n = 10). Means with the same letter in the same color show no significant differences between treatments (Fisher’s LSD test, p < 0.05).

© 2019 by the authors. Licensee MDPI, Basel, Switzerland. This article is an open access article distributed under the terms and conditions of the Creative Commons Attribution (CC BY) license (http://creativecommons.org/licenses/by/4.0/).
Share and Cite
MDPI and ACS Style
Studer, C.; Spoehel, S. Potential and Actual Water Savings through Improved Irrigation Scheduling in Small-Scale Vegetable Production. Agronomy 2019, 9, 888. https://0-doi-org.brum.beds.ac.uk/10.3390/agronomy9120888
AMA Style
Studer C, Spoehel S. Potential and Actual Water Savings through Improved Irrigation Scheduling in Small-Scale Vegetable Production. Agronomy. 2019; 9(12):888. https://0-doi-org.brum.beds.ac.uk/10.3390/agronomy9120888
Chicago/Turabian StyleStuder, Christoph, and Simon Spoehel. 2019. "Potential and Actual Water Savings through Improved Irrigation Scheduling in Small-Scale Vegetable Production" Agronomy 9, no. 12: 888. https://0-doi-org.brum.beds.ac.uk/10.3390/agronomy9120888
Note that from the first issue of 2016, this journal uses article numbers instead of page numbers. See further details here.