Article

Improving the Conservation and Use of Traditional Germplasm through Breeding for Local Adaptation: The Case of the Castellfollit del Boix Common Bean (Phaseolus vulgaris L.) Landrace

1
Mixed Research Unit for the Valorization and Breeding of Horticultural Landraces, Fundació Miquel Agustí, BarcelonaTech, Esteve Terradas, 8, 08860 Castelldefels, Spain
2
Mixed Research Unit for the Valorization and Breeding of Horticultural Landraces, Institut de Conservació i Millora de l’Agrodiversitat Valenciana, Universitat Politècnica de València, Camí de Vera 14, 46022 València, Spain
*
Author to whom correspondence should be addressed.
Submission received: 15 November 2019 / Revised: 4 December 2019 / Accepted: 12 December 2019 / Published: 14 December 2019
(This article belongs to the Section Crop Breeding and Genetics)

Abstract

:
The dramatic reduction in the diversity of crops in the last century is often attributed to the consolidation of scientific breeding, probably because the two processes have occurred at the same time. We carried out a breeding program to enhance the Castellfollit del Boix landrace of common bean (Phaseolus vulgaris L.) in a low-input environment to determine the effects of breeding on a landrace at risk of disappearing. The program increased the number of accessions conserved ex situ and obtained more efficient genotypes that are less likely to be abandoned by farmer without altering the characteristics that consumers appreciate most. As a result, the availability of the product, its promotion, and its use have increased. We propose a Conservation Potential Index to measure the impact of changes in the crop’s epiphenotype, and also apply it to a set of landraces from several crops. We argue that scientific breeding and information gathered in the context of genetic improvement programs can help to conserve biodiversity when they aim to adapt materials to different local environments, rather than having a negative impact on the biodiversity of crops. This approach contrasts with the genetic erosion that results from efforts to homogenize environments by increasing inputs, so that a few improved varieties adapted to these environments can be grown.

1. Introduction

The loss of agrobiodiversity has coincided in time with the development and widespread application of genetic improvement programs, but the causality of this relationship is being questioned [1]. This coincidence gave rise to the conservationist movement that aims to retain established combinations of alleles that had become adapted to multiple local environments over the centuries. However, it is important to recall that scientific breeding has developed side-by-side with scientific improvement of environmental conditions and land use and that the Green Revolution was the result of both to understand the entire process [2,3].
Our ability to affect ecosystems by applying huge amounts of energy, mostly from fossil fuels [4], has enabled us to cultivate large tracts of land and to supply them with water and nutrients while also combating the organisms that would decimate the crops. Human intervention converted large areas into homogeneous environments that made it easy for a few varieties that grew optimally in these environments to rapidly supplant diverse varieties that arose through symbiosis between humans and local environments [5,6]. Is it then really breeding that is responsible for the decrease in cultivated biodiversity?
Castellfollit del Boix (hereafter, simplified to Castellfollit) is a landrace of the common bean (Phaseolus vulgaris L.) that is adapted to cultivation without irrigation in the conditions of the Castellfollit del Boix municipality in central Catalonia (northeast of the Iberian Peninsula), where its cultivation is centered. Being of Mesoamerican origin [7], this bean has been grown in the locality since the eighteenth century [8]. White seeds, whose shape is between rectangular and oval, characterize Castellfollit landrace (Figure 1). The plant has an indeterminate growth pattern type III [9], but it is cultivated without supports because the plants do not grow very high without irrigation. This variety’s main appeal lies in its sensory traits (hardly perceptible seed coat, high creaminess, and delicate but intense dry bean flavor) and culinary qualities (large proportion of whole seeds after cooking).
About 10 years ago, the crop had nearly disappeared due to irregular production (despite the existence of a consolidated market). Accordingly, farmers and local authorities fostered the development of a breeding program to boost cultivation by making evolve the landrace to a more determinate growth and higher tolerance to drought, while keeping its sensory quality.
This situation provides a good opportunity for studying the effects of a program to make a landrace evolve into its particular ecosystem, on its genetic diversity, and conservation expectatives over time. Their quantitative evaluation can also make it possible to compare situations, study costs, and take decisions about the conservation of agrobiodiversity. The objectives of the present study are to: (i) describe the process of genetic improvement in the Castellfollit landrace to underline the changes that are brought about in the genotypic and phenotypic information and in the diversity of the germplasm conserved in situ and ex situ, (ii) propose an index to enable the quantification of changes in the information regarding a landrace/variety over period of time, and (iii) apply this index to several landraces from diverse crops, including the Castellfollit landrace, before and after the selection processes to evaluate current trends.

2. Materials and Methods

2.1. The Castellfollit del Boix Breeding Project

The evaluated effects of the breeding programs had three phases: (1) collecting germplasm, (2) characterizing and elaborating an agromorphological and sensory ideotype, and (3) selection and genetic improvement. Throughout the study, we also collected information regarding cultural characteristics that are related to the landrace (epiphenotype) (Figure 2).

2.2. Collecting Accessions and Characterizing the Epiphenotype

Through visits with farmers in the area of cultivation, we collected all of the available germplasm that presumably belonged to the landrace. In parallel, we searched the inventories of the most important seed banks in Spain (Centro de Recursos Fitogenéticos (CRF-INIA), Instituto de Conservación de la Agrodiversidad Valenciana (COMAV-UPV), and Banco de Germoplasma de Especies Hortícolas de Zaragoza (BGHZ)) for accessions that belong to the landrace according to the passport data and/or name.
We surveyed farmers to collect information regarding the traditional ways of managing the crop and of using the beans while collecting germplasm and throughout the program. Moreover, we conducted several assays to optimize the approach to cultivating the landrace (to determine the minimum soil depth required, the type of mechanization, best method of weed control, etc.); in other words, we worked toward the epiphenotypical characterization of the landrace [10].

2.3. From Characterizing the Phenotypes to the Elaboration of the Ideotype

2.3.1. Characterizing the Phenotypes

The collected accessions were cultivated at a single site representative of the zone (Location 0: 41°39′56.9” N; 1°41′05.0” E). The soil characteristics in the area are considerably homogeneous (Table S1); they are loamy, slightly alkaline, with high concentrations of Ca, acceptable cation exchange capacity, and occasional differences in the concentrations of some elements (Na, P) that we consider are basically due to differences in the management of the fields. The beans are cultivated without irrigation; the mean precipitation during the growing season (mid-April–August) over the last 10 years is 203 mm, and the temperature of the soil in this period ranges from −2 °C to 40 °C, with mean monthly minimum of 1, 4, 8, 11, 12 °C, and mean monthly maximum of 24, 27, 32, 34, 35 °C, respectively, for the five months considered.
Field trials were arranged according to a randomized experimental design with two blocks, where each plot contained 100 plants. The plants were cultivated with the commonly used techniques in the area, being sown in mid-April after the usual spring rains, kept without irrigation, with a single application of fertilizer before sowing (70 kg/ha N), and being harvested in mid-August. The plants were sown at a low density to enable individualized measurements (20,000 plants/ha). This management pattern was maintained in all field trials throughout the project; as will be indicated, only the number of sites, number of blocks per site, and the dimensions of the plots varied.

2.3.2. Effects of the Environment on Sensory Traits

Two of the accessions (CF106 and CF109), chosen by the farmers, were sown (four randomized blocks per site and 10 plants per plot) in three additional environments (Location 1: 41°40’49.2” N; 1°42’52.5” E, Location 2: 41°40’47.9” N; 1°39’33.0” E, Location 3: 41°41’14.7” N; 1°42’45.3” E) representative of the edaphic and climatic variability in the area of study to study the possible effects of the environment on sensory traits. Moreover, a complete edaphic study was carried out at each location. The six seed samples (two genotypes × three locations) were analyzed by the Fundació Miquel Agustí (FMA) trained sensory panel. Sensory tests were done in triplicate at the Escola Superior d’Agricultura de Barcelona sensory analysis laboratory, which was equipped with the requisites established in ISO (2007) [11]. The samples were prepared while using the protocol that was described by Romero del Castillo et al. (2012) [12]. The evaluated traits were intensity of odor, intensity of flavor, seed-coat perceptibility, mealiness, brightness, and roughness. The culinary trait percentage of whole seeds after cooking was also evaluated. All of the sensory traits were scored on a semi-structured scale ranging from 0 to 10 [13].

2.3.3. Consumer Taste Test

We carried out a consumers’ preference test [14], in which 127 people participated to evaluate consumers’ opinions about the sensory traits that should be included in the ideotype (gender: 50.4% men, 49.6% women; age: 26.8% <30 years, 26% 30–50 years, 47.2% >50 years; education level: 29.1% primary school, 32.3% secondary school, 38.6% university degree; residing in towns with population in number of inhabitants: 22.8% <10,000 inhabitants, 62.0% 10,000–100,000, 15.1% >100,000; employment status: 20.5% students, 47.2% employed, 32.3% retired/unemployed; frequency of beans consumption: 18.1% more than once a week, 39.4% once a week, 27.6% less than once a week and more than once a month, 14.2% sporadically, 7.9% never).
The test was conducted with the accessions CF106 and CF109 (grown in the same location), which were also studied to determine the genetic and environmental effects on sensory value (see above). The participants were also asked about the characteristics that they appreciate most in dry beans. The two accessions in the consumers’ preference test were also included in the FMA’s sensory panel’s descriptive analysis to correlate consumer’s preferences with specific sensory attributes.

2.3.4. Elaboration of the Ideotype

The data from the field trials, farmers’ agromorphological preferences, and consumers’ preference were used to configure an ideotype to summarize the agronomic characteristics, the appearance of the raw seed, and the appearance and sensory characteristics of the cooked seeds to be used throughout the breeding programs.

2.4. Selection, Crossings, and Breeding Program

The experiment to characterize the accessions (Section 2.2) was also used for the first phenotypic selection. With the collaboration of ten farmers [15], we considered the growth pattern, aspect, resistance to viruses and fungi, yield, and seed shape (Figure 1). A maximum of three plants were selected within each accession (200 plants per accession).
The following autumn, 50 seeds from each of the selected plants were individually sown in a greenhouse to: (a) check to make sure that there was no phenotypic segregation in the progeny of the plants chosen in the field, (b) multiply the material to ensure enough inbred seeds to continue the trials, and (c) carry out controlled crossings with the inbred line (Croscat) that was chosen to provide the determinate growth trait [16]. All of the F1 populations resulting from crossing Castellfollit with Croscat that would provide the determinate growth trait were sown and allowed to self-fertilize to obtain the first generation of inbreeding (S1 generation) from which to start the pedigree selection program.

2.4.1. Individual Selection Program

A brief individual selection program was conducted over two campaigns on 15 progenies that were obtained from a single plant into a non-segregating family chosen during the phenotypic selection (Section 2.3 and Table 2).
The aim of the first campaign was to: (a) study the genotypic value of the plants that were chosen through their mean phenotypic value of their progenies and (b) choose the plants closest to the ideotype and collect the seeds from self-fertilization to enable the obtainment of selected lines of the Castellfollit type.
The first campaign used a randomized block design with two blocks and 10 plants per plot, in two localities (Castellfollit del Boix (41°41’29.5” N 1°42’57.7” E) and Maians (41°38’23.5” N 1°41’40.4” E)) that mainly differed in their altitudes (626 and 554 m, respectively). During cultivation, we analyzed traits, such as resistance to disease and pests, growth habit, earliness, yield, and size and shape of the seeds (with an image processing program: WinSEEDLE Pro v2005b; Regent Instruments, Inc. Quebec, Canada). The information collected was used to select seven lines for the second campaign, which were conducted in the same two localities with 20 plants per plot. In the second campaign, we added some chemical components of the seed coat and cotyledon calculated to the recorded traits while using regression methods from near-infrared spectroscopy [17,18]. We also analyzed the sensory traits, as described in Section 2.3.2.

2.4.2. Pedigree Selection

For pedigree selection, we chose four of the 30 S1 families that were obtained by crossing the landrace with Croscat. We selected plants that had totally determinate growth habit (type I) [9], good overall appearance, high resistance to disease and pests, and high yields in a single locality with a single block and 150 plants per plot. Only selecting plants with determinate growth habit results in the exclusion of plants that are heterozygous for the determinate growth gene (probably the gene fin, which is recessive [19,20]). This is a fast way to proceed in the selection process without the need for molecular analyses. The seeds were obtained by self-fertilization of plants with determinate growth, and while considering the information obtained from F1 and S1, 22 plants were chosen from all of the S1 families (S2 seeds) to continue the process of selection.
The seeds from these 22 S2 families were assayed in the following campaign in the localities of Maians and Castellfollit del Boix with two randomized blocks and 15 plants per plot. During cultivation, we controlled the number of plants that sprouted, the earliness of flowering, the incidence of viral infection, the growth habit, the general vegetative appearance of the rows, the abundance of pods, and the resistance to root fungi. Finally, the plants were selected from the rows that had the best mean phenotypic values. The seeds that resulted from self-fertilization of these plants were measured to determine the yield as well as to determine their size and shape (scanned and analyzed with WinSEEDLE Pro v2005b; Regent Instruments, Inc. Quebec, Canada); this information was used to select the individual plants whose progenies would be used in the next selection cycle. The maximum selection pressure within each family was approximately 5%; on the other hand, no plants were selected from some families. This procedure was repeated over the next three years until 98.5% homozygous plants were obtained; we considered these S6 plants to be inbreds for practical purposes.
The number of families decreased with each generation, because when two families converged toward very similar characteristics, one of them was eliminated, depending on the degree of differentiation observed among the families closest to the ideotype.
A trial was carried out in the two localities (Maians and Castellfollit del Boix) at the end of the selection process to compare the new inbred lines obtained, all of which had determinate growth and upright bearing, together with the controls Croscat and LCF109 (an inbred with indeterminate growth that was obtained through individual selection within the CF109 population). We used an experimental design with two randomized blocks and 15 plants per plot, and we recorded agromorphological and sensory data (Tables 8 and 9).

2.5. Statistical Analysis of the Data and Index to Measure Conservation Status and Conditions Favorable for Conservation

2.5.1. Statistical Analyses

We performed analyses of variance while considering all of the factors in the design and all the measurable interactions in all of the phenotyping studies. To compare means, we used Tukey’s multiple comparison test with the level of significance set at p ≤ 0.05. We also performed a normalized principal component analysis (PCA) to study the phenotypic relationship between the lines that were obtained in the project. We used the binomial test for the consumer preference test [21]. All of the analyses were done with the R program [22,23].

2.5.2. Measuring Conservation Status and Conditions Favorable for Conservation

As mentioned above, one of the objectives of this paper is to propose a method for easily summarizing the elements favorable for the conservation of the germplasm for a determinate landrace at a determinate point in time, beyond the number of accessions inventoried and conserved. This type of measurement (Conservation Potential Index—CPI), as applied at different points in time, has to enable us to compare diverse situations, including long-term trends in the conservation of landraces, or to evaluate the usefulness of an intervention by calculating the cost per each unit of increase in the index. For that, we propose to: (a) use a collection of items that are related to the landrace, including aspects, such as conservation, phenotyping, epiphenotyping, etc. (Table 1), (b) assess each of these items on a scale ranging from 0 to 10, and (c) add up the points for all of the items and divide the sum by the maximum possible score (200). We have decided to give each item equal importance rather than weighting them until we understand the relationship between items better. We assume that the deviations in the scores for each item that are due to the evaluator’s bias will be randomly distributed and, therefore, the algebraic sum of the deviations will be close to zero if all of the items are equally weighted. This index ranges from 0 to 1. The information provided by the CPI complements other measures, such as the conserved number of accessions of the landrace, of the varieties obtained from selection within the landrace, and of the improved varieties that were obtained through the introgression of genes from outside the landrace that still have the differential characteristics of the landrace.

3. Results

The main results regarding the epiphenotypic characteristics and the recommendations for optimizing the management of Castellfollit have been compiled in a best practices manual [24]. All of the previously existing materials that were documented and the newly developed materials are conserved ex situ at the FMA seed germplasm collection, regardless of whether they are currently being used by farmers. All of the information that was collected about the genetic and environmental effects on sensory value will be presented together with the studies of environmental homogeneity and traditional management and the availability of well-defined genetic material to apply for a geographical quality label from the European Union.

3.1. Collecting Accessions, Phenotypic and Epiphenotypic Characterization, Phenotypic Selection, Study of Preferences, and Elaboration of the Ideotype

Searches in Spanish seed banks by name and geographical origin found no accessions of the Castellfollit landrace. Thus, only the 15 accessions that were collected from farmers in the area were used.
The field trial with these accessions revealed considerable phenotypic variation in the traits studied (Table 2). Some of the variability among plants must be attributed to environmental factors, since the crop is cultivated without irrigation and there were substantial differences in environmental factors in the experimental field.
The sets of plants that were selected for their phenotype within each accession had less variability than the rest of the plants in the accession, since they were selected for their superior characteristics (Table 2).
Regarding the influence of the environment on sensory and culinary traits (see material and methods Section 2.3.2) the trained panelists detected significant differences between localities for most parameters studied (Table 3). Nevertheless, the differences were small if we consider that the sensory traits were measured on a scale that ranged from 0 to 10. The differences in the edaphic and climatic characteristics of the locations were also small (Table S1), and no significant correlations were found between these characteristics and the differences in sensory and culinary traits. These findings are not unusual, because the environmental effects are diffuse and affected by many interactions [25].
Significantly more consumers preferred accession CF109 to CF106 (p > 0.05) in the study of consumers’ preference (see Material and Methods Section 2.3.3), although the differences in the preferences were not very large (56% CF109; 44% CF106). Although the trained panel’s descriptive analysis (see Material and Methods Section 2.3.2) found significant differences in most sensory traits, these differences were relatively small (Table 4). Therefore, it is difficult to attribute consumers’ preference to any particular trait scored by the trained panel.
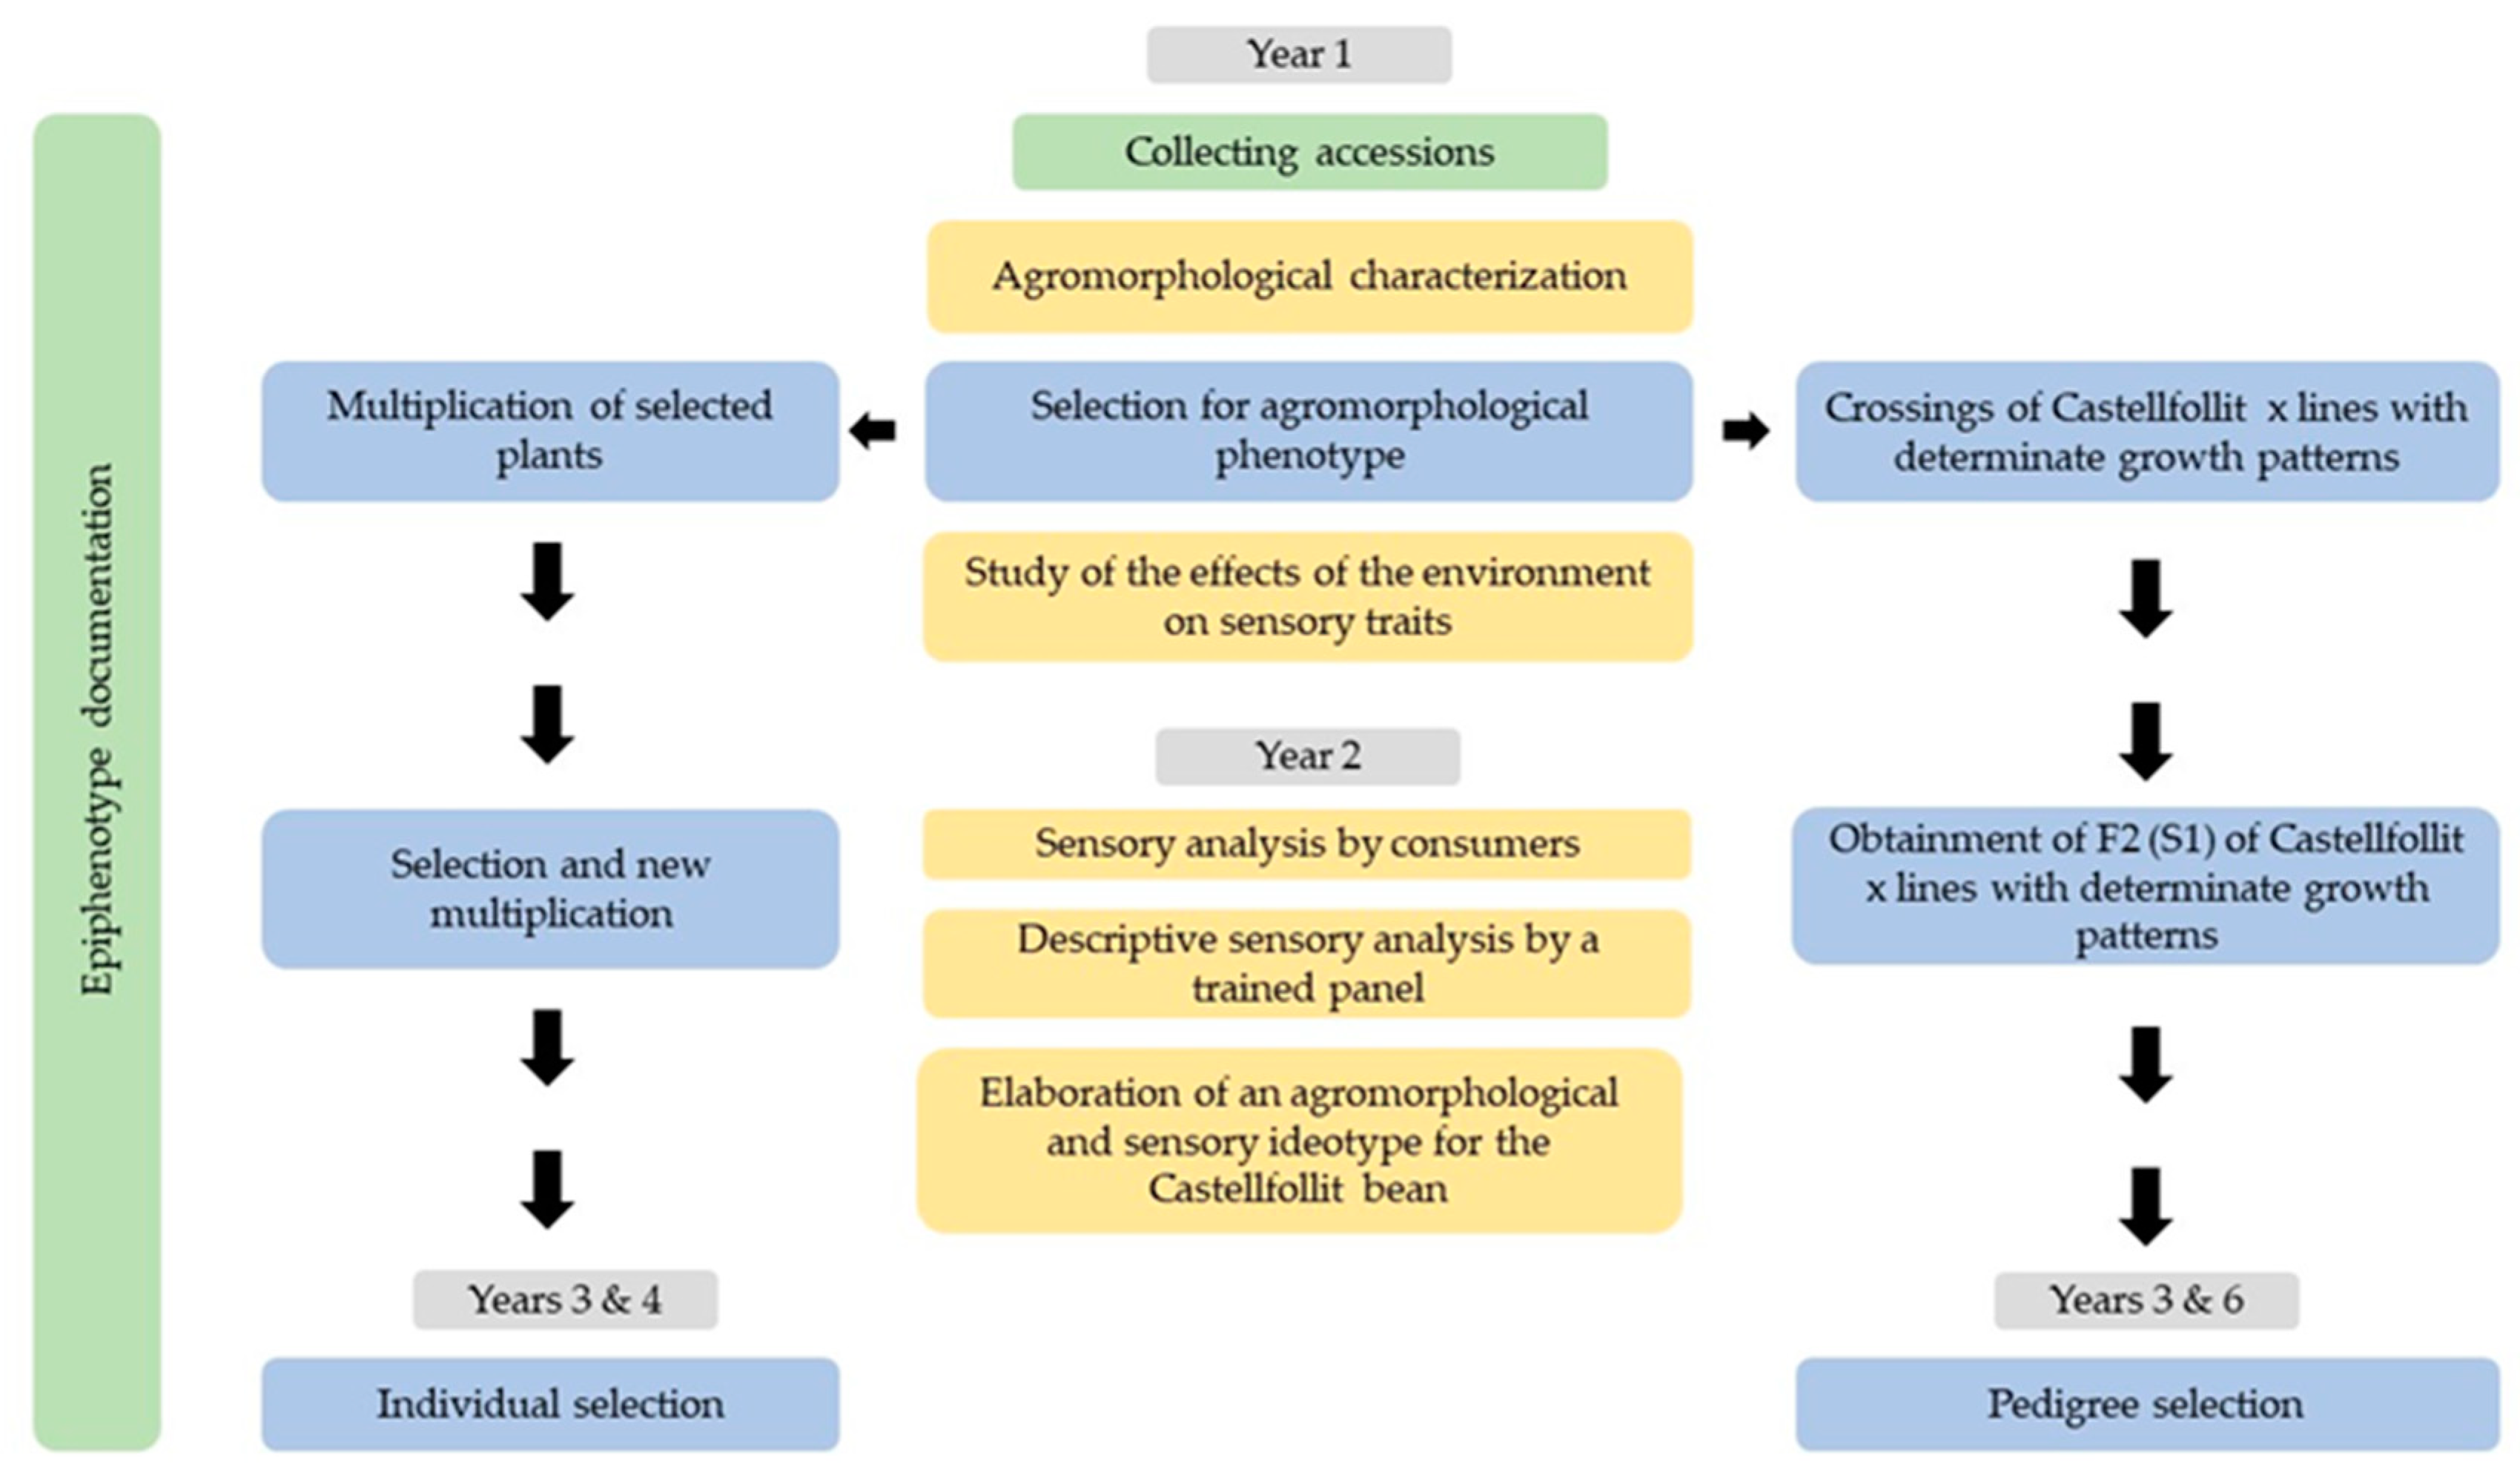
The information from the farmers and the results of our trials during this first phase of the study led to the following ideotype for Castellfollit beans: upright plant with partially or totally determinate growth habit that is resistant to drought, root disease (especially Pythium sp., Fusarium oxysporum, and Rhizoctonia sp.), and viruses (bean common mosaic virus), and that provide good yields. Moreover, a large proportion of the seeds shape should be truncate to facilitate the identification of the landrace in the marketplace (with not rounded ends; see the seeds of the right upper part of Figure 1). A high percentage of the seeds should remain whole after cooking, and very low seed-coat perception, low mealiness, and intense flavor characterize the cooked beans.

3.2. Selection

3.2.1. Individual

No plants with determinate growth habit were identified in the original populations of the landrace. Nevertheless, all of the selected lines had the maximum score for upright bearing. These plants showed considerable variability for the remaining agromorphological traits, being related to yield and seed size and shape (Table 5). Lines LCF420, with big seeds, and LCF109, with small seeds, had the best yields; there were no differences between these two inbreds in the shape of the seeds that were measured by the quotient width/length. Inbred line LCF181, despite having a significantly lower yield than the two lines above, is interesting, because its seeds are easily distinguished (large projected area and size; Table 6) from those of the Navy commercial class [26], with which Castellfollit could be confused.
In the sensory traits (Table 6), the lines that were closest to the ideotype were LCF122, LCF181, LCF810, and LCF109. In the culinary trait, LCF420 was noteworthy, in a negative sense, because it had a low proportion of whole seeds after cooking.
The chemical composition of the cotyledon did not significantly differ between lines (Table 7, but there were some differences in the composition of the seed coat. The genotypes with the lowest values for Ca (LCF191) and Mg (LCF 109), indicators of low seed-coat perceptibility [27], overlapped with other lines. Uronic acid, which is the other trait related with seed-coat perceptibility [27], did not significantly differ between the genotypes.
In light of these results, future efforts will aim to multiply and cultivate inbred lines LCF109, LCF122, and LCF101; LCF181 has also been included because of the peculiar shape of its seeds.

3.2.2. Pedigree Selection

The main aim of the pedigree selection program was to obtain plants with a totally determinate growth habit and upright bearing. All of the selected lines achieved this objective. On the other hand, these lines differed in most other traits. The line that most closely resembles LCF109, the control with indeterminate growth representative of Castellfollit material is LCF6091, which significantly differs in three of the eight traits; the other three lines significantly differ in four of the eight traits (Table 8). In general, the inbred line that has donated determinate growth habit and a degree of resistance to drought has conferred a less flat seed shape (smaller projected area), although three of the four lines still have the elongated seeds that clearly differ from the more rounded seeds of Croscat (Table 8) that are characteristic of the Navy commercial class [26].
Crossings with Croscat in the pedigree selection program also resulted in changes in sensory traits (Table 9). Mealiness decreased in lines LCF6071, LCF6001, and LCF6091. In general, the seed-coat roughness and brightness increased. No changes in aroma or flavor were detected. The most negative result of the pedigree selection program was a decrease in the percentage of seeds that remained whole after cooking (Table 9); this percentage was lower in all of the new lines than in the initial Castellfollit population, but still higher than in the line used to confer determinate growth habit, where it is approximately 20% [16].
We have decided to multiply the four lines and distribute them to farmers to observe their behavior over several seasons and to gauge consumers’ opinions, since the differences in the sensory and culinary traits between the new lines are small and the differences in agromorphological traits indicate considerable variability.

3.2.3. The Selected Germplasm

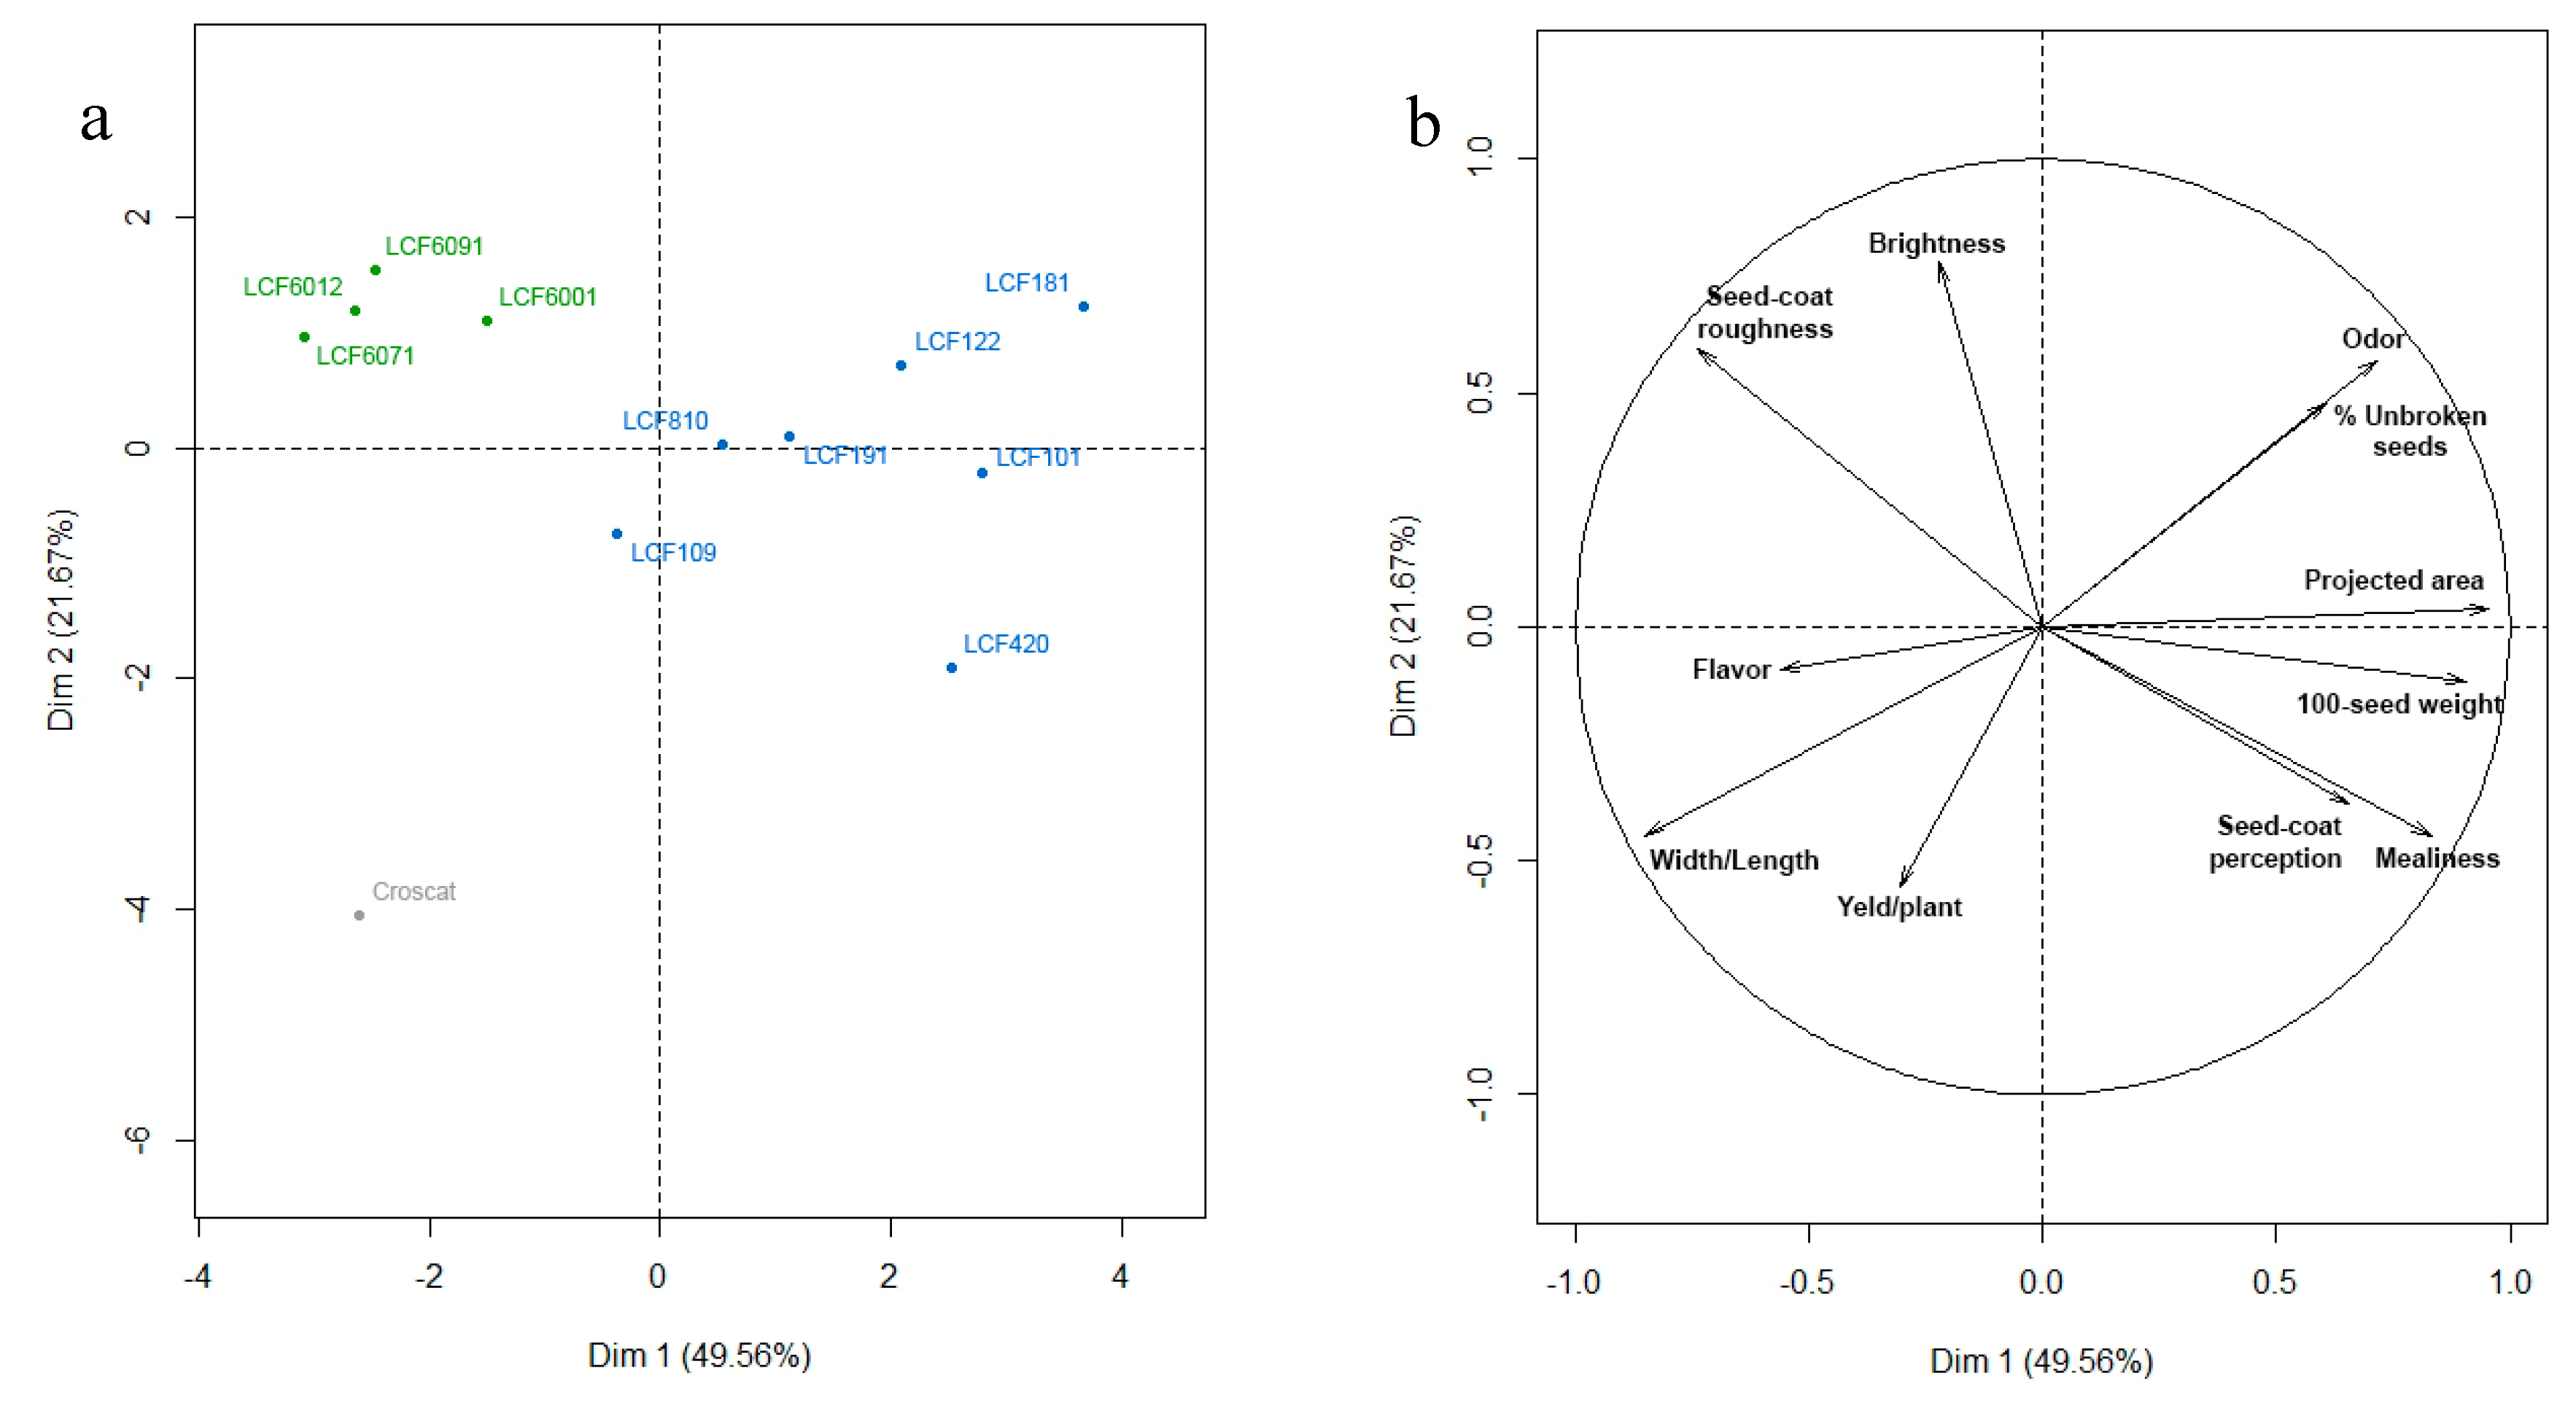
We performed a PCA analysis to evaluate the relationships among the different materials after selection and breeding with the scores of the seven lines coming from the individual selection program (Table 5, Table 6 and Table 7), the four lines of the pedigree selection, and Croscat (Table 8 and Table 9) (Figure 3). Before processing, data were divided by the value of LCF109, present in both experiments, to lower the effects of environmental factors.
The cumulative variation was explained by the first two axes was 71,23% (Figure 3). The traits that best correlated with the first axis were projected area and 100 seeds weight (R = 0.95 and R = 0.90, respectively), and width/length (R = −0.85). With the second axis the highest correlations were those of brightness (R = 0.77), seed-coat roughness (R = 0.59), intensity of odor (R = 0.56), and yield (R = −0.55). Croscat, which is the donor of the determinate growth, has the most extreme position and it is clearly different from the rest of inbreds. The lines that were selected into Castellfollit landrace show a considerable dispersion across the two axes, while the inbreds coming from the pedigree process mainly differ in their position with respect to the first axis (Figure 3). Our intervention had the aim of simulating a spontaneous process of crossing between two varieties and the posterior selection made in favor of the forms closer to the original landrace while taking advantage of new properties, as is usual in farmers’ more or less conscious procedures. The result is that the new inbreds of complete determinate growth habit are in the range of variation of the landrace with respect to sensory properties and yield (axis 2, Figure 3), but they have broadened the variation in size and shape of the seeds (axis 1, Figure 3).

3.3. Effects on Conservation and the Predisposition to Conservation during the Intervention Process

At the start of the intervention, there were 15 accessions of the Castellfollit landrace (variety population) that were conserved in situ (but in high risk of extinction), and none were conserved ex situ. The CPI score at that time was 0.15 (Table 9; details of calculations can be consulted as Table S2), which indicated that there was little documented information about the landrace and its environment. At the end of the intervention, fewer of the old accessions were being cultivated because those farthest from the ideotype had been abandoned; however, the four lines selected within the accessions and four lines improved by the introgression of genes conferring determinate growth habit and other favorable traits were also being cultivated. Moreover, all of the accessions collected were also being conserved ex situ. After the intervention, the CPI score was 0.59 (Table 10; details of calculations can be consulted as Table S2); the increase in the score reflects the documentation of the material and the increased vigor of its use.
We calculated the CPI for 13 other landraces of diverse species that our team has worked with (Table 10; details of calculations can be consulted as Table S2). One of these (maize “d’escairar”, used to make soups) was included, because the only activities to date have been collecting accessions and some local promotion, but no other efforts to characterize the landrace have been undertaken. In the remaining cases, the CPI score ranged from 0.07 to 0.36 before intervention and from 0.29 to 0.80 after the intervention. The lowest initial CPI score was for the Mandó tomato, a landrace about which very little information had been documented when we started to work with it. The highest final CPI score was for the Ganxet and Tavella Brisa landraces of common beans, which our team has been researching, breeding, and promoting for 25 years and 20 years, respectively.
In each case, one or two researchers working with each landrace were asked to quickly assess the items in the CPI based on their knowledge; in fact, on average calculating the CPI only took 10 min. Despite the inevitable risk of error related to the personal bias of the estimations, in the cases where two independent assessors calculated the CPI for a landrace, the results were very similar (Table 10), which suggested the confirmation of the hypothesis proposed in the material and methods section that the deviations of all the items would add up to zero. Without doubt, in its present form, the index is far from achieving the efficiency and predictive capacity of established indices for cardiovascular risk [28], diet quality [29], or food safety [30], but it might be a starting point for further development.
Disregarding the above-mentioned case of maize “d’escairar”, the CPI score increases during the intervention, but this increase is not linear (mean correlation coefficient between the two series [excluding the maize landrace], R = 0.54, nearly significant at p < 0.05). The differences among the situations of the landraces before the intervention, in the time between T0 and T1, in the investments in each case, etc. could explain the differences among cases.
It is also noteworthy that the CPI scores are independent of the number of accessions conserved in situ and/or ex situ (correlation coefficient between the CPI and the number of accessions conserved ex situ after the intervention, R = 0.21, not significant at p < 0.05). This is important, because the objective of the CPI is to complement the information that is obtained in a simple inventory of the resources conserved.

4. Discussion

At the start of this intervention in the Castellfollit bean, the cultivation of the landrace had substantially decreased, despite the greater ease of cultivating large fields of beans facilitated by mechanization and the presence of a market demand that exceeded the supply. It seems paradoxical that the dilution of the autochthonous seed with improved materials, mainly by spontaneous crossings with Great Northern [7], combined with increased capacity to transform fields leading to the abandonment of traditional methods of production in an ecosystem that was very fragile, due to a lack of water, led to the near disappearance of the cultivation of dry beans in the area of Castellfollit del Boix due to decreasing yields.
The project to recover and improve the Castellfollit landrace has enabled us to collect, characterize, multiply, and conserve the historic material. We assessed farmers’ needs and consumers’ preferences, which were obtained inbred lines within the historic material, and introduced genes that favor management and avoid yield loses while keeping modifications to the sensory profile to a minimum. It is true that we have not limited our genetic intervention to the introduction of a single gene to confer determinate the growth habit through backcrossing, so the new varieties with determinate growth habit probably have a considerable number of genes from the donors’ genome. Nevertheless, this situation is not unlike the process that has occurred throughout history in landraces through fortuitous crossings with other varieties [31,32]. We selected the crossings with determinate growth that gave the highest yields of seeds most similar to the historical variety, analogously to what farmers have always done (selecting the plants whose appearance they found most interesting from the appearance of these fortuitous hybrids and continuing this process until they obtained totally homozygous materials). We are also aware that the number of accessions and plants involved in the selection programs is limited, but this kind of interventions must reach a consensus between effectiveness and funding, as the application of the results cover a limited geographical area. Nevertheless, the results show that even dealing with a reduced sample of the variability significant progress is possible.
Throughout this process, we also documented the epiphenotype of the landrace, and proposed methods of cultivation that respected the traditional values while combining them with modern techniques [24]. We also rejected the currently very common, inefficient practice of cultivation in shallow fields, which is acceptable for cereals, but not for beans. Finally, the farmers now have all the tools that are necessary to apply for a quality label, such as a protected denomination of origin (PDO) from the European Union [33].
All of the changes brought about in the intervention have been used to develop an index that quantifies the aspects that our experience tells us favors the conservation of landraces. We consider it to be especially important that the proposed index takes the information collected about a landrace and the efforts to promote it into account, because information regarding the germplasm is fundamental for fomenting its use and thus for its conservation [10,34].
When comparing both the conservation of the landrace and its derivatives before and after the process and comparing the CPI scores at the two points in time indicate that the prospects for conserving the landrace have improved, as has also occurred in other species and situations in which our team has intervened. In every case, the interventions have had a very positive effect on the conservation of the landraces and aspects that are related to their use. The proposed CPI has proven to be easy to calculate and useful in explaining the state of conservation of landraces, complementing simple data regarding the number of accessions conserved in situ and ex situ and diversity indices derived from these data [35,36]. The simplicity with which a person who knows the landrace and its environment can calculate the CPI score makes it, together with the list of accessions, especially appropriate for evaluating the achievements of interventions to conserve plant genetic resources.
Our projects have shown us that landraces lose ground, because it is difficult for them to compete with improved materials, mostly because of their low response to the more intensive cultivation methods that have become generalized. This is fundamentally a matter of objectives, because the results favor biodiversity when the goal is to improve the materials in a specific environment rather than in a generalized environment [37]. Scientific breeding of landraces, which should be the natural evolution of these varieties in the twenty-first century [5], normally involves collecting materials and characterizing them, followed by selection within the collected materials, sometimes incorporating genes from crop wild relatives or other cultivated varieties, a process that significantly increases the genetic variability of the materials. As a result, the ex situ conservation of the previously characterized (often from many points of view) material is ensured, and new variants that are adapted to diverse conditions can be obtained. The number of varieties that have evolved from initial populations depends on the diversity of environments in the area of cultivation and the intended uses for the obtained varieties. The more microenvironments there are, the more it makes sense to develop many varieties. It is evident that we can use our knowledge of genetics and agronomy to recover some of the diversity and wealth of traditional varieties that arose before the advent of scientific crop management and to make these varieties competitive if we opt for low-input crops for a sustainable agriculture [38,39]. Thus, restoring diversity is mainly a matter of appreciating environmental diversity; in this way, we can save and even expand genetic diversity. We can achieve new varieties that are adapted to local conditions very quickly by applying our knowledge of the genome. Perhaps by refocusing the aims of breeding programs, we can transform what Louwaars [1] aptly describes as “troubled relationships” between plant breeding and diversity into a true friendship.

Supplementary Materials

The following are available online at https://0-www-mdpi-com.brum.beds.ac.uk/2073-4395/9/12/889/s1, Table S1: Edaphic characteristics of the fields in the area of Castellfollit del Boix, estimated from samples obtained at 8 representative sites where the bean landrace is cultivated. Table S2: Detail of the calculation of the indexes appearing in Table 10.

Author Contributions

Conceptualization, A.R. (Ana Rivera), J.C., F.C., J.P., M.J.D. and J.S. (Joan Simó); methodology, A.R. (Ana Rivera), A.R. (Aurora Rull), S.S. (Salvador Soler) and J.S. (Josep Sabaté); validation, F.C., J.C., J.S. (Joan Simó) and S.S. (Salvador Soler); investigation, A.R. (Aurora Rull), R.R.D.C., A.R. (Ana Rivera) and S.S. (Silvia Sans); resources, J.S. (Joan Simó) and J.C.; data curation, A.R. (Ana Rivera), A.R. (Aurora Rull), S.S. (Silvia Sans) and J.S. (Josep Sabaté) and R.R.D.C.; writing—original draft preparation, F.C.; writing—review and editing, A.R. (Ana Rivera), J.C. and J.S. (Joan Simó); supervision, J.P. and M.J.D.; funding acquisition, J.C.

Funding

This research was funded by Ajuntament de Castellfollit del Boix, Consell Comarcal del Bages and Diputació de Barcelona.

Acknowledgments

Agrupació de productors de Mongeta de Castellfollit del Boix, and the members of the sensory panel.

Conflicts of Interest

The authors declare no conflict of interest. The funders had no role in the design of the study; in the collection, analyses, or interpretation of data; in the writing of the manuscript, or in the decision to publish the results.

References

  1. Louwaars, N.P. Plant breeding and diversity: A troubled relationship? Euphytica 2018, 214, 114–123. [Google Scholar] [CrossRef] [PubMed] [Green Version]
  2. Borlaug, N.E. The green revolution revisited and the road ahead. In Proceedings of the Special 30th Anniversary Lecture, Oslo, Norway, 8 September 2000. [Google Scholar]
  3. Gollin, D.; Morris, M.; Ekbyerlee, A. Technology adoption in intensive post-green revolution systems. Am. J. Agric. Econ. 2005, 87, 1310–1316. [Google Scholar] [CrossRef]
  4. Stout, J. Handbook of Energy for World Agriculture; Elsevier: New York, NY, USA, 1990. [Google Scholar]
  5. Casañas, F.; Simó, J.; Casals, J.; Prohens, J. Towards an evolved concept of landrace. Front. Plant Sci. 2017, 8, 145. [Google Scholar] [CrossRef] [PubMed] [Green Version]
  6. FAO. The Second Report on the State of the World’s Plant Genetic Resources for Food and Agriculture; FAO: Rome, Italy, 2010. [Google Scholar]
  7. Sánchez, E.; Sifres, A.; Casañas, F.; Nuez, F. Common bean (Phaseolus vulgaris L.) landraces in Catalonia, a Mesoamerican germplasm hotspot to be preserved. J. Hortic. Sci. Biotech. 2007, 82, 529–534. [Google Scholar] [CrossRef]
  8. Young, A. Tour in Catalonia. In Annals of Agriculture and Other Useful Arts; Arthur Young: London, UK, 1787. [Google Scholar]
  9. Singh, S.P. A key for identification of different growth habits of Phaseolus vulgaris L. Annu. Rep. Bean Improv. Coop. 1982, 25, 92–95. [Google Scholar]
  10. Díez, M.J.; de la Rosa, L.; Martín, I.; Guasch, L.; Cartea, M.E.; Mallor, C.; Casals, J.; Simó, J.; Rivera, A.; Anastasio, G.; et al. Plant Genebanks: Present Situation and Proposals for Their Improvement. The Case of the Spanish Network. Front. Plant Sci. 2018, 9, 1794. [Google Scholar] [CrossRef] [Green Version]
  11. ISO. 8589 Sensory Analysis—General Guidance for the Design of Test Rooms; International Organization for Standardization: Génève, Switzerland, 2007. [Google Scholar]
  12. Romero del Castillo, R.; Costell, E.; Plans, M.; Simó, J.; Casañas, F. A standardized method of preparing common beans (Phaseolus vulgaris L.) for sensory analysis. J. Sens. Stud. 2012, 27, 188–195. [Google Scholar] [CrossRef]
  13. Romero del Castillo, R.; Valero, J.; Casañas, F.; Costell, E. Training, validation and maintenance of a panel to evaluate the texture of dry beans (Phaseolus vulgaris L.). J. Sens. Stud. 2008, 23, 303–319. [Google Scholar] [CrossRef]
  14. Meilgaard, M.C.; Civille, G.V.; Carr, B.T. Sensory Evaluation Techniques, 4th ed.; CRC Press: Boca Raton, FL, USA, 2007. [Google Scholar]
  15. Dawson, J.C.; Murphy, K.M.; Jones, S. Decentralized selection and participatory approaches in plant breeding for low-input systems. Euphytica 2008, 160, 143–154. [Google Scholar] [CrossRef]
  16. Almirall, A.; Bosch, L.; Romero del Castillo, R.; Rivera, A.; Casañas, F. ‘Croscat’ common bean (Phaseolus vulgaris L.), a prototypical cultivar within the ‘Tavella Brisa’ type. HortScience 2010, 45, 432–433. [Google Scholar] [CrossRef] [Green Version]
  17. Plans, M.; Simó, J.; Casañas, F.; Sabaté, J. Near-infrared spectroscopy analysis of seed coats of common beans (Phaseolus vulgaris L.): A potential tool for breeding and quality evaluation. J. Agric. Food Chem. 2012, 60, 706–712. [Google Scholar] [CrossRef] [PubMed]
  18. Plans, M.; Simó, J.; Casañas, F.; Romero del Castillo, R.; Rodriguez-Saona, L.E.; Sabaté, J. Estimating sensory properties of common beans (Phaseolus vulgaris L.) by near infrared spectroscopy. Food Res. Int. 2014, 56, 55–62. [Google Scholar] [CrossRef]
  19. Coyne, D.P. Photoperiodism: Inheritance and linkage studies in Phaseolus vulgaris. J. Hered. 1967, 58, 313–314. [Google Scholar] [CrossRef]
  20. Koinange, E.M.K.; Singh, S.P.; Gepts, P. Genetic control of the domestication syndrome in common-bean. Crop Sci. 1996, 36, 1037–1145. [Google Scholar] [CrossRef] [Green Version]
  21. O’Mahony, M. Sensory Evaluation of Food. In Statistical Methods and Procedures; Marcel Dekker: New York, NY, USA, 1986. [Google Scholar]
  22. R Development Core Team. R: A Language and Environment for Statistical Computing; R Foundation for Statistical Computing: Vienna, Austria, 2010. [Google Scholar]
  23. Mendiburu, F. Agricolae: Statistical Procedures for Agricultural Research; R Package Version 1.0–9; R Foundation for Statistical Computing: Vienna, Austria, 2010. [Google Scholar]
  24. FMA. Manual de bones pràctiques. Mongeta de Castellfollit del Boix. 2019. Available online: http://fundaciomiquelagusti.com/es/2017/03/04/projecte-de-recuperacio-i-millora-genetica-de-la-mongeta-de-castellfollit-del-boix/ (accessed on 20 October 2019).
  25. Sans, S.; Casals, J.; Simó, J. Improving the Commercial Value of the ‘Calçot’ (Allium cepa L.) Landrace: Influence of Genetic and Environmental Factors in Chemical Composition and Sensory Attributes. Front. Plant Sci. 2018, 9, 1465. [Google Scholar] [CrossRef] [PubMed]
  26. Santalla, M.; de Ron, A.M.; Voysest, O. European Bean Market Classes. In Catalogue of Bean Genetic Resources; Amurrio, M., Santalla, M., de Ron, A.M., Eds.; PHASELIEUFAIRPL97-3463-MBG-CSIC; Fundación Pedro Barrié de la Maza: Pontevedra, Spain, 2001; pp. 79–94. [Google Scholar]
  27. Casañas, F.; Pujolà, M.; Romero del Castillo, R.R.; Almirall, A.; Sánchez, E.; Nuez, F. Variability in some texture characteristics and chemical composition of common beans (Phaseolus vulgaris L.). J. Sci. Food Agric. 2006, 86, 2445–2449. [Google Scholar] [CrossRef] [Green Version]
  28. De la Iglesia, B.; Potter, J.F.; Poulter, N.R.; Robins, M.M.; Skinner, J. Performance of the ASSIGN cardiovascular disease risk score on a UK cohort of patients from general practice. Heart 2011, 97, 491–499. [Google Scholar] [CrossRef]
  29. Kant, A.K. Indexes of overall diet quality: A review. J. Am. Diet. Assoc. 1996, 8, 85–791. [Google Scholar]
  30. Ross, T.; Summer, J. A simple, spreadsheet-based, food safety risk assessment tool. Int. J. Food Microbiol. 2002, 77, 39–53. [Google Scholar] [CrossRef]
  31. Bitocchi, E.; Nanni, L.; Rossi, M.; Rau, D.; Bellucci, E.; Giardini, A.; Buonamici, A.; Vendramin, G.G.; Papa, R. Introgression from modern hybrid varieties into landrace populations of maize (Zea mays ssp. mays L. in central Italy. Mol. Ecol. 2009, 18, 603–621. [Google Scholar] [CrossRef]
  32. Van Heerwaarden, J.; Doebley, J.; Briggs, W.H.; Glaubitz, J.C.; Goodman, M.M.; Sanchez Gonzalez, J.J.; Ross-Ibarra, J. Genetic signals of origin, spread, and introgression in a large sample of maize landraces. Proc. Natl. Acad. Sci. USA 2011, 108, 1088–1092. [Google Scholar] [CrossRef] [PubMed] [Green Version]
  33. European Union. Regulation No 1151/2012 of the European Parliament and of the Council of 21 November 2012 on quality schemes for agricultural products and foodstuffs. Off. J. Eur. Union 2012, 14, 12. [Google Scholar]
  34. Prada, D. Molecular population genetics and agronomic alleles in seed banks: Searching for a needle in a haystack? J. Exp. Bot. 2009, 60, 2541–2552. [Google Scholar] [CrossRef] [PubMed] [Green Version]
  35. Shannon, C.E.; Weaver, W. The Mathematical Theory of Communication; University Illinois Press: Urbana, IL, USA, 1963. [Google Scholar]
  36. Nei, M. Analysis of gene diversity in subdivided populations. Proc. Natl. Acad. Sci. USA 1973, 70, 3321–3323. [Google Scholar] [CrossRef] [Green Version]
  37. Witcombe, J.R.; Joshi, A.; Joshi, K.D.; Sthapit, B.R. Farmer participatory crop improvement. I. Varietal selection and breeding methods and their impact on biodiversity. Exp. Agric. 1996, 32, 445–460. [Google Scholar] [CrossRef]
  38. Pimentel, D.; Culliney, T.W.; Buttler, I.W.; Reinemann, D.J.; Beckman, K.B. Low-input sustainable agriculture using ecological management practices. Agric. Ecosyst. Environ. 1989, 27, 3–24. [Google Scholar] [CrossRef]
  39. Lammerts van Bueren, E.T.; Østergård, H.; Goldringer, I.; Scholten, O. Plant breeding for organic and sustainable, low-input agriculture: Dealing with genotype–environment interactions. Euphytica 2008, 163, 321–322. [Google Scholar] [CrossRef]
Figure 1. Typical shape of the seeds of the Castellfollit landrace; seeds from the ends of the pods tend to be more rounded. The scale is in cm.
Agronomy 09 00889 g001
Figure 2. Chronogram of the project for the Castellfollit bean landrace. The different phases are represented in different colors: Collecting material and characterizing the epiphenotype (green), characterization, study of preferences, and elaboration of the ideotype (yellow), and selection and genetic improvement (blue).
Agronomy 09 00889 g002
Figure 3. Configuration of the lines and the yield, seed morphology and sensory characteristics on the first Principal Component Analysis (PCA) plan (components 1 and 2). The percentages between parentheses refer to the variation explained by each principal component. (a) Individuals factor map: distribution of individuals on the first PCA plan. Grey colour, line donor of determined growth pattern, green colour, new inbred lines and blue colour, selected inbreeds into the landrace accessions. (b) Variables factor map: correlation between variables and components on the first PCA plan.
Agronomy 09 00889 g003
Table 1. Items evaluated for the calculation of the Conservation Potential Index. Each item is scored on a scale ranging from 0 to 10.
ItemsDefinition
Controlled multiplication of germplasmDegree of multiplication of germplasm done in an isolated and controlled way, with conservative selection
Morphological characterization Degree of characterization of the morphological variability found in the landrace
Agronomic characterizationDegree of characterization of the agronomic variability found in the landrace
Sensory characterizationDegree of characterization of the sensory variability found in the landrace
Chemical characterizationDegree of characterization of the chemical variability found in the landrace
Genetic characterizationDegree of characterization of the genetic variability found in the landrace
Characterization of environmental effectsDegree of characterization of the effects of the environment on the variability found in the landrace
Edaphic description Degree of characterization of the soils in the territory where the landrace has traditionally been cultivated
Climatic description Degree of characterization of the climate in the territory where the landrace has traditionally been cultivated
Historical/cultural documentationDegree of historical/cultural characterization of the uses of the landrace
Documentation of traditional cultivation methodsDegree of knowledge and documentation of the traditional methods of cultivating the landrace
Bringing management technologies up to dateDegree of exploration of new farming technologies and mechanization tried and/or incorporated into cultivation of the landrace
Associations among farmersDegree of association among farmers for the purpose of exploiting and commercializing the landrace
European Union geographical quality label State of the process toward obtaining a European quality label
External quality control Degree of external quality control of the product’s sensory traits
Farmers’ preferencesDegree of formulation of farmers’ preferences
Consumers’ preferencesDegree of formulation of consumers’ preferences
Use in restaurantsDegree of use of the product in restaurants (mainly in the area of cultivation)
Use in transformed productsDegree of transformation of the product (canning, etc.)
Collective promotion in events Degree of promotion of the product at fairs and events
Table 2. Characteristics of the accessions studied: mean (±SE) of all plants in each accession, mean of all the plants in the trial, and the mean of the plants selected for breeding.
AccessionVirus 1Growth Habit 2Appearance 3Days to FloweringNumber of Pod/PlantYield (g/plant)100 Seeds Weight (g)
CF71022.11 ± 0.251.51 ± 0.241.22 ± 0.0950.56 ± 1.0138.56 ± 4.8551.78 ± 8.6433.46 ± 1.45
CF1142.00 ± 0.181.50 ± 0.221.52 ± 0.1848.88 ± 0.0133.01 ± 4.8240.13 ± 0.6734.12 ± 1.70
CF2012.50 ± 0.151.57 ± 0.171.21 ± 0.1148.12 ± 0.3130.14 ± 3.8837.29 ± 7.7232.81 ± 2.77
CF2142.14 ± 0.261.64 ± 0.241.57 ± 0.1748.88 ± 0.0234.14 ± 5.5152.12 ± 6.5940.33 ± 2.58
CF3012.32 ± 0.171.45 ± 0.141.45 ± 0.0850.36 ± 0.7646.09 ± 4.8451.18 ± 5.6831.48 ± 1.92
CF3142.42 ± 0.371.51 ± 0.181.33 ± 0.2149.63 ± 0.8447.00 ± 4.9054.33 ± 8.0128.50 ± 1.59
CF4011.63 ± 0.131.17 ± 0.081.22 ± 0.0949.38 ± 0.5643.78 ± 3.6455.67 ± 5.3434.89 ± 0.92
CF1061.83 ± 0.171.33 ± 0.171.17 ± 0.0849.87 ± 0.7443.56 ± 6.0563.89 ± 7.5636.48 ± 1.22
CF5012.38 ± 0.181.63 ± 0.231.31 ± 0.0949.44 ± 0.6337.38 ± 5.7947.01 ± 9.6133.33 ± 1.87
CF5142.08 ± 0.201.53 ± 0.321.33 ± 0.1749.63 ± 0.8443.33 ± 4.8861.17 ± 7.8439.17 ± 2.26
CF6142.29 ± 0.151.14 ± 0.141.07 ± 0.0751.11 ± 1.0447.57 ± 5.4564.14 ± 6.8735.20 ± 1.58
CF7012.23 ± 0.181.41 ± 0.141.27 ± 0.0850.10 ± 0.6843.42 ± 3.4954.75 ± 6.1236.36 ± 3.36
CF7141.86 ± 0.141.07 ± 0.071.43 ± 0.1750.16 ± 0.9253.29 ± 8.3165.14 ± 9.7537.86 ± 3.78
CF70022.51 ± 0.131.35 ± 0.151.15 ± 0.0851.11 ± 0.8445.00 ± 5.3251.91 ± 5.4831.73 ± 2.12
CF1092.31 ± 0.231.31 ± 0.131.25 ± 0.1350.01 ± 0.8232.63 ± 2.7139.88 ± 5.4232.91 ± 2.43
Initial population2.67 ± 0.020.94 ± 0.011.13 ± 0.0156.44 ± 0.0729.20 ± 0.2840.73 ± 0.5229.61 ± 0.18
Selected plants2.17 ± 0.061.40 ± 0.041.29 ± 0.0349.81 ± 0.2241.25 ± 1.5652.67 ± 2.0934.56 ± 0.73
1 0 = no virus, 3 = extensive viral infection; 2 0 = trailing, 3 = very upright; 3 0= poor overall impression, 3 = good overall impression.
Table 3. Comparison of means of sensory and culinary traits for each locality using CF106 and CF109 accessions. Values within the same column followed by the same letter are not significantly different at p ≤ 0.05 according to Tukey’s multiple comparison test.
LocalityOdor 1FlavorSeed-Coat PerceptionMealinessSeed-Coat RoughnessBrightness% Whole Seeds after Cooking
Loc 13.2 a35 b0.8 b4.3 a4.3 a6.2 b72.1 a
Loc 22.8 a3.0 b1.9 a4.5 a4.2a7.2 a64.5 b
Loc 33.2 a4.6 a1.1 b4.3 a4.7 a6.4 b65.8 b
1 All sensory traits were measured on a scale ranging from 0 (absence of the trait) to 10 (maximum expression of the trait).
Table 4. Comparison of means of sensory traits for the accessions CF109 and CF106. Values within the same column followed by the same letter are not significantly different at p ≤ 0.05 according to Tukey’s multiple comparison test.
AccessionOdor 1FlavorSeed-Coat PerceptionMealinessSeed-Coat RoughnessBrightness% Whole Seeds after Cooking
CF1093.3 a3.7 a0.8 a3.5 a5.2 a5.4 a74.8 a
CF1062.5 b3.5 a1.6 b4.7 b6.0 b6.7 b62.0 a
1 All sensory traits were measured on a scale ranging from 0 (absence of the trait) to 10 (maximum expression of the trait).
Table 5. Agromorphological traits of the inbred lines chosen by individual selection in the final trial of the program. Values within the same column followed by the same letter are not significantly different at p ≤ 0.05 according to Tukey’s multiple comparison test.
Inbred LineYield (g/plant)100-Seed Weight (g)Projected Area of the Seed (mm2)Seed Width/Length
LCF10137.7 cd31.5 ab66.4 bcd0.67 b
LCF12227.8 e34.5 a70.4 bcd0.68 ab
LCF18128.4 e35.9 a80.7 a0.63 c
LCF19143.3 bc26.5 b58.1 d0.67 b
LCF42052.6 a37.7 a73 ab0.68 ab
LCF81033.4 de27.2 b61.7 cd0.68 ab
LCF10947.0 ab25.4 b56.2 d0.7 a
Table 6. Sensory and culinary traits of the inbred lines chosen by individual selection in the final trial of the program. Numbers within the same column followed by the same letter are not significantly different at p ≤ 0.05 according to Tukey’s multiple comparison test.
Inbred LineOdor 1FlavorSeed-Coat PerceptionMealinessSeed-Coat RoughnessBrightness% Whole Seeds after Cooking
LCF1014.9 a5.7 abc3.0 ab4.7 a4.9 b6.5 a77.5 a
LCF1225.1 a6.5 a1.3 cd4.5 a5.7 ab6.0 ab72.5 a
LCF1815.5 a6.3 ab2.1 bc4.8 a6.2 a5.9 ab65.7 ab
LCF1914.7 a5.2 bc2.2 bc3.9 a5.2 ab6.9 a76.8 a
LCF4204.7 a4.8 c3.9 a4.3 a5.1 ab6.7 a46.6 b
LCF8104.6 a6.3 ab1.7 cd4.0 a6.0 ab5.9 ab68.2 ab
LCF1094.5 a6.2 ab0.8 d3.8 a5.8 ab5.2 b78.6 a
1 All sensory traits were measured on a scale ranging from 0 (absence of the trait) to 10 (maximum expression of the trait).
Table 7. Chemical components of the cotyledon and seed coat of the inbred lines used in the final trial of the individual selection program, expressed as g.kg−1. Values within the same column followed by the same letter are not significantly different at p ≤ 0.05 according to Tukey’s multiple comparison test.
Cotyledon Seed Coat
Inbred LineStarchProteinAmyloseApparent Amylose AshCaMgDietary FiberPUronic Acid
LCF101383.70 a257.79 a273.90 a328.21 a 68.31 ab18.33 b3.40 ab769.45 a0.23 ab128.49 a
LCF122397.89 a248.34 a301.91 a328.84 a 74.17 ab20.83 ab3.29 abc789.85 a0.18 ab125.27 a
LCF181362.76 a284.96 a273.58 a312.09 a 65.66 b17.01 b3.18 bc808.36 a0.11 b130.00 a
LCF191366.33 a269.90 a312.35 a333.27 a 60.85 b14.56 b3.47 ab817.60 a0.30 a125.79 a
LCF420386.60 a260.40 a289.85 a328.22 a 76.58 ab20.86 ab3.32 abc822.11 a0.23 ab123.45 a
LCF810388.20 a251.48 a282.00 a330.35 a 71.68 ab19.28 ab3.72 a804.95 a0.21 ab121.54 a
LCF109361.94 a277.62 a265.63 a319.80 a 88.26 a25.66 a2.95 c772.91 a0.18 ab122.26 a
Table 8. Characteristics of the new inbred lines (S6) obtained in the pedigree selection program from the initial Castellfollit line and the Croscat line that donated the trait determinate growth habit. Values within the same column followed by the same letter are not significantly different at p ≤ 0.05 according to Tukey’s multiple comparison test.
InbredDays to FloweringGeneral Value 1Number of Pods/PlantPod Length (cm)Yield (g/Plant)100 Seeds Weight (g)Projected Area of the Seed (mm2)Seed Width/length
LCF600149 b2.9 a62 bc10.5 ab56.4 b23.4 c46.2 b0.67 bc
LCF601257 c1.8 b60 c10.9 a65.1 ab27.4 ab48.6 b0.67 b
LCF607143 a2.4 ab67 b10.8 a67.9 ab24.2 bc47.2 b0.66 bc
LCF609143 a2 ab63 bc10.9 a63.1 b25.5 abc50.5 b0.66 bc
LCF10946 ab2.1 ab61 c10.3 ab74.9 a28.9 a58.9 a0.65 c
Croscat54 c1.9 ab76 a9.7 b71.3 ab26.5 abc45.9 b0.73 a
1 Measured on a scale ranging from 0 (very poor) to 3 (very good).
Table 9. Sensory and culinary traits of the new inbred lines (S6) with determinate growth habit obtained through pedigree selection; of line LCF109, with indeterminate growth habit, representative of the historic landrace; and of line Croscat, used to confer determinate growth habit. Values within the same column followed by the same letter are not significantly different at p ≤ 0.05 according to Tukey’s multiple comparison test.
InbredOdor 1FlavorSeed-Coat PerceptionMealinessSeed-Coat RoughnessBrightness% Whole Seeds after Cooking
LCF60014.4 a5.6 a1.2 ab2.3 b7.1 a7.3 a50 b
LCF60124.7 a4.4 b2.0 a2.9 ab6.7 b6.6 ab62 b
LCF60714.5 a5.6 a 1.2 ab2.4 b7.2 a7.3 a58 b
LCF60914.6 a5.5 a1.3 ab2.3 b7.3 a7.2 a60 b
LCF109 4.4 a5.1 ab0.9 b3.3 a4.7 c4.7 c91 a
Croscat4.1 b6.2 c2.1 a3.8 a4.6 c3.1 d18 c
1 All sensory traits were measured on a scale ranging from 0 (absence of the trait) to 10 (maximum expression of the trait).
Table 10. Inventory of available germplasm and Conservation Potential Index (CPI) score (mean ±SE where the CPI was estimated by two independent evaluators) for different landraces, before (T0) and after directed scientific breeding programs (T1).
Landrace and speciesNumber In Situ Accessions T0Number In Situ Accessions T1 Number Ex Situ Accessions T0Number Ex Situ Accessions T1Number Selected Varieties T0Number Selected Varieties T1Number Varieties Derived T0Number Varieties Derived T1CPI T0CPI T1
Castellfollit del Boix bean (Phaseolus vulgaris L.)154151504040.21 ± 0.050.65 ± 0.03
Ganxet bean (Phaseolus vulgaris L.)257>1403257028000.23 ± 0.040.80 ± 0.01
Tavella Brisa bean (Phaseolus vulgaris L.)17<10171700040.30 ± 0.020.80 ± 0.06
Blanca Tardana de Lleida onion (Allium cepa L.)161011402030.36 ± 0.010.75 ± 0.02
Coll de Nargó onion (Allium cepa L.)440401000.10 ± 0.020.29 ± 0.03
Espigall del Garraf (Brassica oleracea L.)744501000.20 ± 0.060.52 ± 0.00
“D’escairar” maize (Zea mays L.)6 66600000.15 ± 0.030.15 ± 0.03
Mandó tomato (Solanum lycopersicum L.) 110106000.070.64
Penjar tomato (Catalonia) (Solanum lycopersicum L.) 350506029836080.290.54
Penjar tomato (Valencia) (Solanum lycopersicum L.) 5053697233330.40.66
Pera Girona tomato (Solanum lycopersicum L.)6010256201020.140.42
Valencià tomato (Solanum lycopersicum L.)>100 >10013114607070.280.56
Almagro eggplant (Solanum melongena L.)252041801000.360.68

