Assessment of Sustainability in Agriculture of the European Union Countries


1
Department of Economics and Agribusiness, University of Life Sciences in Lublin, ul. Akademicka 13, 20-950 Lublin, Poland
2
Department of Applied Mathematics and Computer Science, University of Life Sciences in Lublin, 20-950 Lublin, Poland
*
Author to whom correspondence should be addressed.
Agronomy 2019, 9(12), 890; https://0-doi-org.brum.beds.ac.uk/10.3390/agronomy9120890
Submission received: 27 October 2019
/
Revised: 6 December 2019
/
Accepted: 9 December 2019
/
Published: 16 December 2019
(This article belongs to the Section Farming Sustainability)
Abstract
:This paper aimed at evaluating the level of sustainability in agriculture in 28 member states of the European Union. The surveys were carried out based on a synthetic technique for order preference by similarity to an ideal solution (TOPSIS)-based measure. This method synthesizes factors of various nature and assigns them a synthetic aggregate measure. The analysis made it possible to develop a ranking of EU member states according to a differentiated level of measures and assign them to one of four groups characterized by different levels of sustainability in agriculture. The group of member states representing the highest level of sustainability in agriculture included two countries from Central and Eastern Europe, i.e., Slovakia and the Czech Republic. The group of countries with a greater than average level of sustainability comprised 14 member states of the European Union, including seven countries admitted to the community after 2004. The group with a low level of sustainability consisted of eight EU member states, six of them from the group of old EU member states, i.e., Ireland, Portugal, Greece, Italy, Denmark and the United Kingdom, and two new members, i.e., Romania and Slovenia. On the other hand, the lowest level of sustainability was characteristic of two “old EU” member states, i.e., The Netherlands and Belgium, and two “new EU” member states, i.e., Cyprus and Malta. The differentiated synthetic measure values showed disparities in the level of sustainability in agriculture among the member states of the European Union. They are a result of the varied level of development of this sector, production intensity and the resulting environmental impact.
1. Introduction
Sustainable growth is an important concept for contemporary society and the economy, being a response to unreasonable management of natural resources [1]. With reference to the European Union (EU), challenges related to these areas were described in “A Sustainable Europe for a Better World: A European Union Strategy for Sustainable Development”, approved in May 2001 by the European Council in Göteborg and renewed in June 2006 [2]. Sustainable growth is a fundamental goal of the EU, assuming continuous improvement in the quality of life and wellbeing of the present and future generations by combining economic growth, environmental protection and social justice. Currently, the fundamental document defining the future of Europe is “A Strategy for Smart, Sustainable and Inclusive growth. EUROPE 2020” [3]. On the basis of challenges connected with sustainable development, a bioeconomy concept emerged, aiming to ensure food security and increase the innovative use of resources in a competitive society in a manner friendly to the natural environment [4]. Bioeconomy has found a significant place in the EU scientific research program Horizon 2020 [5].
In the process of production, agriculture makes use of natural resources, thus disturbing the functioning of the natural environment. In particular, this concerns the model of industrial agriculture [6,7,8]. This imposed costs on economies and made agricultural systems less efficient by degrading ecosystem goods and services [9]. Therefore, agriculture should be a leader in change towards sustainable growth by promoting innovative technologies and stewardship [8,10,11]. According to FAO [12], agriculture alone accounts for 70% of the global intake of fresh water. On the other hand, the sector has important functions, including those connected with food production or with wellbeing. Thus, sustainable growth of the agricultural sector is a necessity from the perspective of the environment, society and economy [13,14]. In particular, global warming, pressure on water resources, degradation of soil and environmental damage, posing threats to human life and to other living habitats, necessitate the implementation of new agricultural practices [15]. Foley et al. [16] emphasize that we face the challenge of managing trade-offs between immediate human needs and maintaining the capacity of the biosphere to provide goods and services in the long term. The European Union, pioneering in the global environmental protection and sustainable growth initiatives, deems agriculture to be particularly interesting in this respect [14]. A special form of support to agriculture in increasing its sustainability level comprises grants for farmers under the Common Agricultural Policy (CAP).
However, the application of this concept in agriculture led to the emergence of multiple definitions of sustainable agriculture [17]. Velten et al. [18], in their studies, found that the multitude of different and partially contradictory definitions contributed to problems in sustainable development of agriculture and deepened the controversies between various groups of stakeholders. According to Hayati et al. [19], sustainable agriculture is a global, dynamic process taking place in three dimensions (economic, environmental and social) and at five levels (field, farmstead, local community, national and international levels).
Measuring the level of sustainability in agriculture is not an easy task [20]. This is due to the high organizational and functional complexity of the agricultural sector, the variety of production, the differentiation of production conditions in respective countries and regions, as well as the complexity of economic, demographic and social processes. Recently, researchers investigating sustainability in agriculture have used many methods based on sets of indicators. However, established international standards regarding the methods of evaluating the level of sustainability with reference to agriculture are missing [21]. Latruffe et al. [17] emphasize that the assessments were not carried out in a comprehensive manner and that they took into account only the selected dimensions of sustainability. Studies concerning sustainable agriculture in the European Union were quite rare and mostly measured the sustainability level of farmsteads [22,23,24,25] or covered selected member states only [15,26,27]. The sustainability of agriculture was measured by means of various indicators, often being predominantly environmental [28]. A review of indicators used for the assessment of sustainability in agriculture according to three dimensions, i.e., environmental, economic and social ones, was performed by Latruffe et al. [17]. The review confirmed that environmental factors are quite widely elaborated on and used in practice, whereas social and economic indicators are considerably less developed. It is particularly difficult to measure social indicators because they are often qualitative and are subjectively evaluated. Thus, reference literature lacks comprehensive approaches to sustainable agriculture in the European Union, both in the context of the set of indicators and in the context of subjects. With regard to the aforesaid, this study aims to evaluate the level of sustainability in agriculture in 28 member states of the European Union, taking its three, i.e., economic, social and environmental, dimensions into account. An analysis of indicators referring to these three areas of agricultural impact and development of a synthetic measure based on them will make it possible to compare the level of sustainability of the agricultural sector between the member states to a fuller extent than only on the basis of selected partial indicators.
Table 1 lists the acronyms used in the paper, which will facilitate the interpretation of the indicators used in the study.
2. Materials and Methods
The variation in the level of sustainability in agriculture in 28 EU member states was evaluated by means of a synthetic measure designed using technique for order preference by similarity to an ideal solution (TOPSIS) [29]. The synthetic measure was based on partial indicators referring to three dimensions of sustainable growth, i.e., economic, social and environmental dimensions. The disagreement among researchers regarding the importance of respective orders of the sustainable development concepts and the fact that certain targets can be mutually exclusive leads to serious difficulties in measuring the level of sustainability of agriculture. Hence, selecting partial indicators for analyses was not an easy task. On the one hand, the choice was dictated by substantive aspects, while on the other hand the choice was dictated by the availability and comparability between the member states of the expanding European Union. The indicators were designed according to the methodology of the European Commission [30]—included in the CAP context indicators 2017. An advantage of variables selected from the Eurostat database is a uniformity of methods related to the developed indicators, and thus, a possibility to compare them between the countries covered by the study. Due to difficulties differentiating social indicators from environmental ones, they were listed in a single group, analogously to the list prepared by the European Commission (Table 2). The time frame of the study refers to the latest available data, thus most of the information refers to the year 2015 or 2016.
The values of the synthetic measure of agricultural sustainability were determined using a commonly known method at the following stages [31,32].
2.1. Selection of Line Features and Determination of the Direction of Their Preference in Relation to the Situation of Agriculture
The features describing the agricultural situation of EU countries were selected on the basis of substantive and statistical analysis, i.e., it was verified whether they were measurable, available, complete, reliable and interpretable and whether the coefficient of variation was sufficiently high. The choice of variables was made to represent two groups of indicators, i.e., socio-economic and sectorial indicators and environmental indicators. Their values formed an observation matrix consisting of n alternatives and m attributes. In order to eliminate the excessively correlated variables, an inverse matrix was established for the correlation coefficients between the assumed variables. The coefficient of variation (>15%) was used to analyze the discriminating abilities of features. Based on these tests, variables X6, X8, X10, X18 and X22 were rejected. Finally, 10 features describing socio-economic and sectorial conditions and 10 environmental indicators were adopted for the analysis, indicating stimulants and destimulants among them. For the needs of the study, all partial indicators were divided into larger-the-better characteristics (stimulants) that positively influence the assessment of the level of agricultural sustainability and smaller-the-better characteristics (destimulants), i.e., factors whose low values are desirable from the point of view of the studied phenomenon.
2.2. Unitarization of the Values of Simple Features
This process is to transform different scales and units into common measurable units to allow comparisons. The normalized evaluation matrix C can be calculated by many normalization methods to achieve the objective. In order to normalize the features, the unitarization procedure was used based on the following formulas:
where and:
2.3. Determination of the Positive Ideal and Negative Ideal Solution
The positive ideal solution indicates the most preferable alternative and the negative ideal solution indicates the least preferable alternative.
2.4. Calculation of the Separation Measure
The separation of each alternative from the positive ideal and negative ideal solution measures, using the Euclidean distance:
2.5. Determination of the Value of a Synthetic Measure
The relative closeness of the ith alternative with respect to the ideal solution is defined as:
2.6. Ranking the Preference Order
The division of units is based on the statistical criterion related to the arithmetic mean and the standard deviation from the values of the synthetic measure :
where —mean; —standard deviation.
3. Results and Discussion
For the 20 features taken into account in the study, statistical characteristics were determined, including arithmetic mean, minimum value, maximum value, standard deviation and coefficient of variation. Their values are presented in Table 3. In the period covered by the study, the highest variation was characteristic of three features, i.e., X13 (116%), X23 and X24, with variation amounting to 94%. On the other hand, the lowest variation was recorded for criteria such as X7 (25%), X17 (31%) and X14 (32%).
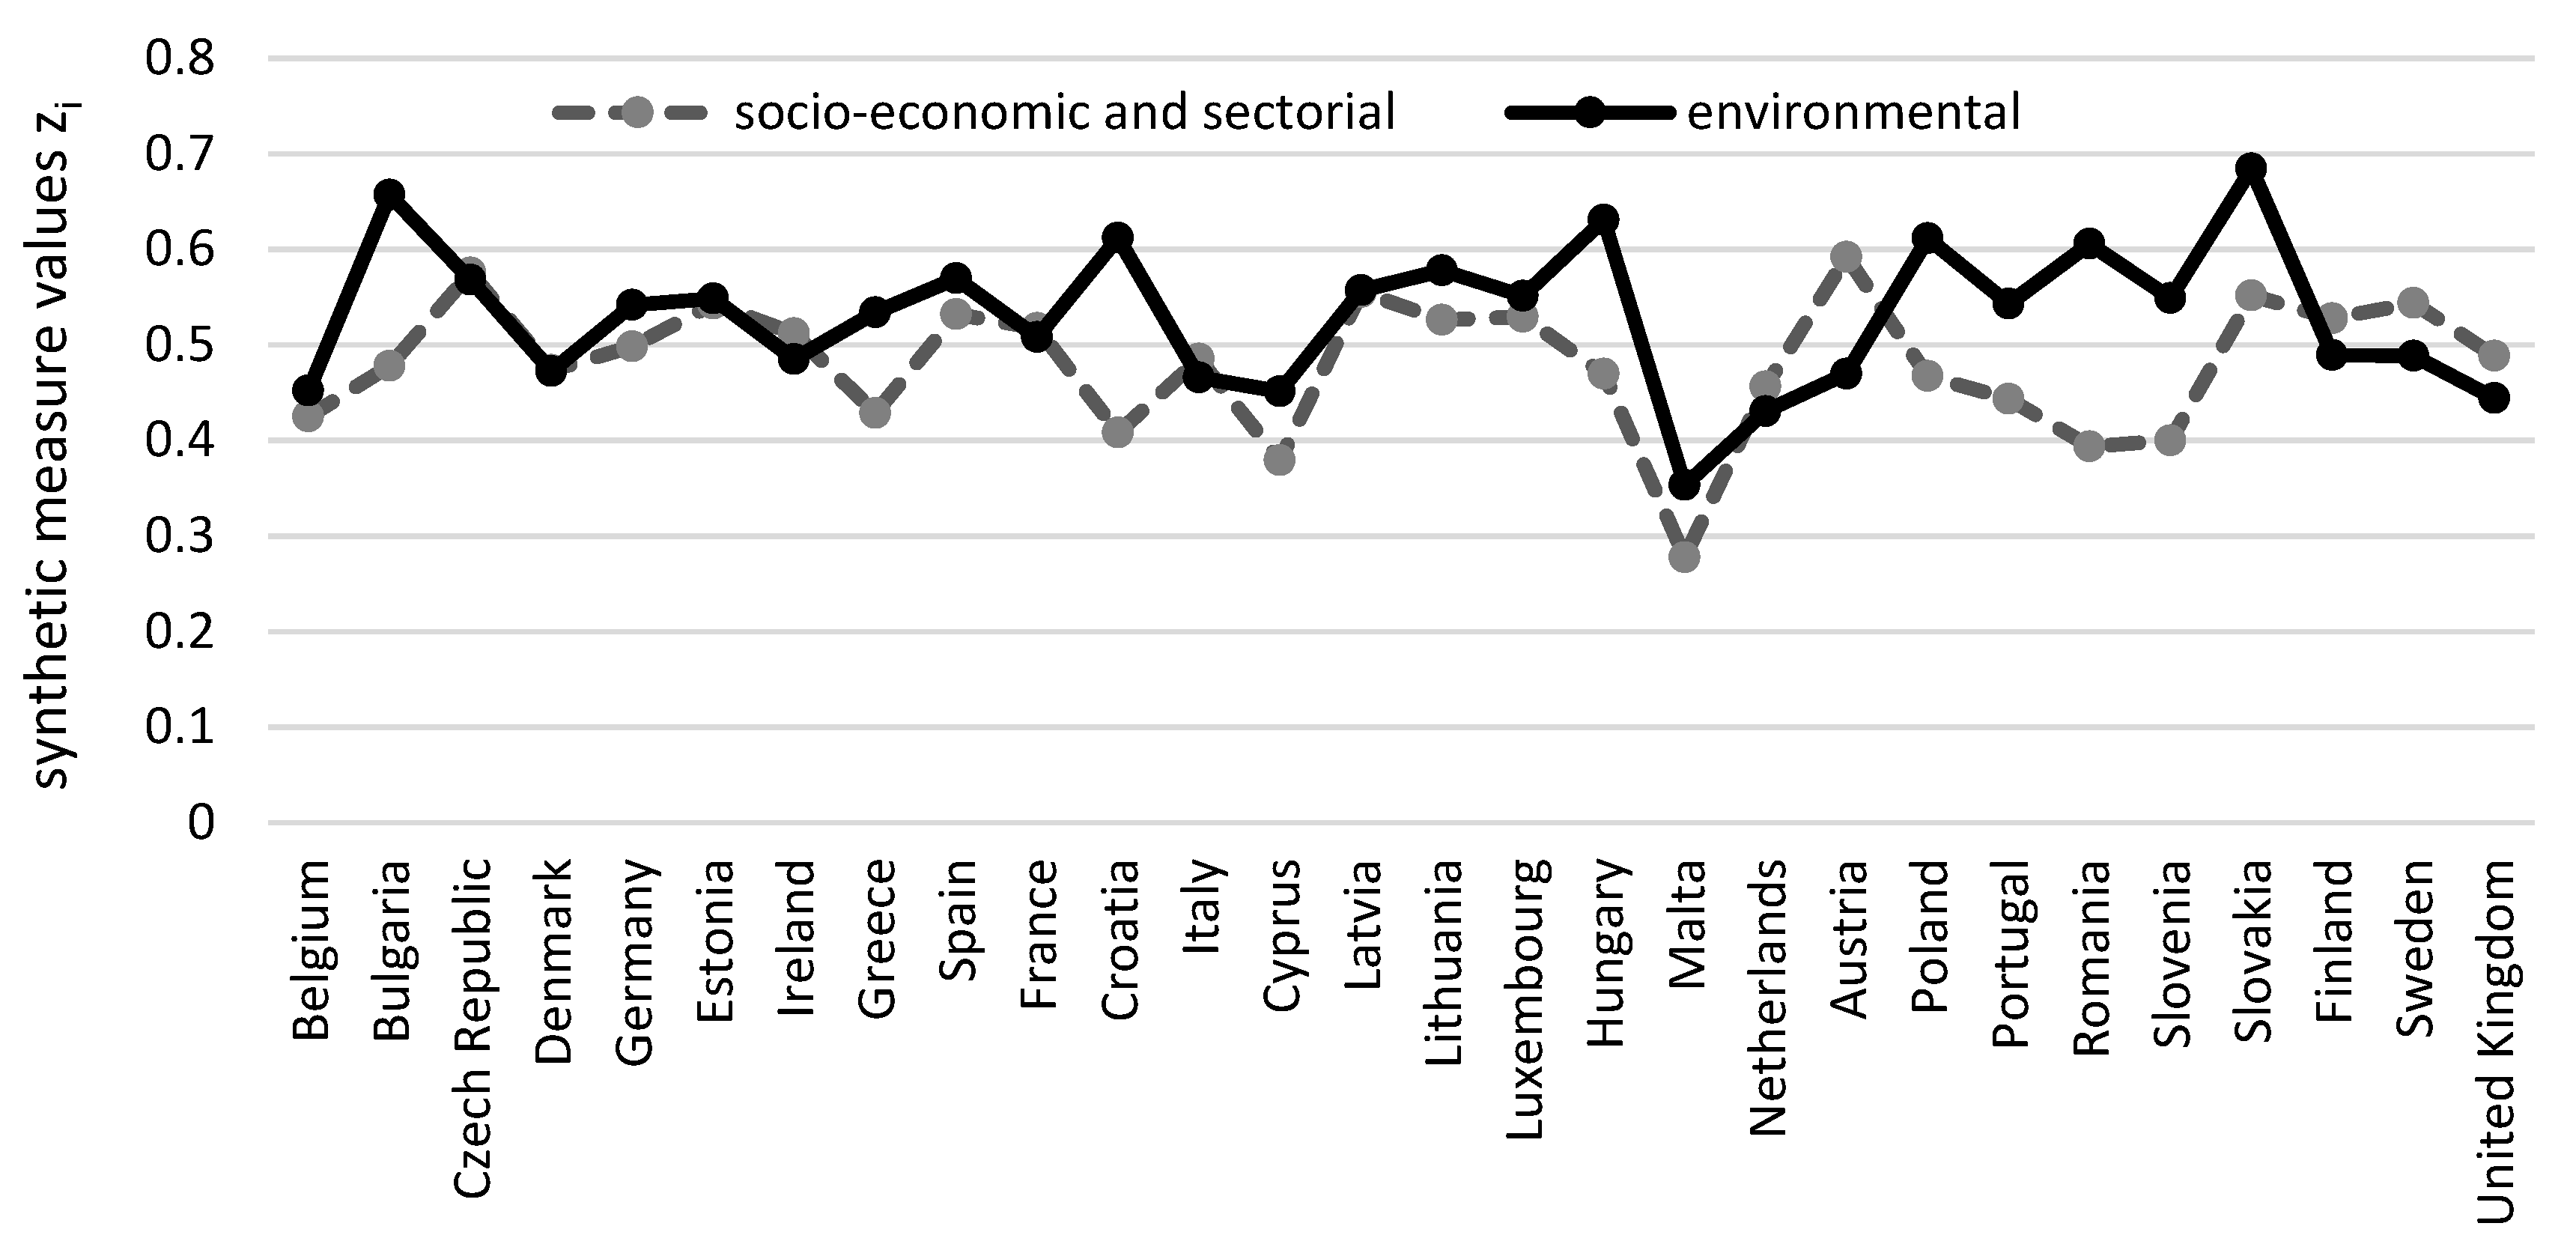
At the beginning, according to the procedure described in Section 2, synthetic measures zi were determined for socio-economic and environmental indicators separately. Based on this, Figure 1 was created, which shows that the group of countries with the highest socio-economic indicators includes Austria, the Czech Republic, Latvia and Slovakia. On the other hand, the lowest level was recorded for Croatia, Slovenia, Romania, Cyprus and Malta. The low value of the measure for the above-mentioned member states was due to a very low level of labor productivity (in particular, in the first three countries) and high workloads calculated as 100 ha UAA. Whereas, countries with the highest environmental indicator were Slovakia, Bulgaria, Hungary, Croatia and Poland, that is, new member states of the EU (so-called EU-13) characterized by a low level of production intensity. The opposite extremity was countries with intensive production, such as Belgium, the United Kingdom and The Netherlands.
All the variables used in the study made it possible to develop the synthetic measure zi, describing the level of sustainability in agriculture for respective EU member states, and to rank them with regard to the value of the measure assigning 28 EU member states to four groups (Table 4).
The first group of member states representing the highest level of sustainability in agriculture included two countries from Central and Eastern Europe, i.e., Slovakia and the Czech Republic. The high rank of Slovakian agriculture is a result of the predominant share of farms running extensive production at an average level (X17), which ranks Slovakia among the sustainability leaders in the EU. In addition, agricultural sustainability was highly evaluated thanks to a high (second) rank in terms of X7 measure and third rank in terms of variables X9 and X20. The sustainability of Slovakian agriculture was highly evaluated thanks to the low animal stocking density per 100 ha and a relatively low level of employment per 100 ha. For agriculture in the Czech Republic, the high rank in terms of sustainability was due to variable X9, on average amounting to 237.2 EUR/h worked, which ranked it first among EU member states. Like in Slovakian agriculture, in the Czech Republic the structure of crops is dominated by medium intensity of agricultural production (X17), which ranked this country third in that respect among EU member states. In addition, Czech agriculture was ranked fifth in terms of two features describing the level of sustainability in the economic and social aspect, i.e., area under organic farming (14%) and indicator A that amounted to 148.1. The environmental criterion, characterized by variable X25, production of renewable energy from agriculture (accounting for 18.1% of total production of renewable energy), also had a positive effect on the level of sustainability. In addition, like in Slovakia, in the Czech Republic a low stocking density per 100 ha amounting to 49.5 LSU per 100 ha UAA is worth noting.
The second class of countries in terms of agricultural sustainability included 14 member states, of which there are seven new ones (Bulgaria, Latvia, Lithuania, Estonia, Hungary, Poland and Croatia) and seven countries from the so-called “EU-15” (Spain, Luxembourg, Austria, Germany, Sweden, France and Finland). A relatively high level of sustainability in new EU member states is due to lower intensity and smaller concentration of production, which does not constitute such a big burden to the natural environment as is the case in countries with more developed agriculture. On the other hand, however, the realization of social and economic effects in those member states is at a considerably lower level than in the “old Union” member states. For instance, in 2016 the average labor productivity (X1) in the above-mentioned seven new member states was EUR 6435.5 per AWU, which accounted for only 33.5% of the average productivity of EU-28. On the other hand, the average value of this indicator in six old member states reached EUR 26111.5 per AWU, which accounted for 136% of the productivity of EU-28.
Class III consists of eight countries, i.e., Ireland, Portugal, Romania, Greece, Slovenia, Italy, Denmark and the United Kingdom. The highest level of sustainability in that group was recorded in Ireland. Irish agriculture was characterized by a high level of arable land per capita (X5), that is, 1.049 ha per person, which ranked Ireland first in that respect among EU member states. In turn, the agriculture of Ireland was ranked third in terms of variable X7 (158.1) and second with regard to the share of cropland in the total area of land (67.9%). A small percentage of area under organic farming (rank 26), a very low share of forest area in the country (rank 27) and a very low share of UAA under Natura 2000 (rank 24) had a negative effect on the synthetic measure expressing the level of agricultural sustainability. Furthermore, Dillon et al. [33] show that the emission of methane, being the key pollutant in the sector, is a factor that negatively affects the sustainability of Irish agriculture.
In turn, the lowest level of agricultural sustainability in that group was recorded in the United Kingdom. On the one hand, agriculture in the UK is characterized by a high level of labor productivity (X1), which amounted to EUR 32,549.76 (fifth rank among EU member states). High labor productivity is connected with a relatively low level of employment in agriculture (1.21%) and with quite a low number of workers per 100 ha of UAA (1.72 AWU/100 ha). Nevertheless, the values of the remaining criteria negatively affect the synthetic assessment of the level of sustainability of agriculture in that country. One such element is a low share of area under organic farming, accounting for only 2.8% of the total UAA and the emissions of CO2 from agricultural production (43.4 thousand tonnes), thanks to which UK ranks third among EU member states. A low evaluation of environmental criteria, such as the percentage of forest area (8.4%), the percentage of UAA under Natura 2000 (0.9%) and the percentage of forest area under Natura 2000 (6.7%), also decreases synthetic measure of agricultural sustainability in that country.
Based on the surveys, countries with the lowest level of agricultural sustainability, forming class IV, included The Netherlands, Belgium, Cyprus and Malta (Table 5). Insofar as agriculture in the latter two is of little significance among European countries and its low evaluation derives from high intensity of production, the scale of production and the significance of agriculture in The Netherlands and Belgium require that the reasons for the low level of sustainability be analyzed in depth. Dutch agriculture is a leader among EU member states in terms of labor productivity, which amounted to EUR 72,334.8 per AWU. Another advantage of the agricultural sector in that country from the point of view of sustainable agriculture is a high share of production of renewable energy from biomass production (37.8%). Nevertheless, a number of factors, mainly of environmental nature, decrease the synthetic assessment of the level of sustainability of agriculture in that country. These include the highest stocking density in the EU (357.3 LSU per 100 ha of UAA). As shown by Boss et al. [34], both the stocking density and the population density in The Netherlands are among the highest in the world. This puts the biological diversity, the environment and the landscape under strong pressure. A big environmental problem Dutch agriculture must face is a high level of CO2 emissions from agriculture and high level of water pollution with mineral fertilizers, and in particular nitrogen fertilizers. Emissions of CO2 from agriculture (X25) amounted to 10.36 tonnes of CO2 equivalent per 1 ha of UAA, which exceeds the level of emissions in most EU countries multiple times. Agriculture in Belgium was responsible for CO2 emissions of 7.53 t of CO2 equivalent per 1 ha of UAA (second rank among member states). In turn, with respect to water pollution measured based on variable X21, Dutch agriculture ranks second among the community members (150.5 kg N/ha/year). However, a positive evaluation must be given to the downward trend observed in 2004–2015 as indicated by Eurostat [35]. Moreover, it should be emphasized that apart from the above-indicated factors, one of the reasons for a low evaluation of sustainability of Dutch agriculture is a high level of agricultural production intensity (criteria X16 and X17), which is due to the limited UAA per capita (X5).
The second country with the lowest level of agricultural sustainability is Belgium, where the structure of crops includes a small percentage of areas with extensive production methods, as illustrated by low values of variables X16 (7.4%—rank 27) and X17 (18.9%—rank 26). A high level of intensity of technologies used in agriculture on the one hand is reflected in the high level of the economic indicator illustrating the efficiency of production methods in use. Labor productivity amounted to EUR 37,116.37 per AWU (rank two), indicator A reached 89.3% (rank 26) and stocking density was 274.1 LSU per 100 ha of UAA (rank three). On the other hand however, it gives rise to a number of negative consequences such as adverse changes to the natural environment, which is illustrated by high values of X21 (39 kg N/ha/year, i.e., rank four among member states) and X25 (7.53 t of CO2 equivalent per 1 ha; rank two). This is also supported by the studies carried out by Pretty [9], who emphasizes that those distressing negative consequences altered the views on how agricultural systems can enhance their efficiency both in the production of food and in reducing environmental damage.
4. Conclusions
This paper evaluates the level of sustainability in agriculture in 28 member states of the European Union using a synthetic measure developed on the basis of TOPSIS. The results of surveys point to a diversification in the level of agricultural sustainability among the member states of the European Union. The member states representing the highest level of sustainability in agriculture included two countries from Central and Eastern Europe, i.e., Czech Republic and Slovakia. The second group consisted of 14 member states, many of which (seven countries) joined the community in 2004 and later. The third group comprised eight countries, most of which represent the so-called old Union member states. The last group with the lowest level of agricultural sustainability included four countries: The Netherlands, Belgium, Cyprus and Malta.
In the context of study results it is worth emphasizing the validity of implementing the EU bioeconomy development strategy and the key role of agriculture as a participant of biosystems in accomplishing goals in the area of climate protection and energy as well as sustainable development of rural areas. Changes in the Common Agricultural Policy toolbox and in the criteria of financial grants to support agriculture and rural areas taking place in the EU after 2000 also aim at stimulating sustainable growth. However, in the opinion of Pretty [9], although in the European Union farm subsidies have increasingly been shifting toward targeted environmental outcomes rather than payments for production, this seldom guarantees synergistic benefits across whole landscapes. This gives rise to new challenges to the agricultural sector, on the one hand connected with an increase in economic effectiveness, and on the other with the accomplishment of social and environmental objectives [8]. It seems that an additional challenge is determining the desirable proportions between the accomplishment of those objectives. This is particularly significant given the complexity of the structure of agriculture in the European Union and the differentiated level of agricultural development, and thus, different levels of accomplishment of respective objectives [8]. This necessitates redesigning agricultural systems so that the optimum production results are ensured along with the change in ecological and economic conditions of production [9]. However, as emphasized by [36], sustainable development is one of the major challenges of our times that matters both at the global and local levels. Therefore, it is necessary to learn more and propagate education about sustainable development. Pretty [37] believes that this need is due to the fact that a lack of information and stewardship skills forms the main barrier to accepting the model of sustainable agriculture. The rising global attention focusing on natural environmental protection and conservation has made sustainable growth a subject of multiple scientific studies. However, with reference to agriculture, studies concerning the level of its sustainability in all EU member states have not been carried out. This justifies analyses carried out on the indicated subject, and this paper is an attempt at filling this gap. The studies should be treated as preliminary surveys that need to be continued using a wider selection of variables and other methods allowing a comprehensive assessment of sustainability in agriculture.
Author Contributions
Conceptualization, A.N. and A.K.; methodology, A.N., A.K. and M.R.-B.; software, A.N., A.K. and M.R.-B.; validation, A.N., A.K. and M.R.-B.; formal analysis, A.N., A.K. and M.R.-B.; investigation, A.N., A.K. and M.R.-B.; resources, A.N., A.K. and M.R.-B.; data curation, A.N., A.K. and M.R.-B.; Writing—Original Draft preparation, A.N., A.K. and M.R.-B.; Writing—Review and Editing, A.N., A.K. and M.R.-B.; visualization, A.N., A.K. and M.R.-B.; supervision, A.N., A.K. and M.R.-B.; project administration, A.N., A.K. and M.R.-B.; funding acquisition, A.N. and A.K.
Funding
Research supported by Poland’s Ministry of Science and Higher Education as part of the statutory activities of the Department of Economy and Agribusiness, University of Life Sciences in Lublin.
Conflicts of Interest
The authors declare no conflict of interest.
References
- Food and Agriculture Organization (FAO). Sustainable development and natural resources management. In Twenty-Fifth Conference, Paper C 89/2—Sup. 2; FAO: Rome, Italy, 1989. [Google Scholar]
- European Communities (EC). Sustainable Europe for a Better World: A European Union Strategy for Sustainable Development; 15.5.2001, COM(2001)264 final; EC: Brussels, Belgium, 2001. [Google Scholar]
- European Communities (EC). A Strategy for Smart, Sustainable and Inclusive Growth. EUROPE 2020; 3.3.2010, COM(2010) 2020 final; EC: Brussels, Belgium, 2010. [Google Scholar]
- European Communities (EC). Innovating for Sustainable Growth: A Bioeconomy for Europe; 13.2.2012 COM(2012) 60 final; EC: Brussels, Belgium, 2012. [Google Scholar]
- European Communities (EC). Horizon 2020—The Framework Programme for Research and Innovation; 30.11.2011, COM(2011) 808 final; EC: Brussels, Belgium, 2011. [Google Scholar]
- Czyżewski, A.; Czyżewski, B. Research challenges for agricultural economics in the new paradigm. In Political Rents of European Farmers in the Sustainable Development Paradigm. International, National and Regional Perspective; Czyżewski, B., Ed.; PWN: Warsaw, Poland, 2016. [Google Scholar]
- Bas-Defossez, F.; Allen, B.; Weigelt, J.; Marechal, A.; Meredith, S.; Lorant, A. Feeding Europe: Agriculture, and sustainable food systems. In Proceedings of the Policy Paper produced for the IEEP Think 2030 Conference, Brussels, Belgium, 17–18 October 2018. [Google Scholar]
- Pretty, J. Agricultural sustainability: Concepts, principles and evidence. Philos. Trans. R. Soc. B Biol. Sci. 2008, 363, 447–465. [Google Scholar] [CrossRef] [PubMed] [Green Version]
- Pretty, J. Intensification for redesigned and sustainable agricultural systems. Science 2018, 362, eaav0294. [Google Scholar] [CrossRef] [PubMed] [Green Version]
- de Fazio, M. Agriculture and sustainability of the welfare: The role of the short supply chain. Agric. Agric. Sci. Procedia 2016, 8, 461–466. [Google Scholar] [CrossRef] [Green Version]
- Longo, P. Food justice and sustainability: A new revolution. Agric. Agric. Sci. Procedia 2016, 8, 31–36. [Google Scholar] [CrossRef] [Green Version]
- FAO. The State of the World’s Land and Water Resources for Food and Agriculture. Managing Systems at Risk; Food and Agriculture Organization of the United Nations: Rome, Italy, 2011; Available online: http://www.fao.org/nr/solaw/solaw-home/en/ (accessed on 20 September 2019).
- FAO. Sustainability Assessment of Food and Agriculture Systems. Guidelines; FAO: Rome, Italy, 2012. [Google Scholar]
- Radulescu, C.V.; Ioan, I. Sustainable development of Romanian agriculture within the context of European Union’s requirements. USV Ann. Econ. Public Adm. 2015, 15, 57–62. [Google Scholar]
- Mollavelioglu, S.; Mihci, H.; Cağatay, S.; Ulucan, A. Assessment of sustainability of the European Union and Turkish agricultural sectors. New Medit 2010, 9, 13–21. [Google Scholar]
- Foley, J.A.; DeFries, R.; Asner, G.P.; Barford, C.; Bonan, G.; Carpenter, S.R.; Chapin, F.S.; Coe, M.T.; Daily, G.C.; Gibbs, H.K.; et al. Global consequences of land use. Science 2005, 309, 570–574. [Google Scholar] [CrossRef] [PubMed] [Green Version]
- Latruffe, L.; Diazabakana, A.; Bockstaller, C.; Desjeux, Y.; Finn, J.; Kelly, E.; Ryan, M.; Uthes, S. Measurement of sustainability in agriculture: A review of indicators. Stud. Agric. Econ. 2016, 118, 123–130. [Google Scholar] [CrossRef]
- Velten, S.; Leventon, J.; Jager, N.; Newig, J. What is sustainable agriculture? A Systematic Review. Sustainability 2015, 7, 7833–7865. [Google Scholar] [CrossRef] [Green Version]
- Hayati, D.; Ranjbar, Z.; Karami, E. Measuring agricultural sustainability. In Biodiversity, Biofuels, Agroforestry and Conservation Agriculture; Lichtfouse, E., Ed.; Sustainable Agriculture Reviews 5; Springer Science+Business Media B.V.: Heidelber, Germany; London, UK; New York, NY, USA, 2010. [Google Scholar]
- Gennari, P.; Navarro, D.K. The challenge of measuring agricultural sustainability in all its dimensions. J. Sustain. Res. 2019, 1, e190013. [Google Scholar] [CrossRef]
- Schindler, J.; Graef, F.; König, H.J. Methods to assess farming sustainability in developing countries. A review. Agron. Sustain. Dev. 2015, 35, 1043–1057. [Google Scholar] [CrossRef] [Green Version]
- Gatzweiler, F.W.; Judis, R.; Hagedorn, K. Sustainable Agriculture in Central and Eastern European Countries; Shaker Verlag: Aachen, Germany, 2002. [Google Scholar]
- Darnhofer, I.; Fairweather, J.; Moller, H. Assessing a farm’s sustainability: Insights from resilience thinking. Int. J. Agric. Sustain. 2010, 8, 186–198. [Google Scholar] [CrossRef]
- Majewski, E. Measuring and modelling farm level sustainability. Visegr. J. Bioecon. Sustain. Dev. 2013, 2, 2–10. [Google Scholar] [CrossRef]
- Gaviglio, A.; Bertocchi, M.; Demartini, E. A tool for the sustainability assessment of farms: Selection, adaptation and use of indicators for an Italian case study. Resources 2017, 6, 60. [Google Scholar] [CrossRef]
- Öhlund, E.; Zurek, K.; Hammer, M. Towards sustainable agriculture? The EU framework and local adaptation in Sweden and Poland. Environ. Policy Gov. 2015, 25, 270–287. [Google Scholar] [CrossRef]
- Mili, S.; Martínez-Vega, J. Accounting for regional heterogeneity of agricultural sustainability in Spain. Sustainability 2019, 11, 299. [Google Scholar] [CrossRef] [Green Version]
- Reytar, K.; Hanson, C.; Hennin, N. Indicators of Sustainable Agriculture: A Scoping Analysis; Working Paper 2014; The World Resources Institute: Washington, DC, USA, 2014. [Google Scholar]
- Hwang, C.L.; Yoon, K. Multiple Attribute Decision Making; Lecture Notes in Economics and Mathematical Systems 186; Springer: New York, NY, USA, 1981; pp. 58–191. [Google Scholar]
- European Commision. CAP Context Indicators 2017. Available online: https://ec.europa.eu/agriculture/cap-indicators/context/2017_en (accessed on 30 June 2018).
- Aryanezhad, B.; Tarokh, M.J.; Mokhtarian, M.N.; Zaheri, F. A fuzzy TOPSIS method based on left and right scores. Int. J. Ind. Eng. Prod. Res. 2011, 22, 51–62. [Google Scholar]
- Wysocki, F. The application of the TOPSIS method for estimation of regional diversity of the dairy sector development level. Wiadomości Stat. 2008, 1, 38–49. [Google Scholar]
- Dillon, E.J.; Hennessy, T.; Hynes, S. Assessing the sustainability of Irish agriculture. In Proceedings of the Conference on Integrated Assessment of Agriculture and Sustainable Development: Setting the Agenda for Science and Policy (AgSAP 2009), Egmond aan Zee, The Netherlands, 10–12 March 2009; van Ittersum, M.K., Wolf, J., van Laar, H.H., Eds.; Wageningen University and Research Centre: Wageningen, The Netherlands, 2009. [Google Scholar]
- Boss, J.F.F.P.; Smit, A.B.L.; Schröder, J.J. Is agricultural intensification in The Netherlands running up to its limits? Wagening. J. Life Sci. 2013, 66, 65–73. [Google Scholar] [CrossRef] [Green Version]
- Eurostat. Agri-Environmental Indicator—Gross Nitrogen Balance, Statistics Explained. 2018. Available online: http://ec.europa.eu/eurostat/statisticsexplained/ (accessed on 25 May 2018).
- Foley, H. Understanding Sustainability from a Global Perspective: Exploring the Role of Education for Sustainable Development within Contemporary Education in Ireland. Ph.D. Thesis, University College Cork, Cork, Ireland, 2017. [Google Scholar]
- Pretty, J. Overview to four volumes: Sustainable agriculture and food. In Earthscan Reference Collection: Sustainable Agriculture and Food; Pretty, J., Ed.; Earthscan: London, UK, 2008; Volume 1. [Google Scholar]
Figure 1.
Synthetic measure values zi expressing the socio-economic, sectorial and environmental conditions of EU member states.
Figure 1.
Synthetic measure values zi expressing the socio-economic, sectorial and environmental conditions of EU member states.


Table 1.
Explanation of the acronyms used in the paper.
| Acronyms | Explanation |
|---|---|
| EU | European Union |
| FAO | Food and Agriculture Organization of the United Nations |
| CAP | Common Agricultural Policy |
| GVA | Gross value added |
| AWU | Annual work unit |
| UAA | Utilized agricultural area |
| LSU | Livestock unit |
| TFP | Total factor productivity |
| GFCF | Gross fixed capital formation |
Table 2.
Set of variables used for constructing the agricultural sustainability index.
| Variable | Indicators |
|---|---|
| Socio-economic and sectorial indicators | |
| X1 | Labor productivity in agriculture (GVA/Employed persons in agriculture (full-time equivalent AWU)) |
| X2 | Area under organic farming (% of total UAA) |
| X3 | Livestock units per 100 ha UAA (LSU per 100 UAA) |
| X4 | Ratio young/elderly managers (Less than 35 years/55 years and over)—number of young managers by 100 elderly managers |
| X5 | UAA per 1 inhabitant (ha/1 person) |
| X6 | Agricultural factor income per AWU in real terms |
| X7 | Indicator A: Index of the real income of factors in agriculture per annual work unit (2010 = 100) |
| X8 | Agricultural entrepreneurial income (net agricultural entrepreneurial income in real terms) per unpaid (nonsalaried) annual work unit |
| X9 | Income per family worker compared to the wages of employees in the whole economy (based on EUR/h worked) |
| X10 | Total factor productivity (TFP) compares total outputs relative to the total inputs used in production of the output (both output and inputs are expressed in term of volumes) |
| X11 | Gross fixed capital formation in agriculture (investments in assets which are used repeatedly or continuously over a number of years to produce goods in agriculture)—% of GVA in agriculture (GFCF/GVA in agriculture) |
| X12 | % of employment in primary sector (branch A—agriculture, forestry and fishing) |
| X13 | Employed persons in agriculture (full-time equivalent AWU) per 100 ha UAA—AWU/100 ha UAA |
| Environmental indicators | |
| X14 | Agricultural area (% of total area) |
| X15 | Forest area (% of total area) |
| X16 | Areas of extensive agriculture UAA managed by farms with low input intensity per ha |
| X17 | Areas of extensive agriculture UAA managed by farms with medium input intensity per ha |
| X18 | Areas of extensive agriculture UAA managed by farms with high input intensity per ha |
| X19 | Agricultural area UAA under Natura 2000 (% of territory) |
| X20 | Forest area under Natura 2000 (% of territory) |
| X21 | Water quality (gross nutrient balance 4-year avg. (potential surplus of nitrogen on agricultural land (kg N/ha/year))) |
| X22 | Soil organic matter (total estimates of organic carbon content in arable land) |
| X23 | Soil erosion by water (tonnes/ha/year) |
| X24 | Production of renewable energy from agriculture (% of total production of renewable energy) |
| X25 | Emissions from agriculture (t of CO2 equivalent per 1 ha UAA) |
Table 3.
Characteristics of the diagnostic variables describing the agricultural sustainability of EU member states.
Table 3.
Characteristics of the diagnostic variables describing the agricultural sustainability of EU member states.
| Variable | Mean | Minimum | Maximum | Standard Deviation | Coefficient of Variation (%) |
|---|---|---|---|---|---|
| X1 | 19,194.23 | 4277.38 | 72,334.88 | 15,161.55 | 79 |
| Poland | The Netherlands | ||||
| X2 | 7.77 | 0.21 | 21.25 | 5.45 | 70 |
| Malta | Austria | ||||
| X3 | 97.03 | 22.00 | 357.30 | 86.82 | 89 |
| Bulgaria | The Netherlands | ||||
| X4 | 12.35 | 2.40 | 38.90 | 8.98 | 73 |
| Cyprus | Austria | ||||
| X5 | 0.42 | 0.03 | 1.05 | 0.26 | 64 |
| Malta | Ireland | ||||
| X7 | 122.06 | 65.30 | 205.50 | 30.55 | 25 |
| Finland | Bulgaria | ||||
| X9 | 61.88 | −9.23 | 237.19 | 50.03 | 81 |
| Denmark | Czech Republic | ||||
| X11 | 41.67 | 3.33 | 99.13 | 23.83 | 57 |
| Cyprus | Luxembourg | ||||
| X12 | 5.76 | 0.88 | 24.02 | 5.27 | 92 |
| Luxembourg | Romania | ||||
| X13 | 7.73 | 1.73 | 46.32 | 9.00 | 116 |
| United Kingdom | Malta | ||||
| X14 | 49.01 | 8.55 | 76.05 | 15.64 | 32 |
| Finland | Denmark | ||||
| X15 | 28.75 | 0.66 | 61.74 | 15.82 | 55 |
| Malta | Finland | ||||
| X16 | 38.59 | 4.10 | 78.60 | 18.95 | 49 |
| The Netherlands | Portugal | ||||
| X17 | 30.44 | 7.20 | 49.80 | 9.51 | 31 |
| The Netherlands | Slovakia | ||||
| X19 | 9.61 | 0.70 | 22.30 | 6.41 | 67 |
| Finland | Croatia | ||||
| X20 | 30.01 | 6.70 | 57.00 | 14.17 | 47 |
| United Kingdom | Cyprus | ||||
| X21 | 65.38 | 2.00 | 189.00 | 45.61 | 70 |
| Romania | Cyprus | ||||
| X23 | 2.45 | 0.05 | 8.35 | 2.30 | 94 |
| Finland | Italy | ||||
| X24 | 9.56 | 0.00 | 37.80 | 9.03 | 94 |
| Estonia | The Netherlands | ||||
| X25 | 3.04 | 1.26 | 10.36 | 2.13 | 70 |
| Bulgaria | The Netherlands |
Table 4.
Value of synthesis measure of agricultural sustainability according to four classes.
| Classes | |
|---|---|
| Class I | |
| Class II | 0.5044 |
| Class III | |
| Class IV |
Table 5.
Classification of EU countries according to the value of synthetic measure describing the level of agricultural sustainability.
Table 5.
Classification of EU countries according to the value of synthetic measure describing the level of agricultural sustainability.
| No. | Country | Value of the Synthetic Measure (zi) | Class |
|---|---|---|---|
| 1 | Slovakia | 0.6105 | I |
| 2 | Czech Republic | 0.5721 | |
| 3 | Bulgaria | 0.5589 | II |
| 4 | Latvia | 0.5563 | |
| 5 | Lithuania | 0.5511 | |
| 6 | Spain | 0.5499 | |
| 7 | Estonia | 0.5458 | |
| 8 | Hungary | 0.5452 | |
| 9 | Luxembourg | 0.5391 | |
| 10 | Austria | 0.5340 | |
| 11 | Poland | 0.5330 | |
| 12 | Germany | 0.5187 | |
| 13 | Sweden | 0.5140 | |
| 14 | France | 0.5129 | |
| 15 | Finland | 0.5079 | |
| 16 | Croatia | 0.5072 | |
| 17 | Ireland | 0.4987 | III |
| 18 | Portugal | 0.4950 | |
| 19 | Romania | 0.4932 | |
| 20 | Greece | 0.4790 | |
| 21 | Slovenia | 0.4775 | |
| 22 | Italy | 0.4760 | |
| 23 | Denmark | 0.4729 | |
| 24 | United Kingdom | 0.4665 | |
| 25 | The Netherlands | 0.4430 | IV |
| 26 | Belgium | 0.4378 | |
| 27 | Cyprus | 0.4149 | |
| 28 | Malta | 0.3120 |
© 2019 by the authors. Licensee MDPI, Basel, Switzerland. This article is an open access article distributed under the terms and conditions of the Creative Commons Attribution (CC BY) license (http://creativecommons.org/licenses/by/4.0/).
Share and Cite
MDPI and ACS Style
Nowak, A.; Krukowski, A.; Różańska-Boczula, M. Assessment of Sustainability in Agriculture of the European Union Countries. Agronomy 2019, 9, 890. https://0-doi-org.brum.beds.ac.uk/10.3390/agronomy9120890
AMA Style
Nowak A, Krukowski A, Różańska-Boczula M. Assessment of Sustainability in Agriculture of the European Union Countries. Agronomy. 2019; 9(12):890. https://0-doi-org.brum.beds.ac.uk/10.3390/agronomy9120890
Chicago/Turabian StyleNowak, Anna, Artur Krukowski, and Monika Różańska-Boczula. 2019. "Assessment of Sustainability in Agriculture of the European Union Countries" Agronomy 9, no. 12: 890. https://0-doi-org.brum.beds.ac.uk/10.3390/agronomy9120890
Note that from the first issue of 2016, this journal uses article numbers instead of page numbers. See further details here.