Article

To Stop Nitrogen Overdose in Soilless Tomato Crop: A Way to Promote Fruit Quality without Affecting Fruit Yield

1
CTIFL, Centre Technique Interprofessionnel des Fruits et Légumes (CTIFL), Centre de Carquefou, ZI Belle Etoile—Antarès, 35 allée des Sapins, 44483 Carquefou CEDEX, France
2
INRA, Institut National de Recherche Agronomique, UR-1115, Plantes et Systèmes de culture Horticoles, centre PACA, Domaine Saint Paul, 84914 Avignon CEDEX, France
*
Authors to whom correspondence should be addressed.
Submission received: 20 December 2018 / Revised: 5 February 2019 / Accepted: 9 February 2019 / Published: 12 February 2019
(This article belongs to the Collection Nutrition Management of Hydroponic Vegetable Crops)

Abstract

:
Precision horticulture is fundamental to ensure high quality production with a minimal environmental footprint. It offers the possibility to manage climatic and fertilization inputs closer to the plant needs. In practice, there is a tendency to over-fertilize, as nitrogen limitation can decrease photosynthesis and consequently fruit yield, but also because nutrient recycling does not lead to any substantial costs increase, thus ignoring the influence of nitrogen input on the balance between growth and metabolism. Nitrogen recommendation for tomato greenhouse production on rockwool is 16mM, even it is well established that only 50% of nitrogen amount is really absorbed by plants. This study compares the usual practice (16 mM) to a nitrogen supply to meet plant’s needs (5 mM). We analyzed plant growth and development, yield, leaf photosynthetic activity and fruit quality (sugars, acids, vitamin C,) over the entire crop period (December to October). Over-fertilization favoured the accumulation of nitrogen in leaves and stem but yield, leaf photosynthetic activity and plant architecture were not significantly improved. In addition, it decreased the quality of the tomatoes as the sugar:acid ratio decreased dramatically in the pericarp, whereas the locular gel composition remained similar. A reduction of the nitrogen supply is one solution to improve tomato quality without any reduction of yield in greenhouse. These data have to be incorporated in tomato fertigation management to define a new standard based on overall quality of tomato fruit and low environmental footprint.

1. Introduction

Horticulture is facing new challenges linked to climate change combined with societal expectations on environmental impact and quality of products. Greenhouse horticulture is spreading widely all over the world as a solution to meet with these expectations. Most of the land available for food production is actually already being cultivated, innovative strategies or techniques that increase yields, improve quality, control energy consumption and reduce the ecological footprint have to be integrated in the greenhouse sector. In particular, Northern countries settled on soilless production systems in heated glasshouses, increasing performance and competitiveness, but the profitability depends mainly on the good management of greenhouse inputs (energy, water, nutrients, CO2, labor). In this context, greenhouse management has to be finely tuned to meet real-time plant requirements.
To improve the durability of greenhouses, both economically and environmentally, climate management has been intensively studied [1,2]. It must take into account climatic parameters (inside and outside) and equipment’s of the greenhouse which are diverse and complex to manage (semi-closed greenhouse, [3]). As for fertigation management, few models are adapted to soilless crops. We proposed here a focus on nitrogen management for soilless tomato (Solanum lycopersicum) crop.
Nitrogen, as others nutrients, is provided to plant using fertigation in soilless crops. It consists of dissolving the fertilizer in the irrigation water, then delivering it to the root zone through drippers. Nitrogen leaching in the environment is highly damaging (release of greenhouses gases, eutrophication, and contamination of aquifers) and closely monitored by European laws [4]. High-tech soilless greenhouses recirculate water and nutrients: the whole system is close, such as no leak into the environment is possible [5]. Unfortunately, this precious advantage led to a tendency to over-fertilize soilless crops so that no nutrient deficiency occurs. In practice for soilless tomatoes, fertigation is managed in dependency to the drainage percentage, drainage electric conductivity and pH, with objectives in the drainage respectively 30%, EC = 3–4 dS m−1 and pH = 5–5.8 [6]. Nutrient recipes for tomato plant have been empirically identified by Hoagland [7], and more recently by De Kreij et al., [8]. Nutrient recipes are adapted to the developmental stage of the plant and differ from the start to flowering, flowering to the first truss, then to the fifth and tenth trusses. The reason is related to variability between organ needs characterizing fruiting stage or vegetative stage. Nowadays, nitrogen recommendation [8,9] for tomato greenhouse production on rockwool is 13–16 mM (depending on the growth stage). Turcotte et al., [10] estimated that for 60 kg m−2 harvested in one hectare greenhouse, growers need 1800 kg of nitrogen. It is well established that only 50% of the nitrogen amount provided to crops is really absorbed in the actual system [11,12]. Few improvements have been suggested mainly due to the fact that nutrient recipe is neutralized (in terms of equilibrium between anions and cations) using NO3 [13]. Except from adjustments of EC (which may also lead to yield decrease, [10]), fertilization recipes optimized for fruit quality has not been intensively studied; old recipes are mainly used based on growers’ experiences [14]. Worldwide, tomato is one of the most important crops, and its consumption is still rising. A total of 18.2 millions of tons were produced in 2017 on 4.8 Mill. Ha (http://faostat3.fao.org/home/E). However, improving tomato fruit quality is a pending topic as the demand for premium quality is strong, especially in Europe. Tomato fruit quality depends on external (color, form and size) and internal (sugars, acids, aroma, carotenoids, vitamin C, minerals) indicators that affect attractiveness, texture, taste and nutritional quality. Tomato is a model plant for fleshy fruits, especially for fruit quality studies [15]. Tomato fruits are 95% water while the other 5% contains sugars (mainly glucose and fructose, in equimolar ratio [16]), acids (malic acid and citric acid), cell wall components and secondary metabolites. The perception of fruit acidity is mainly due to citric acid. It is widely accepted that the sugar:acid ratio is a good indicator of taste for consumers [17]. It seems largely admitted that locular gel (inner tissue) of tomato fruit is particularly rich in acids, but no study has been carried out to highlight its biochemical evolution during ripening, nor the influence of the environment on this particular tissue. Tomato is also rich in carotenoids (lycopene and beta-carotene [16]) and vitamin C [18]. In addition to genetic variability [19], cultural techniques and environmental conditions may affect fruit quality [20]. In particular, there is a need to improve fertigation management with regard to fruit quality. Water management can affect fruit quality, notably through water deficit management [21], but such an approach can be difficult to transfer to tomato growers. Indeed, the timing of the water deficit has different impacts on the plant, and more importantly, the impacts of the water deficit differ according to the stage of fruit development [22]. Since greenhouse tomato plants are indeterminate with different stages of fruit development at the same time on an individual plant (cultivation period is 10 months), it may be difficult to adopt a water deficit in practice without any adverse effect on a stage or on crop performance [23,24,25]. Fertilization management might be one valuable option to achieve better fruit quality in greenhouse [26]. Primarily, nitrogen is a key element for yield establishment and crop quality [27]. Previous work by Bénard et al., [9] focused on the impact of nitrogen reduction in the nutrient recipes provided to tomato plants. The authors showed that the marketable yield was not affected by a nitrogen supply divided by three (12 to 4 mM of NO3 ). The reduction in nitrogen resulted in a reduction in leaf area, which led to an increase in radiation capture by ripening fruits. In addition to a specific effect on primary metabolism [9], the reduction in nitrogen supply led to an improvement in fruit quality. Apart from this study, few others were carried out in greenhouses (equipment’s and management) comparable with growers’. However, results obtained showed the same trend: lowering nitrogen supply leads to an improvement in organoleptic and/or nutritional quality. Parisi et al., [28] showed that sugar content and sugar:acid ratio in processing tomatoes were reduced with high rates (up to 250 kg ha−1) of nitrogen supply without any improvement of marketable yield. Zhang et al., [29] and Wang et al., [25] drew similar conclusions with a particular focus on vitamin C and minerals that were also negatively correlated to the amount of nitrogen provided. Thus, it is admitted that plant metabolism shifts from carbon containing compounds (sugars, acids, vitamin C) to nitrogen containing compounds (proteins) as a function of nitrogen supply [30].
Precision horticulture makes it possible to fine-tune the climate and fertigation according to the plant’s needs in order to achieve high yield and quality objectives. Previous work has shown that there is a lack of references to know to what extent nitrogen supply can be reduced without leading to a decrease in fruit yield. Our working hypothesis was that it was possible to reduce inputs without negative impact on fruit production and quality and that this would reduce nitrogen leakage into the environment. To confirm this hypothesis, we aimed to refine the nitrogen supply recommendations for soilless tomato crops based on the actual needs of the plants. Our objectives were to verify on a long-term experiment that a 3-fold reduction in nitrogen input had no impact on plant growth and performance. Results included distribution of leaf photosynthetic activity according to plant architecture, dry mass and nitrogen distribution and fruit quality. This is the first study to analyze the quality of tomato pericarp and locular gel and their impact on overall quality.

2. Results

2.1. Nitrogen Supply Effects on Tomato Plant Growth and Architecture

The plant architecture measurements are presented in Table 1. Tomato stem growth reached 25.7 cm per week and showed no significant difference between treatments. Cumulative growth over crop period was about 11 meters, whatever the nitrogen treatment (data not shown). Nitrogen supply did not change the stem diameter, the distance between the apex of the plant and the first flowering truss or the number of leaves per plant (data not shown). Leaf length and width were significantly higher under high nitrogen supply for replicate 1, not for replicate 2. The leaf growth rate (assessed by length measurements) from juvenile to deleafing did not show a clear trend (Table S3) and only measurements 4 and 5 (carried out in July and August) showed some differences between nitrogen treatments (N− showing a lower leaf growth rate).

2.2. Distribution of the Photosynthetic Activity Throughout Plant Architecture and Impact of Nitrogen Treatments

Figure 1a highlights the higher potential photosynthetic activity of young leaves at the top of the plant compared to lower leaves. Potential photosynthetic activity strongly decreased after leaf number 11 (counting from the top) to reach a minimal photosynthetic activity for the lower leaves. The upper leaves were characterized by a high potential for photosynthetic activity (up to 36.5 µmol CO2 m−2 s−1) and the lower leaves by a low potential (down to 9.0 µmol CO2 m−2 s−1). Figure 1b shows the potential photosynthetic activity expressed per leaf according to the individual leaf area. We noticed that the young fully developed leaves accounted for a larger share of the plant’s total photosynthetic activity (leaves 9 to 11). Consequently, to compare the effect of nitrogen on the plant physiological status, we decided to focus on the net photosynthetic activity of a single leaf, number 10 (Table 1).
We noticed a not significant decrease of the net photosynthetic activity under high nitrogen supply (averaging 17.8 µmol CO2 m−2 s−1) in comparison to low nitrogen supply (averaging 20.8 µmol CO2 m−2 s−1).

2.3. Influence of Nitrogen Supply on the Yield of a Soilless Tomato Crops

Table 2 shows the agronomic performance of tomato crops as a function of nitrogen supply. At the end of the test (week 42), the total fruit yield reached 49.8 and 48.7 kg m−2 respectively for the control treatments R1N+ and R2N+, which is similar to values obtained in comparable greenhouses of grower’s.
A lower nitrogen supply had no significant effect on total fruit yield and reached 47.1 and 46.8 kg m−2 for R1N− and R2N− respectively. The number of marketable fruits was not different from one treatment to another, unlike unmarketable fruits whose number increased under high nitrogen supply (significantly different for Replicate 2, a trend for Replicate 1). Average fruit mass of marketable fruits was higher under high nitrogen supply compared to low nitrogen supply (on average +4.5 g in R1 (significant difference); +1.6 g in R2). It is worth noticing that R1 and R2 only differ in terms of average fruit mass.

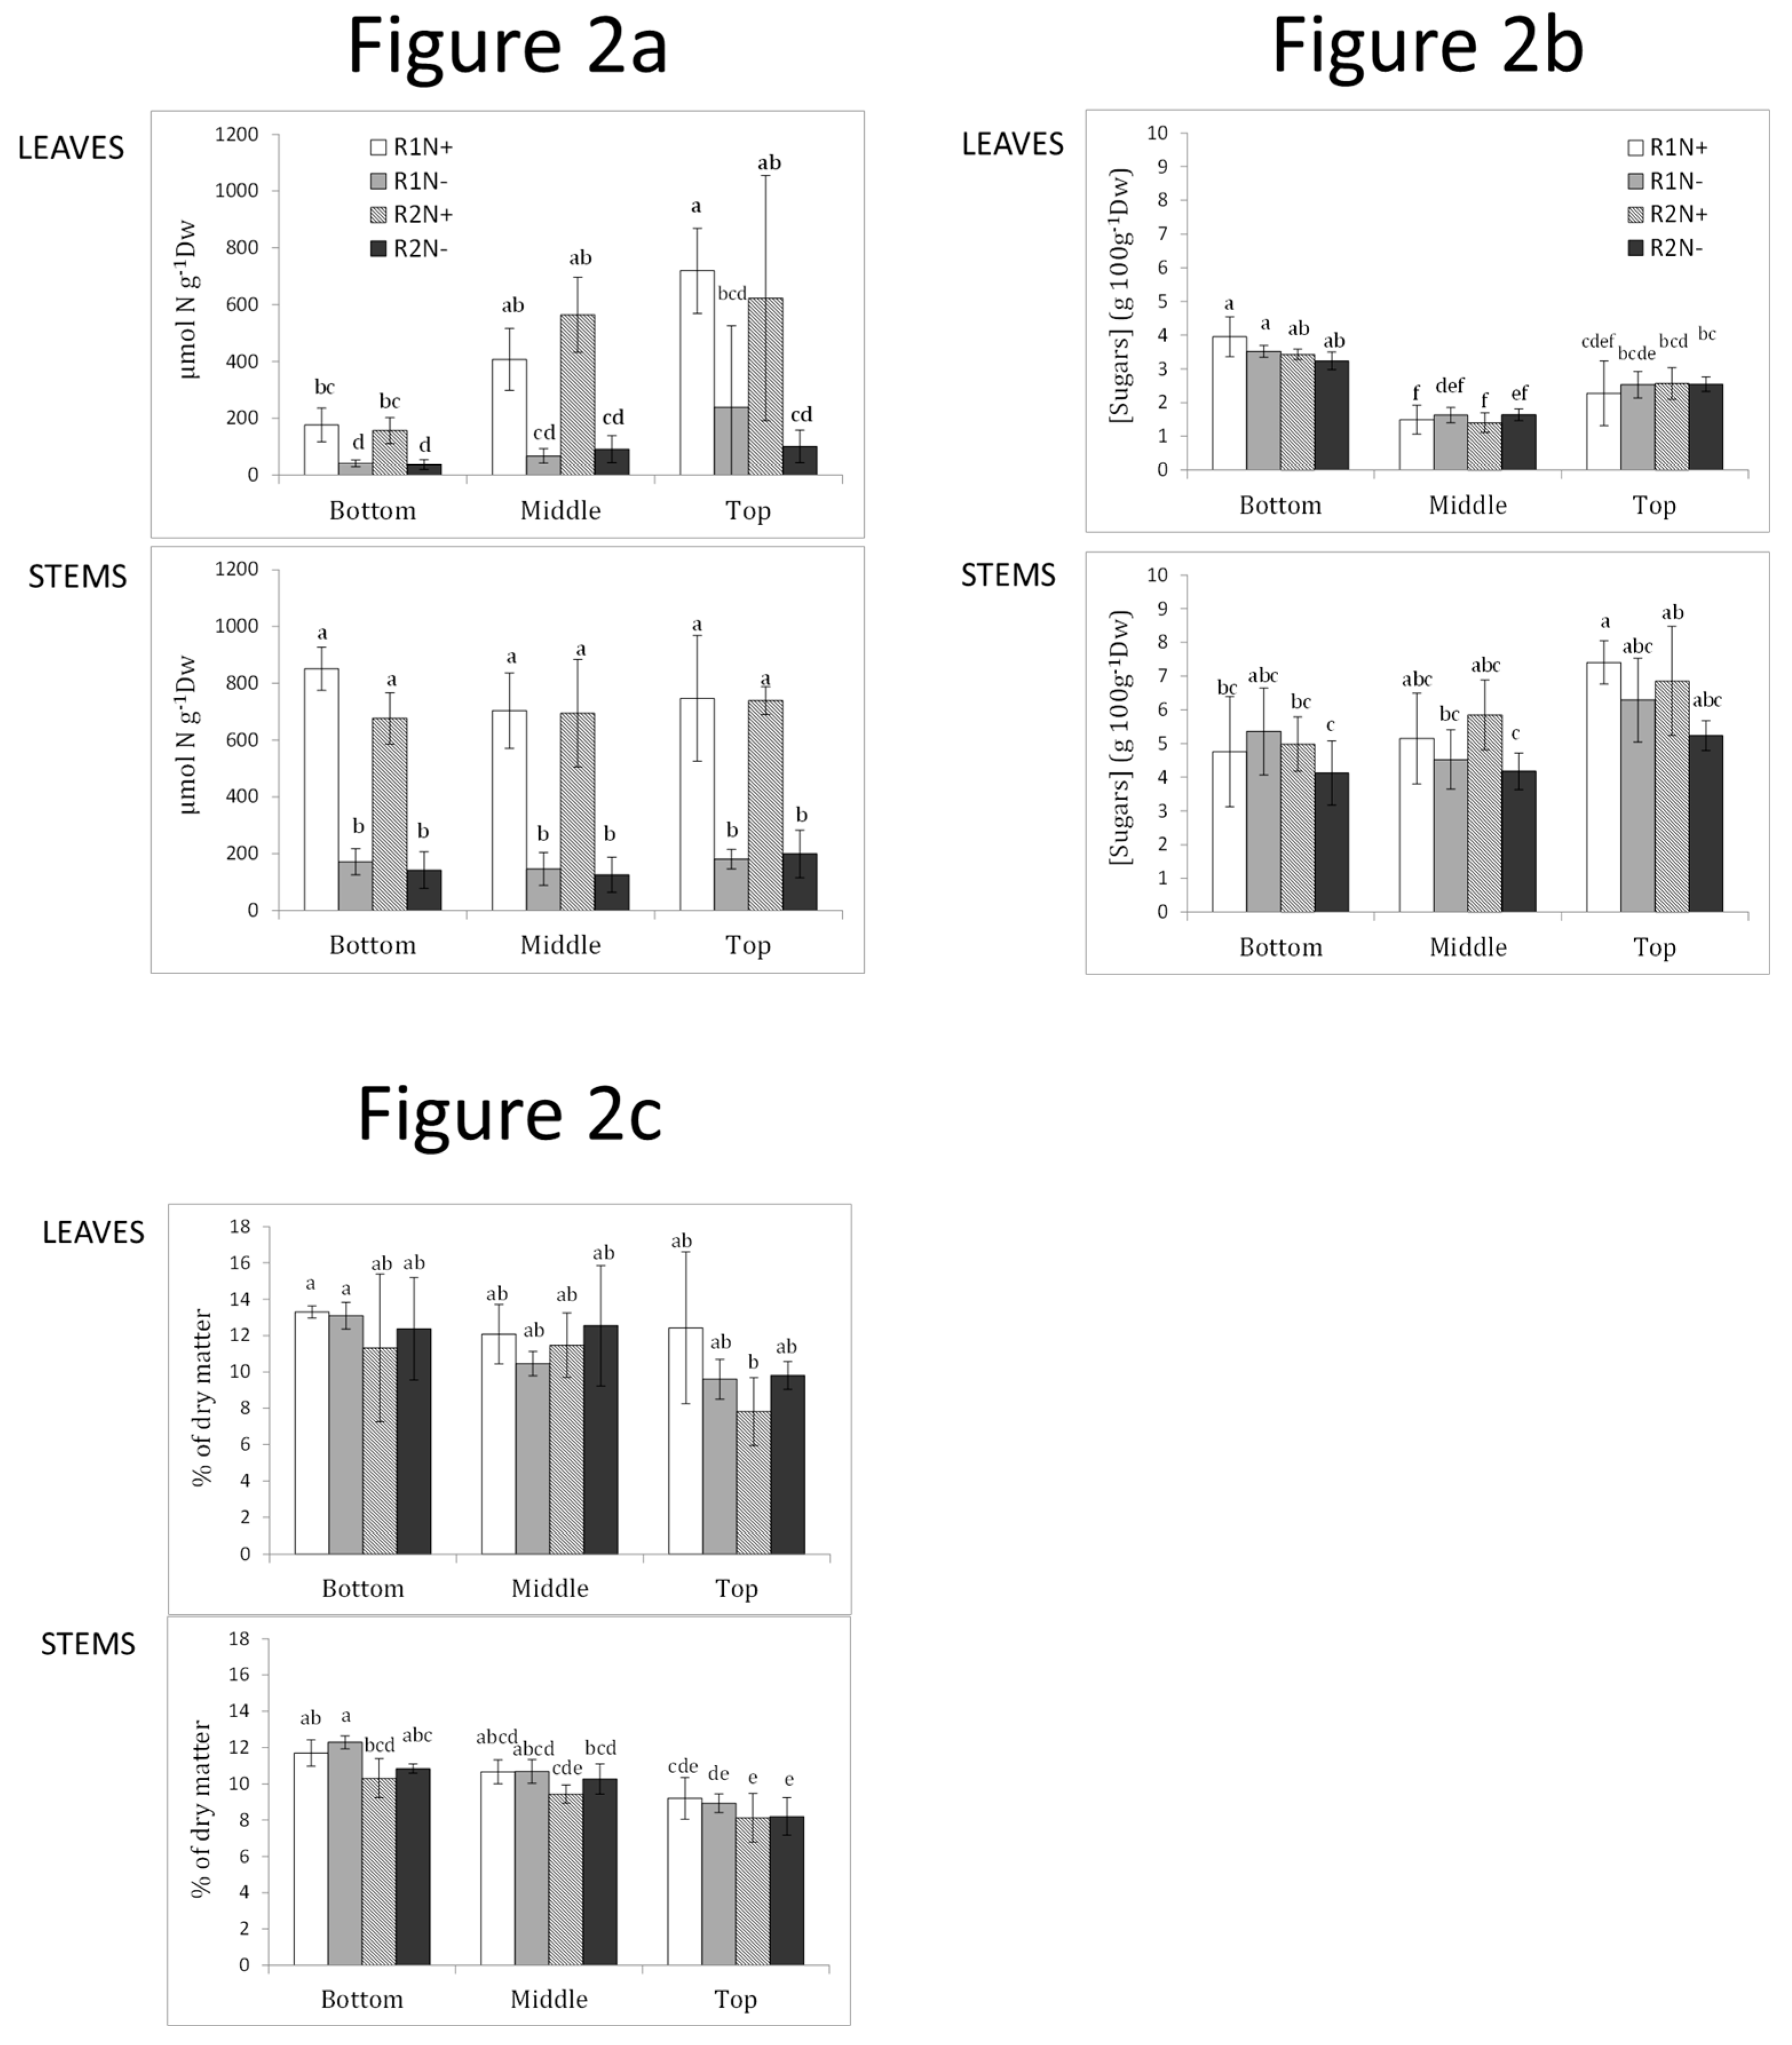
2.4. The Nitrogen Content of the Vegetative Parts as a Function of Nitrogen Supply

Figure 2a shows the effect of nitrogen supply on the nitrogen content of leaves and stems of tomato crops R1 and R2. R1 and R2 were not statistically different, regardless of plant material (leaf and stem) or location (top, middle, bottom). Leaf nitrogen content was characterized by a 4-fold increase (averaging R1 and R2) at the top compared to the lower leaves, regardless of the nitrogen treatment.
Averaging R1 and R2, the top leaves reached 671 and 170 µmol N g−1 of dry weight (Dw) for N+ and N−, respectively; the middle leaves reached 486 and 79 µmol N g−1Dw for N+ and N−, respectively; and bottom leaves reached 166 and 39 µmol N g−1Dw for N+ and N−, respectively.
Regarding the nitrogen content of the stems, we did not notice any significant difference from top to bottom of the plant, but a significant reduction of nitrogen content for plants receiving less nitrogen. Thus, we observed a strong decrease in nitrogen content with N− treatment, both in the leaves (up to 4-fold decrease at the bottom) and the stems (5-fold decrease for top, middle and bottom parts, Figure 2a).
These results observed at the end of the experiment were evidenced along the crop period using an independent protocol (Table 2). In accordance with the results in Figure 2a, we were able to notice that very-high nitrogen contents were detected in the N+ leaves (up to 942.6 µmol N g−1 of Dw) compared to the N− leaves (on average 282.7 µmol N g−1 of Dw).
Figure 2b shows the sugar content (glucose + fructose + sucrose) of the leaves and stems of R1 and R2 according to nitrogen supply. In the upper part of the canopy, twice as much sugar was found in the stems as in the leaves (Figure 2b), but no difference between treatments the N+ and N− treatments in either leaves or stems. The sugar content of the leaves changes in the canopy: the middle leaves contain less sugar than the bottom or top leaves.
Figure 2c shows the percentage of dry matter (expressed as a percentage of the total fresh weight) of the leaves and stems of R1 and R2 according to nitrogen supply. No differences were found between plant organs or nitrogen treatments. There is a vertical gradient: the upper part of the stem has a lower percentage of dry matter than the lower part.
We analyzed the distribution of above-ground biomass (fresh and dry mass) between leaves, stems and fruits, but no differences were found between treatments (data not shown).

2.5. Impact of the Nitrogen Supply on Tomato Fruit Quality

Table 3 shows the fructose, glucose, citric acid and malic acid contents in the pericarp of red (55 DAA) tomato fruits of R1 and R2 according to the nitrogen supply N+ and N− and season (Hordes of spring, summer and autumn are presented). The fruits harvested did not show statistical difference in sugar content, on average 153 g kg−1Fw in spring, 158 g kg−1Fw in summer and 154 g kg−1Fw in autumn. Fructose and glucose were present in equimolar ratio in the pericarp and were not modified by the decrease in nitrogen supply.
If we focus on acids, we noticed a seasonal effect: the malic acid content increased significantly for the autumn horde. The average acid content was assayed at 20 g kg−1Fw in spring and 28 g kg−1Fw in autumn. Citric acid is the main acid accumulating in the pericarp compared to malic acid (a difference of 10-times in spring). Citric acid content was significantly lower in R2N− than in R2N+, regardless of the horde studied. No significance can be stressed for replicate 1, but there is still a clear trend. The malic acid content has significantly decreased in R1N− and R2N− compared to R1N+ and R2N+, but only for the summer horde. The sugar:acid ratio showed an obvious effect of nitrogen supply: N− treatments had a higher sugar:acid ratio than N+ treatments in spring (only one replicate shows a significant response), summer and autumn (both replicates show a significant effect). Changes in the acid content of fruit during the season resulted in significant changes in the sugar:acid ratio in autumn (averaging 5.7) in compared to spring (7.9) or summer (7.1).
The vitamin C content (Table 3), assayed in the pericarp of red fruits (replicate 1), was similar between N+ and N− treatments. A slight significant decrease (statistic not shown) in vitamin C content occurred during the season.

2.6. Variation in the Biochemical Compounds in the Inner Tissues and Pericarp during Tomato Ripening

We measured the accumulation of compounds related to fruit quality traits during the ripening stages of the autumn horde. Results are presented in Figure 3 for Replicate 1 and in Table S4 (pericarp) and Table S5 (locular gel) for R1 and R2. Concerning red ripe fruits (55DAA), the results from Table 3 were consolidated: acids (especially malic acid) were decreased in low nitrogen treatment, whereas sugars showed no clear tendency. The sugar:acid ratio was significantly higher in N− (the differences were significant for both replicates). The evolution of fructose and glucose contents during fruit development was similar: the sugar content increased rapidly to reach a maximum level at 30DAA (up to 17.8 g 100g−1Dw), then remained constant until harvest (no significant differences between 30DAA, 45DAA and 55DAA). Figure 3a shows a different profile of hexose accumulation in the locular gel: indeed, the fructose content did not vary between 15DAA (12.3 g 100g−1Dw in N− and 12.8 g 100g−1Dw in N+) and 55DAA (11.8 g 100g−1Dw in N− and 10.2 g 100g−1Dw in N+) while the glucose content decreased significantly during ripening (12.6 g 100g−1 Dw in N− and 13.5 g 100g−1Dw in N+ for 15DAA fruits and 8.5 g 100g−1Dw in N− and 7.3 g 100g−1Dw in N+ for 55DAA fruits). Unlike pericarp, fructose and glucose were not equimolar in the locular gel: the fructose content was higher (×1.4) than the glucose content at harvest. Figure 3b shows the dynamics of acid accumulation over fruit development for R1N+ and R1N−. During fruit development, citric acid content strongly increased (2.5 times more) in the locular gel and, to lesser extent, in the pericarp, regardless of nitrogen supply. At the fruit scale, citric acid accumulated mainly in the locular gel (up to 10.0 g 100g−1Dw for 55DAA fruits) compared to the concentration assayed in the pericarp (up to 4.5 g 100g−1Dw for 55DAA fruits). The accumulation of malic acid during fruit development was not so different between the pericarp and the locular gel. Malic acid accumulated more in the locular gel under N+ (1.2 and 2.7 g 100g−1Dw respectively for 15DAA fruits and 55DAA fruits) while a lower accumulation was observed under N− (1.1 and 1.5 g 100g−1Dw respectively for 15DAA fruits and 55DAA fruits). In addition, the malic acid content remained stable in the pericarp whatever the nitrogen supply.
3c shows the starch content (expressed in grams of glucose per 100g of dry matter). Starch decreased strongly during tomato fruit ripening and was detected similarly in pericarp and locular gel. No differences were highlighted between nitrogen treatments.
Therefore, if we focus on the sugar:acid ratio (Figure 3d), we found a low ratio in the locular gel (1.6 and 1.8 respectively for N+ and N− at harvest) where total acids were mainly accumulated at the expense of pericarp. The pericarp is characterized by a high sugar:acid ratio (4.4 and 5.9 respectively for N+ and N− at harvest) related to sugar accumulation. As shown in Table 3, in pericarp the sugar:acid ratio was significantly higher in N− compared to N+ (significance for 45DAA and 55DAA fruits).
Figure 3e shows the vitamin C content of the pericarp and locular gel of the autumn horde. The locular gel contains significantly more vitamin C than the pericarp: 1.5 to 1.7 times more for N− and N+ respectively. The vitamin C content in locular gel strongly increased during ripening. In the locular gel, the vitamin C content reached a peak of 292 mg 100g−1Dw at the harvest stage, while the vitamin C content of the pericarp reached 194 mg 100g−1Dw. No statistical differences in ascorbate content were noticed between nitrogen treatments within hordes.

3. Discussion

Greenhouse vegetable crops are defined by a vertical distribution of light, temperature and CO2 [2,3]. This vertical gradient implies that the upper and lower leaves encounter different microclimatic conditions, which do not necessarily allow them to reach their optimal photosynthetic capacity. The photosynthetic activity records of each tomato leaf provide us with information on the relative importance of the different leaves in the acquisition of carbon through photosynthesis. As previously highlighted by modeling tomato [31] and sweet pepper (from 37.0 at the top to 12.4 µmol CO2 m−2 s−1 at the bottom; [32]), we confirmed a vertical distribution of the potential photosynthetic activity of the leaves.
Above all, light is the most important parameter affecting leaf photosynthesis, and plants adjust the leaf size and shape to improve light interception and compensate for the vertical gradient [33]. In addition, nitrogen resources are preferentially distributed to improve canopy photosynthesis [34,35,36] as nitrogen is required for chlorophyll biosynthesis [37]. Our results agreed wholeheartedly with the studies mentioned. We also explored the distribution of nitrogen in the stem compartment but no clear tendency could be drawn.
Nitrogen fluxes within the plant interact with nutrient and carbon flows, pH regulation affecting transporters’ activity and ionic fluxes [38] but also in relation to environmental parameters. Lebot et al., [39] reported that water and nutrient uptake rates from the substrate to the roots in growing tomato seedlings were uncoupled under high radiation and high temperatures. In our experiment, the nitrogen requirements of plants are fulfilled even under low nitrogen supply and during the summer, as plant growth and architecture have shown a similar pattern under N+ and N−. This reinforces our hypothesis that the nitrogen supply recommendations for greenhouse tomato production were higher than the plant growth and development requirements. In this study, precision horticulture allows us to estimate the amount of nitrogen to be supplied without causing a nitrogen deficiency that could affect plant growth. Indeed, a more severe reduction in nitrogen supply can lead to a reduction in plant leaf area [9]. Similar results of reduced leaf growth were reported in potato [40] and maize [41] when a greater reduction in nitrogen was applied, which was not the case in the present study. Since the leaf area influences the interception of light, it is important to accurately monitor the N supply to avoid any reduction in leaf area, in order to optimize light interception, photosynthesis and crop yield.
Noteworthy, the leaves 10–11 (counting from the top) were identified as the most important leaves regarding the interception of light by the plant [33], nitrogen distribution, leaf area and potential photosynthetic activity. Therefore, we chose these very active leaves to monitor the impact of a reduction in nitrogen supply on their photosynthetic activity. We did not observe any difference related to nitrogen supply. In other experiments aimed at limiting nitrogen supply, the results were different since the rate of light saturating photosynthesis was reduced when there was a deficiency of nitrogen or a high nitrogen content [40,42]. This supports the hypothesis that, in our case, even the low nitrogen treatment meets the plants’ requirements for the necessary adjustments (leaf growth and chlorophyll content) to optimize plant photosynthesis. As for the lower leaves, their nitrogen content was significantly reduced as they acclimatized to a dimly lit environment [43]. Remobilization of nitrogen from senescent leaves has been shown [44] and plays an essential role in improving the efficiency of nitrogen use by crops. The lower leaves removed from the plant by growers for sanitary purpose and to improve the distribution of light to the fruits are definitely not senescent leaves. Deleafing in grower’s greenhouses implies the storage then destruction of the removed leaves. This can therefore be a huge nitrogen leak for the plant if the nitrogen is not remobilized before cutting. With regards to the results of our experiment in May (Table 2), leak could reach 189 grams of N per plant each week (3 leaves are cut off per week) under high nitrogen supply; 75 grams of N per plant under low nitrogen supply. In order to ensure a high nitrogen efficiency at the crop level, the adjustment of nitrogen supply to plant needs has led us to reduce the nitrogen supply by 3 by 3 (5 mM) compared to current practices (16 mM). In addition, even if fertigation practices encourage drainage recycling, the environmental footprint of greenhouse crops could be affected by this export of nitrogen through deleafed leaves. Assuming a final plant density of 3.3 stems per square meter, we estimated the nitrogen leakage for one hectare of tomato at 6 tons of nitrogen per week and 2.5 tons per week for N+ and N− supplies respectively. This means that the re-use of wasted leaves is a priority but should be supervised when spreading on others crops.
We have also monitored the nitrogen content of the stems and the immobilization of nitrogen is also huge in this compartment, as no physiological evidence has yet been found, except for the transport of nitrogen in the plant. The stem has been identified as a carbon storage organ [45], with accumulation of starch, glucose, fructose and sucrose. The authors proposed that carbon storage in the stem could be a residual trait of tomato domestication [45], while it could also play a role as a signal for abiotic stress [46].
Nitrogen deficiency could modify biomass allocation by promoting the root system. Thus, an increase in the root to shoot ratio is often mentioned [47,48], but unfortunately it was not possible to evaluate this ratio in our experimental procedure (the roots are stuck in the rockwool substrate). Nitrogen deficiency leads to the accumulation of starch and sugars in the leaves [48], which might lead to a negative feed-back regulation of photosynthesis activity [49]. In our data, we were able to maintain the physiological activity of the plants comparable to the control plants by adjusting the nitrogen supply to the actual needs of the plant. No deficiencies were observed. As already mentioned by Parisi et al., and Mũnoz et al. [28,50], marketable yield was not affected by a reduction in nitrogen supply, while unmarketable fruits significantly increased under N+ treatment. Our results are consistent with those of comparable studies. It should be noted that a severe nitrogen deficiency greatly reduces yield [39,51] and has an impact on plant metabolism [52]. This could influence the phenolic content of tomato leaves and stems [27] and consequently affect plant susceptibility to different diseases by increasing their resistance to pathogens [53].
In the previous sections, we showed that a significant storage of nitrogen occurred in the plant organs of a greenhouse tomato crop whose fertigation was managed according to grower’s practices. We can address important challenges regarding the impact of this storage on fruit quality, as was previously questioned [54]. In the past, the quality of tomato fruit was intensely studied, but exclusively focused on pericarp tissue. Of course, consumers eat the tomato entirely. Recently, Wang et al. [55] showed that the aromatic volatile compounds in the inner tissue of tomato were similar to those in the pericarp, emphasizing that the inner tissue must be taken into account as an important factor influencing the quality of the tomato flavour. With regard to the sugar/acid ratio, which is really important for the evaluation of tomato quality, the spatial characterization of tomato fruits has not been studied in the past. Some specific work has been done in the internal tissues of tomatoes on sugar metabolism [56,57], sugar and lycopene accumulation during ripening [58] or ethylene metabolism [59].
In the present study, we divided the tomatoes into two parts: the inner tissue (mainly containing locular gel and seeds) and the outer tissue (pericarp). In the pericarp, the temporal dynamics of these compounds during ripening are consistent with previous works [20,60,61]. It is interesting to note that acids accumulate mainly in the locular gel (70% of total organic acids content), while hexoses accumulate in the pericarp (60% of total hexoses content). As the sugar:acid ratio is decisive for the consumer’s acceptance, it is really important to take into consideration the composition of the locular gel for breeding purposes. Moreover, the hexose content tends to decrease during ripening in the locular gel but still representing 40% of the total hexose content of the fruit at the harvest stage. The total hexoses content (pericarp + locular gel) is quite similar at 15DAA and at the harvest stage (nearly 50 g 100g−1Dw). This is not the case for total acids whose content is doubled from 15DAA to 56DAA. If the harvest stage were defined in terms of fruit quality rather than on color stage, for this variety, sugars might not be the only metabolites to be considered. Thus, the harvest stage could be finely adjusted according to the acidity of the fruit, especially if we consider that the acids are more sensitive to the environment (at least to the nitrogen content). Since quality is not only defined by the sugar:acid ratio, the integration of the aromatic profile during ripening [55,62,63] associated with the dynamic of organic acids in the fruit should lead to an increase in the quality of the tomato fruit. The composition of the pericarp has been widely used to define the impact of the environment or genetic on fruit quality, but we show that this is only part of the solution. Our innovative work on the spatial and dynamic profiles of the inner tissues and pericarp of tomatoes could lead to a reassessment of the harvest stage. We propose to include acids and aroma profiles at the forefront of tomato quality assessment, rather than just the sugar profile.
Furthermore, sugar partitioning during fruit ripening between inner and outer tissues is closely linked to the growth of each sub-organ. Indeed, from 15DAA to 30DAA, the inner tissues represent nearly 40% of the total mass of fresh fruit (data not shown; no impact of the nitrogen supply), the seeds develop and we can consider that, biologically, it is the most important part of the fruit. The fresh mass of pericarp represents 80% of the total fruit fresh mass (data not shown; no impact of nitrogen supply) at maturity (from green mature stage to harvest). Sugars are the main driver of fruit growth by increasing osmotic pressure leading to water influx [64,65]. Their partitioning within the fruit is important to ensure cell division and cell growth, first in the inner part, then in the pericarp. Thus, it could be assumed that the partitioning of sugars changes during the development and ripening of the fruit to ensure the growth of each part of the fruit. Simulations from fruit growth models could help us to better understand these processes [66].
A low nitrogen supply increased the sugar:acid ratio at the harvest stage due to lower acid accumulation. This is the only difference we found between nitrogen treatments. The vitamin C content was not affected, nor was the hexose profile. In a previous study, vitamin C content was found to be particularly sensitive to nitrogen supply, being negatively correlated to nitrogen content [23,67]. Bénard et al. [9] provided a possible explanation for this increased vitamin C content in fruits harvested from plants grown under low nitrogen: Nitrogen deprivation reduced leaf area and improved light transmitted to fruit, which improved the ascorbate content of tomatoes as the ascorbate content increases as light reaching the fruit increases [68]. Current data support the hypothesis that nitrogen reduction does not necessary affect ascorbate metabolism, unless if results in a reduction in leaf area and an increase in fruit irradiance. Vitamin C is particularly important for human diet, and fruits and vegetables are the major source of vitamin C. Therefore, nitrogen fertilization should be maintained at an acceptable level to support human health. Based on our results, a lower nitrogen supply did not alter the spatial dynamic between inner and outer tissues of tomato fruits.

4. Materials and Methods

4.1. Plant Material and Growing Conditions

Soilless tomato cultivation took place in two Venlo-type heated greenhouse compartments (R1 and R2), with a 5.5 m height and a 320 m² ground surface. R1 and R2 are strictly similar in terms of management and structure, and will be used as two replicates. Tomato plants (Solanum lycopersicum var. ‘Clodano’ (bunch tomatoes), Syngenta, Bâle, Switzerland) were two-head grafted on the rootstock DRO 141 (De Ruiter™ Seeds, Bergschenhoek, The Netherlands). Sowing was on 25th October 2016 and transplantation on 14th December 2016 with a planting density of 2.50 stems m−2. To follow the irradiance increase, leaving the axillary shoot from the axil just below the 5th truss (13th March 2017) led to a final stem density of 3.33 stems m−2. Growing substrates were rockwool in slabs (Cultilene EXACT® AIR, Saint-Gobain Cultilene, Rijen, The Netherlands); integrated pest management was made with Biobest (Biobest Group NV, Westerlo, Belgium). A MultiMa® climate computer (Ridder, Pijnacker, The Netherlands) was used to record and control the greenhouse climatic conditions. Climate management (Table S1) of R1 and R2 led to the establishment of a 24 h-average temperature of 20.6 °C and 20.7 °C respectively. Day temperature was 22.8 °C in R1 and 22.9 °C in R2, night temperature was 18.1 °C in both greenhouses. The air saturation deficit was set to 6.0 g of water per kg−1 of dry air during the day, and 3.0 g kg−1 during the night. The injection of CO2 led to a CO2 content of 581 ppm in R1 and 632 ppm in R2.

4.2. Nitrogen Management

Water was supplied to plants using a drip irrigation system to maintain 30–40% drainage. Fertilization was done using Substrafeed™ liquid fertilizers (Yara France, La Défense, France). Control treatment (labeled N+) was made according to the commercial practices. Nitrogen supply was set to 16 mM. Complete supply settings are detailed in Table S2. As for the low nitrogen supply (labeled N−), settings were as followed: since the 2nd of February 2017 (mature plants), nitrogen supply was divided by two in comparison to the control (8 mM), then we progressively decreased the nitrogen supply until no nitrogen could be detected in the drainage. Therefore, it leads to a nitrogen content setting divided by 3 in N− (5 mM), corresponding to nitrogen supply adjusted on plant’s needs. Complete supply settings are detailed in Table S2.

4.3. Agronomic Performance

Tomatoes were harvested bi-weekly (ripening stage as defined by commercial practices). Total marketable fruit yield per square meter is expressed as kg m−2. The number of marketable and unmarketable fruits and total fruit mass were recorded per plot on 6 plots of 12 plants per greenhouse, spread all over the greenhouse. Average fruit mass is expressed in g. Marketable fruits and unmarketable fruits were split according to visual inspection at conditioning stage. Harvesting started week 11 and ended week 42.

4.4. Plant Architecture

Plant architecture was evaluated through weekly measurements of stem growth (expressed in cm.week−1), stem diameter (expressed in mm and measured 30 cm below stem apex), length and width of leaf number 10 (counting from the top of the plant; first leaf was larger than 6 cm². Data expressed in cm), number of leaves on the plant, distance from plant apex to first flowered truss (expressed in cm). Measurements were done from week 6 until week 41 (which represent 36 weekly measurements per treatment). Data are averaging 6 plants per treatment.
Furthermore, leaf growth rate was recorded on 12 leaves from 12 different plants per treatment and per month (5 replicates: starting from 8th of February, 29th of March, 18th of May, 29th of June and last replicate started 08th of August 2017). Leaf length was noted from juvenile leaf (6 cm²) until deleafing, which represented 4 weeks of measurements per leaf. Deleafing was done according to grower’s practices (3 leaves were removed per week).

4.5. Leaf Potential Photosynthetic Activity

4.5.1. Photosynthetic Activity of All Individual Leaves in the Control Treatment

Potential photosynthetic rate (µmol CO2 m−2 s−1) was measured on leaves using a LI-6400XT portable photosynthesis system (Li-Cor Biosciences, Lincoln, NE, USA), with the following parameters: 26 °C, 1600 μmol PPFD m−2 s−1, 800 ppm CO2, 60% of relative humidity, air flow of 100 µmol s−1. It corresponds to saturating conditions. Measurements were performed on expanded leaves of 10 independent plants from control treatment (N+). Leaf area was determined from pictures on the same leaves from the same plants using ImageJ software (US National Institutes of Health, Bethesda, MD, USA; data not shown). Average leaf area was used to evaluate the leaf potential photosynthetic activity expressed in µmol CO2 leaf−1 s−1. Recordings started after a 20 minutes period of acclimation [69] of the leaf to the chamber conditions, and lasted 10 minutes (records every 30 seconds). Photosynthetic activity according to leaf area represents a closer estimation of the influence of each leaf on the overall physiological activity of a plant. Thereby, it allows us to work on the impact of the nitrogen treatments on the more active leaves.

4.5.2. Photosynthetic Activity and Impact of the Nitrogen Treatments

Net photosynthetic rate (µmol CO2 m−2 s−1) was measured on leaves using a LI-6400XT portable photosynthesis system (Li-Cor Biosciences, Lincoln, NE, USA), with the following parameters: 23 °C, 800 μmol PPFD m−2 s−1, 600 ppm CO2, 60% of relative humidity, air flow of 100 µmol s−1. Measurements were performed on the leaf number 10 (counting starts from the top of the plant, first leaf is the first leaf fully expanded with a surface area larger than 6 cm²) of 10 independent plants per treatment. Recordings were ensured during two days of October 2017 on mature plants. Recordings started after a 20 minutes period of acclimation [69] of the leaf to the chamber conditions, and lasted 10 minutes (records every 30 seconds).

4.6. Plant and Fruit Sampling

4.6.1. Vegetative Material Sampling

During the crop period, terminal leaflets of 12 leaves (sampling straight after deleafing) from 12 different plants per treatment and per month were cut and immediately frozen into liquid nitrogen before biochemical analyses (Table 2).
At the end of the crop period (week 41), leaf compartment was divided in 3: top leaves (leaves number 1 to 6), middle leaves (6 to 12) and bottom leaves (12 to 18). Terminal leaflet was cut, weighted and immediately frozen into liquid nitrogen before biochemical analyses. Remaining parts of the leaf were weighted (fresh mass) and the dry weight of the material was estimated after drying for 3 days at 72 °C.
Stem compartment was also divided in 3: top (top-half of the leafed part), middle (bottom-half of the leafed part) and bottom (part without leaves). From these 3 locations, 50–80 g were immediately frozen into liquid nitrogen before biochemical analyses. Remaining parts of the stems were weighted (fresh mass) and the dry weight of the material was estimated after drying for 3 days at 72 °C.

4.6.2. Fruit Sampling

Three hordes were defined according to year’s period: horde 1 was during spring, horde 2 during summer and horde 3 during autumn. The same day, at least 350 flowers were labeled at anthesis, and then fruits of the following developmental ages: 15 days after anthesis (DAA), 30 DAA (green mature fruits), 45 DAA (orange fruits) and 55 DAA (red fruits) were harvested. Thus fruits endured the same climatic history. 10 fruits per treatment and per fruit age were selected and pooled into 5 samples. Fruits were divided into quarters, and from two opposite quarters from two different fruits, we separated (except for horde 1) pericarp material from locular gel (containing seeds). Pericarp material was inclusive of exocarp, mesocarp and endocarp of the tomato fruit. Locular gel included locule, columella and seeds. Material was weighted and immediately frozen and stored at −80 °C before grinding.
The two other opposite quarters were weighted (fresh mass) and dry weight of the material was estimated after drying for 3 days at 72 °C.

4.6.3. Biochemical Analyses

Measurements of glucose, fructose and sucrose (expressed in g per 100 g of Dw in Figure 2 and Figure 3, in g per kg of Fw in Table 3), starch (expressed in % of total dry matter), malic and citric acid (expressed in g per 100 g of Dw in Figure 3, in g per kg of Fw in Table 3) were performed by HPLC, as previously described [70]. Sugars, acids and starch were extracted in a methanol:chloroform:water mixture (1/0.6/1) at 4 °C. Polyvinylpolypyrrolidone was used to trap phenolic compounds, and extracts were then purified through Waters C18 cartridge (Waters) and 0.45 μm Sep-Pak filter (Jasco France) before quantitative analysis. The total N content (mg g−1Dw) of each sample was measured on 4 mg of plant material powder using an automated CN analyzer (Flash EA 1112, Thermo Firmingam Milan, Italy). Measurements of vitamin C (expressed in mg per 100 g of Dw in Figure 3, in mg per 100 g of Fw in Table 3) content were carried out as described by Truffault et al. [71].

4.7. Statistical Analyses

Homoscedasticity and normal distribution were evaluated respectively through Bartlett’s test and Shapiro-Wilk’s test with a p-value of 0.05. According to the number of replicates analyzed (n > 3), ANOVA was performed followed by a Tukey’s test (p < 0.05) to rank modalities per group. In the case of two replicates analyzed (n = 2), student t-test was favored (p < 0.05).

5. Conclusions

Nitrogen management adapted to the actual needs of the plant should reduce the nitrogen input to a soilless tomato crop by three times compared to current grower practices. This reduction in nitrogen supply did not affect yield and photosynthetic activity. Fruit quality was improved through the sugar:acid ratio increase. Therefore, a low nitrogen supply is a solution to reduce the environmental footprint of tomato crops and increase the nitrogen use efficiency, as a large part of the nitrogen stored by plants is exported through deleafing. We can conclude that nitrogen management based on plant needs increases fruit quality without affecting plant performance.

Supplementary Materials

The following are available online at https://0-www-mdpi-com.brum.beds.ac.uk/2073-4395/9/2/80/s1, Table S1: Climatic parameters of replicates 1 and 2 (R1 and R2). Measurements are recorded by MultiMa® climate computer (HortiMax, Pijnacker, The Netherlands) every minutes. Yearly (from 14th of December 2016 to 15th of October 2017) averaged data are presented; Table S2: Fertigation settings of nitrogen treatments N+ and N−. Settings are detailed from substrate filling to the end of the crop; Table S3: Leaf growth rate of tomato plants from R1 and R2 depending on nitrogen supply N+ and N-. The growth rate of leaf was recorded on 12 leaves from 12 different plants per treatment and per month (5 replicates: starting from 8th of February, 29th of March, 18th of May, 29th of June and last replicate starts 08th of August 2017). Leaf length was noted when juvenile leaf was fully expanded until deleafing (timing according to grower’s practices, thus 3 leaves deleafed per week), which represents 4 weeks of measurements per leaf. se stands for standard deviation. Letters indicate results of statistical analysis according to Tukey’s test: different letters indicate statistical differences; Table S4: Fructose, glucose, citric acid and malic acid contents, sugar:acid ratio and vitamin C content in pericarp during ripening of tomato fruits from R1 and R2 of spring, summer and autumn hordes depending on the nitrogen supply N+ and N−. Fructose, glucose, citric acid and malic acid contents are expressed in g.100g−1 of dry matter, vitamin C in mg.100g−1 of dry matter. Starch content is expressed in % of dry matter. Sugar:acid ratio has no unit. Average data are from 5 samples per treatment. se stands for standard deviation. Letters indicate results of statistical analysis according to Tukey’s test: different letters indicate statistical differences between treatments. Hordes are analyzed separately; Table S5: Fructose, glucose, citric acid and malic acid contents, sugar:acid ratio and vitamin C content in locular gel during ripening of tomato fruits from R1 and R2 of spring, summer and autumn hordes depending on the nitrogen supply N+ and N−. Fructose, glucose, citric acid and malic acid contents are expressed in g.100g−1 of dry matter, vitamin C in mg.100g−1 of dry matter. Starch content is expressed in % of dry matter. Sugar:acid ratio has no unit. Average data are from 5 samples per treatment. se stands for standard deviation. Letters indicate results of statistical analysis according to Tukey’s test: different letters indicate statistical differences between treatments. Hordes are analyzed separately.

Author Contributions

E.B., V.T. and G.V. conceived and designed research. V.T. and M.R. conducted experiments. V.T. analyzed the data. V.T. and H.G. wrote the manuscript. All authors read and approved the manuscript and agree to be accountable for all aspects of the work.

Funding

This research was funded by FranceAgriMer, grant number 2016–0244, through the “Programme d’investissements d’avenir PIA- Projets agricoles et agroalimentaires d’avenir P3A”.

Acknowledgments

The authors declare that there are no conflicts of interest. We warmly thank Nathalie Mavel, Irène Gérondeau and Denis Loda for technical assistance and the greenhouse staff at CTIFL; Benjamin Albert for photosynthesis measurements of Figure 1; Céline Caboche, Patricia Laugier, Emilie Rubio, Sylvie Sérino (INRA) for metabolites analyses. This work has been funded by FranceAgriMer through the “Programme d’investissements d’avenir PIA—Projets agricoles et agroalimentaires d’avenir P3A”. We warmly thank members of the project “MAGESTAN”.

Conflicts of Interest

The authors declare no conflict of interest.

References

  1. Vanthoor, B.H.E.; Stanghellini, C.; van Henten, E.J.; de Visser, P.H.B. A methodology for model-based greenhouse design: Part 1, a greenhouse climate model for a broad range of designs and climates. Biosyst. Eng. 2011, 110, 363–377. [Google Scholar] [CrossRef]
  2. Boulard, T.; Roy, J.-C.; Pouillard, J.-B.; Fatnassi, H.; Grisey, A. Modelling of micrometeorology, canopy transpiration and photosynthesis in a closed greenhouse using computational fluid dynamics. Biosyst. Eng. 2017, 158, 110–133. [Google Scholar] [CrossRef]
  3. Truffault, V.; Le Quillec, S.; Brajeul, E. Insights into the potential of semi-closed greenhouses and future perspectives for tomato crops. Acta Horti. 2018, 1227, 141–150. [Google Scholar] [CrossRef]
  4. Nitrate Directive: Council Directive 91/676/EEC of 12 December 1991 Concerning the Protection of Waters against Pollution Caused by Nitrates from Agricultural Sources. Available online: https://eur-lex.europa.eu/legal-content/en/ALL/?uri=CELEX%3A31991L0676 (accessed on 20 November 2018).
  5. Savvas, D.; Gruda, N. Application of soilless culture technologies in the modern greenhouse industry—A review. Eur. J. Hortic. Sci. 2018, 83, 280–293. [Google Scholar] [CrossRef]
  6. Schwarz, D.; Thompson, A.J.; Kläring, H.-P. Guidelines to use tomato in experiments with a controlled environment. Front. Plant Sci. 2014, 5, 625–641. [Google Scholar] [CrossRef]
  7. Hoagland, D.R. Inorganic nutrition of plants; Chronica Botanica Co.: Waltham, UK, 1944. [Google Scholar]
  8. De Kreij, C.; Voogt, W.; Van den Bos, A.; Baas, R. Voedingsoplossingen voor de teelt van tomaat in gesloten teeltsystemen; Brochure VG: Naaldwijk, The Netherlands, 1997. [Google Scholar]
  9. Bénard, C.; Gautier, H.; Bourgaud, F.; Grasselly, D.; Navez, B.; Caris-Veyrat, C.; Weiss, M.; Génard, M. Effects of low nitrogen supply on tomato (Solanum lycopersicum) fruit yield and quality with special emphasis on sugars, acids, ascorbate, carotenoids, and phenolic compounds. J. Agric. Food Chem. 2009, 57, 4112–4123. [Google Scholar] [CrossRef]
  10. Turcotte, G.; Larouche, R.; Carrier, A.; Lambert, L. Production de la tomate de serre au Québec (guide technique). Available online: https://www.agrireseau.net/documents/95590/production-de-la-tomate-de-serre-au-quebec-guide-technique-de-297-pages (accessed on 15 August 2017).
  11. Le Bot, J.; Adamowicz, S.; Robin, P.; Andriolo, J.L.; Gary, C. Modelling nitrate uptake by greenhouse tomato crops at the short and long time scales. Acta Horti. 1998, 456, 237–246. [Google Scholar] [CrossRef]
  12. Adamowicz, S.; Le Bot, J. Trends in modelling nitrate uptake. Acta Horti. 1991, 507, 231–240. [Google Scholar] [CrossRef]
  13. Sonneveld, C.; Voogt, W. Nutrient Solutions for Soilless Cultures. In Plant Nutrition of Greenhouse Crops; Springer: Houten, The Netherlands, 2009; pp. 257–275. [Google Scholar]
  14. Incrocci, L.; Massa, D.; Pardossi, A. New Trends in the Fertigation Management of Irrigated Vegetable Crops. Horticulturae 2017, 3, 37. [Google Scholar] [CrossRef]
  15. Bertin, N.; Génard, M. Tomato quality as influenced by preharvest factors. Sci. Hortic. 2018, 233, 264–276. [Google Scholar] [CrossRef]
  16. Davies, J.N.; Hobson, G.E.; McGlasson, W.B. The constituents of tomato fruit—the influence of environment, nutrition, and genotype. CRC Crit. Rev. Food Sci. Nutr. 1981, 15, 205–280. [Google Scholar] [CrossRef]
  17. Baldwin, E.A.; Scott, J.W.; Einstein, M.A.; Malundo, T.M.M.; Carr, B.T.; Shewfelt, R.L.; Tandon, K.S. Relationship between Sensory and Instrumental Analysis for Tomato Flavor. J. Amer. Soc. Hort. Sci. 1998, 123, 906–915. [Google Scholar] [CrossRef]
  18. Bhowmik, D.; Kumar, K.S.; Paswan, S.; Srivastava, S. Tomato-a natural medicine and its health benefits. J. Pharmacogn. Phytochem. 2012, 1, 33–43. [Google Scholar]
  19. Klee, H.J.; Tieman, D.M. The genetics of fruit flavour preferences. Nat. Rev. Genet. 2018, 19, 347–356. [Google Scholar] [CrossRef]
  20. Gautier, H.; Diakou-Verdin, V.; Bénard, C.; Reich, M.; Buret, M.; Bourgaud, F.; Poëssel, J.L.; Caris-Veyrat, C.; Génard, M. How Does Tomato Quality (Sugar, Acid, and Nutritional Quality) Vary with Ripening Stage, Temperature, and Irradiance? J. Agr. Food Chem. 2008, 56, 1241–1250. [Google Scholar] [CrossRef]
  21. Ripoll, J.; Urban, L.; Staudt, M.; Lopez-Lauri, F.; Bidel, L.P.R.; Bertin, N. Water shortage and quality of fleshy fruits—making the most of the unavoidable. J. Exp. Bot. 2014, 65, 4097–4117. [Google Scholar] [CrossRef]
  22. Ripoll, J.; Urban, L.; Bertin, N. The potential of the magic tom parental accessions to explore the genetic variability in tomato acclimation to repeated cycles of water deficit and recovery. Front. Plant Sci. 2016, 6, 1187. [Google Scholar] [CrossRef]
  23. Wang, Z.-H.; Li, S.-X.; Malhi, S. Effects of fertilization and other agronomic measures on nutritional quality of crops. J. Sci. Food Agr. 2007, 88, 7–23. [Google Scholar] [CrossRef]
  24. Wang, C.; Gu, F.; Chen, J.; Yang, H.; Jiang, J.; Du, T.; Zhang, J. Assessing the response of yield and comprehensive fruit quality of tomato grown in greenhouse to deficit irrigation and nitrogen application strategies. Agr. Water Manage. 2015, 161, 9–19. [Google Scholar] [CrossRef]
  25. Wang, X.; Xing, Y. Evaluation of the effects of irrigation and fertilization on tomato fruit yield and quality: A principal component analysis. Sci. Rep. 2017, 7, 350. [Google Scholar] [CrossRef]
  26. Gruda, N.; Savvas, D.; Colla, G.; Rouphael, Y. Impacts of genetic material and current technologies on product quality of selected greenhouse vegetables – A review. Eur. J. Horticul. Sci. 2018, 83, 319–328. [Google Scholar] [CrossRef]
  27. Larbat, R.; Olsen, K.M.; Slimestad, R.; Løvdal, T.; Bénard, C.; Verheul, M.; Bourgaud, F.; Robin, C.; Lillo, C. Influence of repeated short-term nitrogen limitations on leaf phenolics metabolism in tomato. Phytochemistry 2012, 77, 119–128. [Google Scholar] [CrossRef]
  28. Parisi, M.; Giordano, L.; Pentangelo, A.; D’Onofrio, B.; Villari, G. Effects of different levels of nitrogen fertilization on yield and fruit quality in processing tomato. Acta Horticulturae. 2006, 700, 129–132. [Google Scholar] [CrossRef]
  29. Zhang, T.Q.; Tan, C.S.; Liu, K.; Drury, C.F.; Papadopoulos, A.P.; Warner, J. Yield and Economic assessments of fertilizer nitrogen and phosphorus for processing tomato with drip fertigation. Agron. J. 2010, 102, 774–780. [Google Scholar] [CrossRef]
  30. Albornoz, F. Crop responses to nitrogen overfertilization: A review. Scientia Horticulturae. 2016, 205, 79–83. [Google Scholar] [CrossRef]
  31. Sarlikioti, V.; De Visser, P.H.; Marcelis, L.F.M. Exploring the spatial distribution of light interception and photosynthesis of canopies by means of a functional—structural plant model. Ann. Bot. 2011, 107, 875–883. [Google Scholar] [CrossRef]
  32. Kim, J.H.; Lee, J.W.; Ahn, T.I.; Shin, J.H.; Park, K.S.; Son, J.E. Sweet Pepper (Capsicum annuum L.) Canopy photosynthesis modeling using 3D plant architecture and light ray-tracing. Front. Plant Sci. 2016, 7, 1321–1331. [Google Scholar] [CrossRef]
  33. Sarlikioti, V.; De Visser, P.H.; Buck-Sorlin, G.H.; Marcelis, L.F.M. How plant architecture affects light absorption and photosynthesis in tomato: Towards an ideotype for plant architecture using a functional–structural plant model. Ann. Bot. 2011, 108, 1065–1073. [Google Scholar] [CrossRef]
  34. Field, C. Allocating leaf nitrogen for the maximization of carbon gain: Leaf age as a control on the allocation program. Oecologia. 1989, 56, 341–347. [Google Scholar] [CrossRef]
  35. Prieto, J.A.; Louarn, G.; Peña, J.P.; Ojeda, H.; Simonneau, T.; Lebon, E. A leaf gas exchange model that accounts for intra-canopy variability by considering leaf nitrogen content and local acclimation to radiation in grapevine (Vitis vinifera L.). Plant Cell Environ. 2012, 35, 1313–1328. [Google Scholar] [CrossRef]
  36. Hikosaka, K. Optimality of nitrogen distribution among leaves in plant canopies. J. Plant Res. 2016, 129, 299–311. [Google Scholar] [CrossRef]
  37. Evans, J.R. Photosynthesis and nitrogen relationships in leaves of C3 plants. Oecologia. 1989, 78, 9–19. [Google Scholar] [CrossRef]
  38. Stitt, M.; Müller, C.; Matt, P.; Gibon, Y.; Carillo, P.; Morcuende, R.; Scheible, W.-R.; Krapp, A. Steps towards an integrated view of nitrogen metabolism. J. Exp. Bot. 2002, 53, 959–970. [Google Scholar] [CrossRef]
  39. Le Bot, J.; Jeannequin, B.; Fabre, R. Growth and Nitrogen Status of Soilless Tomato Plants Following Nitrate Withdrawal from the Nutrient Solution. Ann. Bot. 2001, 88, 361–370. [Google Scholar] [CrossRef]
  40. Vos, J.; van der Putten, P.E.L. Effect of nitrogen supply on leaf growth, leaf nitrogen economy and photosynthetic capacity in potato. Field Crop. Res. 1998, 59, 63–72. [Google Scholar] [CrossRef]
  41. Vos, J.; Putten, P.E.L.; van der Birch, C.J. Effect of nitrogen supply on leaf appearance, leaf growth, leaf nitrogen economy and photosynthetic capacity in maize (Zea mays L.). Field Crop. Res. 2005, 93, 64–73. [Google Scholar] [CrossRef]
  42. Guidi, L.; Lorefice, G.; Pardossi, A.; Malorgio, F.; Tognoni, F.; Soldatini, G.F. Growth and photosynthesis of Lycopersicon esculentum (L.) plants as affected by nitrogen deficiency. Biol. Plantarum 1997, 35, 235. [Google Scholar] [CrossRef]
  43. Hirose, T.; Werger, M.J.A. Maximizing daily canopy photosynthesis with respect to the leaf nitrogen allocation pattern in the canopy. Oecologia 1987, 72, 520–526. [Google Scholar] [CrossRef]
  44. Hörtensteiner, S.; Feller, U. Nitrogen metabolism and remobilization during senescence. J. Exp. Bot. 2002, 53, 927–937. [Google Scholar] [CrossRef]
  45. Hocking, P.J.; Steer, B.T. The distribution and identity of assimilates in tomato with special reference to stem reserves. Ann. Bot. 1994, 73, 315–325. [Google Scholar] [CrossRef]
  46. Ende, W.V.; den Peshev, D. Sugars as antioxidants. In Crop improvement under adverse conditions; Springer: New York, NY, USA, 2013; pp. 285–307. [Google Scholar]
  47. Scheible, W.-R.; Lauerer, M.; Schulze, E.-D.; Caboche, M.; Stitt, M. Accumulation of nitrate in the shoot acts as a signal to regulate shoot-root allocation in tobacco. Plant J. 1997, 11, 671–691. [Google Scholar] [CrossRef]
  48. Hermans, C.; Hammond, J.P.; White, P.J.; Verbruggen, N. How do plants respond to nutrient shortage by biomass allocation? Trends Plant Sci. 2006, 11, 610–617. [Google Scholar] [CrossRef]
  49. Paul, M.J.; Driscoll, S.P. Sugar repression of photosynthesis: The role of carbohydrates in signalling nitrogen deficiency through source:sink imbalance. Plant Cell Environ. 1997, 20, 110–116. [Google Scholar] [CrossRef]
  50. Muñoz, P.; Antón, A.; Paranjpe, A.; Ariño, J.; Montero, J.I. High decrease in nitrate leaching by lower N input without reducing greenhouse tomato yield. Agron. Sustain. Dev. 2008, 28, 489–495. [Google Scholar] [CrossRef]
  51. Le Bot, J.; Jeannequin, B.; Fabre, R. Impacts of N-deprivation on the yield and nitrogen budget of rockwool grown tomatoes. Agronomie. 2001, 21, 341–350. [Google Scholar] [CrossRef]
  52. Bénard, C.; Bourgaud, F.; Gautier, H. Impact of temporary nitrogen deprivation on tomato leaf phenolics. Int. J. Mol. Sci. 2011, 12, 7971–7981. [Google Scholar] [CrossRef]
  53. Hoffland, E.; Jeger, M.J.; van Beusichem, M.L. Effect of nitrogen supply rate on disease resistance in tomato depends on the pathogen. Plant Soil 2000, 218, 239–247. [Google Scholar] [CrossRef]
  54. Le Bot, J.; Adamowicz, S. Nitrogen nutrition and use in horticultural crops. J. Crop Improv. 2006, 15, 323–367. [Google Scholar] [CrossRef]
  55. Wang, L.; Qian, C.; Bai, J.; Luo, W.; Jin, C.; Yu, Z. Difference in volatile composition between the pericarp tissue and inner tissue of tomato (Solanum lycopersicum) fruit. J. Food Process Pres. 2017, 42, e13387. [Google Scholar] [CrossRef]
  56. Wang, F.; Smith, A.G.; Brenner, M.L. Temporal and spatial expression pattern of sucrose synthase during tomato fruit development. Plant Physiol. 1994, 104, 535–540. [Google Scholar] [CrossRef]
  57. Brown, M.M.; Hall, J.L.; Ho, L.C. Sugar uptake by protoplasts isolated from tomato fruit tissues during various stages of fruit growth. Physiol. Plantarum 1997, 101, 533–539. [Google Scholar] [CrossRef]
  58. Cheng, Y.-C.; Wang, T.-T.; Chen, J.-H.; Lin, T.-T. Spatial–temporal analyses of lycopene and sugar contents in tomatoes during ripening using chemical shift imaging. Postharvest Biology and Technology. 2011, 62, 17–25. [Google Scholar] [CrossRef]
  59. Van de Poel, B.; Vandenzavel, N.; Smet, C.; Nicolay, T.; Bulens, I.; Mellidou, I.; Vandoninck, S.; Hertog, M.L.; Derua, R.; Spaepen, S.; et al. Tissue specific analysis reveals a differential organization and regulation of both ethylene biosynthesis and E8 during climacteric ripening of tomato. BMC Plant Biol. 2014, 14, 11. [Google Scholar] [CrossRef]
  60. Biais, B.; Bénard, C.; Beauvoit, B.; Colombié, S.; Prodhomme, D.; Ménard, G.; Bernillon, S.; Gehl, B.; Gautier, H.; Ballias, P.; et al. Remarkable Reproducibility of Enzyme Activity Profiles in Tomato Fruits Grown under Contrasting Environments Provides a Roadmap for Studies of Fruit Metabolism. Plant Physiol. 2014, 164, 1204–1221. [Google Scholar] [CrossRef]
  61. Colombié, S.; Nazaret, C.; Bénard, C.; Biais, B.; Mengin, V.; Solé, M.; Fouillen, L.; Dieuaide-Noubhani, M.; Mazat, J.-P.; Beauvoit, B.; et al. Modelling central metabolic fluxes by constraint-based optimization reveals metabolic reprogramming of developing Solanum lycopersicum (tomato) fruit. Plant J. 2015, 81, 24–39. [Google Scholar] [CrossRef]
  62. Rambla, J.L.; Tikunov, Y.M.; Monforte, A.J.; Bovy, A.G.; Granell, A. The expanded tomato fruit volatile landscape. J Exp Bot. 2014, 65, 4613–4623. [Google Scholar] [CrossRef]
  63. Wang, L.; Baldwin, E.A.; Bai, J. Recent Advance in aromatic volatile research in tomato fruit: The metabolisms and regulations. Food Bioproc. Technol. 2016, 9, 203–216. [Google Scholar] [CrossRef]
  64. Fishman, S.; Génard, M. A biophysical model of fruit growth: Simulation of seasonal and diurnal dynamics of mass. Plant Cell Environ. 1998, 21, 739–752. [Google Scholar] [CrossRef]
  65. Fanwoua, J.; Visser, P.H.B.; de Heuvelink, E.; Yin, X.; Struik, P.C.; Marcelis, L.F.M. A dynamic model of tomato fruit growth integrating cell division, cell growth and endoreduplication. Funct. Plant Biol. 2013, 40, 1098–1114. [Google Scholar] [CrossRef]
  66. Beauvoit, B.; Belouah, I.; Bertin, N.; Cakpo, C.B.; Colombié, S.; Dai, Z.; Gautier, H.; Génard, M.; Moing, A.; Roch, L.; et al. Putting primary metabolism into perspective to obtain better fruits. Ann. Bot. 2018, 122, 1–21. [Google Scholar] [CrossRef]
  67. Mozafar, A. Nitrogen fertilizers and the amount of vitamins in plants: A review. J. Plant Nutr. 1993, 16, 2479–2506. [Google Scholar] [CrossRef]
  68. Gautier, H.; Massot, C.; Stevens, R.; Sérino, S.; Génard, M. Regulation of tomato fruit ascorbate content is more highly dependent on fruit irradiance than leaf irradiance. Ann. Bot. 2009, 103, 495–504. [Google Scholar] [CrossRef]
  69. Kaiser, E.; Morales, A.; Harbinson, J.; Kromdijk, J.; Heuvelink, E.; Marcelis, L.F.M. Dynamic photosynthesis in different environmental conditions. J. Exp. Bot. 2015, 66, 2415–2426. [Google Scholar] [CrossRef] [PubMed]
  70. Gomez, L.; Rubio, E.; Auge, M. A new procedure for extraction and measurement of soluble sugars in ligneous plants. J. Sci. Food Agr. 2002, 82, 360–369. [Google Scholar] [CrossRef]
  71. Truffault, V.; Riqueau, G.; Garchery, C.; Gautier, H.; Stevens, R.G. Is monodehydroascorbate reductase activity in leaf tissue critical for the maintenance of yield in tomato? J. Plant Physiol. 2018, 222, 1–8. [Google Scholar] [CrossRef] [PubMed]
Figure 1. Potential photosynthetic rate of every leaf layer of a control plant expressed per square meter of leaves (µmol CO2 m−2 s−1; Figure 1a) and per leaf according to its leaf area (µmol CO2 leaf−1 s−1; Figure 1b). Data on an average of 10 independent plants (dark line). The dots show the individual values for each plant. Separate statistical analyses were conducted for Figure 1a,b. Letters indicate results of statistical analysis according to Tukey’s test: different letters indicate statistical differences.
Agronomy 09 00080 g001
Figure 2. Nitrogen content (Figure 2a), sugar content (Figure 2b) and percentage of dry matter (Figure 2c) of leaves and stems of tomato crops R1 and R2 according to nitrogen supply. Plant material was harvested at the end of the cultivation period. R1N+ and R2N+ are represented respectively in white and dashed bars; R1N− and R2N− respectively by grey and black bars. Errors bars stand for standard deviation. Letters indicate results of statistical analysis according to Tukey’s test: different letters indicate statistical differences.
Agronomy 09 00080 g002
Figure 3. (a) Fructose and glucose contents, (b) citric acid and malic acid contents, (c) starch content, (d) sugar:acid ratio and (e) vitamin C content in pericarp and locular gel during the ripening of tomato fruits of R1 according to nitrogen supply N+ and N−. Fructose, glucose, citric acid and malic acid contents are expressed in g 100g−1 of dry weight. Starch content is expressed in % of dry weight. Sugar:acid ratio has no unit. Vitamin C (reduced + oxidized forms) is expressed in mg 100g−1 of dry weight. Pericarp material is presented in squares with dark lines, locular gel in circles with dotted lines. Black symbol represents N−, white symbol represents N+. Errors bars represent the standard deviation. One star indicates significant difference between nitrogen treatments. Complete statistical analysis is available in Table S4.
Agronomy 09 00080 g003
Table 1. Plant architecture (stem growth and leaf length and width), photosynthetic activity and agronomic performance (yield, average fruit mass and number of marketable and unmarketable fruits) of tomato crops replicates 1 (R1) and 2 (R2) according to nitrogen supply N+ and N−. sd stands for standard deviation. Letters indicate results of statistical analysis according to Tukey’s test: different letters within the row indicate statistical differences.
R1N+R1N−R2N+R2N−
sdTukey’s group sdTukey’s group sdTukey’s group sdTukey’s group
Stem growth (cm week−1)25.5±2.9a25.0±2.5a25.6±2.6a25.7±2.5a
Final length leaf 10 (cm)47.3±3.0a45.6±3.1b47.0±3.5ab46.1±3.0ab
Final width leaf 10 (cm)53.3±2.9a49.9±3.2c52.8±3.5ab51.0±3.1bc
Leaf photosynthetic activity (µmol CO2 m−2 s−1)18.5±4.6a20.1±1.4a17.2±2.5a21.6±1.6a
Marketable yield (kg m−2)49.8±5.1a47.1±1.9a48.7±1.4a46.8±2.6a
Average fruit mass (g)122.3±3.3a117.8±3.9b116.2±3.5bc114.6±3.3c
Marketable fruits (number)407±35a400±13a419±5a408±14a
Unmarketable fruits (number)27.2±3.1ab25.4±2.2b30.1±2.5a24.4±3.4b
Table 2. Nitrogen content of mature leaves removed from the plant according to grower’s practice (deleafing). Data on an average of 5 leaves per month per treatment. sd stands for the standard deviation. Letters indicate results of statistical analysis according to Tukey’s test: different letters indicate statistical differences.
Nitrogen Content
MonthTreatmentµmol N g−1DwsdTukey’s Group
MayN+942.6±148.2a
N−375.8±186.4b
JuneN+752.4±164.6a
N−376.5±180.5b
JulyN+932.6±170.3a
N−294.9±150.5bc
SeptemberN+871.7±271.6a
N−303.6±126.3bc
OctoberN+455.8±127.7b
N−62.8±32.3c
Table 3. Fructose, glucose, citric acid and malic acid contents, sugar:acid ratio and vitamin C content in the pericarp of red (55DAA) tomato fruits of R1 and R2 according to nitrogen supply N+ and N−. Spring, summer and autumn hordes are presented. Values are expressed in g kg−1 of fresh weight, with the exception of vitamin C content which is expressed in mg 100g−1 of fresh weight. sugar:acid ratio was calculated and has no unit. Average data are from 5 samples per treatment and per horde. sd stands for standard deviation. Hordes are analyzed separately. Letters indicate results of statistical analysis according to Tukey’s test: different letters indicate statistical differences between replicates and nitrogen treatments. T-test analysis was performed for vitamin C.
Spring hordeFructoseGlucoseCitric acidMalic acidsugar: acid ratioVitamin C
g kg−1FwsdTukey’s groupg kg−1FwsdTukey’s groupg kg−1FwsdTukey’s groupg kg−1FwsdTukey’s group sdTukey’s groupmg 100g−1Fwsdt-test
R1N+77.0±5.8a77.9±6.1a18.4±1.8ab1.8±0.6a7.7±0.6ab12.7±1.2ns
R1N−77.8±2.3a76.0±3.7a17.7±1.8ab1.5±0.9a8.2±1.3ab11.6±1.2ns
R2N+74.1±9.8a75.7±11a20.4±1.9a2.1±0.3a6.7±1.0b
R2N−77.8±5.9a76.9±6.8a15.9±1.4b1.3±0.6a9.0±0.9a
Summer hordeFructoseGlucoseCitric acidMalic acidsugar:acid ratioVitamin C
g kg−1FwsdTukey’s groupg kg−1FwsdTukey’s groupg kg−1FwsdTukey’s groupg kg−1FwsdTukey’s group sdTukey’s groupmg 100g−1Fwsdt-test
R1N+78.6±3.8a78.6±3.9a21.6±1.9ab5.8±0.5a5.8±0.5b9.1±0.7ns
R1N−84.5±5.8a80.6±5.5a17.7±1.4b2.2±0.4b8.4±0.6a10.0±1.1ns
R2N+77.3±3.7a77.7±4.6a22.5±2.8a3.7±1.3ab6.0±0.4b
R2N−79.3±3.9a75.2±3.0a17.4±2.6b2.3±0.5b8.0±1.0a
Autumn hordeFructoseGlucoseCitric acidMalic acidsugar:acid ratioVitamin C
g kg−1FwsdTukey’s groupg kg−1FwsdTukey’s groupg kg−1FwsdTukey’s groupg kg−1FwsdTukey’s group sdTukey’s groupmg 100g−1Fwsdt-test
R1N+71.5±6.3b70.9±5.5a20.5±1.6ab12.0±1.7a4.5±0.3c7.5±1.5ns
R1N−77.8±6.5ab74.6±7.2a19.3±2.6ab7.0±0.8b5.9±0.6b9.3±1.1ns
R2N+77.7±6.1ab76.2±7.4a24.1±2.6a6.9±2.3b5.1±0.5bc
R2N−85.1±4.8a80.4±4.5a18.5±1.3b4.8±2.4b7.2±0.7a

