Article

Variability among Young Table Grape Cultivars in Response to Water Deficit and Water Use Efficiency

by
Carolin Susanne Weiler
1,*,
Nikolaus Merkt
2,
Jens Hartung
3 and
Simone Graeff-Hönninger
1
1
Institute for Crop Science, University of Hohenheim, Fruwirthstr. 23, 70599 Stuttgart, Germany
2
Institute for Crop Science, Quality of Plant Products, University of Hohenheim, Emil-Wolff-Str. 25, 70599 Stuttgart, Germany
3
Institute for Crop Science, Biostatistics, University of Hohenheim, Fruwirthstr. 23, 70599 Stuttgart, Germany
*
Author to whom correspondence should be addressed.
Submission received: 28 January 2019 / Revised: 8 March 2019 / Accepted: 11 March 2019 / Published: 15 March 2019
(This article belongs to the Special Issue Viticulture and Winemaking under Climate Change)

Abstract

:
Climate change will lead to higher frequencies and durations of water limitations during the growing season, which may affect table grape yield. The aim of this experiment was to determine the variability among 3-year old table grape cultivars under the influence of prolonged water deficit during fruit development on gas exchange, growth, and water use efficiency. Six own rooted, potted table grape cultivars (cv. ‘Muscat Bleu’, ‘Fanny’, ‘Nero’, ‘Palatina’, ‘Crimson Seedless’ and ‘Thompson Seedless’) were subjected to three water deficit treatments (Control treatment with daily irrigation to 75% of available water capacity (AWC), moderate (50% AWC), and severe water deficit treatment (25% AWC)) for three consecutive years during vegetative growth/fruit development. Water deficit reduced assimilation, stomatal conductance, and transpiration, and increased water use efficiencies (WUE) with severity of water limitation. While leaf area and number of leaves were not affected by treatments in any of the tested cultivars, the response of specific leaf area to water deficit depended on the cultivar. Plant dry mass decreased with increasing water limitation. Overall, high variability of cultivars to gas exchange and water use efficiencies in response to water limitation was observed. ’Palatina’ was the cultivar having a high productivity (high net assimilation) and low water use (low stomatal conductance) and the cultivar ‘Fanny’ was characterized by the highest amount of total annual dry mass as well as the highest total dry mass production per water supplied during the experiment (WUEDM). Hence, ‘Fanny’ and ‘Palatina’ have shown to be cultivars able to cope with water limiting conditions and should be extensively tested in further studies.

1. Introduction

Climate change and the resulting alterations in temperature, precipitation as well as frequency and duration of extreme weather events, have a huge impact on crop production worldwide and will result in positive and negative changes in the quality and quantity of agricultural products [1]. Water will be one of the most limiting factors for agricultural crop production [2]. According to the IPCC [3], the central and southern part of Europe will have a higher risk of summer droughts due to increasing temperatures and annual precipitation decreases [3]. Additionally, more frequent and intense heat waves will occur all over Europe [3]. High temperatures and decreasing water availability might make Southern Europe unsuitable for wine as well as for table grapes, while northern and central Europe may offer better growing conditions. Increasing temperatures in northern and central Europe will result in an enlarged production area, which will continue to extend further north [4,5,6]. Climate conditions in regions from France and Germany will likely resemble to those located in the Mediterranean Basin [7]. Due to very high annual yields and high water requirements, table grape production has already been affected and will be more affected in the future by water shortages [8].
Adaptations of table grape production to changing environmental conditions are possible but will require additional irrigation, time-consuming breeding, or the selection of drought tolerant cultivars, which are able to cope with limited water availability. Until now, most research in the field of water limitation was done on vines and very few studies exist for table grapes, such as ‘Crimson Seedless’ [9,10] and ‘Thompson Seedless’ [11]. From our knowledge, no screening was done yet on the cultivars cultivated in Germany, especially with regard to their physiological and growth response to water deficit, their ability to use water efficiently, and their potential to grow under water limiting conditions in the future. Within several studies, grapevine cultivars showed a high variability to water limitation on leaf and on whole-plant level parameters. This was demonstrated under water-stress [12,13,14] and also under non-stressed conditions [15,16]. Screenings can be based on direct or indirect measurements for the determination of water limitation on the physiological level. Non-destructive gas exchange measurements on a single leaf are often used as an indicator for the detection of water stress in plants, as stomatal closure is one of the first adaptable plant responses to water limitation, and will result in limiting plant water losses [17,18]. While protecting plants against water loss, the closure of stomata will also reduce the amount of assimilated carbon [18], which can decrease yield and reduce the quality of table grapes. Furthermore, additional observations on the plant-level are important to evaluate the impact of water deficit on table grape cultivars, as grapevines adapt to water limitation by decreasing leaf area, reducing the number of leaves, and limiting growth rate [19,20]. Water use efficiency (WUE) can be calculated on a single-organ or on whole canopy scale. On leaf-scale, WUE can be distinguished between intrinsic WUE (WUEi) and instantaneous WUE (WUEinst). WUEi represents the link between net assimilation of CO2 (An) and the stomatal conductance of water (gs) [21] and WUEinst of An and transpiration (E). Both leaf-level WUE are used as parameters to characterize genetic as well as environmental effects [16,22,23]. Plant-level WUE is expressed as the accumulation of biomass per water lost/used [24,25] and shows the response of the plant during the growing season. In contrast to leaf-level WUE, plant-level WUE is not based on a single gas exchange measurement at a specific time and environmental conditions. The main objective of the present work was to determine the influence of water deficit on growth, physiology, and WUEs of six 3-year old table grape cultivars and to indentify possible cultivars able to cope with water limitation.

2. Materials and Methods

2.1. Plant Material and Treatments

The experiment was conducted from 2014 to 2016 on potted, own rooted table grapes in a greenhouse of the University of Hohenheim, Germany. Overall, six table grape cultivars (‘Muscat Bleu’, ‘Nero’, ‘Fanny’, ‘Palatina’, ‘Crimson Seedless’, and ‘Thompson Seedless’) subjected to three water deficit levels were tested with eight replications/plants per combination (six cultivars × three treatments × eight replications). For the current study, only data of 2016 was analyzed. For experimental setup, a non resolvable block design was chosen as it allows to cover a potential temperature gradient within the greenhouse.
The plant material of the table grape cultivars ‘Thompson Seedless’ and ‘Crimson Seedless’ originated from Israel (The Volcani Center, ARO, Bet-Dagan, Israel), while the other cultivars were obtained from Germany (Rebveredlung Kühner, Lauffen, Germany). One-bud cuttings of all cultivars were grown in sand, kept hydrated until they grew 4 to 6 leaves and developed a sufficient root. Twenty-four plants per cultivar were transplanted in 7-L pots with six kilograms of a loam, sand, and peat mixture (40:50:10, % per volume) in July 2014, with a maximum water holding capacity of 37.8%. During the consecutive three-year experiment, plants were kept at field capacity before and after stress treatment. Additionally, plants were fertilized biweekly with 1 g Hakapos® Blue (N 15% + P 10% + K 15% + Mg 2%) (CAMPO EXPERT, Münster, Germany) and 0.1 g Fetrilon ®1 Combi (BASF, Ludwigshafen, Germany). Treatments and experiment information (timeframe, no. of weeks of water deficit treatment, and BBCH) are summarized in Table 1. The first water deficit treatment started in 2014, after an establishment phase of 16 weeks. In the second year, water was limited during vegetative growth starting at an average shoot height of 60 cm and 6 to 8 leaves for 10 weeks. Furthermore, grapevines developing inflorescences were defruited before the treatments started. In 2016, table grapes were kept well-watered during flowering and water deficit treatments started at fruit set and ended at harvest. Over the entire three-year experiment, plants were maintained with only one shoot, attached to bamboo sticks.
For determining the water usage of every plant during the imposition of water deficit, plant and soil water loss was measured gravimetrically on a daily basis using a platform scale (FKB 36K0.1, KERN, KERN & SOHN GmbH, Balingen, Germany) with a maximum range of 36 kg and 0.1 g accuracy. Control plants were irrigated daily to 75% available water content (AWC), moderate to 50% AWC, and severe deficit to 25% AWC. Before starting the treatment, AWC was determined for each pot/plant individually by flooding the pots after sunset to avoid transpiration losses. The excess water was able to drain overnight. Before sunrise, pots were weighed to get the maximum pot weight/field capacity. Wilting point was considered as the minimum weight of the pots. Therefore, all pots were dried out until a constant weight was reached and plants started wilting. Plants were rewatered and adjusted to the plant-pot specific weight. The following formula was used to calculate the individual pot weight for every plant in the treatments:
Individual   Pot   Weight = PotMin + ( PotMax PotMin ) · Treatment
Within Formula (1), we used 0.75, 0.5, and 0.25 of the total available water content for the respective treatments (Control (75% AWC), moderate (50% AWC), and severe (25% AWC)).
During 2014 and 2015, pot weight was not adjusted to the increasing plant weight during the water deficit treatment. In 2016, due to additional bunch weight, pot weight for irrigation was modified by including bunch weights at veraison. Therefore, bunch weights were determined individually by a handheld scale and their weight was added to the corresponding pot’s weight. Irrigation during water deficit treatment was applied daily, by the gravimetric determination of water used by each plant/pot and manually refilling to the plant specific weight, calculated with Formula (1).
During the water deficit treatment in 2016, temperature and relative humidity were measured in five-minute intervals using a datalogger (TGP-4500, Gemini Data Loggers, Chichester, UK). Mean temperature over the experimental period in 2016 was 21.8 °C and relative humidity was 63.9% (Figure 1). Vapour-pressure deficit was calculated based on measured values of temperature and relative humidity and ranged between 0.42–1.74 kPa.

2.2. Plant Water Status

The plant water status was estimated by measuring predawn leaf water potential (Ψpd) in two consecutive nights before harvest. Measurements were performed with a pressure chamber at harvest, according to the methodology developed by Scholander et al. [26] on one leaf per plant before dawn (03.00 to 06.00 a.m.).

2.3. Gas Exchange Measurements

Net assimilation (An), transpiration (E), stomatal conductance (gs), and intercellular CO2 (Ci) were measured using the portable gas exchange system GFS 3000 (Walz, Effeltrich, Germany) on one mid plant level leaf of every plant per cultivar–treatment combination. The system was equipped with the Basic System Package, including the Control Unit 3100-C, Standard Measuring Head 3010-S, and LED Light Source 3040-L (90% red and 10% blue light). Measurements were carried out within a timeframe of six days before harvest (10:00 a.m.–06:00 p.m.). Gas exchange was determined on an area of four cm2 with a flowing rate of 750 µmol s−1 and impeller setting of 7. For the simulation of future climate conditions, a PPFD intensity of 1300 µmol m−2s−1, 400 ppm CO2, a temperature of 30 °C, and relative humidity of 50% were configured as the chamber environment.
Instantaneous WUE was calculated by An/E and intrinsic WUE by An/gs.

2.4. Plant Dry Weight and Leaf Area

The total leaf area (LA), dry mass (DM) of leaves, stems, and petioles were determined and the number of leaves were counted at harvest for each vine individually. Total leaf area was determined using an LI-3100C Area Meter (LI-COR, Lincoln, NE, USA). Dry mass was measured after drying at 60 °C until reaching constant weight. Specific leaf area (SLA) (cm2 g−1) was calculated as the ratio of LA and leaf dry mass and total dry mass water use efficiency (WUEDM) as the ratio of total plant dry mass and water supplied during the experimental period (g L−1).

2.5. Statistical Analysis

The physiological response of leaf-level gas exchange, WUEi and WUEinst, Ψpd, growth parameters, and WUEDM of six table grape cultivars (cultivars: 6) subjected to three water deficit stress levels (treatments: 3) were analyzed using PROC MIXED (SAS version 9.2., SAS Institute Inc., Cary, NC, USA) with the following model:
y i j k l = μ + t k + b k l + τ i + φ j + ( τ φ ) i j + e i j k l ,
where μ is the general effect, t k and b k l are random block effects for the kth table and the lth block on the kth table, respectively. τ i , φ j , and ( τ φ ) i j corresponds to fixed main effects of the ith cultivar and jth water deficit treatment and their interaction effects, respectively. e i j k l are the error effects of observations y i j k l . Residuals were checked graphically for normality and homogeneity of variances. To reach normality and homogeneity of variances, data of E and gs needed to be square-root transformed prior to analysis. Data of WUEi, WUEinst, LA, total DM, WUEDM, and Ψpd were log-transformed. In case of a significant F-test, multiple comparisons for levels of the corresponding factor were done based on LSD (α = 0.05). Significant differences were presented using a letter display created by the SAS macro %mult [27]. Within the letter display, capital letters show significant differences among cultivars in one or for all water deficit treatments. Lower case letters indicate significances among treatments in one cultivar or for all cultivars. If data needed transformation before analysis, statistical analysis are based on the transformed data. However, the same statistical analysis was conducted for transformed and non-transformed data. For the presentation of the results, transformed data were back-transformed (back-transformation: LOG: y = ex; square-root: y = x2). However, the corresponding letter display is based on previously transformed data.

3. Results

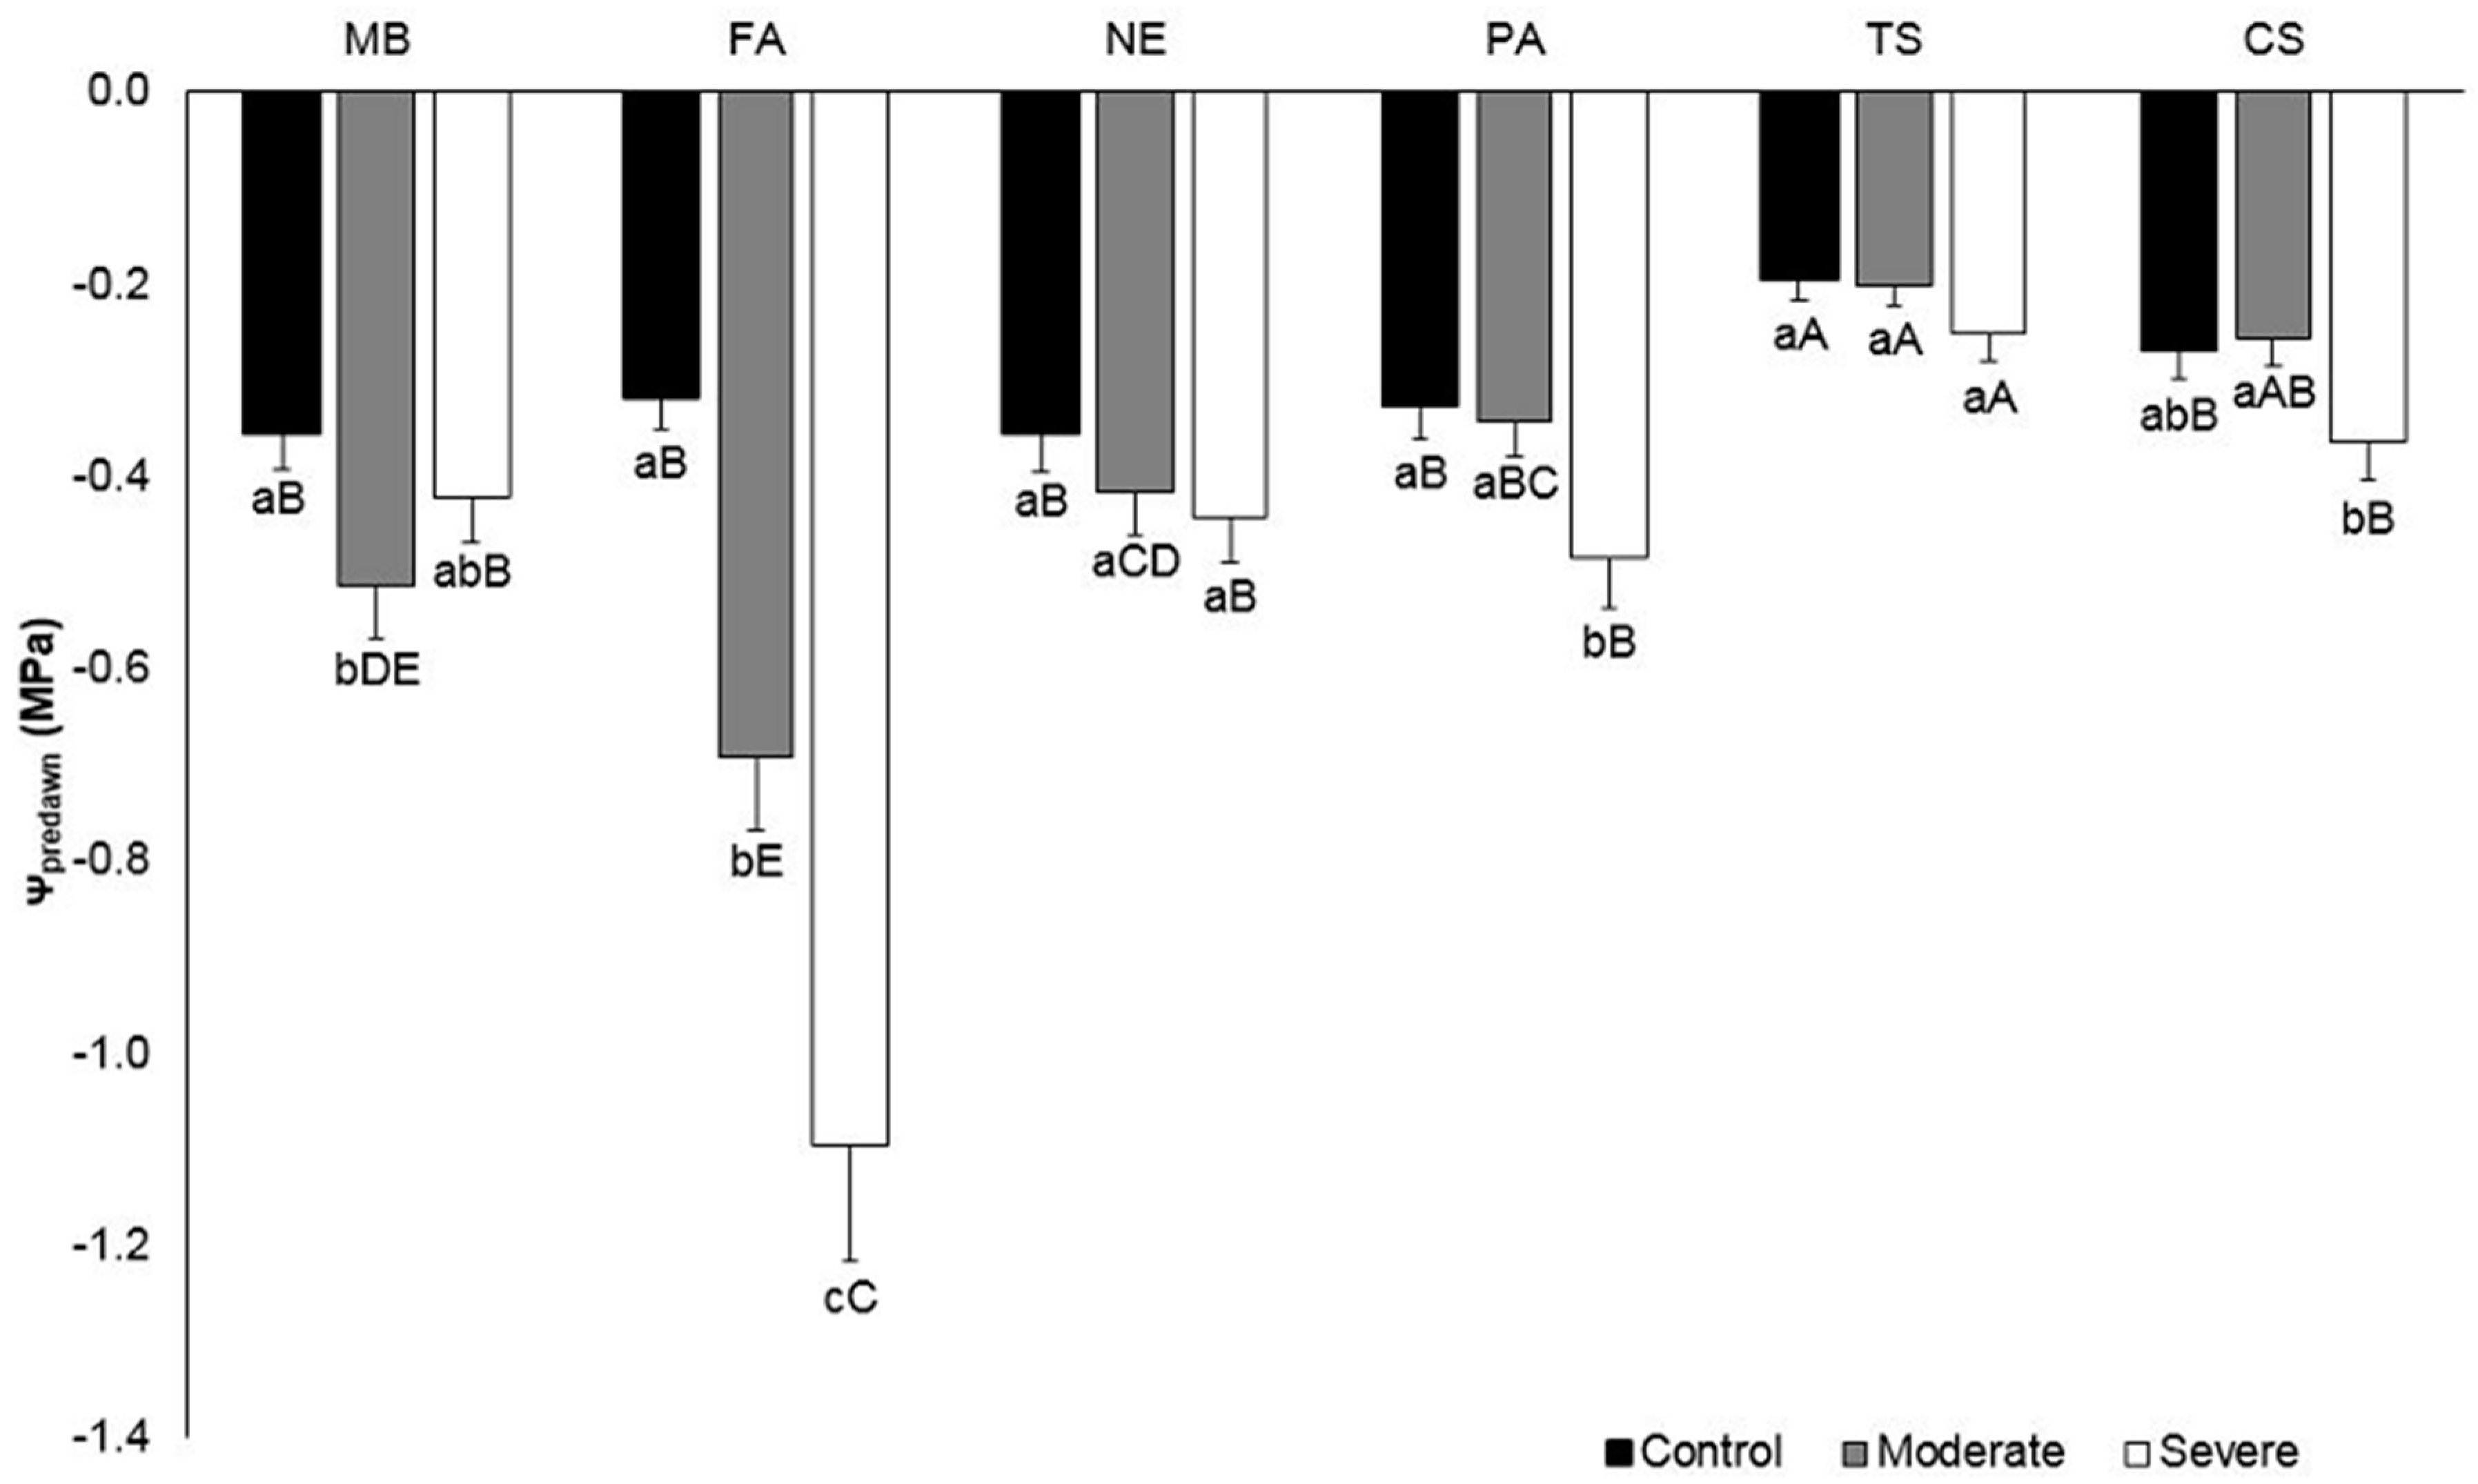
3.1. Plant Water Status

Predawn leaf water potential (Ψpd) showed significant interactions between cultivar and treatment. Ψpd values for the control treatment ranged between −0.2 to −0.36 MPa, for the moderate treatment between −0.2 to −0.69 MPa, and for the severe treatment between −0.25 to −1.10 MPa (Figure 2). For ‘Fanny’, all treatments differed significantly from each other and Ψpd decreased (−0.32 to −1.1 MPa) when water deficit intensified. Differences between the control and severe treatments were observed for ‘Palatina’ (−0.33 to −0.48 MPa) and ‘Crimson Seedless’ (−0.27 to −0.36 MPa), while no differences between treatments for ‘Nero’ and ‘Thompson Seedless’ were observed. When comparing cultivars within the treatments, ‘Thompson Seedless’ was the cultivar that differed the most from other cultivars and had the least negative Ψpd. In contrast, the most negative Ψpd was observed in ‘Fanny’ with a moderate (−0.69 MPa) and severe water deficit (−1.1 MPa).

3.2. Gas Exchange Measurement

Gas exchange parameters differed significantly between cultivars and treatments (Table 2). ‘Fanny’ had the highest rate of all cultivars (10.96 µmol m−2s−1), while ‘Muscat Bleu’ (5.18 µmol m−2s−1), ‘Thompson Seedless’ (5.78 µmol m−2s−1), and ‘Crimson Seedless’ (4.16 µmol m−2s−1) were the cultivars with lowest assimilation rates. Similar results were observed for E and gs, where ‘Thompson Seedless’, ‘Crimson Seedless’, and ‘Muscat Bleu’ had approximately 55 to 60% lower transpiration and 58 to 63% lower stomatal conductance in comparison to ‘Fanny’. The highest Ci was found in ‘Nero’ with 245.48 µmol m−2s−1, whereas ‘Palatina’ (143.91 µmol m−2s−1) and ‘Thompson Seedless’ (161.58 µmol m−2s−1) had the smallest Ci values. WUEinst and WUEi were highest for ‘Palatina’ with 6.42 µmol CO2 mmol−1 H2O and 0.16 µmol CO2 mmol−1 H2O respectively, but did not differ significantly from ‘Thompson Seedless’, ‘Fanny’, and ‘Muscat Bleu’. ‘Nero’, on the other hand, represented the least efficient cultivar at this development stage with 45% lower instantaneous and 47% lower intrinsic WUE compared to ‘Palatina’. Among the treatments, all parameters differed significantly between the control and severe water deficit. Control vines had the highest E (1.85 mmol m−2s−1) and gs (77.83 mmol m−2s−1), followed by moderately stressed plants (E = 1.51 mmol m−2s−1, gs = 62.24 mmol m−2s−1), and the lowest values were found in plants treated with severe water deficit (E = 0.94 mmol m−2s−1, gs = 37.6 mmol m−2s−1). For An, Ci, and both leaf-level WUEs, control and moderate treatments did not significantly differ from each other. Vines under severe water deficits had a 22 to 29% lower An and 22 to 26% lower Ci, while WUEi and WUEinst increased by approximately 22 to 30% and 19 to 26%, respectively.

3.3. Growth Parameters, Dry Mass Partitioning, and Plant WUE

Leaf area differed significantly within the cultivars but was not affected by treatments. ‘Crimson Seedless’ was the cultivar that produced the highest LA (1921 cm2), followed by ‘Thompson Seedless’ (1660 cm2), ‘Nero’ (1213 cm2), ‘Palatina’ (1211 cm2), ‘Fanny’ (1168 cm2), and lastly ‘Muscat Bleu’ (1116 cm2) (Table 3). For SLA, significant interactions of treatment and cultivar were observed. Though ‘Fanny’, ‘Palatina’, and ‘Thompson Seedless’ showed no differences between treatments, SLA of ‘Crimson Seedless’ significantly decreased with increasing water limitation. Additionally, ‘Nero’ reached the highest SLA values under severe water deficit conditions (159.73 cm2 g−1). Within all levels of treatments, we observed the highest SLA for ‘Fanny’ and ‘Crimson Seedless’. In contrast, the lowest values were found in ‘Palatina’ and ‘Nero’. Differences between cultivars were determined by the number of leaves per plant (Table 3), where ‘Crimson Seedless’ produced the most leaves (20.5) while ‘Fanny’ and ‘Muscat Bleu’ only formed 12 and 9.8 leaves per plant, respectively. However, no differences between the water deficit levels were observed for any of the cultivars studied. Significant effects of treatment and cultivar were found for the total annual DM production and resulting WUE (Table 3). Among all cultivars, ‘Fanny’ had the highest values with a DM of 61.35 g and WUE of 0.08 g L−1. ‘Thompson Seedless’ (30.12 g) produced the least amount of dry mass but did not differ significantly from ‘Crimson Seedless’ (30.45 g). Due to high water usage of both cultivars during the experiment, WUE was 55 to 58% lower than ‘Fanny’. Besides cultivar, deficit treatment led to significant differences in both parameters. Severely stressed vines had 10 to 12% higher annual DM production as well as 19 to 33% higher WUE than the moderate treatment and the control.
Total annual dry mass production of vines and relative dry mass production of fruit, leaves, stem, and petioles are shown in Table 3 and Table 4. Overall, we determined significant differences between cultivars regarding leaves, petioles, and fruit dry mass. Petioles were also affected by the water deficit treatments (Table 4). For stem dry mass, significant interactions between cultivar and treatment have been determined. ‘Fanny’ had the highest fruit dry mass and the lowest DM of leaves, stem, and petioles, while ‘Crimson Seedless’ had the highest dry mass of leaves, and petioles, but no plant of ‘Crimson Seedless’ produced fruit. Lowest dry mass of leaves and petioles were determined for ‘Fanny’ (6.9 g and 1.08 g).

4. Discussion

At the end of the water deficit treatments, cultivars showed a high variation in plant water potential when exposed to water limitation. According to Ojeda et al. [28], who defined four levels of water deficit, the cultivar suffering from the most severe water stress was ‘Fanny’ with about −1.1 MPa at the end of the treatment, while ’Thompson Seedless’ had a stress level that ranged between none to weak stress (−0.2 to −0.25 MPa). Differential behaviors and responses of plant water potential to water deficit were described by Costa et al. [29] for the cultivars ‘Aragonez’ and ‘Trincadeira’. In the study of Ojeda et al. [28], they also determined Ψpd continuously during the experiment and Ψpd of the stress treatment showed high variations. At some measurements, they could observe only a weak or non-existent stress level. In our study, only minor differences between the levels of water deficit were found for some cultivars. Based on the studies of Ezzahouani and Williams [30] and Wenter et al. [31], who determined decreasing Ψpd values towards the end of stress/growing season, plants with highest water limitation could have experienced a period with severe water stress (defined by Ojeda et al. [28]) in this study. In order to identify differences in the behavior of different cultivars to water limitation during the experimental period, additional measurements of water potential should be carried out before and during the experimental period.
Even though no clear results were found for Ψpd, gas exchange measurements and leaf-level WUE showed a definite reaction to water limitation. For gs, rates decreased when the deficit intensified, which is in accordance with other studies on grapevines [13], table grapes [10], and rootstocks [32,33]. Since stomata closure is the first reaction to water limitations [34], gs is often used as a non-destructive indicator to detect water stress. Therefore, water stress was classified into three levels. The first level of mild water stress is defined by gs from 150 to 500 mmol H2O m−2s−1 (≙max. gs), the second level of moderate water stress by gs between 50 to 150 mmol H2O m−2s−1, and the third level of severe water stress by gs < 50 mmol H2O m−2s−1 [34,35]. According to these definitions, the control and the moderate treatment had a moderate water stress level at harvest, while vines subjected to severe water deficit had gs values within the third level of water stress. As a consequence of increasing stomatal closure, we observed a downregulation of An when water deficit intensified. Previous studies observed similar results and determined a curvilinear relationship of An and gs [34,35]. Furthermore, the range of An and gs values are in agreement with studies by Chaves et al. [36] and Jara-Rojas et al. [37]. Decreasing Ci values with intensified water limitation, as observed in our study, imply stomatal limitations as the dominant factor for regulation at moderate stress [38,39], while the dominant factors for an upregulation of Ci, at the threshold value of gs (50 mmol H2O m−2s−1), are non-stomatal limitations [38]. As we could not determine increasing Ci at the threshold value within our study, stomatal closure may have led to decreasing gs values. As a result of a higher decrease of gs and E than An, both leaf-level WUEs increased with severity of water deficit. Medrano et al. [34] described similar results, where gs decreased by 50% while An only decreased by 30% when the deficit progressed and led to higher WUE values when the water deficit intensified. Based on the observations for gs, An, E, Ci, and leaf-level WUEs, our results indicate stomatal limitations as the limiting factor for lower An values in table grapes exposed to severe water limitation. The stomatal limitation could have been caused by increasing ABA concentration within xylem sap [33,40,41] and/or decrease of hydraulic conductance [33,42,43], as they are considered as main factors regulating stomatal conductance. Besides the effect of water deficit treatment, cultivar selection had a major influence on all gas exchange parameters and WUEleaf. Variations and differences among grapevine cultivars in gas exchange under non-limiting and limiting water conditions were observed in several studies [13,44,45] and the response to water limitation is highly dependent on environmental conditions [45]. However, results obtained by gas exchange measurements could be overestimated, due to the possible occurrence of non-uniform closure of stomata (patchiness) in grapevines, when subjected to water deficit [46]. Furthermore, single leaf WUEs are limited due to high variability of measurements within the canopy, differences in leaf-response to the cumulative daily irradiance and leaf age, as young leaves have a higher gas exchange than older leaves [24]. Within our study, we determined differences among the cultivars for plant-level WUEDM. The result of a high variability of cultivars are conform with other grapevine studies, comparing whole plant WUE (WUEWP) of 19 cultivars under well-watered conditions in a glasshouse [47] or eight cultivars under well-watered and water-stressed conditions [12]. In contrast to our study, Palliotti et al. [44] could not find any differences in the measurement of whole plants WUECanopy with regard to the response to higher water limitation. The comparison of results based on whole plants in relation to water stress is problematic and difficult, as the results are based, among other things, on gas exchange measurements of the canopy [44], biomass growth during the experiment [12], or, as in our study, on the total dry matter of the plant. When comparing leaf and plants WUEs, we observed increasing efficiencies with increasing water deficits, while in other studies no clear relationship was found between leaf and plant WUEs [24,44]. Medrano et al. [24] suggested the analysis of additional physiological parameters to reveal cultivar specific responses.
In most studies investigating the influence of water deficiency on plant growth and the adaptation of plants to the limited availability of soil water, it was observed that leaf area, dry matter, and number of leaves decreased in response to water limitation [19]. In our study, leaf area and the number of leaves were not negatively affected by the water deficit, in contrast to the results of Gomez-del-Campo et al. [20] where less leaf area was produced under water limiting conditions and the number of leaves was lower than under well-watered conditions. Plant growth, indicated by annual dry mass production, decreased, when the deficit was more severe which is in accordance with the study of Toumi et al. [19]. Within the study of Tardieu et al. [48], SLA was reported to decrease, if environmental conditions led to greater reduction of growth than on photosynthesis [48]. Therefore, it is used as a tool for the detection of changes in leaf structure [49,50]. Within our study, response of SLA depended on cultivar–treatment. Only SLA values of ‘Crimson Seedless’ decreased with increasing water limitation, indicating a higher influence of water deficit conditions on growth than on photosynthesis. While no clear behavior of the cultivars with regard to water deficit could be determined for SLA, differences could be determined for dry mass. A severe water deficit led to a lower dry mass. Since An rates and dry mass production have a close relationship [51], the reduced carbon assimilation, as an effect of closed stomata, could have led to a decrease in dry mass production in severely stressed plants within our study. Reductions of plant dry matter in case of a severe water deficit are in line with other studies [19,33] and indicated reduced plant growth due to a prolonged water deficit during fruit development and ripening. Cultivar differences, as they occurred in this study, were also observed by Gómez del Campo et al. [52,53], where cultivar selection and cultivar–irrigation interactions were the main factors influencing leaf area, number of leaves, SLA, and dry mass production [53,54,55].

5. Conclusions

Based on the obtained results, we identified gas exchange and water use efficiencies of table grapes to be affected by cultivar and by water deficit treatment. Since high productivity (high An) with low water loss (gs) is a selection criterion for cultivation in water limiting environments, ‘Palatina’ could be a possible cultivar for cultivation under these environmental conditions. In addition. ‘Fanny’ appeared to be the cultivar least influenced by the deficit treatment. Hence, under changing climatic conditions with increasingly limited water availability during the growing period, ‘Palatina’ and ‘Fanny’ seem to be the most promising table grape cultivars of our study. However, further studies in the field under limited water conditions, as well as grafting on different rootstock, are necessary to confirm the ability of these cultivars to cope with water limitations.

Author Contributions

Conceptualization, C.S.W., N.M. and S.G.-H.; Data curation, C.S.W.; Formal analysis, C.S.W. and J.H.; Funding acquisition, C.S.W. and S.G.-H.; Investigation, C.S.W.; Methodology, C.S.W. and S.G.-H.; Project administration, C.S.W. and S.G.-H.; Resources, C.S.W., N.M. and S.G.-H.; Supervision, N.M. and S.G.-H.; Validation, C.S.W. and S.G.-H.; Visualization, C.S.W.; Writing – original draft, C.S.W.; Writing – review & editing, C.S.W., N.M., J.H. and S.G.-H.

Funding

This research was funded by the Anton & Petra Ehrmann-Stiftung Research Training Group “Water People Agriculture”.

Acknowledgments

We want to thank Folkard Asch and his department for providing the gas-exchange measuring system “Walz GFS-3000” and especially Marc Schmierer for his help and support. This study was conducted within the framework of the Anton & Petra Ehrmann-Stiftung Research Training Group “Water People Agriculture” at the University of Hohenheim.

Conflicts of Interest

The authors declare no conflict of interest. The founding sponsors had no role in the design of the study; in the collection, analyses, or interpretation of data; in the writing of the manuscript, and in the decision to publish the results.

References

  1. IPCC. Climate Change 2014: Synthesis Report. Contribution of Working Groups I, II and III to the Fifth Assessment Report of the Intergovernmental Panel on Climate Change; IPCC: Geneva, Switzerland, 2014. [Google Scholar]
  2. Costa, J.M.; Ortuño, M.F.; Chaves, M.M. Deficit irrigation as a strategy to save water: Physiology and potential application to horticulture. J. Integr. Plant Biol. 2007, 49, 1421–1434. [Google Scholar] [CrossRef]
  3. IPCC. Climate Change 2014: Impacts, Adaptation, and Vulnerability. Part B: Regional Aspects. Contribution of Working Group II to the Fifth Assessment Report of the Intergovernmental Panel on Climate Change; Cambridge University Press: Cambridge, UK; New York, NY, USA, 2014; ISBN 9781107683860. [Google Scholar]
  4. Moriondo, M.; Bindi, M.; Fagarazzi, C.; Ferrise, R.; Trombi, G. Framework for high-resolution climate change impact assessment on grapevines at a regional scale. Reg. Environ. Chang. 2011, 11, 553–567. [Google Scholar] [CrossRef]
  5. Fraga, H.; Santos, J.A.; Malheiro, A.C.; Oliveira, A.A.; Moutinho-Pereira, J.; Jones, G.V. Climatic suitability of Portuguese grapevine varieties and climate change adaptation. Int. J. Climatol. 2016, 36, 1–12. [Google Scholar] [CrossRef]
  6. Fraga, H.; García de Cortázar Atauri, I.; Malheiro, A.C.; Santos, J.A. Modelling climate change impacts on viticultural yield, phenology and stress conditions in Europe. Glob. Chang. Biol. 2016, 22, 3774–3788. [Google Scholar] [CrossRef] [PubMed]
  7. Fraga, H.; Malheiro, A.C.; Moutinho-Pereira, J.; Santos, J.A. Future scenarios for viticultural zoning in Europe: Ensemble projections and uncertainties. Int. J. Biometeorol. 2013, 57, 909–925. [Google Scholar] [CrossRef] [PubMed]
  8. Permanhani, M.; Costa, J.M.; Conceição, M.A.F.; de Souza, R.T.; Vasconcellos, M.A.S.; Chaves, M.M. Deficit irrigation in table grape: Eco-physiological basis and potential use to save water and improve quality. Theor. Exp. Plant Physiol. 2016, 28, 85–108. [Google Scholar] [CrossRef]
  9. Pinillos, V.; Chiamolera, F.M.; Ortiz, J.F.; Hueso, J.J.; Cuevas, J. Post-veraison regulated deficit irrigation in “Crimson Seedless” tablegrape saves water and improves berry skin color. Agric. Water Manag. 2015, 165, 181–189. [Google Scholar] [CrossRef]
  10. Conesa, M.R.R.; de la Rosa, J.M.M.; Domingo, R.; Bañon, S.; Pérez-Pastor, A. Changes induced by water stress on water relations, stomatal behaviour and morphology of table grapes (cv. Crimson Seedless) grown in pots. Sci. Hortic. 2016, 202, 9–16. [Google Scholar] [CrossRef]
  11. Williams, L.E. Effects of applied water amounts at various fractions of evapotranspiration (ETc) on leaf gas exchange of Thompson Seedless grapevines. Aust. J. Grape Wine Res. 2012, 18, 100–108. [Google Scholar] [CrossRef]
  12. Tomás, M.; Medrano, H.; Pou, A.; Escalona, J.M.; Martorell, S.; Ribas-Carbó, M.; Flexas, J. Water-use efficiency in grapevine cultivars grown under controlled conditions: Effects of water stress at the leaf and whole-plant level. Aust. J. Grape Wine Res. 2012, 18, 164–172. [Google Scholar] [CrossRef]
  13. Bota, J.; Tomás, M.; Flexas, J.; Medrano, H.; Escalona, J.M. Differences among grapevine cultivars in their stomatal behavior and water use efficiency under progressive water stress. Agric. Water Manag. 2016, 164, 91–99. [Google Scholar] [CrossRef]
  14. Bota, J.; Flexas, J.; Medrano, H. Genetic variability of photosynthesis and water use in Balearic grapevine cultivars. Ann. Appl. Biol. 2001, 138, 353–361. [Google Scholar] [CrossRef]
  15. Tortosa, I.; Escalona, J.M.; Bota, J.; Tomas, M.; Hernandez, E.; Escudero, E.G.; Medrano, H. Exploring the genetic variability in water use efficiency: Evaluation of inter and intra cultivar genetic diversity in grapevines. Plant Sci. 2016, 251, 35–43. [Google Scholar] [CrossRef] [PubMed] [Green Version]
  16. Tomás, M.; Medrano, H.; Escalona, J.M.; Martorell, S.; Pou, A.; Ribas-Carbó, M.; Flexas, J. Variability of water use efficiency in grapevines. Environ. Exp. Bot. 2014, 103, 148–157. [Google Scholar] [CrossRef]
  17. Schulze, E. Carbon dioxide and water vapor exchane in repsponse to drought in the atmosphere and in the soil. Annu. Rev. Plant Physiol. 1986, 37, 247–274. [Google Scholar] [CrossRef]
  18. Chaves, M.M. Effects of water deficits on carbon assimilation. J. Exp. Bot. 1991, 42, 1–16. [Google Scholar] [CrossRef]
  19. Toumi, I.; M’Sehli, W.; Bourgou, S.; Jallouli, N.; Bensalem-Fnayou, A.; Ghorbel, A.; Mliki, A. Response of ungrafted and grafted grapevine cultivars and rootstocks (Vitis sp.) to water stress. J. Int. Sci. Vigne Vin. 2007, 41, 85–93. [Google Scholar] [CrossRef]
  20. Gómez-del-Campo, M.; Ruiz, C.; Baeza, P.; Lissarrague, J.R. Drought adaptation strategies of four grapevine cultivars (Vitis vinifera L.): Modification of the properties of the leaf area. J. Int. Sci. Vigne Vin. 2003, 37, 131–143. [Google Scholar] [CrossRef]
  21. Lavoie-Lamoureux, A.; Sacco, D.; Risse, P.-A.; Lovisolo, C. Factors influencing stomatal conductance in response to water availability in grapevine: A meta-analysis. Physiol. Plant. 2017. [Google Scholar] [CrossRef]
  22. Chaves, M.M.; Oliveira, M.M. Mechanisms underlying plant resilience to water deficits: Prospects for water-saving agriculture. J. Exp. Bot. 2004, 55, 2365–2384. [Google Scholar] [CrossRef]
  23. Morison, J.I.L.; Baker, N.R.; Mullineaux, P.M.; Davies, W.J. Improving water use in crop production. Philos. Trans. R. Soc. B Biol. Sci. 2008, 363, 639–658. [Google Scholar] [CrossRef] [PubMed] [Green Version]
  24. Medrano, H.; Tomás, M.; Martorell, S.; Flexas, J.; Hernández, E.; Rosselló, J.; Pou, A.; Escalona, J.-M.; Bota, J. From leaf to whole-plant water use efficiency (WUE) in complex canopies: Limitations of leaf WUE as a selection target. Crop J. 2015, 3, 220–228. [Google Scholar] [CrossRef] [Green Version]
  25. Merli, M.C.; Gatti, M.; Galbignani, M.; Bernizzoni, F.; Magnanini, E.; Poni, S. Water use efficiency in Sangiovese grapes (Vitis vinifera L.) subjected to water stress before veraison: Different levels of assessment lead to different conclusions. Funct. Plant Biol. 2015, 42, 198–208. [Google Scholar] [CrossRef]
  26. Scholander, P.F.; Hammel, H.T.; Bradstreet, E.D.; Hemmingsen, E.A. Sap Pressure in Vascular Plants: Negative hydrostatic pressure can be measured in plants. Science 1965, 148, 339–346. [Google Scholar] [CrossRef]
  27. Piepho, H.P. A SAS macro for generating letter displays of pairwise mean comparisons. Commun. Biometry Crop Sci. 2012, 7, 4–13. [Google Scholar]
  28. Ojeda, H.; Deloire, A.; Carbonneau, A. Influence of water deficits on grape berry growth. Vitis 2001, 40, 141–145. [Google Scholar]
  29. Costa, J.M.; Ortuño, M.F.; Lopes, C.M.; Chaves, M.M. Grapevine varieties exhibiting differences in stomatal response to water deficit. Funct. Plant Biol. 2012, 39, 179–189. [Google Scholar] [CrossRef]
  30. Ezzahouani, A.; Williams, L.E. Effect of irrigation amount and preharvest cutoff date on vine water status and productivity of Danlas grapevines. Am. J. Enol. Vitic. 2007, 58, 333–340. [Google Scholar]
  31. Wenter, A.; Zanotelli, D.; Montagnani, L.; Tagliavini, M.; Andreotti, C. Effects of an early-summer drought stress on leaf photosynthesis, growth and yields of grapevine in mountain conditions. Acta Hortic. 2017, 457–462. [Google Scholar] [CrossRef]
  32. Meggio, F.; Prinsi, B.; Negri, A.S.; Simone Di Lorenzo, G.; Lucchini, G.; Pitacco, A.; Failla, O.; Scienza, A.; Cocucci, M.; Espen, L. Biochemical and physiological responses of two grapevine rootstock genotypes to drought and salt treatments. Aust. J. Grape Wine Res. 2014, 20, 310–323. [Google Scholar] [CrossRef]
  33. Pou, A.; Flexas, J.; Alsina, M.D.M.; Bota, J.; Carambula, C.; De Herralde, F.; Galmés, J.; Lovisolo, C.; Jiménez, M.; Ribas-Carbó, M.; et al. Adjustments of water use efficiency by stomatal regulation during drought and recovery in the drought-adapted Vitis hybrid Richter-110 (V. berlandieri x V. rupestris). Physiol. Plant. 2008, 134, 313–323. [Google Scholar] [CrossRef] [PubMed]
  34. Medrano, H.; Escalona, J.M.; Bota, J.; Gulías, J.; Flexas, J. Regulation of photosynthesis of C3 plants in response to progressive drought: Stomatal conductance as a reference parameter. Ann. Bot. 2002, 89, 895–905. [Google Scholar] [CrossRef] [PubMed]
  35. Flexas, J.; Bota, J.; Escalona, J.-M.; Sampol, B.; Medrano, H. Effects of drought on photosynthesis in grapevines under field conditions: An evaluation of stomatal and mesophyll limitations. Funct. Plant Biol. 2002, 29, 461–471. [Google Scholar] [CrossRef]
  36. Chaves, M.M.; Zarrouk, O.; Francisco, R.; Costa, J.M.; Santos, T.; Regalado, A.P.; Rodrigues, M.L.; Lopes, C.M. Grapevine under deficit irrigation: Hints from physiological and molecular data. Ann. Bot. 2010, 105, 661–676. [Google Scholar] [CrossRef] [PubMed]
  37. Jara-Rojas, F.; Ortega-Farías, S.; Valdés-Gómez, H.; Acevedo-Opazo, C. Gas exchange relations of ungrafted grapevines (cv. Carménère) growing under irrigated field conditions. S. Afr. J. Enol. Vitic. 2015, 36, 231–242. [Google Scholar] [CrossRef]
  38. Flexas, J.; Medrano, H. Drought-inhibition of photosynthesis in C3 plants: Stomatal and non-stomatal limitations revisited. Ann. Bot. 2002, 89, 183–189. [Google Scholar] [CrossRef] [PubMed]
  39. Ghaderi, N.; Talai, A.R.; Ebadi, A.; Lessani, H. The physiological response of three Iranian grape cultivars to progressive drought stress. J. Agric. Sci. Technol. 2011, 13, 601–610. [Google Scholar]
  40. Romero, P.; Fernández-Fernández, J.I.; Martinez-Cutillas, A. Physiological Thresholds for Efficient Regulated Deficit Irrigation Management in Winegrapes Under Semiarid Conditions: Soil-Plant-Water Relationships and Berry Composition. Acta Hortic. 2012, 171–178. [Google Scholar] [CrossRef]
  41. Tramontini, S.; Döring, J.; Vitali, M.; Ferrandino, A.; Stoll, M.; Lovisolo, C. Soil water-holding capacity mediates hydraulic and hormonal signals of near-isohydric and near-anisohydric Vitis cultivars in potted grapevines. Funct. Plant Biol. 2014, 41, 1119–1128. [Google Scholar] [CrossRef] [Green Version]
  42. Schultz, H.R. Differences in hydraulic architecture account for near-isohydric and anisohydric behaviour of two eld-grown. Plant Cell Environ. 2003, 26, 1393–1406. [Google Scholar] [CrossRef]
  43. Lovisolo, C.; Perrone, I.; Hartung, W.; Schubert, A. An abscisic acid-related reduced transpiration promotes gradual embolism repair when grapevines are rehydrated after drought. New Phytol. 2008, 180, 642–651. [Google Scholar] [CrossRef] [PubMed] [Green Version]
  44. Palliotti, A.; Tombesi, S.; Frioni, T.; Famiani, F.; Silvestroni, O.; Zamboni, M.; Poni, S. Morpho-structural and physiological response of container-grown Sangiovese and Montepulciano cvv. (Vitis vinifera) to re-watering after a pre-veraison limiting water deficit. Funct. Plant Biol. 2014, 41, 634–647. [Google Scholar] [CrossRef]
  45. Pou, A.; Medrano, H.; Tomàs, M.; Martorell, S.; Ribas-Carbó, M.; Flexas, J. Anisohydric behaviour in grapevines results in better performance under moderate water stress and recovery than isohydric behaviour. Plant Soil 2012, 359, 335–349. [Google Scholar] [CrossRef]
  46. Maroco, J.P.; Rodrigues, M.L.; Lopes, C.; Chaves, M.M. Limitations to leaf photosynthesis in field-grown grapevine under drought—Metabolic and modelling approaches. Funct. Plant Biol. 2002, 29, 451–459. [Google Scholar] [CrossRef]
  47. Gibberd, M.R.; Walker, R.R.; Blackmore, D.H.; Condon, A.G. Transpiration efficiency and carbon-isotope discrimination of grapevines grown under well-watered conditions in either glasshouse or vineyard. Aust. J. Grape Wine Res. 2001, 7, 110–117. [Google Scholar] [CrossRef]
  48. Tardieu, F.; Granier, C.; Muller, B. Modelling Leaf Expansion in a Fluctuating Environment: Are Changes in Specific Leaf Area a Consequence of Changes in Expansion Rate? New Phytol. 1999, 143, 33–43. [Google Scholar] [CrossRef]
  49. De Pinheiro Henriques, A.R.; Marcelis, L.F.M. Regulation of growth at steady-state nitrogen nutrition in lettuce (Lactuca sativa L.): Interactive effects of nitrogen and irradiance. Ann. Bot. 2000, 86, 1073–1080. [Google Scholar] [CrossRef]
  50. Koundouras, S.; Tsialtas, I.T.; Zioziou, E.; Nikolaou, N. Rootstock effects on the adaptive strategies of grapevine (Vitis vinifera L. cv. Cabernet-Sauvignon) under contrasting water status: Leaf physiological and structural responses. Agric. Ecosyst. Environ. 2008, 128, 86–96. [Google Scholar] [CrossRef]
  51. Peterson, R.B.; Zelitch, I. Relationship between Net CO2 Assimilation and Dry Weight Accumulation in Field-Grown Tobacco. Plant Physiol. 1982, 70, 677–685. [Google Scholar] [CrossRef]
  52. Gómez-del-Campo, M.; Ruiz, C.; Sotés, V.; Lissarrague, J.R. Consequences of Water Consumption in the Leaf Area and Dry Matter Partitioning in Four Grapevine Varieties. Acta Hortic. 1996, 331–338. [Google Scholar] [CrossRef]
  53. Gómez-del-Campo, M.; Baeza, P.; Ruiz, C.; Lissarrague, J.R. Effects of water stress on dry matter content and partitioning in four grapevine cultivars (Vitis vinifera L.). J. Int. Sci. Vigne Vin 2005, 39, 1–10. [Google Scholar] [CrossRef]
  54. Mullins, M.G.; Bouquet, A.; Williams, L.E. Biology of the Grapevine; Cambridge University Press: Cambridge, UK, 1992. [Google Scholar]
  55. Williams, L.E. Grape. In Photoassimilate Distribution in Plants and Crops Source-Sink Relationship, 1st ed.; Zamski, E., Ed.; CRC Press: New York, NY, USA, 1996; pp. 851–881. ISBN 9780824794408. [Google Scholar]
Figure 1. Daily mean values of air temperature, air humidity, and vapour pressure deficit in the open greenhouse during the experimental period (fruit set to harvest) in 2016.
Agronomy 09 00135 g001
Figure 2. Median values of predawn leaf water potential (Ψpd) of six table grape cultivars subjected to three water deficit treatments at harvest in 2016. The data represent values of back transformed data. Treatments included: Control: daily irrigation to 75% of available water capacity (AWC), Moderate: daily irrigation to 50% of AWC, and Severe: daily irrigation to 25% of AWC. CS: Crimson Seedless, FA: Fanny, MB: Muscat Bleu, NE: Nero, PA: Palatina, TS: Thompson Seedless; Error bars represent standard errors; Values with identical letters indicate non-significant differences among cultivars (capital letters) and treatments (lower case letters) at α = 0.05.
Agronomy 09 00135 g002
Table 1. Characterization of water deficit treatments and experimental information from 2014 to 2016.
Water Deficit TreatmentDaily Irrigation to
Control75% AWC
Moderate50% AWC
Severe25% AWC
YearTimeframeWeeks of Water DeficitBBCH
(at the Beginning of Water Deficit)
201422.9.29.10.5.519
201512.5.21.7.1016–18
201615.6.16.9.1271
In 2014, one bud cuttings were planted. 2014 & 2015: Only vegetative growth. AWC was determined gravimetrically for each pot. AWC, available water content; BBCH, Biologische Bundesanstalt, Bundessortenamt und Chemische Industrie.
Table 2. Mean values of net assimilation (An) and intercellular CO2 (Ci), and median values of transpiration (E), stomatal conductance (gs), and leaf-level water use efficiencies (intrinsic: WUEi and instantaneous: WUEinst) of six table grape cultivars subjected to three water deficit treatments.
CultivarTreatmentAnEgsCiWUEinstWUEi
(µmol m−2s−1)(mmol m−2s−1)(mmol m−2s−1)(µmol m−2s−1)A/EA/gs
Muscat BleuControl4.65aC0.96aC39.60aC218.12aABC3.98bABC0.10bABC
Moderate5.57a1.07b43.84b203.69a4.76b0.12b
Severe5.32b0.69c27.19c120.74b6.57a0.17a
FannyControl12.30aA3.28aA148.08aA247.20aABC3.74bABC0.08bABC
Moderate11.86a2.45b104.30b213.00a4.23b0.10b
Severe8.71b1.32c53.11c149.88b6.84a0.17a
NeroControl10.67aB3.14aA135.63aA258.41aA3.25bC0.08bC
Moderate7.54a1.93b81.64b241.87a3.67b0.09b
Severe7.14b1.77c75.26c236.15b3.69a0.09a
PalatinaControl11.03aAB1.80aB74.22aB155.00aBC5.83bAB0.14bAB
Moderate9.89a1.44b59.32b149.40a6.72b0.17b
Severe7.80b1.03c41.17c127.33b6.75a0.17a
Thompson SeedlessControl6.64aC1.29aC51.29aC175.67aC5.15bA0.13bA
Moderate5.88a1.14b46.38b191.45a4.87b0.12b
Severe4.81b0.71c27.05c117.62b7.11a0.19a
Crimson SeedlessControl5.17aC1.24aC49.66aC225.53aAB4.00bBC0.10bBC
Moderate5.19a1.25b48.36b220.30a4.05b0.10b
Severe2.12b0.44c15.98c192.44b4.51a0.12a
ANOVA
Cultivar (C)<0.0001 <0.0001 <0.0001 0.0361 0.0355 0.0324
Treatment (T)0.0006 <0.0001 <0.0001 <0.0001 0.0001 <0.0001
C*T0.5774 0.4113 0.3597 0.5151 0.4336 0.3549
The data represent mean values (An, and Ci) and median values of back transformed data (E, gs, WUEinst, and WUEi). Treatments included: Control: daily irrigation to 75% of available water capacity, Moderate: daily irrigation to 50% of available water capacity, and Severe: daily irrigation to 25% of available water capacity. Different letters indicate significant differences among cultivars (capital letters) and treatments (lower case letters) at α = 0.05. ANOVA: p-values are given for the global F-test of the corresponding factor.
Table 3. Mean values of specific leaf area (SLA) and number of leaves and median values of leaf area (LA), total dry mass (Total DM), and total dry mass water use efficiency (WUEDM) of six table grape cultivars subjected to three water deficit treatments.
CultivarTreatmentLASLATotal DMNumber of LeavesWUEDM
(cm2)(cm2 g−1)(g) (g L−1)
Muscat BleuControl1074.27C171.72aAB32.54aCD9.88D0.04cB
Moderate1151.48152.17bC35.95a10.000.05b
Severe1122.71167.16aAB36.08b9.380.06a
FannyControl1191.18C168.62aB60.33aA12.75C0.07cA
Moderate1228.93171.35aA70.98a11.630.09b
Severe1087.03175.67aA53.89b11.630.09a
NeroControl1282.80C152.30abC43.45aB16.38B0.05cB
Moderate1229.79144.03bC41.43a16.250.05b
Severe1130.14159.73aBC35.79b16.250.06a
PalatinaControl1311.60C152.09aC34.06aBC16.25B0.04cB
Moderate1206.16153.33aBC37.52a15.250.05b
Severe1121.81149.95aC33.65b15.250.05a
Thompson SeedlessControl1766.40B169.15aB32.31aE14.71B0.03cC
Moderate1560.87164.10aAB29.46a14.880.03b
Severe1658.88161.83aB29.37b15.130.05a
Crimson SeedlessControl2185.06A180.90aA34.90aDE21.13A0.03cC
Moderate1836.10174.25abA31.77a19.250.03b
Severe1767.82165.01bAB25.47b21.250.04a
ANOVA
Cultivar (C)<0.0001 <0.0001 <0.0001 <0.0001 <0.0001
Treatment (T)0.0633 0.0448 0.0324 0.8144 <0.0001
C*T0.7734 0.0069 0.4589 0.9975 0.7317
The data represent mean values (SLA and number of leaves) and median values of back transformed data (LA, Total DM, and WUEDM). Treatments included: Control: daily irrigation to 75% of available water capacity, Moderate: daily irrigation to 50% of available water capacity, and Severe: daily irrigation to 25% of available water capacity. Different letters indicate significant differences among cultivars (capital letters) and treatments (lower case letters) at α = 0.05; ANOVA: p-values are given for the global F-test of the corresponding factor.
Table 4. Mean values of annual dry mass production of leaf, stem, petioles, and fruit of six table grape cultivars subjected to three water deficit treatments.
CultivarTreatmentLeaf DM
(g)
Stem DM
(g)
Petioles DM
(g)
Fruit DM
(g)
Muscat BleuControl6.33D17.99aAB1.05aD21.98B
Moderate7.6618.06aAB1.04a14.81
Severe6.7616.06aA1.03b11.58
FannyControl7.14D13.46aC1.14aD35.48A
Moderate7.2712.51aC1.15a57.62
Severe6.2711.36aC0.93b37.45
NeroControl8.55C16.83aB1.33aC27.08B
Moderate9.1216.31aB1.38a17.80
Severe7.2714.98aAB1.09b14.62
PalatinaControl8.72C17.49aB1.63aB17.55B
Moderate7.9817.80aAB1.47a23.13
Severe7.6915.20bAB1.33b16.74
Thompson SeedlessControl10.47B17.47aB1.61aB18.51B
Moderate10.0117.27aAB1.49a10.11
Severe10.3916.54aA1.46b14.03
CrimsonSeedlessControl12.11A20.03aA2.07aAn.a.n.a.
Moderate11.0718.96aA1.85an.a.
Severe10.9013.06bBC1.62bn.a.
ANOVA
Cultivar (C)<0.0001 <0.0001 <0.0001 <0.0001
Treatment (T)0.1221 <0.0001 0.0003 0.5901
C*T0.6549 0.0191 0.6271 0.4693
The data represents mean values of leaves, stem, petioles, and fruit dry mass. Treatments included: Control: daily irrigation to 75% of available water capacity, Moderate: daily irrigation to 50% of available water capacity, and Severe: daily irrigation to 25% of available water capacity; n.a.: not available; Different letters indicate significant differences among cultivars (capital letters) and treatments (lower case letters) at α = 0.05; ANOVA: p-values are given for the global F-test of the corresponding factor.

