Article

Physiological and Growth Response of Pepper (Capsicum annum L.) Seedlings to Supplementary Red/Blue Light Revealed through Transcriptomic Analysis

1
Department of Facility Horticulture Science, College of Horticulture, Gansu Agricultural University, Lanzhou 730070, China
2
Department of Horticulture, FoA, University for Development Studies, P.O. Box TL 1882 Tamale, Ghana
*
Author to whom correspondence should be addressed.
Submission received: 21 January 2019 / Revised: 2 March 2019 / Accepted: 12 March 2019 / Published: 18 March 2019
(This article belongs to the Section Horticultural and Floricultural Crops)

Abstract

:
Red and blue light have great effects on physiological processes and growth of plants. In this experiment, we investigated the physiological and growth response of pepper (Capsicum annuum L.) to supplementary red:blue (4:1) light for 1 h (T1), 3 h (T2), and 5 h (T3), and the full-spectrum light-emitting diodes, LEDs, as control (CK). Thirty-day-old seedlings were grown under these treatments for 20 days in a climate-controlled room before data measurement. The results showed that the light treatments significantly (p < 0.05) affected the photosynthesis and growth indexes as well as gene expression in the pepper seedlings. Plants under T2 generally had better performance in terms of seedling growth. A total of 124, 1283, and 1091 differentially expressed genes were found in CK vs. T1, CK vs. T2, and CK vs. T3, respectively. Among the treatments, T2 in comparison with CK had 705 upregulated and 578 downregulated differentially expressed genes (DEGs). We also found that CPRF2, Paggis, HLIPS, GIGANTEA, LSH1, and FTSH genes were expressed differently under the various light treatments. Based on GeneOntology (GO) enrichment analysis, DEGs were significantly enriched on 15 GO terms of which xyloglucan:xyloglucosyl transferase activity and apoplastic, cellular polysaccharide metabolic, and cellular carbohydrate metabolic processes were closely related to light responses. A total of 96 genes that are related to plant–pathogen interaction, zeatin biosynthesis, plant hormone signal transduction, and wax/cutin/suberine biosynthesis which are involved in the pathway of light reaction in plants were significantly enriched in T2 plants compared with plants under CK. The application of red:blue light at 4:1 for 3 h improved the growth of pepper seedlings better than the other treatments and this can be tested under the Chinese Solar Greenhouse condition.

1. Introduction

In recent years, many studies have been conducted on the effect of light quality on plant growth and development. Fukuda et al. studied the effect of red light (R), blue light (B), and white light (W) provided by light-emitting diodes on Petunia hybrid, and found that red light inhibited shoot elongation whiles blue light greatly increased it [1]. However, exposure of plants to a high proportion of blue light has also been shown to be effective in suppressing stem elongation [2,3,4]. The exposure of ‘Green Oak Leaf’ lettuce plants to fluorescent lamps with blue or red LEDs increased stem diameter, leaf area, leaf number, and dry biomass of shoot [5]. Brown et al. indicated that red LEDs in combination with other wavelengths of light may be suitable for the culture of plants under climate-controlled environments [6]. The application of red and blue light also affected biomass accumulation, pigment synthesis, antioxidants, and phenolic compounds. Moreover, chlorophyll contents increased significantly with increasing blue light in tomato, cucumber, radish, and pepper as compared with control plants [7]. Košvancová-Zitová et al. reported that irradiance with high B:R ratio (3:1) increased the rate of photosynthesis in Fagus sylvatica better than irradiance with low B:R (1:3) ratio [8]. In another experiment, Son et al. reported that the total antioxidant phenolic concentrations of lettuce plants increased as the proportion of blue light was increased [9].
Furthermore, different proportions of red and blue light have different effects on plant growth. A study showed that photosynthesis and yield of plants treated with LED-A (R:B = 6:3) were improved as compared to the control plants [10]. The fresh and dry weights of pepper fruits produced under LED-A were also greater than those of the control plants. Moreover, the light quantum yield of PSII, electron transfer rate, and the proportion of the open fraction of PSII centers of plants grown under the LED-A were greater than the control plants. The LED-B (R:B = 8:1) increased plant height and stem diameter of the pepper plants more than the LED-A [10].
With the progress of “next-generation” sequencing technology, transcriptome technology has been widely used to study the response of plants to the environment [11]. In grape plantlets under blue and red light treatments, the blue light induced the upregulation of genes related to microtubules, serine carboxypeptidase, and chlorophyll synthesis, but downregulated auxin-repressed protein and resistance-related genes [12], whereas red and green light promoted the expression of the auxin inhibitor protein gene, suggesting that the auxin concentrations are low in plants treated with red and green light, a condition that is suitable for plant stem and root length growth. Transcriptome sequencing of Saccharina japonica under blue light (notation by Swissprot, Nr, GO, KEGG, and COG databases) found that unigenes are putative BL photoreceptors; these genes are involved in processes of circadian rhythm, flavonoid biosynthesis, photo-reactivation, and photo-morphogenesis [13].
Several authors have reported that the application of supplementary light improves the growth and development of vegetables, fruits, and ornamental plants under greenhouse conditions [14,15,16]. Fierro et al. found that increasing CO2 and supplementary lighting for about three weeks increased shoot and root dry matter accumulation in tomato and pepper seedlings under greenhouse conditions [17]. In another experiment, the application of supplementary lighting alone increased net photosynthesis and water use efficiency and these led to increased fruit yield and quality of pepper, though the combination of supplementary lighting and CO2 improved these parameters better than supplementary lighting [18]. Naing et al. also reported that the application of supplementary lighting alone or in combination with CO2 significantly improved plant growth through increased plant height, stem diameter, and number of axillary shoots, as well as flower stem diameter, fresh weight, and number of petals per flower in rose plants under greenhouse conditions [19].
In the northwestern part of China, the Chinese Solar Greenhouse (CSG) is widely utilized for vegetable cultivation during the winter period. The natural light available to the plants during the peak of winter is usually for a short period of about 7 h. To improve the growth of plants under the CSG, the application of supplementary light could be an option. The significance of supplementary lighting and the significant role of the combined effect of red:blue light on the growth and development of horticultural plants have been reported [15,16,20,21]. However, there is little research on the effect of duration of supplementary red:blue lighting on vegetable crops. We therefore conducted this experiment with the hypothesis that appropriate duration of supplementary red:blue light will enhance photosynthesis, improve plant growth, and influence gene expression in pepper seedlings. The experiment was therefore conducted to determine the effect of durations of red:blue supplementary light on photosynthesis, growth, and gene expression in pepper seedlings. The results of this experiment could provide the basis for the utilization of supplementary red:blue light for improved plant growth in the CSG.

2. Materials and Methods

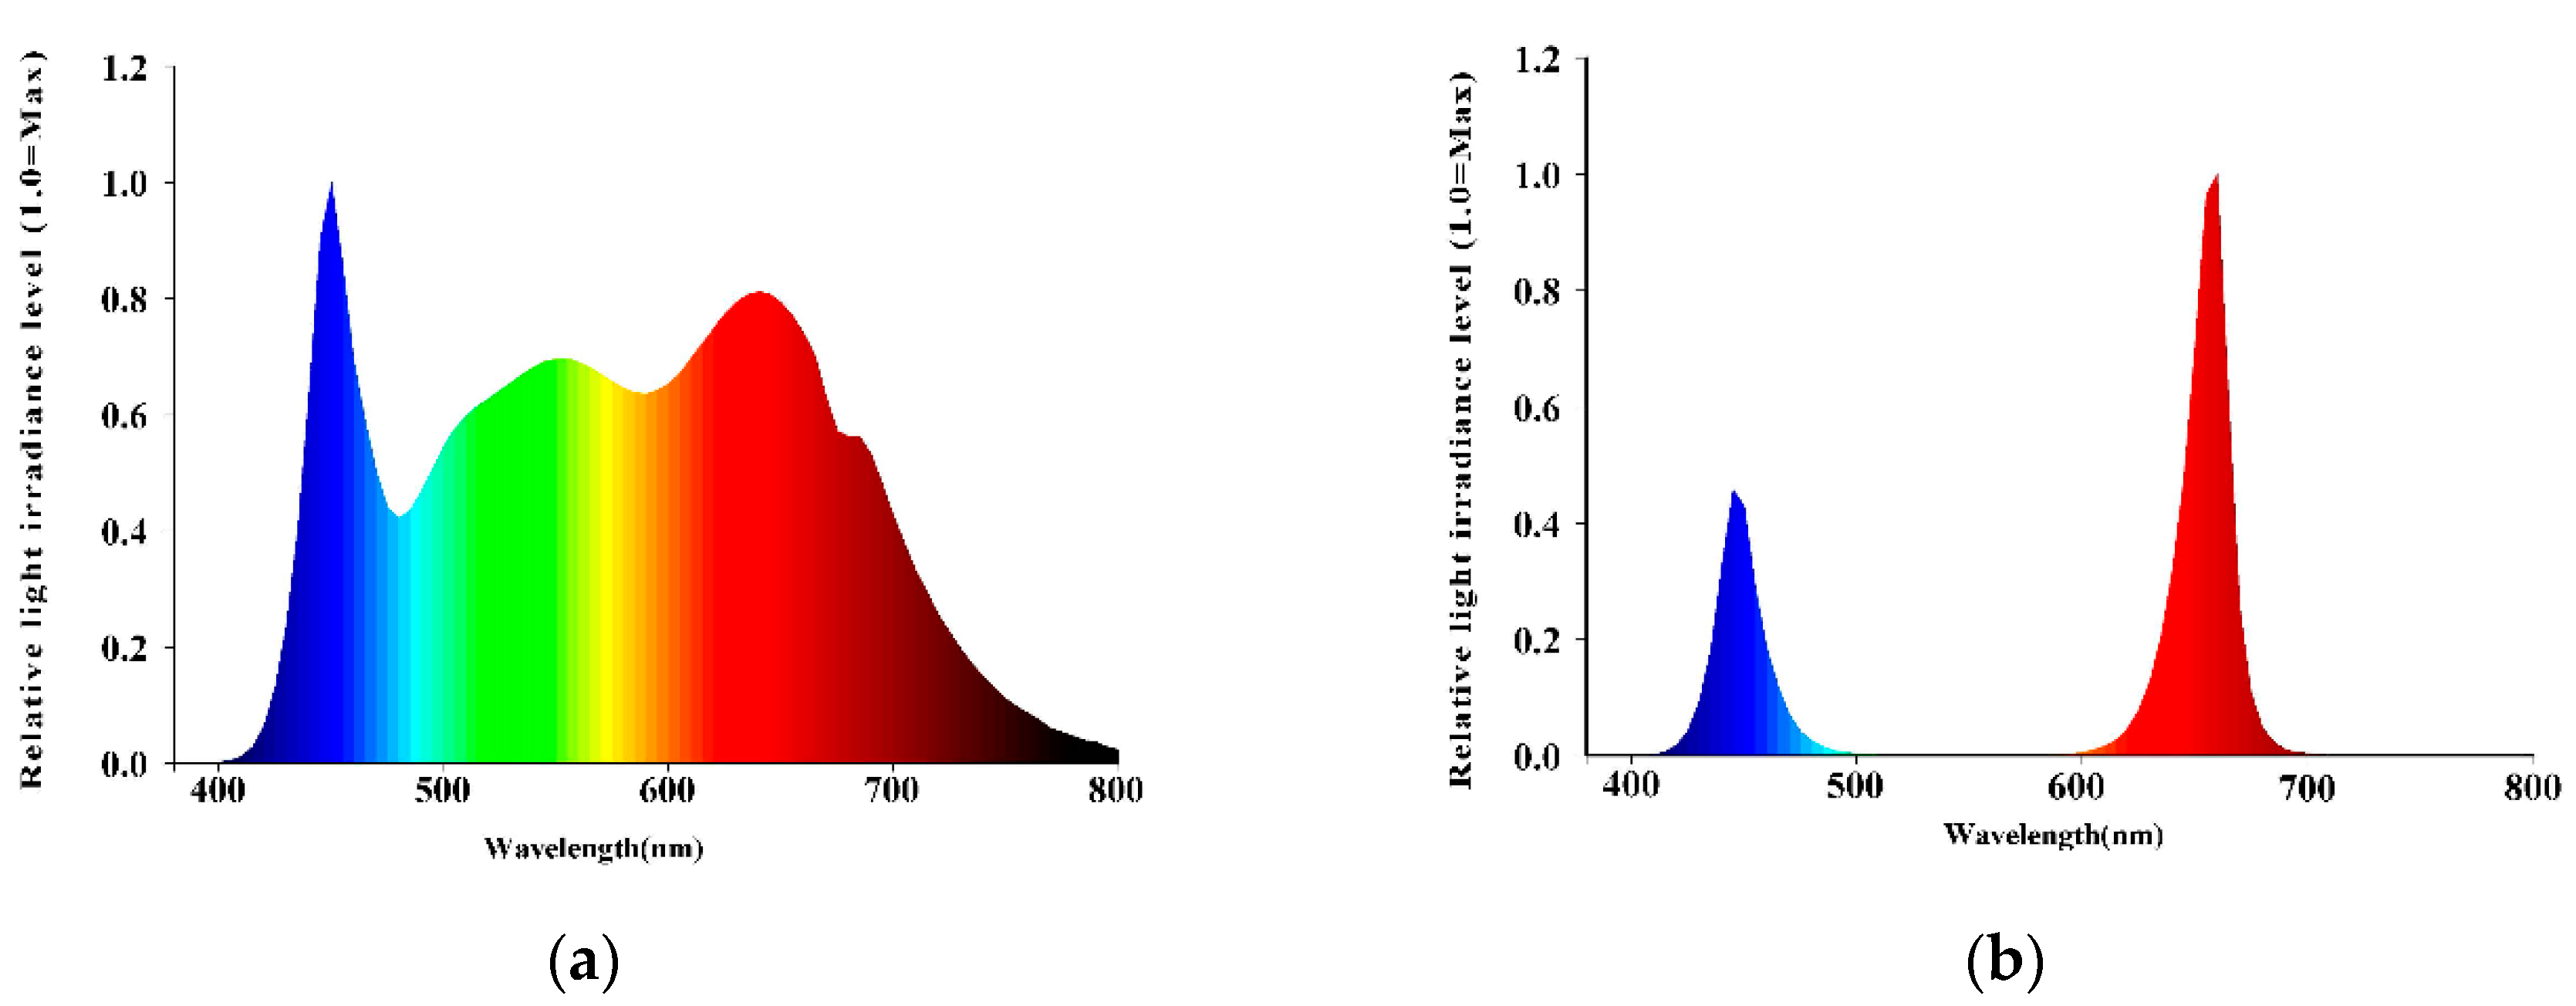
2.1. Plant Material and Growth Conditions

Pepper seeds (Capsicum annum L. “Longjiao NO. 5”) purchased from the Gansu Academy of Agricultural Sciences, Lanzhou, China, were soaked in distilled water at 25 °C for 15 min, and then transferred into distilled water at 55 °C~60 °C for 15 min and stirred continuously to promote uniform germination. The seeds were allowed in the distilled water for 12 h before being exposed to suitable conditions for germination in petri dishes placed in a climate box with a constant temperature of 28 °C. The germinated seeds were sown in seedling trays containing substrate (Zhongqing Agricultural Technology co. LTD, Yinchuan, China) and the seedlings were grown in a climate-controlled room (temperature, 28 °C/22 °C; light intensity, 300 μmol·m−2·s−1; photoperiod, 12 h; relative humidity during photoperiod, about 80%) for 30 days. The 30-day-old seedlings were subjected to four supplementary light treatments in the climate-controlled room.

2.2. Treatments and Experimental Design

Two light sources were used to treat the seedlings: full-spectrum white LED (W) and red:blue LED light source with a 4:1 ratio (R4:B1). The wavelength of the red LED light was 660 nm ± 5 nm, while that of the blue LED was 460 nm ± 5 nm (Figure 1a,b). The ±5 nm standard deviation of the wavelengths was given by the company that supplied the light sources (VANQ Technology Co. Ltd., Shenzhen, China). The light intensity of both the white LED and red:blue LED was maintained at 300 μmol·m−2·s−1 throughout the experiment. Figure 1 shows the spectral qualities of the full-spectrum white LED and supplementary red:blue light sources used in the experiment. The seedlings were exposed to the light treatments for 20 days in the climate-controlled room. The seedlings under each treatment were screened with thick ash tarpaulin material to prevent the interference of light from the other treatments. In each day (24 h), all the seedlings under the control (CK) treatment and T1, T2, and T3 were supplied with 7 h white LED light. After the 7 h, seedlings under T1 were supplied with 1 h additional R4:B1 light, seedlings under T2 were supplied with 3 h additional R4:B1 light, and seedlings under T3 were supplied with 5 h additional R4:B1 light. Thus, seedlings under CK were exposed to 7 h white LED light and remained under dark conditions for 17 h. Seedlings under T2 were exposed to 7 h white LED light + 1 h R4:B1 light and remained under dark conditions for 16 h. The seedlings under T2 were exposed to 7 h white LED + 3 h R4:B1 light and remained under dark conditions for 14 h. The seedlings under T3 were exposed to 7 h white LED + 5 h R4:B1 light and remained under dark conditions for 12 h. The treatments were arranged in a complete randomized design with three replications. Each experimental unit consisted of 50 seedlings, giving a total of 150 seedlings per treatment. At 20 days after treatment application, five plants were randomly collected per treatment per replication for the growth and physiological data. Another set of five plants per treatment per replications was randomly collected for the gene analysis. Table 1 shows a summary description of the light treatments applied.

2.3. Measurement of Plant Growth and Physiological Parameters

All the growth and physiological data were measured at 20 days after the application of the supplementary red:blue light treatments. Plant height was measured from the base of the stem to the tip of the terminal bud with a meter rule. The stem diameter was measured from about 1 cm above the root color using vernier calipers. Photosynthetic indexes, including net photosynthesis, stomata conductance, intercellular CO2, and transpiration rate, were measured using a portable photosynthesis systems machine (CIRAS-2, PP System Inc., Amesbury, MA 01913, USA) within the hours of 9:00–11:00 a.m. The conditions in the assimilation chamber of the CIRAS-2 equipment were relative humidity 75%, CO2 concentration 400 ppm, temperature 25 °C, and VPD 21.0 mb. The third fully opened leaf below the terminal bud of each sampled plant was used for the data on the photosynthetic indexes. For fresh and dry biomass, sampled seedlings were gently uprooted and separated into leaves, stems, and roots, then the fresh biomass was immediately measured with a digital balance. Before this measurement, the substrate particles attached to the roots were washed gently in distilled water. Leaf surface area and root indexes, including total root length, root surface area, and root volume, were scanned with a root scanner (STD 4800, EPSON, Quebec, QC, Canada) to obtain a digital image and the measurements conducted with the aid of the WinRHIZO software (Regent Instruments Inc., Quebec, QC, Canada). The various plant parts were dried at 105 °C for 15 min and then at 80 °C until constant weights were attained. The dry biomass of roots, stems, and leaves was measured using the digital scale. Chlorophyll (Chl a and Chl b) and total carotenoid contents were measured spectrophotometrically using 100 mg FW of leaf tissue ground in the presence of 8 mL of acetone 80% (v/v). After complete extraction, the mixture was filtered and the volume made up to 10 mL by adding cold acetone. The absorbance of the extract was read at 663.2, 646.8, and 470 nm and pigment contents were calculated according to Lichtenthaler (1987) [22,23].

2.4. RNA Extraction and RNA-Seq

The extraction of total RNA from leaves was done with Trizol reagent (Invitrogen, Carlsbad, CA, USA) following the method described by Hu et al. [14]. The total RNA extraction was divided into two aliquots; one was used for RNA-sequencing, and the other was utilized for real-time PCR. The RNA sequencing was done at Beijing Novogene Technology Co. Ltd., Beijing, China, using the illumine HiSeq 4000 platform (Illumina, San Diego, CA, USA). Each sample produced more than 6 gigabytes of data. The clean reads were filtered from raw sequencing data and the low-quality reads containing unknown nucleotides or adaptor sequences were removed [24]. The filtered clean reads were aligned to C. annuum reference genome (http://peppersequence.genomics.cn/page/ species/download.jsp).

2.5. Analysis of Differentially Expressed Genes (DEGs)

Differential gene expression analysis was conducted for all four treatments based on the DESeq R package. This package allows for statistical analysis by the negative binomial distribution model [25]. To check the false discovery rate, the resulting p-values were adjusted according to Benjamini and Hochberg’s approach, where an adjusted p < 0.05 is accepted to represent differentially expressed genes (DEGs) [26]. The gene ontology (GO) enrichment analysis of the DEGs was conducted according to the goSeq R package, and GO terms which had q < 0.05 were regarded as significantly enriched [27]. The statistical enrichment of the differential expression genes was performed in Kyoto Encyclopedia of Genes and Genomes (KEGG) pathways using the KOBAS software [28].

2.6. Validation of DEGs by Real-Time Quantitative PCR

Twenty transcript genes were selected for the qRT-PCR assay. The genes and gene-specific primers which were used are presented in the Supplementary Material (Table S1). U6 was used as an internal reference control. The qRT-PCR was conducted using SYBR-Green on an ABI 7900 Fast Real-Time PCR Detection System (Applied Bio-systems, Carlsbad, USA). A real-time RT-PCR reaction (20 µL) included 10 µL of 2× super real premix Plus, 2 µL cDNA, 1 µL of each primer, and 6 µL ddH2O, and it proceeded for 40 cycles (ABI-Invitrogen, Carlsbad, CA, USA). The relative expression levels of the 20 selected genes normalized to the expression level of U6 were calculated from cycle threshold values using the 2−ΔΔCT method [29].

2.7. Statistical Analysis

The data collected were subjected to analysis of variance (ANOVA) with the aid of SPSS (Statistical Product and Service Solutions, Version 22, IBM, Armonk, NY, USA) software. The Duncan’s multiple range test (p < 0.01) was used for the separation of treatment means and the results were presented as mean ± standard error of mean (SEM) of three replicates.

3. Results

3.1. Effect of Light Durations on Growth Indexes

The results showed that with the exception of stem diameter, the light treatments significantly (p ≤ 0.05) affected all the growth indexes that were measured (Table 2). Plants under T2 had higher values for plant height, total root length, root volume, root surface area, fresh plant biomass, dry root weight, dry stem weight, and dry leaf weight. The least values for all these indexes were recorded in the CK plants. However, the fresh plant biomass, dry leaf weight, and dry stem weight were not statistically different among T1, T2, and T3 plants but these were significantly greater than the CK plants. Moreover, the total root length, root surface area, root volume, and dry root weight of T1 and CK plants were statistically the same. Similarly, root surface area, plant height, and root volume were statically not different between T2 and T3 plants.

3.2. Effect of Light Durations on Plant Physiological Indexes

Table 3 shows that with the exception of contents of chlorophyll b and carotenoid, which were not affected (p > 0.05) by the light treatments, other photosynthetic indexes including stomatal conductance, intercellular CO2, transpiration rate, chlorophyll a, and total chlorophyll were all affected (p < 0.05) by the light treatments. Plants exposed to T1 and T2 generally had higher values for most of the photosynthetic indexes, including net photosynthesis, rate of transpiration, and stomatal conductance. However, the net photosynthesis of the plants under T1 and T2 were statistically similar to those under CK while the plants under T3 had the lowest net photosynthetic rate.

3.3. Effects of Light Durations on the Transcriptome of Pepper Plantlets

3.3.1. Statistics and Sequencing Quality Assessment of the RNA-Seq Data

Transcriptome analysis was performed to test the hypothesis that supplementary application of red:blue light can improve growth and influence the expression of genes responsible for seedling growth in pepper. Out of the 12 sequencing samples (each treatment contained three samples), an average of 55 million total sequencing reads of approximately 8.13 Gb for each sample were obtained. HISAT software filtered sequences were selected to perform genomic positioning analysis. An average of 49.6 million reads were matched to the genome in each group. Each library that produced the clean reads was aligned to the recently released C. annuum reference genome, release_2.0 [30]. An average of 91.48% of clean reads was aligned to the reference genome. Correlation tests of gene expression levels between samples showed that the square of the Pearson correlation coefficient (R2) was greater than 0.92 and the lowest was 0.929.

3.3.2. Results of the Screen for the DEGs between Treatments

The 43,705 genes from the mapped libraries were normalized = using the reads per kilobases per million reads (FPKMs) method [31]. The values of FPKM which were obtained were used to analyze the differences in gene expression associated with each group and these were compared with the gene expression in the control (CK) plants. The standard for screening DEGs is log2 (fold change) | > 2&q-value < 0.005. There were 124 differential genes between CK and T1, with 82 upregulated genes and 42 downregulated genes. There were 1283 differential genes between CK and T2, of which 705 genes were upregulated while 578 genes were downregulated. There were 1091 differentially expressed genes between CK and T3, of which 553 were upregulated and 538 were downregulated.

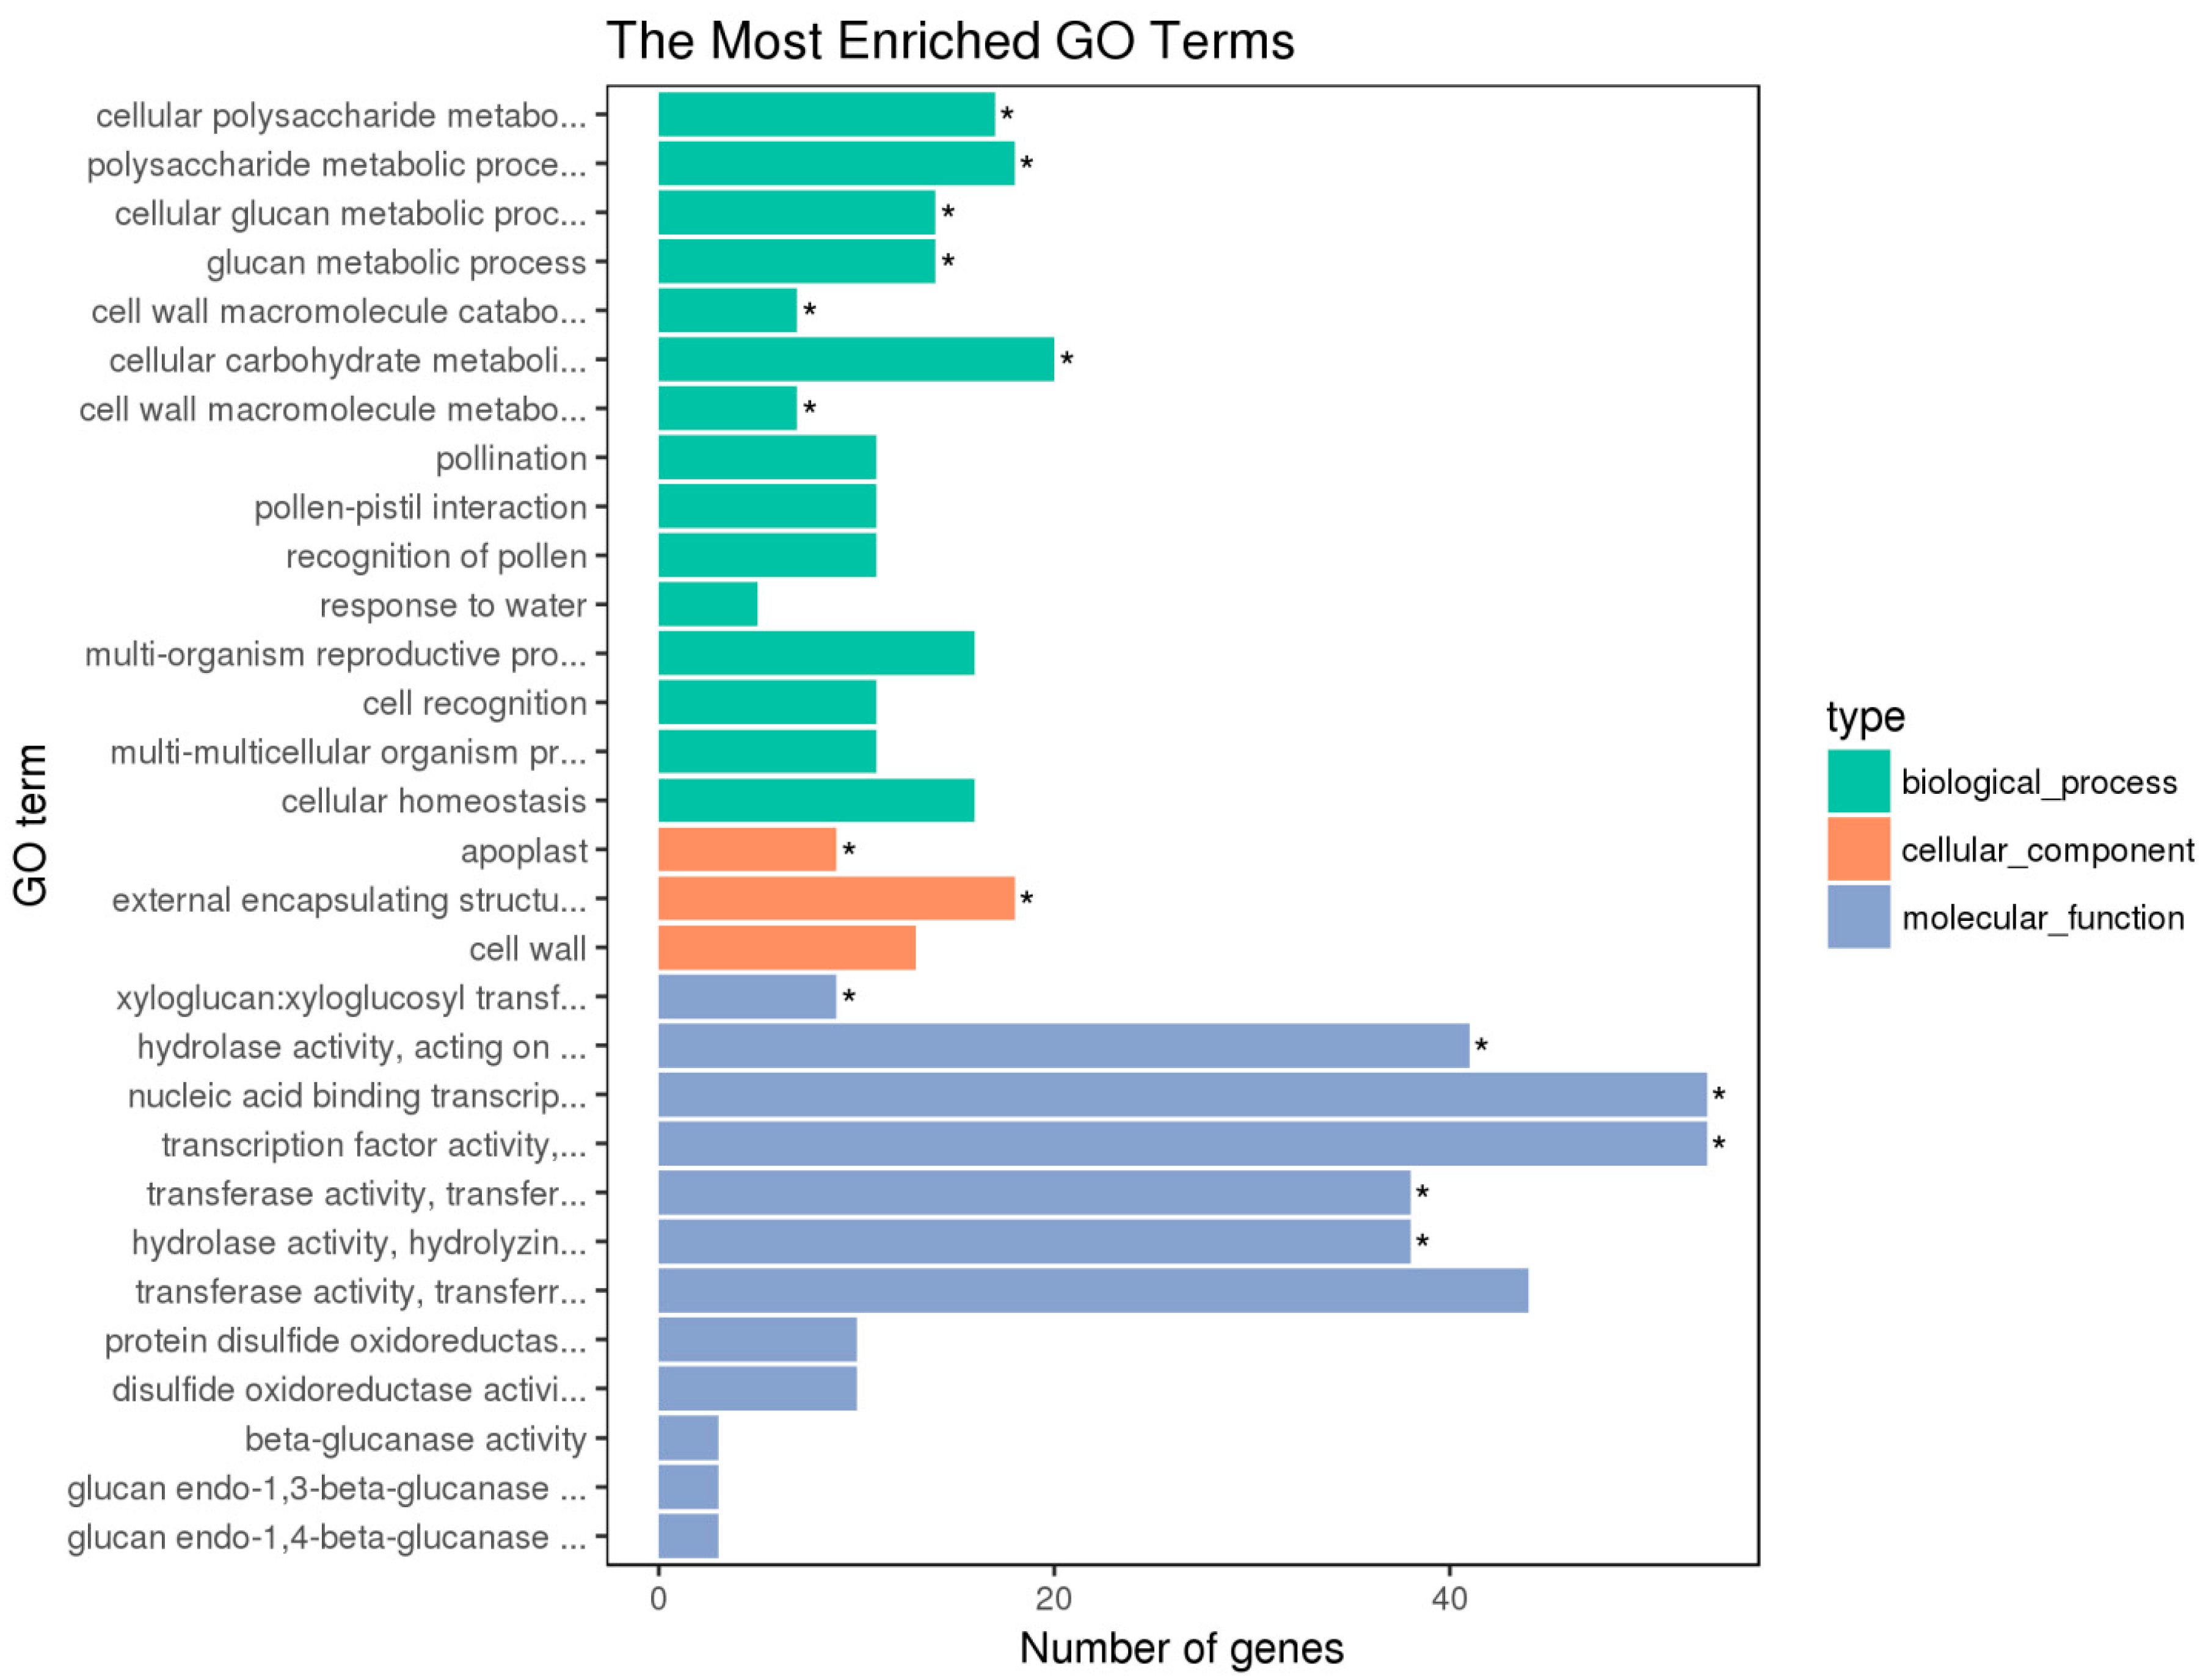
3.3.3. GO Analysis of DEGs in Plants That Received Light Duration Treatments

DEGs enrichment analysis was performed to investigate the distribution of molecular functions, biological processes, and cellular components in order to elucidate the manifestations of DEGs. Since the T2 group (Figure 2) had the greatest effect on the growth and physiological processes of the seedlings, we analyzed the data from the CK vs. T2 group. We found that 356 DEGs were significantly enriched on 15 GO terms. Molecular function was mainly enriched in the following six pathways: xyloglucan:xyloglucosyl transferase activity (GO:0016762), hydrolase activity, acting on glycosyl bonds (GO:0016798), nucleic acid binding transcription factor activity (GO:0001071), transcription factor activity, sequence-specific DNA binding (GO:0003700), transferase activity, transferring hexosyl groups (GO:0016758), and hydrolase activity, hydrolyzing O-glycosyl compounds (GO:0004553). The components of the cell mainly focused on the following two pathways: apoplast (GO:0048046) and external encapsulating structure (GO:0030312), while the biological process mainly concentrated on the following seven pathways: cellular polysaccharide metabolic process (GO:0044264), polysaccharide metabolism (GO:0005976), the process of cellular glucan metabolism (GO:0006073), the process of glucan metabolism (GO:0044042), the process of cell wall macromolecule catabolism (GO:0016998), the process of cellular carbohydrate metabolism (GO:0044262), and the process of cell wall macromolecule metabolism (GO:0044036).

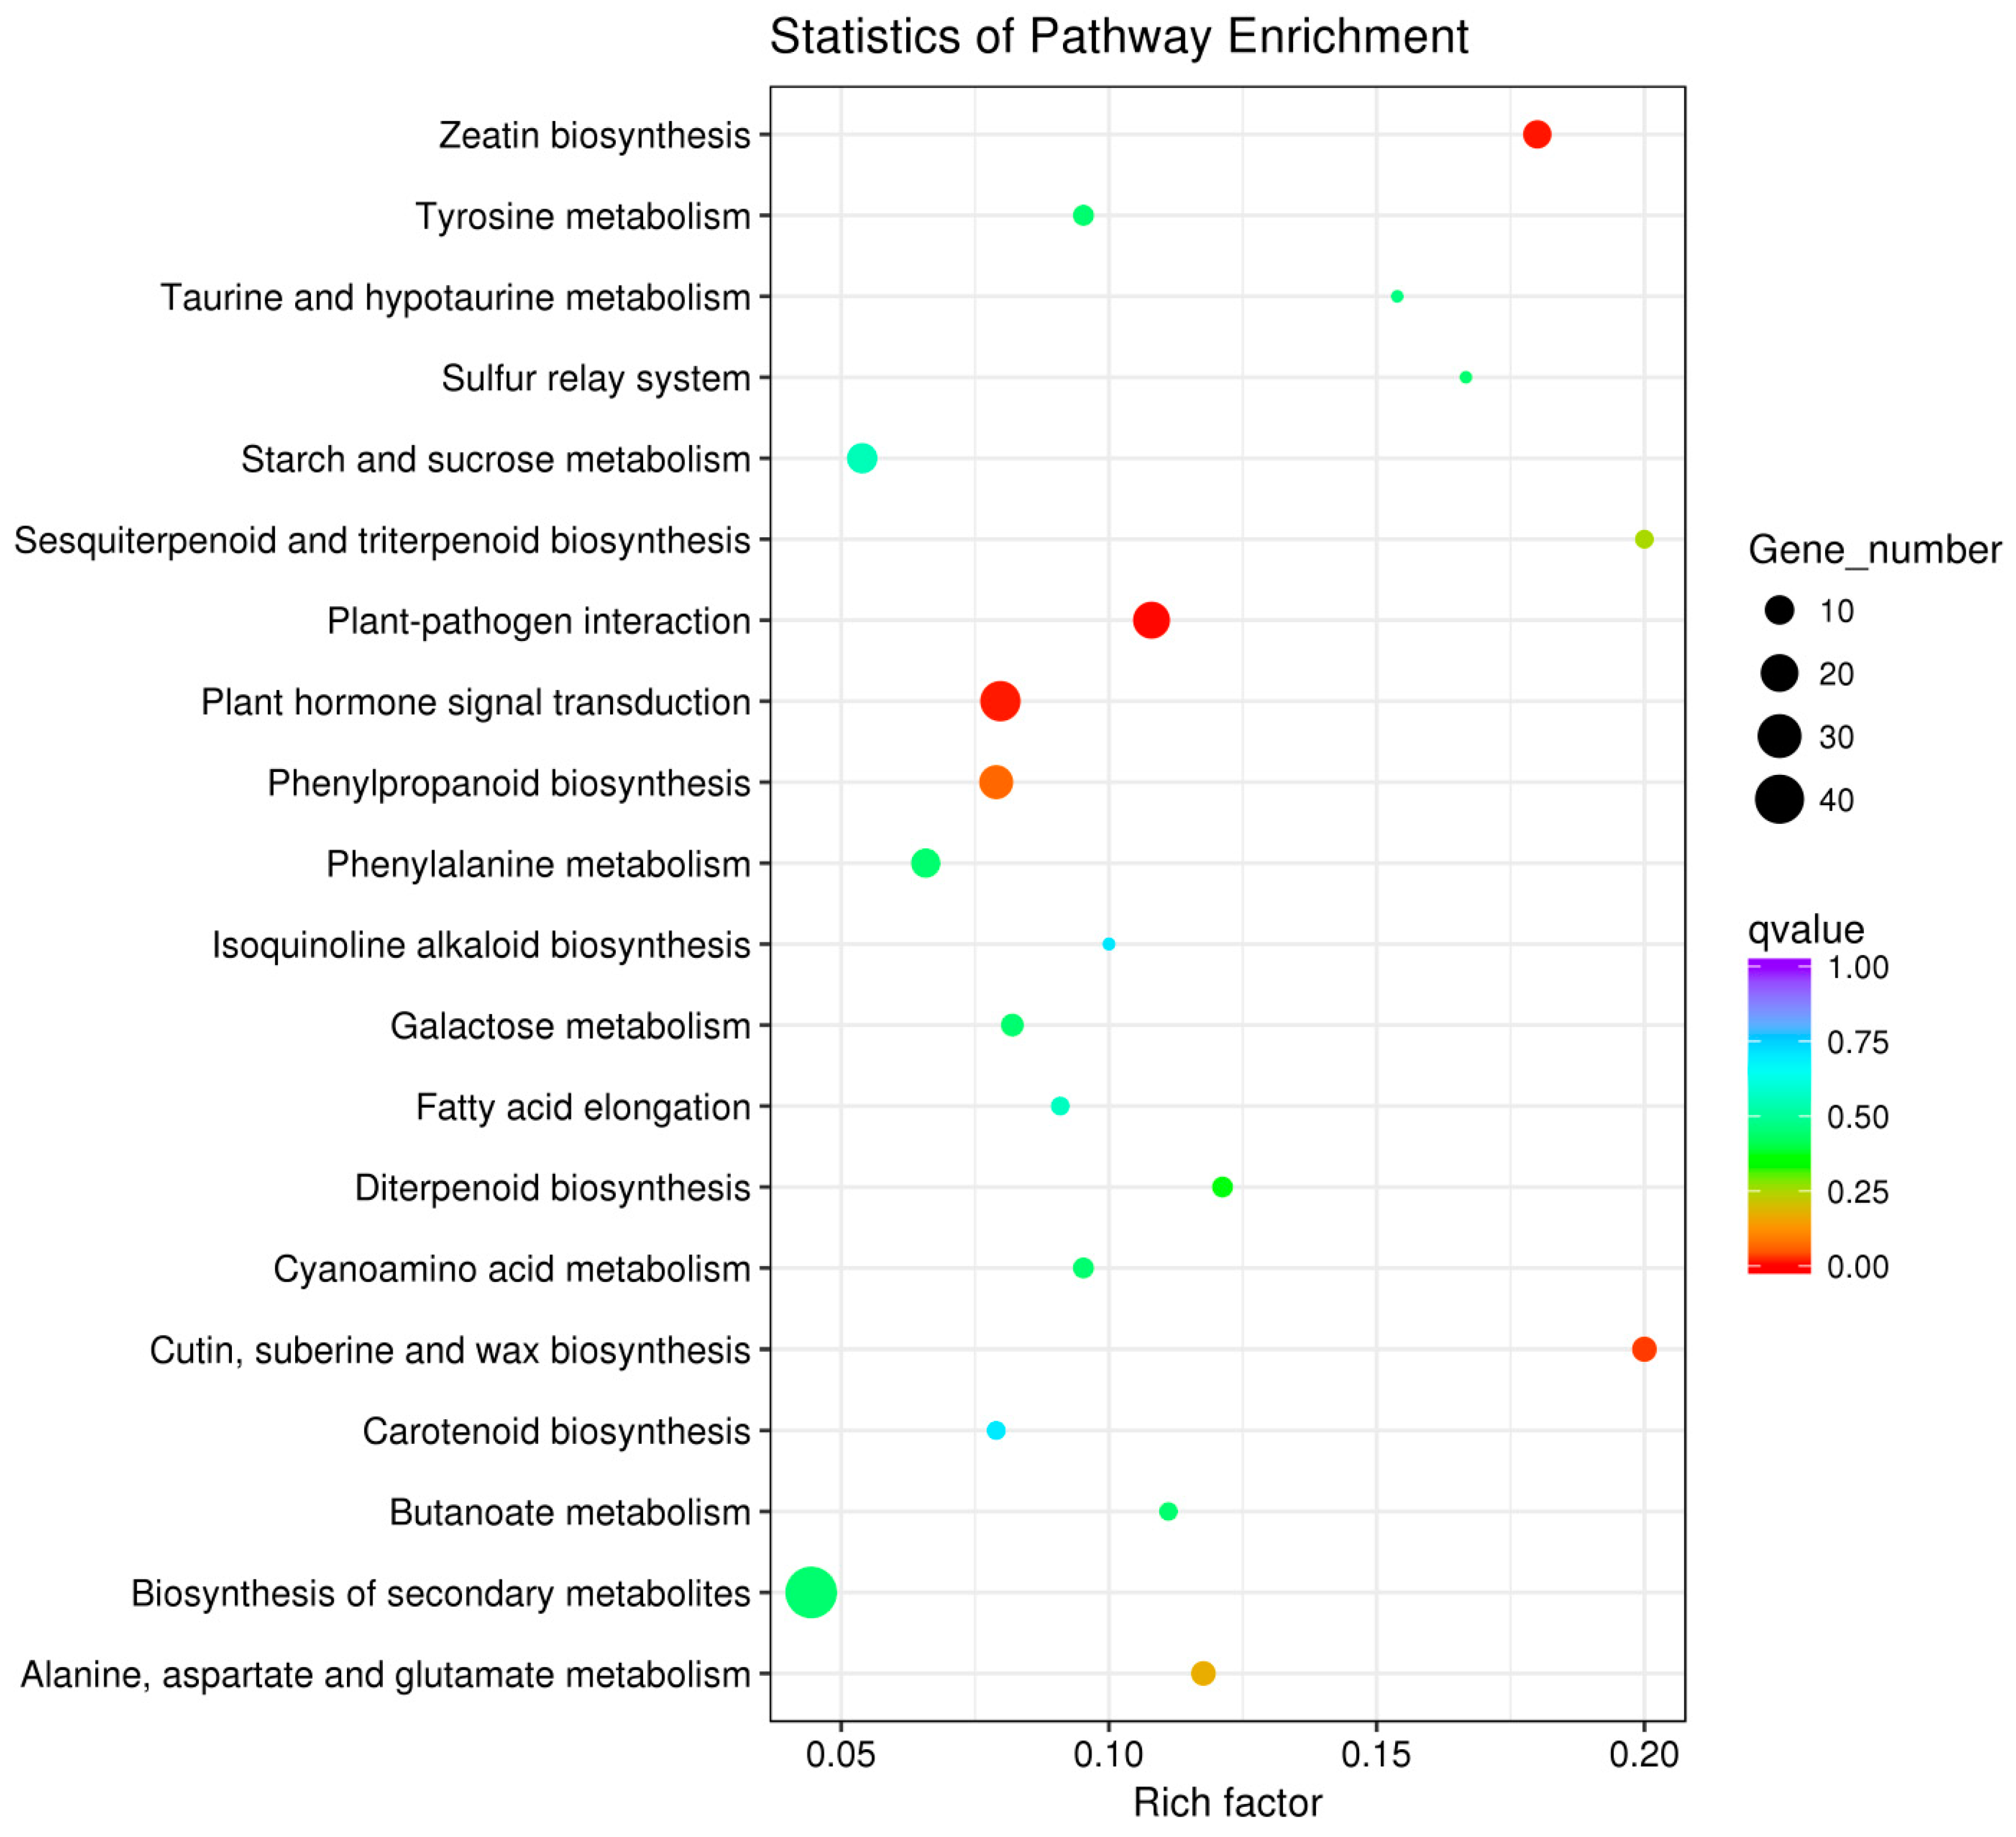
3.3.4. KEGG Pathway Analysis of DEGs in the Light Duration Treatments

A total of 378 genes in CK vs. T2 were enriched in 84 pathways, of which 96 genes were significantly (p < 0.05) enriched in 9 pathways (Figure 3). These included the following: interaction between plant and pathogen, zeatin biosynthesis, endogenous plant hormone signal transduction, cutin, biosynthesis of suberine and wax, biosynthesis of phenylpropanoid, alanine, aspartate, and glutamate metabolism, sesquiterpenoid and triterpenoid biosynthesis, diterpenoid biosynthesis, phenylalanine metabolism.

3.3.5. Venn Diagram Analysis and Cluster Analysis of DEGs among the Treatments

Figure 4 shows the specific expression of genes. Sixteen overlapped genes were identified in the following comparisons: CK vs. T1, CK vs. T2, and CK vs. T3; these genes may be linked to primary processes that are controlled by light duration. Among them, six genes were upregulated, gene id: 107839749, 107863290, 107878304, 107879369, Novel00285, Novel01800. The other 10 genes were downregulated, gene id: 107851308, 107853885, 107854168, 107855063, 107856574, 107857219, 107859144, 107863290, 107865651, 107877347.

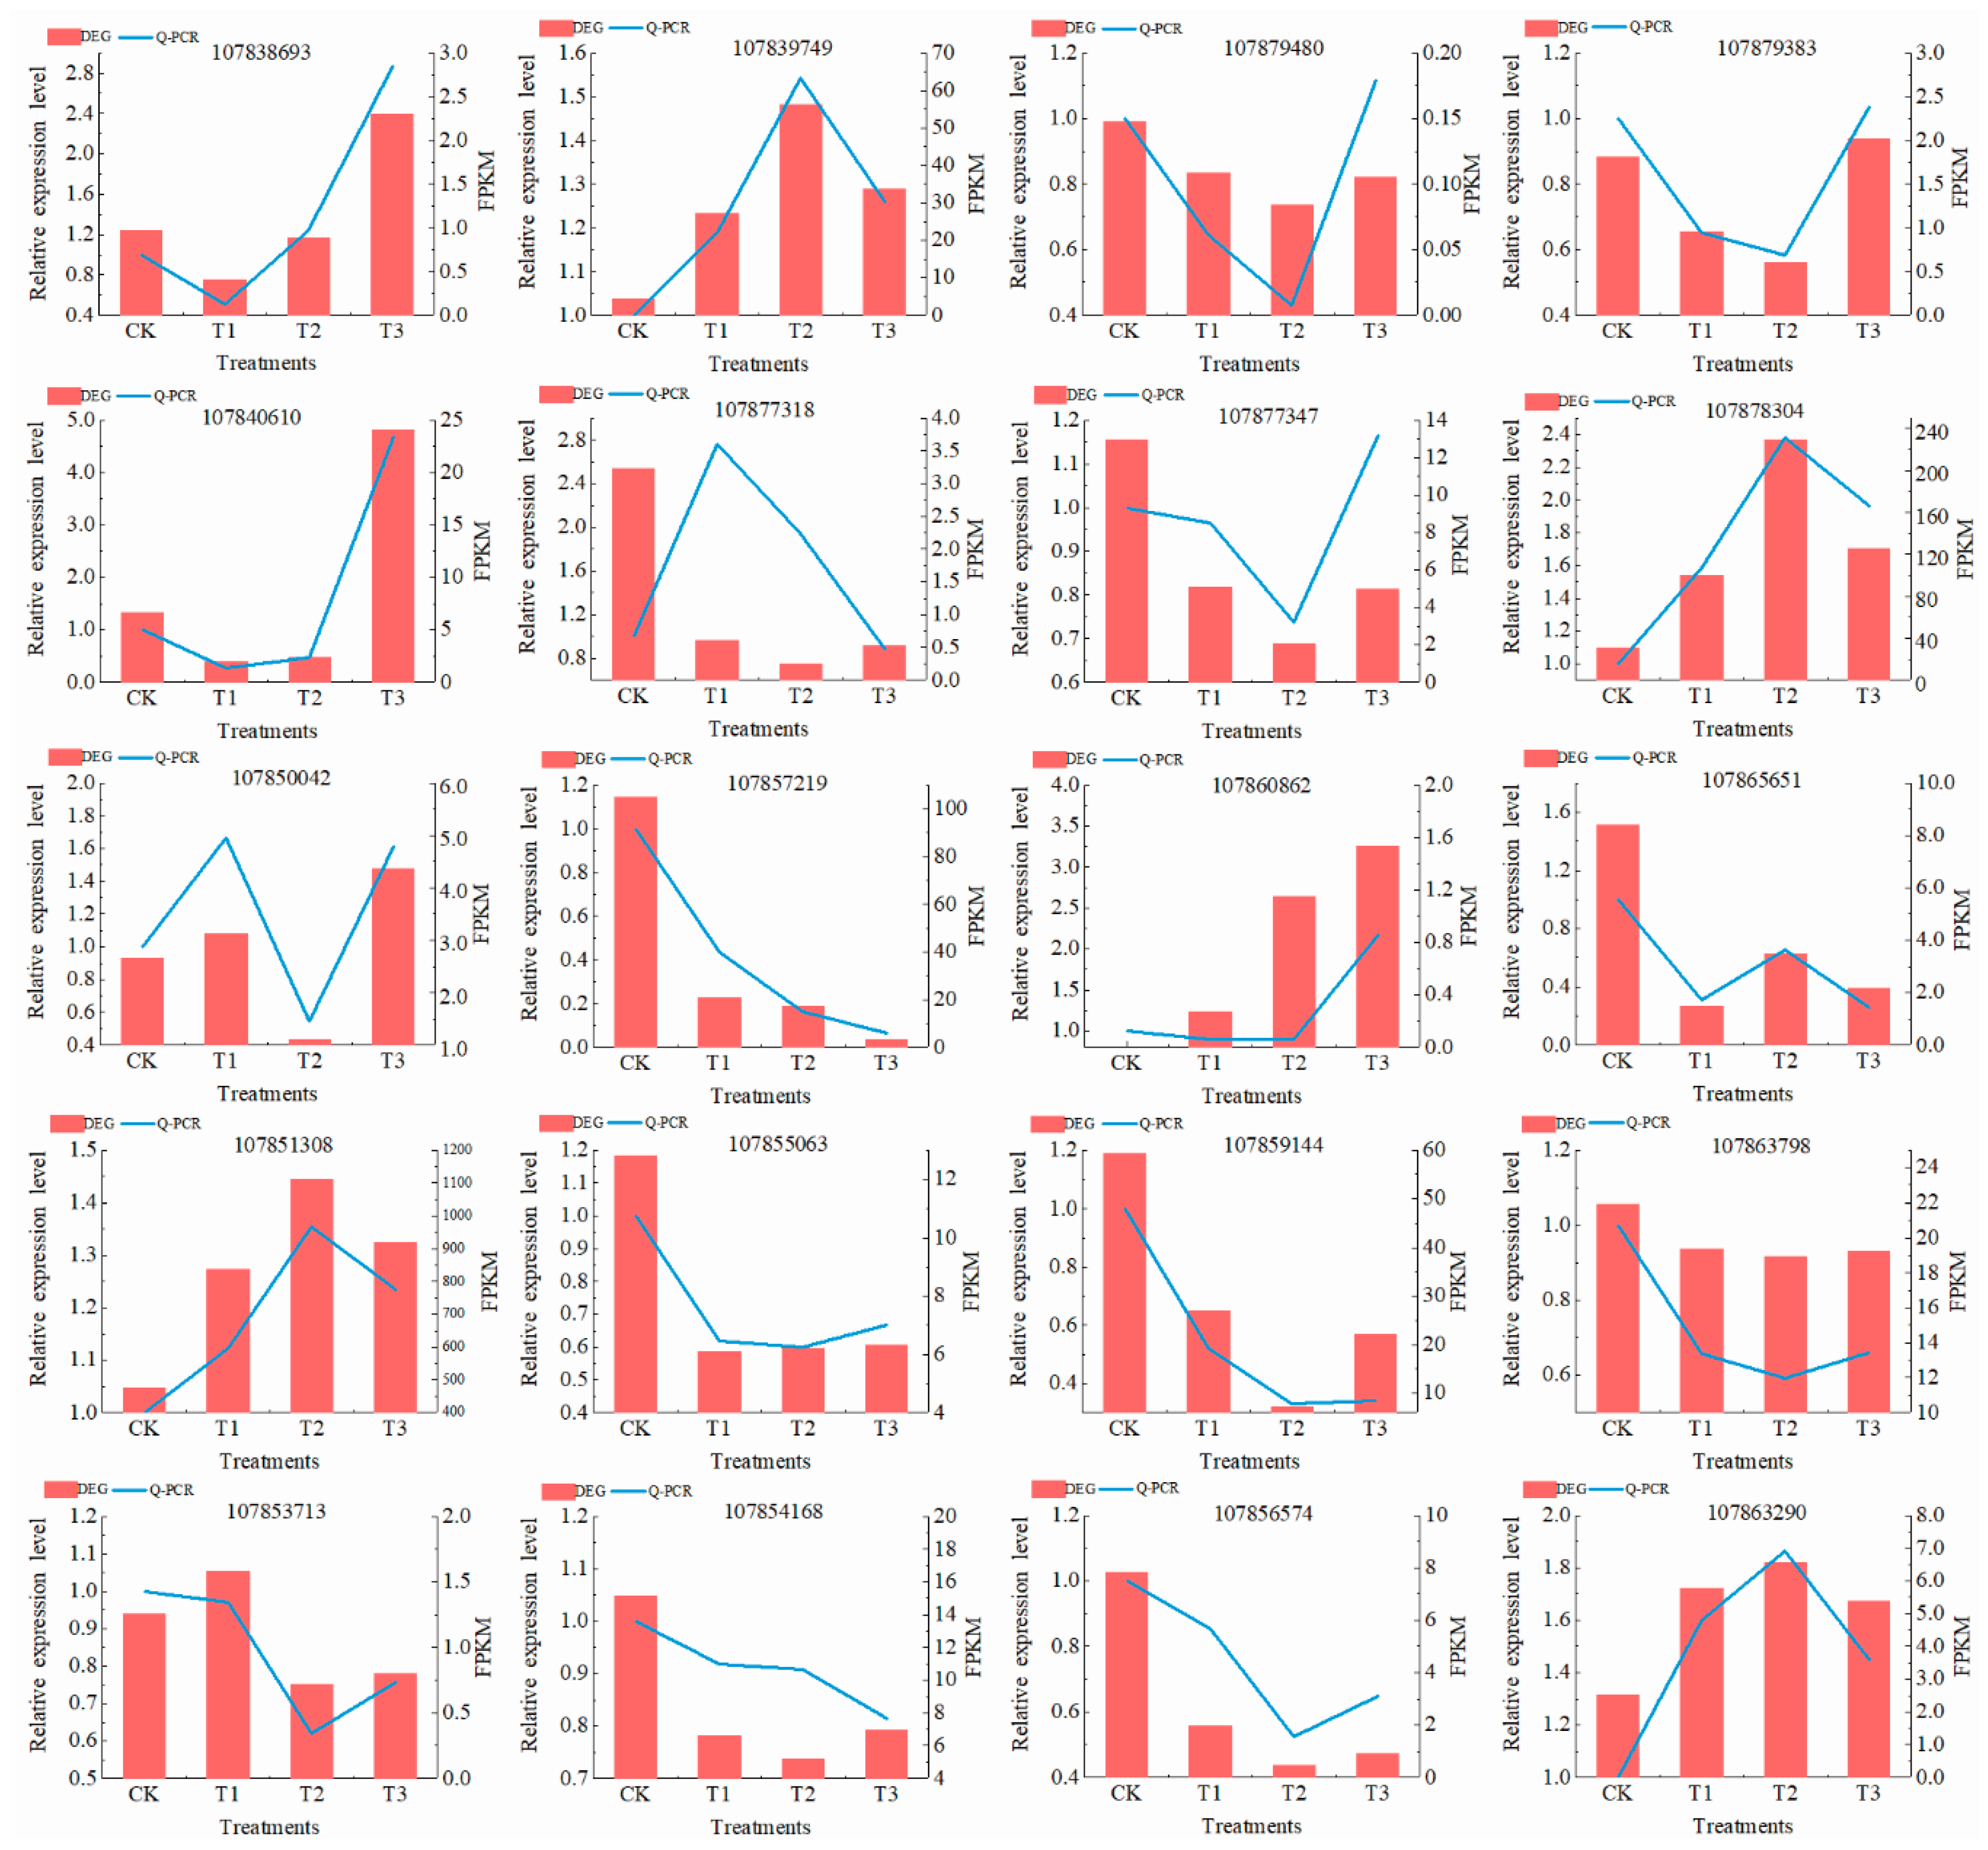
3.3.6. Confirmation of the RNA-Seq Results Using qRT-PCR

As shown in Figure 5, qRT-PCR analysis was performed to confirm the RNA-Seq results of the 20 DEGs which were randomly selected. In RNA-Seq and qRT-PCR data, the relative expression of these genes was different, but the trend in expression of these genes was similar, and this confirms the accuracy of the RNA-Seq results.

4. Discussion

The quality of light has a significant effect on the physiological processes and growth and development of plants [32]. In this experiment, the exposure of pepper seedlings to red:blue (4:1) light for 3 h or 5 h resulted in improved physiological processes and plant growth. The plants under these treatments generally had improved photosynthesis which resulted in higher plant biomass compared with the plants under normal LED light without supplementary red:blue lighting. The increased biomass in the plants grown under the red:blue (4:1) light for 3 h or 5 h could be attributed to enhanced photosynthesis as a result of the increased contents of chlorophyll a and total chlorophyll in the plants. Higher level of chlorophyll has been associated with improvement in photosynthesis since the chlorophyll is largely responsible for absorption of light energy needed for photosynthesis in green plants [33]. Although the effect of the supplementary application of 3 h or 5 h red:blue light in this experiment was in most cases not significantly different in terms of photosynthetic parameters, the use of 3 h supplementary lighting could be most preferable. This is because the application of 5 h supplementary lighting in a greenhouse is more likely to increase the cost of production due to the supply of two more hours of light energy. Naznin and Lefsrud compared the effect of red:blue (5:1, 10:1, and 19:1) light with 100% red LED on tomato plants and found that the highest photosynthetic rate of the plants was attained with red:blue lighting at 10:1 but this was not significantly different from the 5:1 ratio [34]. The influence of light quality on photosynthetic rate, dark respiration, intracellular carbon and nitrogen content, and accumulation of photosynthetic pigments and cell-wall polysaccharides during short-term incubation of the red alga Gelidium sesquipedale was investigated [35]. It was shown that blue light induced photosynthesis, dark respiration, and chlorophyll and biliproteins synthesis, particularly phycoerythrin. The synthesis of internal carbon and nitrogen was greatest with blue light treatment, while the proportion of cell-wall polysaccharides decreased during incubation under all light treatments except red light. The function of a nonphotosynthetic photoreceptor in the synthesis of cell-wall polysaccharides which was suggested to depend on the accumulation of cell-wall polysaccharides was not correlated with net photosynthesis as compared with carbon, chlorophyll, and phycoerythrin accumulation [35].
We analyzed DEGs data and found that there were 124 differential genes in CK vs. T1, of which 82 and 42 genes were up- and downregulated, respectively; 1283 differential genes in CK vs. T2, of which 705 were upregulated and 578 downregulated; and in CK vs. T3, there were 1091 differentially expressed genes, of which 553 were upregulated and 538 were downregulated. Thus, our results demonstrated that many genes were upregulated in the seedlings under the influence of supplementary red:blue light. We found that a total of 96 genes that are related to plant–pathogen interaction, zeatin biosynthesis, plant hormone signal transduction, and wax/cutin/suberine biosynthesis which are involved in the pathway of light reaction in plants were significantly enriched in T2 plants compared with plants under CK. This suggests that these genes which were significantly upregulated in the seedlings that were exposed to 3 h supplementary red:blue lighting contributed to the enhancement of photosynthesis in the plants. In a genetic screening of Arabidopsis populations for loci potentially involved in phytochrome (PHy) signaling, a mutant exhibited reduced seedling de-etiolation under the influence of continuous red light, but little if any change in response to the application of continuous far-red light. This suggested that the gene played a role in PHy signaling [36]. In another study, blue-light-related transcriptome showed that FKF1 were BL response-relevant genes, which constitute essential components in the physiological processes of circadian rhythm [13]. Moreover, Harari-Steinberg et al. reported that red, far-red, and blue lights regulated expression of the Elip genes, and phytochrome A and B were also involved in this signaling [37]. In another report, the overexpression of LSH1, which is a member of an uncharacterized gene family, enhanced light regulation of seedling development [38]. We found the 107873637 gene expressed at lower levels in T3 vs. CK. Another research found it encoded in the chloroplastic protein fluorescent in blue light; it regulated chlorophyll biosynthesis and could be a negative regulator of tetrapyrrole biosynthesis in chloroplasts [39]. The thylakoid ftsh Protease plays a role in the light-induced turnover of the photosystem II D1 protein [40]. Light signaling in Arabidopsis showed that the red, far-red, and blue lights regulated expression of the Elip genes [41]. The original function of lhcs and elips was to disperse the light energy absorbed in the form of heat [42]. In our study, these metabolically related genes differed significantly in the different groups and this therefore suggested they had great relationships with the light reaction.
Several studies have shown that supplementary lighting improves the growth and development of horticultural plants [18,19]. The significance of a combination of red:blue light in promoting the growth and development of horticultural plants has also been reported [34]. However, the results of our experiment have shown that the duration of exposure of plants to supplementary red:blue light is also important. Thus, this experiment has demonstrated that the application of 3 h supplementary red:blue (4:1) lighting is optimum for the growth of pepper seedlings under greenhouse conditions. The application of 3 h supplementary red:blue (4:1) lighting can be tested under the CSG condition for a possible adoption for commercial pepper seedling production during winter in northwest China.

5. Conclusions

This study analyzed the growth and physiological response of pepper (cv. “Longjiao NO. 5”) seedlings grown under different LED supplementary lights with red:blue (4:1) combination for 1 h, 3 h or 5 h durations in a climate-controlled room. We found that supplementing 7 h LED white light with red:blue (4:1) light for 3 h improved the physiological processes and growth of pepper seedlings better than the other light treatments. Furthermore, the transcriptome analysis revealed a lot of differentially expressed genes in CK vs. the other treatments, including T1, T2, and T3. Thus, CPRF2, Paggis, HLIPS, GIGANTEA, LSH1, and FtsH were expressed differently in the seedlings under the different light treatments. Based on GO enrichment analysis, DEGs were significantly upenriched on 15 GOs, of which xyloglucan:xyloglucosyl transferase activity and apoplastic, cellular polysaccharide metabolic, and cellular carbohydrate metabolic processes were closely related to the light reaction of plants. For a long time, research on LED supplementary light only focused on different light qualities and many studies have shown that the combined application of red and blue light at near 4:1 ratios is suitable for improved plant growth. However, there are relatively few transcriptome studies on plants under LED red:blue light supplementation. The results of this study give some clues about the molecular mechanism of pepper seedling growth under different durations of red:blue LED light, and also provide theoretical basis for effective use of red:blue LED light source under the CSG condition. In conclusion, although several studies utilized supplementary red:blue lighting at near 4:1 ratio to promote the growth and yield of plants under greenhouse conditions, the present study indicates that the duration of the supplementary light is important. Whereas the application of 1 h additional red:blue light was insufficient for significant increase in seedling growth, the 5 h supplementary light, which can increase the cost of production, gave a negligible increase in seedling growth. The application of supplementary red:blue light at 4:1 ratio for 3 h was the most appropriate duration for improved growth of pepper seedlings under greenhouse conditions. The results of this research provide important information on the use of red:blue supplementary lighting for commercial pepper seedling production under the CSG condition.

Supplementary Materials

The following are available online at https://0-www-mdpi-com.brum.beds.ac.uk/2073-4395/9/3/139/s1, Table S1: Sequences of primers used in this study.

Author Contributions

Formal analysis, Z.T.; Funding acquisition, J.Y.; Investigation, Z.T., J.Y., J.X., J.L., Z.F., M.M.D., W.L., Y.W., and L.H.; Methodology, J.Y., J.X., J.L., and Z.F.; Project administration, J.Y.; Software, Z.T.; Supervision, J.Y. and W.L.; Validation, J.Y., W.L., Y.W., and L.H.; Visualization, Z.T.; Writing—original draft, Z.T.; Writing—review & editing, Z.T. and M.M.D.

Funding

This research was funded by The National Key Research and Development Program of China, grant number 2018YFD0201205; The National Natural Science Foundation of China, grant number 31660584; Agriculture Research System of China, grant number CARS-23-C-07; and Science and Technology Key Project foundation of Gansu Province, China, grant number 17ZD2NA015.

Acknowledgments

Thanks for the guidance of the teacher and the cooperation of all my colleagues.

Conflicts of Interest

The authors declare no conflict of interest.

References

  1. Fukuda, N.; Ajima, C.; Yukawa, T.; Olsen, J.E. Antagonistic action of blue and red light on shoot elongation in petunia depends on gibberellin, but the effects on flowering are not generally linked to gibberellin. Environ. Exp. Bot. 2016, 121, 102–111. [Google Scholar] [CrossRef]
  2. Islam, M.A.; Kuwar, G.; Clarke, J.L.; Blystad, D.-R.; Gislerød, H.R.; Olsen, J.E.; Torre, S. Artificial light from light emitting diodes (LEDs) with a high portion of blue light results in shorter poinsettias compared to high pressure sodium (HPS) lamps. Sci. Hortic. 2012, 147, 136–143. [Google Scholar] [CrossRef]
  3. Nanya, K.; Ishigami, Y.; Hikosaka, S.; Goto, E. Effects of blue and red light on stem elongation and flowering of tomato seedlings. In Proceedings of the VII International Symposium on Light in Horticultural Systems, Wageningen, The Netherlands, 15–18 October 2012; pp. 261–266. [Google Scholar]
  4. Terfa, M.T.; Solhaug, K.A.; Gislerød, H.R.; Olsen, J.E.; Torre, S. A high proportion of blue light increases the photosynthesis capacity and leaf formation rate of Rosa× hybrida but does not affect time to flower opening. Physiol. Plant. 2013, 148, 146–159. [Google Scholar] [CrossRef] [PubMed]
  5. Chen, X.-L.; Guo, W.-Z.; Xue, X.-Z.; Wang, L.-C.; Qiao, X.-J. Growth and quality responses of ‘Green Oak Leaf’ lettuce as affected by monochromic or mixed radiation provided by fluorescent lamp (FL) and light-emitting diode (LED). Sci. Hortic. 2014, 172, 168–175. [Google Scholar] [CrossRef]
  6. Brown, C.S.; Schuerger, A.C.; Sager, J.C. Growth and photomorphogenesis of pepper plants under red light-emitting diodes with supplemental blue or far-red lighting. J. Am. Soc. Hortic. Sci. 1995, 120, 808–813. [Google Scholar] [CrossRef] [PubMed]
  7. Snowden, M.C. Effects of Blue and Green Light on Plant Growth and Development at Low and High Photosynthetic Photon Flux; Utah State University: Logan, UT, USA, 2015. [Google Scholar]
  8. Košvancová-Zitová, M.; Urban, O.; Navrátil, M.; Špunda, V.; Robson, T.; Marek, M. Blue radiation stimulates photosynthetic induction in Fagus sylvatica L. Photosynthetica 2009, 47, 388. [Google Scholar] [CrossRef]
  9. Son, K.-H.; Oh, M.-M. Leaf shape, growth, and antioxidant phenolic compounds of two lettuce cultivars grown under various combinations of blue and red light-emitting diodes. HortScience 2013, 48, 988–995. [Google Scholar] [CrossRef]
  10. Li, X.; Lu, W.; Hu, G.; Wang, X.C.; Zhang, Y.; Sun, G.X.; Fang, Z. Effects of light-emitting diode supplementary lighting on the winter growth of greenhouse plants in the Yangtze River Delta of China. Bot. Stud. 2016, 57, 2. [Google Scholar] [CrossRef] [PubMed]
  11. Bolger, M.E.; Arsova, B.; Usadel, B. Plant genome and transcriptome annotations: From misconceptions to simple solutions. Brief. Bioinform. 2017, 19, 437–449. [Google Scholar] [CrossRef]
  12. Li, C.-X.; Xu, Z.-G.; Dong, R.-Q.; Chang, S.-X.; Wang, L.-Z.; Khalil-Ur-Rehman, M.; Tao, J.-M. An RNA-seq analysis of grape plantlets grown in vitro reveals different responses to blue, green, red LED light, and white fluorescent light. Front. Plant Sci. 2017, 8, 78. [Google Scholar] [CrossRef]
  13. Deng, Y.; Yao, J.; Wang, X.; Guo, H.; Duan, D. Transcriptome sequencing and comparative analysis of Saccharina japonica (Laminariales, Phaeophyceae) under blue light induction. PLoS ONE 2012, 7, e39704. [Google Scholar] [CrossRef] [PubMed]
  14. Gunnlaugsson, B.; Adalsteinsson, S. Interlight and plant density in year-round production of tomato at northern latitudes. In Proceedings of the V International Symposium on Artificial Lighting in Horticulture 711, Lillehammer, Norway, 30 June 2006; pp. 71–76. [Google Scholar]
  15. Hovi-Pekkanen, T.; Tahvonen, R. Effects of interlighting on yield and external fruit quality in year-round cultivated cucumber. Sci. Hortic. 2008, 116, 152–161. [Google Scholar] [CrossRef]
  16. Pettersen, R.I.; Torre, S.; Gislerød, H.R. Effects of intracanopy lighting on photosynthetic characteristics in cucumber. Sci. Hortic. 2010, 125, 77–81. [Google Scholar] [CrossRef]
  17. Fierro, A.; Gosselin, A.; Tremblay, N. Supplemental carbon dioxide and light improved tomato and pepper seedling growth and yield. HortScience 1994, 29, 152–154. [Google Scholar] [CrossRef]
  18. Li, X.; Kang, S.; Li, F.; Zhang, X.; Huo, Z.; Ding, R.; Tong, L.; Du, T.; Li, S. Light supplement and carbon dioxide enrichment affect yield and quality of off-season pepper. Agron. J. 2017, 109, 2107–2118. [Google Scholar] [CrossRef]
  19. Naing, A.H.; Jeon, S.M.; Park, J.S.; Kim, C.K. Combined effects of supplementary light and CO2 on rose growth and the production of good quality cut flowers. Can. J. Plant Sci. 2016, 96, 503–510. [Google Scholar] [CrossRef]
  20. Terashima, I.; Fujita, T.; Inoue, T.; Chow, W.S.; Oguchi, R. Green light drives leaf photosynthesis more efficiently than red light in strong white light: Revisiting the enigmatic question of why leaves are green. Plant Cell Physiol. 2009, 50, 684–697. [Google Scholar] [CrossRef]
  21. Olle, M.; Viršile, A. The effects of light-emitting diode lighting on greenhouse plant growth and quality. Agric. Food Sci. 2013, 22, 223–234. [Google Scholar] [CrossRef]
  22. Taïbi, K.; Taïbi, F.; Abderrahim, L.A.; Ennajah, A.; Belkhodja, M.; Mulet, J.M. Effect of salt stress on growth, chlorophyll content, lipid peroxidation and antioxidant defence systems in Phaseolus vulgaris L. S. Afr. J. Bot. 2016, 105, 306–312. [Google Scholar] [CrossRef]
  23. Lichtenthaler, H.K. [34] Chlorophylls and carotenoids: Pigments of photosynthetic biomembranes. In Methods in Enzymology; Elsevier: New York, USA, 1987; Volume 148, pp. 350–382. [Google Scholar]
  24. Chen, J.; Hou, K.; Qin, P.; Liu, H.; Yi, B.; Yang, W.; Wu, W. RNA-Seq for gene identification and transcript profiling of three Stevia rebaudiana genotypes. BMC Genom. 2014, 15, 571. [Google Scholar] [CrossRef]
  25. Wang, L.; Feng, Z.; Wang, X.; Wang, X.; Zhang, X. DEGseq: An R package for identifying differentially expressed genes from RNA-seq data. Bioinformatics 2009, 26, 136–138. [Google Scholar] [CrossRef]
  26. Benjamini, Y.; Hochberg, Y. Controlling the false discovery rate: A practical and powerful approach to multiple testing. J. R. Stat. Soc. Ser. B (Methodol.) 1995, 289–300. [Google Scholar] [CrossRef]
  27. Young, M.D.; Wakefield, M.J.; Smyth, G.K.; Oshlack, A. Gene ontology analysis for RNA-seq: Accounting for selection bias. Genome Biol. 2010, 11, R14. [Google Scholar] [CrossRef]
  28. Xie, C.; Mao, X.; Huang, J.; Ding, Y.; Wu, J.; Dong, S.; Kong, L.; Gao, G.; Li, C.-Y.; Wei, L. KOBAS 2.0: A web server for annotation and identification of enriched pathways and diseases. Nucleic Acids Res. 2011, 39, W316–W322. [Google Scholar] [CrossRef] [PubMed]
  29. Livak, K.J.; Schmittgen, T.D. Analysis of relative gene expression data using real-time quantitative PCR and the 2− ΔΔCT method. Methods 2001, 25, 402–408. [Google Scholar] [CrossRef]
  30. Qin, C.; Yu, C.; Shen, Y.; Fang, X.; Chen, L.; Min, J.; Cheng, J.; Zhao, S.; Xu, M.; Luo, Y. Whole-genome sequencing of cultivated and wild peppers provides insights into Capsicum domestication and specialization. Proc. Natl. Acad. Sci. USA 2014, 111, 5135–5140. [Google Scholar] [CrossRef] [PubMed] [Green Version]
  31. Mortazavi, A.; Williams, B.A.; McCue, K.; Schaeffer, L.; Wold, B. Mapping and quantifying mammalian transcriptomes by RNA-Seq. Nat. Methods 2008, 5, 621. [Google Scholar] [CrossRef] [PubMed]
  32. Bian, Z.H.; Yang, Q.C.; Liu, W.K. Effects of light quality on the accumulation of phytochemicals in vegetables produced in controlled environments: A review. J. Sci. Food Agric. 2015, 95, 869–877. [Google Scholar] [CrossRef]
  33. Evans, J.R. Acclimation by the thylakoid membranes to growth irradiance and the partitioning of nitrogen between soluble and thylakoid proteins. Funct. Plant Biol. 1988, 15, 93–106. [Google Scholar] [CrossRef]
  34. Naznin, M.T.; Lefsrud, M.G. Impact of LED irradiance on plant photosynthesis and action spectrum of plantlet. In Proceedings of the Optics and Photonics for Information Processing VIII, San Diego, CA, USA, 19–20 May 2014; p. 921602. [Google Scholar]
  35. Wellmer, F.; Kircher, S.; Rügner, A.; Frohnmeyer, H.; Schäfer, E.; Harter, K. Phosphorylation of the parsley bZIP transcription factor CPRF2 is regulated by light. J. Biol. Chem. 1999, 274, 29476–29482. [Google Scholar] [CrossRef]
  36. Huq, E.; Tepperman, J.M.; Quail, P.H. GIGANTEA is a nuclear protein involved in phytochrome signaling in Arabidopsis. Proc. Natl. Acad. Sci. USA 2000, 97, 9789–9794. [Google Scholar] [CrossRef] [PubMed] [Green Version]
  37. Harari-Steinberg, O.; Ohad, I.; Chamovitz, D.A. Dissection of the light signal transduction pathways regulating the two early light-induced protein genes in Arabidopsis. Plant Physiol. 2001, 127, 986–997. [Google Scholar] [CrossRef] [PubMed]
  38. Zhao, L.; Nakazawa, M.; Takase, T.; Manabe, K.; Kobayashi, M.; Seki, M.; Shinozaki, K.; Matsui, M. Overexpression of LSH1, a member of an uncharacterised gene family, causes enhanced light regulation of seedling development. Plant J. 2004, 37, 694–706. [Google Scholar] [CrossRef] [Green Version]
  39. Song, X.; Li, Y.; Liu, T.; Duan, W.; Huang, Z.; Wang, L.; Tan, H.; Hou, X. Genes associated with agronomic traits in non-heading Chinese cabbage identified by expression profiling. BMC Plant Biol. 2014, 14, 71. [Google Scholar] [CrossRef] [PubMed]
  40. Lindahl, M.; Spetea, C.; Hundal, T.; Oppenheim, A.B.; Adam, Z.; Andersson, B. The thylakoid FtsH protease plays a role in the light-induced turnover of the photosystem II D1 protein. Plant Cell 2000, 12, 419–431. [Google Scholar] [CrossRef] [PubMed]
  41. Berry-Lowe, S.L.; Meagher, R.B. Transcriptional regulation of a gene encoding the small subunit of ribulose-1, 5-bisphosphate carboxylase in soybean tissue is linked to the phytochrome response. Mol. Cell. Biol. 1985, 5, 1910–1917. [Google Scholar] [CrossRef] [PubMed]
  42. Montané, M.-H.; Kloppstech, K. The family of light-harvesting-related proteins (LHCs, ELIPs, HLIPs): Was the harvesting of light their primary function? Gene 2000, 258, 1–8. [Google Scholar] [CrossRef]
Figure 1. Spectral qualities of the supplementary light sources used in the experiment: (a) full-spectrum white LEDs (W); (b) red/blue LED light source with a 4:1 ratio (R4:B1).
Agronomy 09 00139 g001
Figure 2. GO enrichment analysis of DEGs between T2 and CK treatments. The 30 most enriched GO terms including upregulation and downregulation are shown. Asterisks indicate significantly enriched GO terms (q < 0.05).
Agronomy 09 00139 g002
Figure 3. KEGG pathway enrichment analysis of DEGs T2 and CK treatments. The left Y-axis shows the KEGG pathway. The X-axis shows the Rich factor. A high q-value is represented by blue and a low q-value is represented by red (q < 0.05).
Agronomy 09 00139 g003
Figure 4. Venn diagram and cluster analyses of DEGs in CK vs. T1, CK vs. T2, and CK vs. T3. (A) Venn diagram showing the overlapped DEGs in three comparison groups. (B) Clustered heat maps on the right show the differential expression levels of overlapped DEGs in these groups.
Agronomy 09 00139 g004
Figure 5. Real-time quantitative PCR (qRT-PCR) validation of 20 randomly selected DEGs identified by RNA-Seq in pepper grown under CK, T1, T2, and T3 light condition. The red histograms denote the RNA-Seq results. The blue line denotes the mean value of q-PCR results.
Agronomy 09 00139 g005
Table 1. The different supplementary light designs used in the experiment.
TreatmentsDescription
CK (Control)7 h white LED + no supplementary R4B1
T17 h white LED + 1 h supplementary R4B1
T27 h white LED + 3 h supplementary R4B1
T37 h white LED + 5 h supplementary R4B1
Note: The photosynthetic photon flux density (PPFD) was 300 μmol·m−2·s−1 and it was maintained at this level by adjusting the distance of the LEDs above the plants relative to the light source. The PPFD was measured using a plant illumination analyzer (PLA-20, Everfine Corporation, Hangzhou, China).
Table 2. Effect of supplementary light treatments on growth traits of pepper seedlings.
Light TreatmentPlant Height (cm)Stem Diameter (mm)Leaf Area (cm2)Total Length of Root (cm)Root Surface Area (cm2)Root Volume (cm3)Fresh Biomass (g·plant−1)Dry Weight of Root (g·plant−1)Dry Weight of Stem (g·plant−1)Dry Weight of Leaf (g·plant−1)
CK10.33 ± 0.19 c3.45 ± 0.11 a33.48 ± 1.52 b444.51 ± 32.49 c67.81 ± 4.69 b0.83 ± 0.10 b9.62 ± 0.30 b0.14 ± 0.02 b0.10 ± 0.01 b0.49 ± 0.08 b
T114.97 ± 0.29b3.54 ± 0.08 a39.81 ± 2.56 a502.40 ± 32.28 c80.37 ± 7.04 b1.00 ± 0.06 b11.12 ± 0.15 a0.20 ± 0.01 ab0.17 ± 0.01 a0.71 ± 0.01 a
T217.37 ± 0.91 a3.65 ± 0.10 a43.79 ± 0.79 a963.94 ± 21.90 a 155.76 ± 1.81 a2.01 ± 0.06 a12.48 ± 0.61 a0.21 ± 0.01 ab0.22 ± 0.03 a0.79 ± 0.02 a
T316.73 ± 0.96 ab3.78 ± 0.10 a33.67 ± 0.96 b803.07 ± 27.87 b137.23 ± 13.67 a1.87 ± 0.37 a12.03 ± 0.51 a0.27 ± 0.01 a0.19 ± 0.02 a0.74 ± 0.03 a
Data are shown as treatment means ± Standard error of means of three replicates.; mean values followed by different letters in the same column indicate significant differences by the Duncan’s multiple range test at p ≤ 0.05.
Table 3. Effect of supplementary light treatments on photosynthetic parameters and photosynthetic pigments of pepper seedlings.
Light TreatmentNet Photosynthetic Rate (Pn/μmol·m–2·s–1)Stomatal Conductance (Gs/mmol·m−2·s−1)Intercellular CO2 Concentration (Ci/μmol·mol−1)Transpiration Rate (Tr/mmol·m−2·s−1)Chlorophyll a Content (mg·gFW−1)Chlorophyll b Content (mg·gFW−1)Carotenoid Content (mg·gFW−1)Total Chlorophyll Content (mg·gFW−1)
CK8.5 ± 0.31 a402 ± 8.50 b396 ± 3.10 a3.07 ± 0.11 b1.79 ± 0.03 b0.69 ± 0.02 a0.24 ± 0.01 a2.48 ± 0.05 c
T19.1 ± 0.22 a473 ± 8.07 a389 ± 0.45 a3.4 ± 0.19 ab1.89 ± 0.05 b0.74 ± 0.05 a0.31 ± 0.04 a2.63 ± 0.04 c
T29.8 ± 0.47 a488 ± 9.62 a365 ± 8.06 b3.8 ± 0.13 a2.38 ± 0.09 a0.81 ± 0.09 a0.31 ± 0.04 a3.19 ± 0.08 b
T36.6 ± 0.21 b332 ± 19.74 c393 ± 2.93 a3.2 ± 0.18 ab2.49 ± 0.09 a0.90 ± 0.09 a0.33 ± 0.04 a3.39 ± 0.03 a
Data are shown as treatment means ± Standard error of means of three replicates; mean values followed by different letters in the same column indicate significant differences by the Duncan’s multiple range test at p ≤ 0.05.

