Article

A Method for a Fast Evaluation of the Biostimulant Potential of Different Natural Extracts for Promoting Growth or Tolerance against Abiotic Stress

1
Instituto de Biología Molecular y Celular de Plantas (IBMCP), Universitat Politécnica de Valencia-Consejo Superior de Investigaciones Científicas, 46022 Valencia, Spain
2
Agrometodos S.A., Las Rozas, 28232 Madrid, Spain
*
Author to whom correspondence should be addressed.
Submission received: 1 March 2019 / Revised: 13 March 2019 / Accepted: 15 March 2019 / Published: 20 March 2019
(This article belongs to the Section Soil and Plant Nutrition)

Abstract

:
Under adverse environmental conditions, biostimulants can help crops withstand abiotic stress while increasing productivity. We have designed a sequential system based on two different biological model organisms—the baker’s yeast Saccharomyces cerevisiae and the plant Arabidopsis thaliana—to evaluate the potential as biostimulants of a battery of 11 different natural extracts on a blind-test basis. Firstly, yeast assays consist in a drop test in solid medium, and a BioScreen® test with liquid cultures. The method is completed with two plant assays to assess effects on germination and growth. The designed method provided relevant data on the ability of each extract to promote biomass accumulation under normal conditions and in the presence of abiotic stresses, such as drought, salinity, or cold. Besides, this laboratory-based method allowed to assess the potential toxicity or unsuspected deleterious effect of each extract in a short period of time (six months) with low budget and space requirements. We could also test the effects of the biostimulants during germination, vegetative, and reproductive growth, under normal and stressed conditions. As each product is tested on different organisms at different developmental stages, we could get some preliminary information on the mode of action. This method enables a fast screen of many different products, in order to select potential candidates to be marketed as biostimulants, avoiding long and expensive field tests with previously uncharacterized products.

Graphical Abstract

1. Introduction

The amount of arable land is limited so to obtain a higher food supply for a growing population. Therefore, we must increase the yield per area of already cultivated land, as well as the tolerance to drought and other abiotic stresses [1]. With this goal in mind, biofertilizers and biostimulants have been proposed as a potential solution to stimulate plant growth, increase yield, reduce the abiotic stress impact, and decrease the fertilizer and pesticide dependence [2].
The concept of biostimulants are still under discussion. The “biogenic stimulation” was first proposed by Filatov [3], but there is not a consensus definition yet. In a recent report, Yakhin et al. depicted chronologically the different definitions and proposed the following consensus for biostimulants: “A formulated product of biological origin that improves plant productivity as a consequence of the novel or emergent properties of the complex of constituents and not as a sole consequence of the presence of known essential plant nutrients, plant growth regulators, or plant protective compounds” [4]. More recently, additional reports addressed this question [5,6].
One of the main factors determining the efficiency of a given biostimulant is its ability to increase yield under adverse environmental conditions. Abiotic stress is considered the major limitation for productivity [7,8,9,10].
The composition and the origin of biostimulants can be very diverse. Usually amino acid-containing biostimulants (i.e., protein hydrolysates) are derived from the chemical or biological hydrolysis of animal or plant protein-rich substrates. It is believed that the exogenous application of amino acids such as proline or glycine betaine can increase the yield of crops under different types of abiotic stress [11,12,13,14]. Glutathione—a tripeptide composed of cysteine, glutamic acid, and glycine—is also associated with tolerance to abiotic stress, since it has an important role in the protection against reactive oxygen species [12,15,16]. Other studies have shown the effect of biostimulants based on humic substances, microalgae, and algae extracts, whose popularity increased in recent years due to the improvement of tolerance to abiotic stress [17,18,19], although the molecular mechanisms underlying these effects remain mostly uncharacterized.
The demand for biostimulants is likely going to increase in the coming years for the conventional and growing demand of organic and low input farming. The European market for biostimulants was around 800 million euros in 2018, with an annual growth potential of more than 10%. In North America, the biostimulant market is expected to grow at a rate of 12.4% annually, reaching around 69 billion dollars in 2018. Similar increases are happening around the world [20].
Although biostimulants used in agriculture come from many different sources, their compounds are poorly characterized; some of them are even marketed without efficiency data. Their regulation and their legal framework is based mainly in the origin of the material and not on effectiveness. This is likely to change in the future, as a growing market usually demands strict regulations and more protection for consumers and farmers. The determination of the mode of action at this stage may be performed on a broad basis due to the difficult in characterizing the specific mode of action [4]. Currently, there are scarce methods or protocols in the literature to evaluate the biostimulant potential of an extract [21].
Validating the efficiency of uncharacterized biostimulants directly in field experiments with crops can be long and expensive due to the requirements of time and infrastructure. The use of model organisms in laboratory-based tests can circumvent most of the problems and asses the functionality of each biostimulant in a cheap and fast manner. The baker’s yeast Saccharomyces cerevisiae is a unicellular, non-pathogenic fungus with a high growth rate. It is easily manipulated in the laboratory, with the genome completely sequenced and highly characterized [22]. A large number of metabolic pathways and molecular mechanisms are similar between this organism and plants, making it a suitable model, since it facilitates the understanding of the biological phenomena that occur in more complex organisms [23]. Regarding the response to abiotic stress, yeast has been previously proposed as a model organism for the study of stress tolerance in plants [24]. In addition, it has been proposed that the effect of the biostimulant may not be exerted directly to the plant but to the endophytic or non-endophytic bacteria, yeast, and fungi. Thus, promoting the growth of any of these microorganism may increase plant yield [25] and therefore using a yeast model system may unveil a biostimulant effect that affects microbial growth.
A limitation for yeast as a model system is that some biostimulants may exert action by affecting a plant biochemical or signal transduction pathway that is not conserved in yeast. Therefore, we must complement our approach with a plant model system. Arabidopsis thaliana is a crucifer plant whose genome is completely sequenced. Arabidopsis completes its life cycle in three months, grows easily under greenhouse condition, and has little space or nutrient requirements. All this allows for a significant number of tests in a short time. Although the impact of abiotic stress in plants has been studied for several decades, it was by using Arabidopsis thaliana as a model that the stress response mechanisms began to be discovered and characterized at the molecular level, including the effect on vegetative and reproductive growth [26].
In this report, we describe how by using these two model organisms we can perform functional laboratory-based blind tests to characterize the biostimulant capacity of extracts from natural products in a cheap and fast manner.

2. Materials and Methods

2.1. Candidate Biostimulants

In this study, 11 candidate products were tested for biostimulant activity and were provided by the company Agrométodos S.A. The description of the products can be found in Table 1, although the experiments were performed as blind tests, so product composition was unknown to experimenters. Nevertheless, all products are derived from natural extracts and its composition, in the case that a biological stimulation effect is determined, would be in agreement with the biostimulant definition of Yakhin et al. [4]. The concentration is indicated in each case as weight/volume or volume/volume.

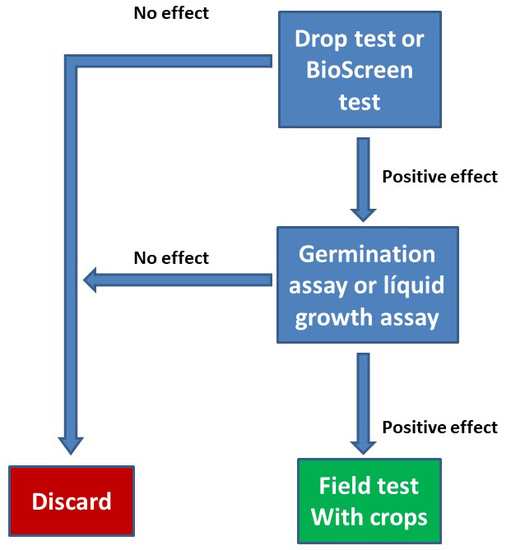
2.2. Experimental Setup

The working hypothesis for this report is that we can detect a biostimulant effect under normal or abiotic stress conditions of a previously uncharacterized product by using yeast and Arabidopsis in a sequential manner. The laboratory-based method was designed for a sequential system, based on two different biological model systems: the baker’s yeast S. cerevisiae and the plant model system A. thaliana.
First, the yeast assays consisted in a drop test in solid yeast extract Peptone Dextrose (YPD) medium performed under normal growth condition without abiotic stress to determine the toxic dose of the products and the possible biostimulant effect in yeast. A subsequent second yeast drop test was carried out under abiotic stress conditions (osmotic, salt, and cold stress) by using non-toxic dose of each product. Afterwards, a BioScreen® (Oy Growth Curves Ab Ltd., Helsinki, Finland) assay was performed with yeast liquid cultures in microtiter plates, under normal conditions, and abiotic stresses, to evaluate whether or not the biostimulant effect of the product was exerted during the exponential phase and/or affects growth speed.
The plant assays were performed to evaluate effect of each product on germination and plant growth under normal conditions and abiotic stresses. Percentages of seedlings with green expanded cotyledons were recorded with different doses of each product. Mass accumulation and percentage of flowering plants were recorded in plantlets for three weeks. A flowchart of the method can be found as graphical abstract.

2.3. Drop Test Yeast Assays

The drop test assays were performed as indicated in [27]. All assays where performed in a solid YPD medium, a nutrient-rich medium (1% yeast extract, 2% bacteriological peptone, 2% glucose, and 2% agar in distilled water). Drop tests were performed by growing wild-type Saccharomyces cerevisiae strain BY4741 (MATa his3Δ1 leu2Δ0 met15Δ0 ura3Δ0) [28] cells until saturation in YPD medium. Cell cultures were then diluted 1:10, 1:100, and 1:1000, and spotted onto plates of YPD medium containing NaCl, LiCl, or Sorbitol. The products assayed were added after autoclaving but prior to gelification; growth was recorded after four to five days. Cold stress was applied by exposing YPD plates to 10 °C for four weeks. Three independent complete experiments, each using a different plate and three biological replicates per plate, were performed with similar results.

2.4. BioScreen® Assays

Yeast liquid cultures were grown until saturation in liquid YPD medium (as described before, but without 2% agar), then diluted to an initial OD600 of 0.01 in YPD medium containing the indicated biostimulant and the indicated stress. Growth was monitored in microtiter plates using the BioScreen® C microbiological workstation with automatic recording of OD600 every 30 min. Each point represents the mean of three replicates, with SE < 2% in most cases (error bars are not shown for clarity). The experiment was reproduced independently three times with similar results.

2.5. Plant Assays

A detailed description of plant assays can be found in [29]. For in vitro culture, seeds were surface-sterilized with commercial bleach and rinsed with sterile water. The MS solid medium contained 0.8% phytoagar, Murashige and Skoog (MS) basal salt mixture (0.4%; Sigma, Saint Louis, MO, USA), sucrose (1%), and 10 mM MES (2-(N-morpholino) ethanesulfonic acid) buffer, adjusted to pH 5.5 with Tris base (tris(hydroxymethyl)aminomethane). Stratification was performed over three days at 4 °C. Then, plates were grown under long-day chamber conditions (16 h light/8 h dark, 23°C, 130 μE m−2 s−1, 70% relative humidity). When indicated, the medium was supplemented with NaCl, LiCl or mannitol, as indicated in each case. Germination was scored after four or five days, except for cold, where plants were grown at 10 °C and germination was scored after 10 days. For growth in liquid culture, the MS medium was prepared without phytoagar and plants were grown in six-well Cellstar plates (Greiner). Each well contained 7 mL of the medium and three seedlings that had been previously cultivated for six days in an MS solid medium without stress nor biostimulant and then transferred to the liquid medium with the indicated additive (stress and/or biostimulant). Plates were incubated with shaking (100 rev/min).

3. Results

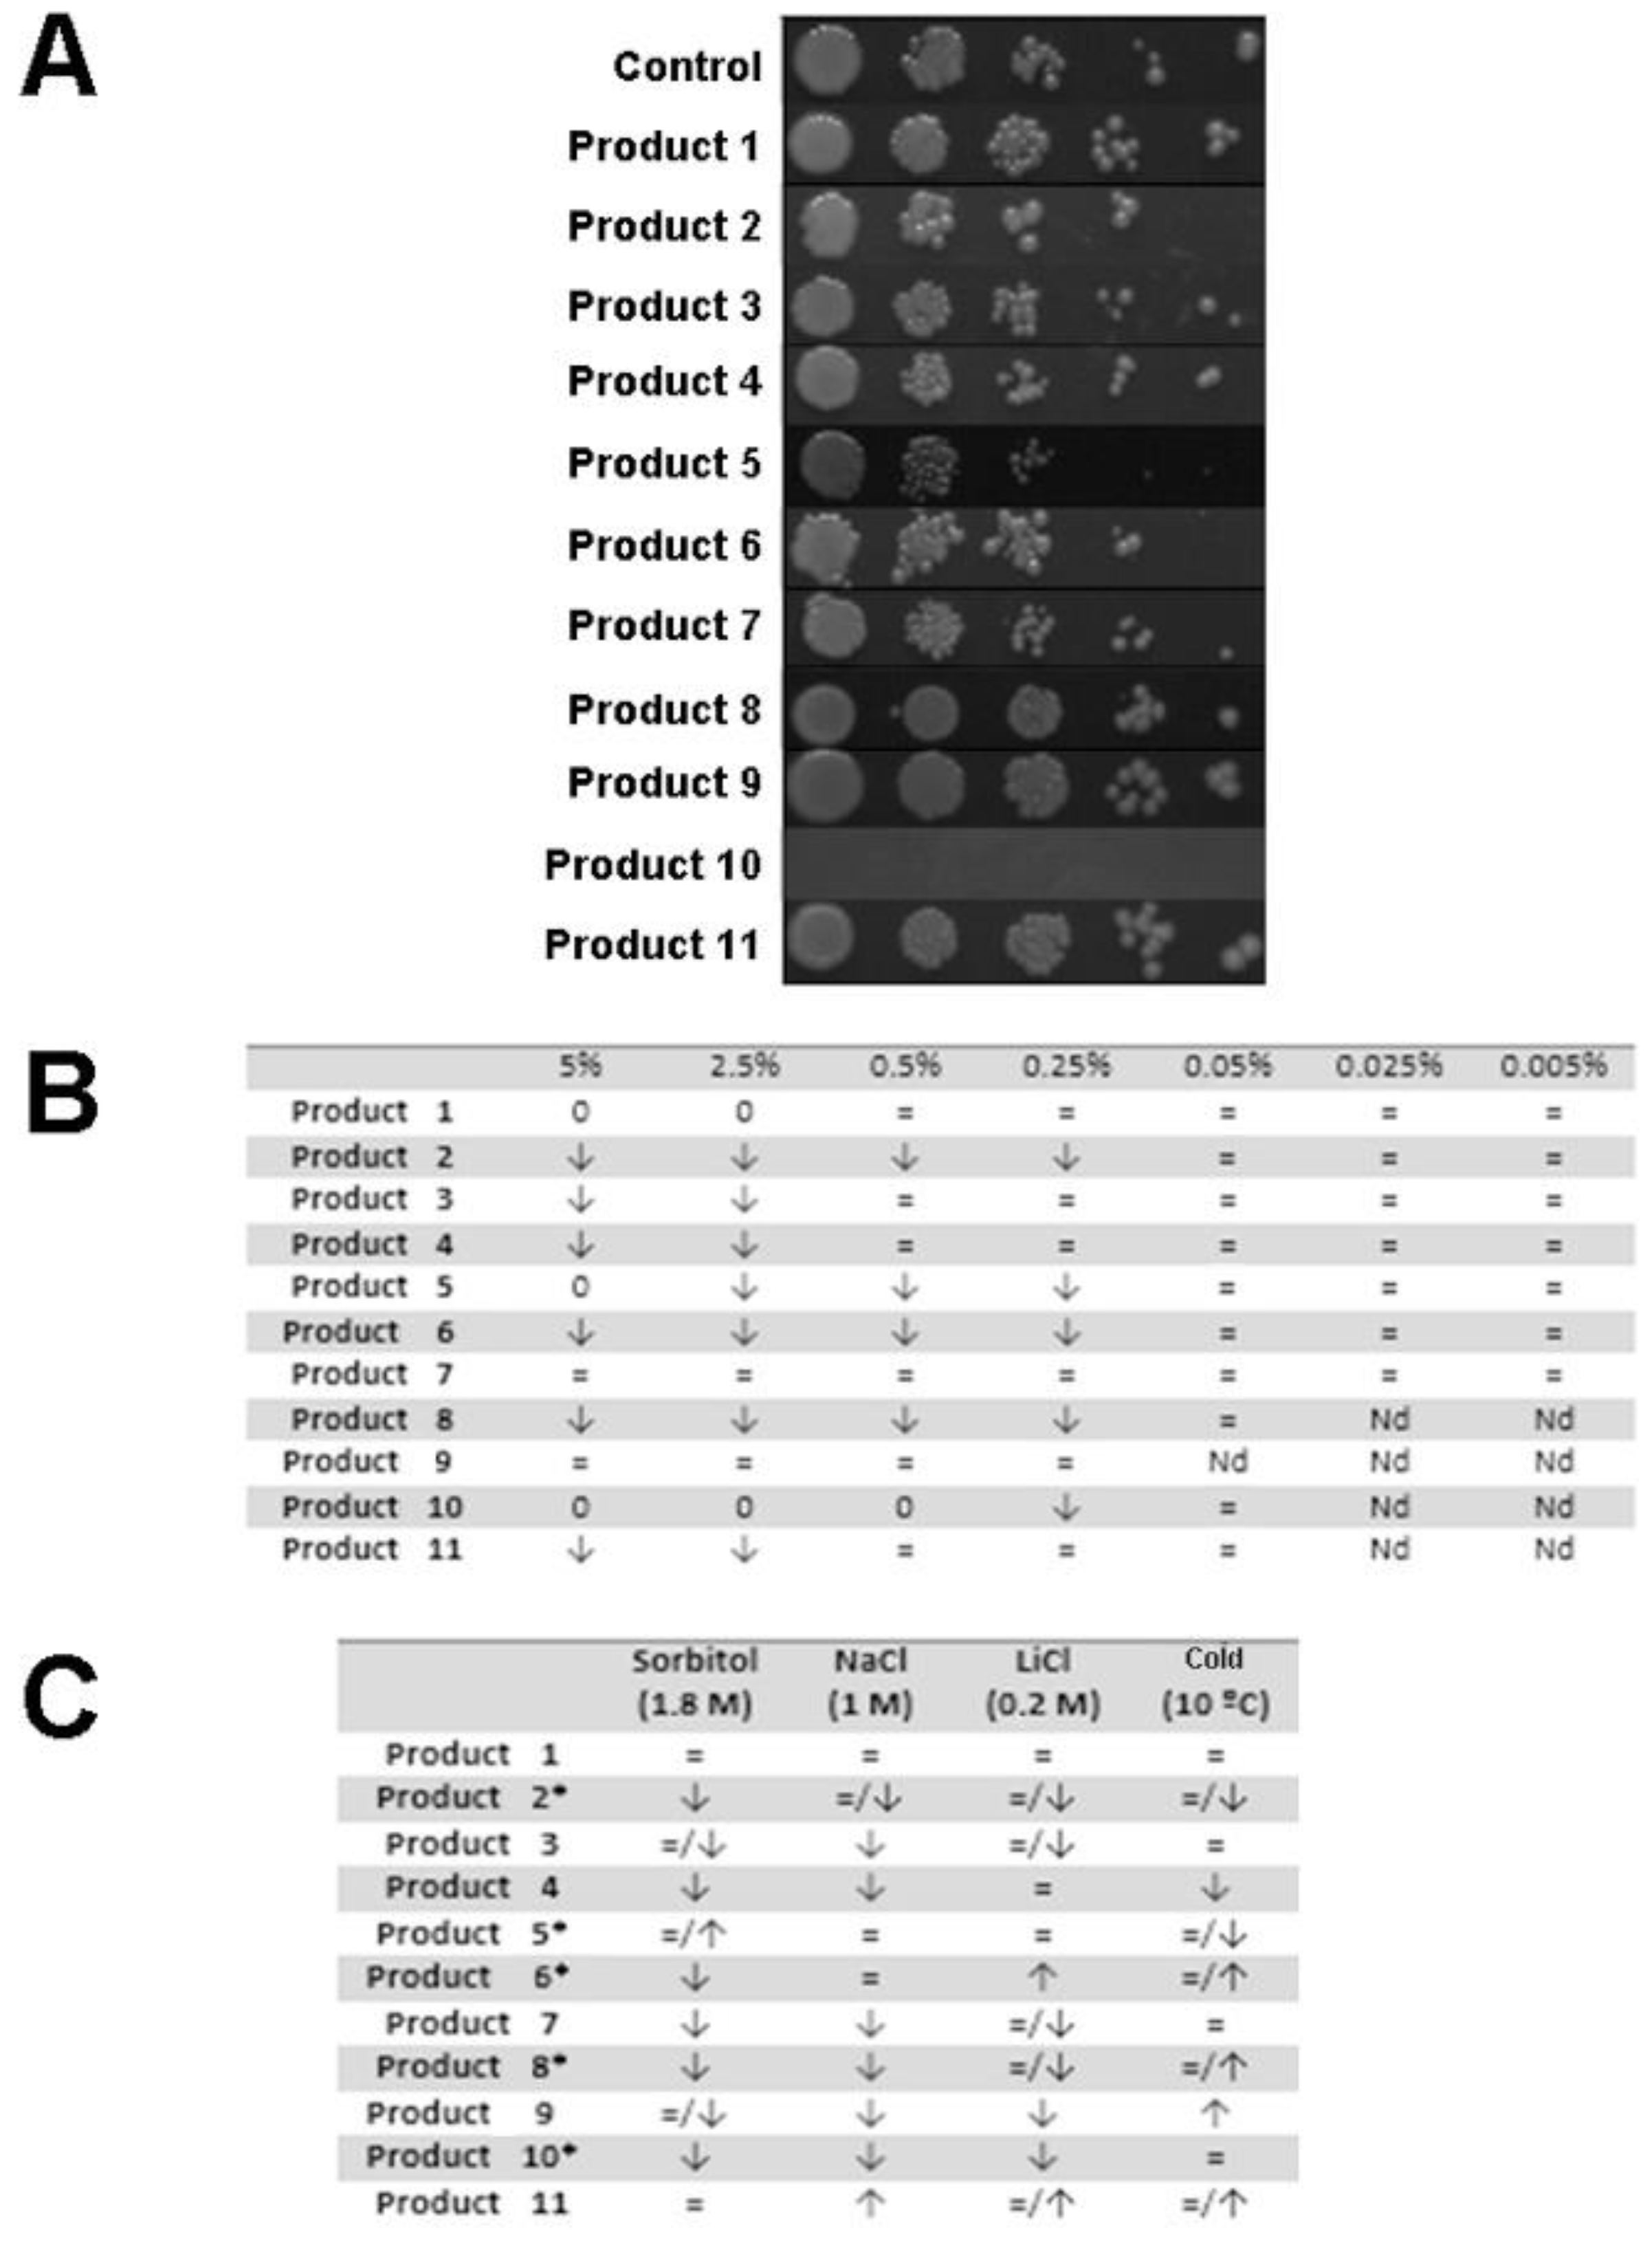
3.1. Determination of the Toxic Dose of the Products

All the experiments were designed as blind-tests. Thus, we did not have any information on the composition of the products, which was provided during the elaboration of the manuscript (Table 1).
The first assay consisted in determining the toxic concentration for yeast of the given products. We prepared several series of YPD plates containing different concentration of every product (from 5% concentration (weight/volume) to 0.005%). Three repetitions were made per product and concentration. These experiments allowed for the determination of the maximum concentration at which the addition of the biostimulant did not negatively affect yeast growth. The obtained concentrations have been applied in subsequent experiments. A representative experiment is shown in Figure 1A; total data are summarized in Figure 1B. According to these results, we assayed the biostimulant effect in yeast with a 0.5% concentration, except for products (P) P2, P5, P6, P8, and P10, in which we have used a 0.05% concentration. We did not observe that any of the products enhanced the growth when compared to the medium without any additive and without stress, so none of the products had a biostimulant effect on yeast growth under normal conditions.

3.2. Determination of the Biostimulant Effect in Yeast

Once we determined that none of the products was enhancing growth under normal conditions, we wanted to test whether the products had a biostimulant effect under abiotic stress. We performed drop test experiments in medium with sorbitol, a polyalcohol which increases the osmotic potential of the medium, and therefore induces osmotic stress similar to what happens to plants under drought conditions [15]. We tested the effect of the extracts under salt stress using lithium and sodium. Yeast can grow in sodium concentrations higher than 1 M. At these concentrations, yeast has to cope with the toxic effect of sodium cations, but also with the osmotic effect. At the molecular level, both responses are controlled by different signaling pathways. We tested in parallel lithium chloride as lithium is toxic at lower concentrations, so the osmotic effect is negligible and the deleterious effect for yeast is due to the toxicity of lithium cations. We also tested cold stress by growing the plates at 10 °C, a temperature in which yeast is able to grow, but only at a slow rate [30]. Results are summarized in Figure 1C. Products 6 and 11 increased yeast growth in a medium that contained LiCl; products 6, 8, 9, and 11 increased growth under cold stress.

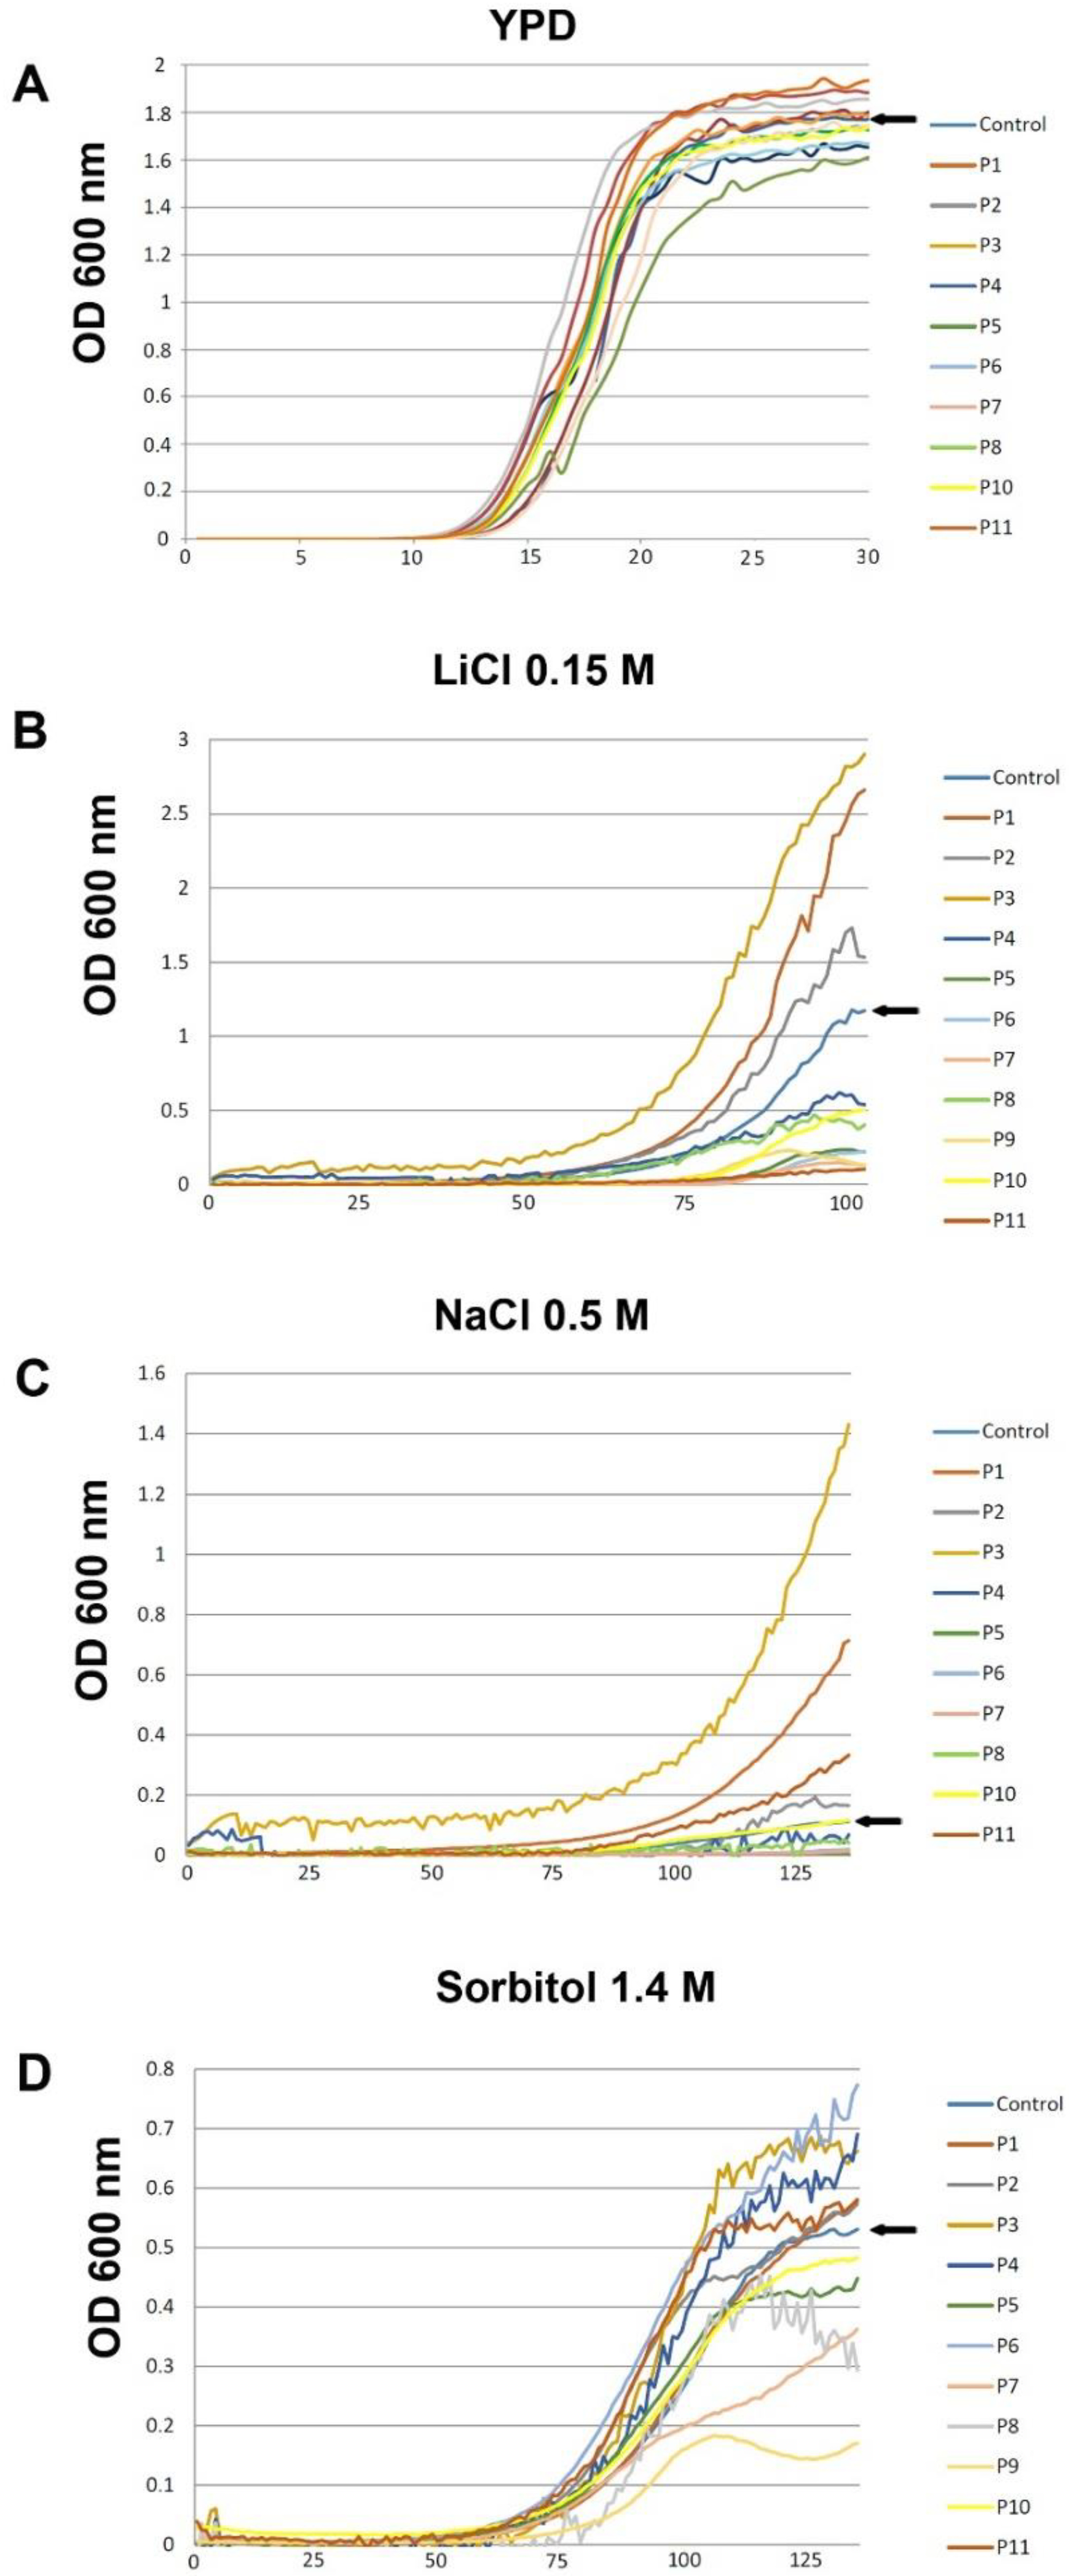
3.3. Evaluation of the Biostimulant Effect of the Different Product in Yeast Under Continuous Growth

A yeast drop test assay can provide information in a short time, but has several limitations. Growth of Saccharomyces cerevisiae presents two separate phases. In a nutrient rich medium growth (measured as an increase in optical density) follows an exponential pattern, while in a nutrient depleted medium or in the presence of stress, cells enter the stationary phase. Yeast metabolism and stress response is different in these two phases. A drop test assay focuses on continuous growth in solid media and renders a final state result. When growing in solid medium the majority of yeast cells are in the stationary phase, as the effective growth occurs mostly in the borders of the colony. If the biostimulant exerts its effect during the exponential growth phase the effect may be underestimated.
Another limitation of a drop test assay is that it is difficult to quantify; its results are qualitative rather than quantitative. To gain more information, we assayed the effect of the different products under continuous growth, measured as an increase in the optical density at 600 nm by using a BioScreen® equipment, which measures turbidity from cells growing in a 96-well microplate. This has several advantages. If the biostimulant only affects the exponential phase, but not the stationary phase, no effect will be seen in a drop test assay. Another advantage of a BioScreen® test is that if the biostimulant enhances growth speed, but not total yield, we can recover quantitative data from the growth curve, using time and optical density as parameters and measure the effect. A higher final value of the growth curve in the Y axis means higher yeast yield, as the final optical density is higher. A more pronounced slope means fastest growth. In normal growth conditions (YPD without stress) biostimulant had little effect and differences in the final yield where not significant (Figure 2A). In a medium containing 0.15 M of LiCl P1, P2, and P3, there was an increased yield average of 130%, 30%, and 154%, respectively, as well as an increased growth rate (Figure 2B). In a medium with NaCl P1, there was an increased yield average of 540%, P3 1200%, and P11 200%. The other products did not enhance yield or even have a deleterious effect (Figure 2C). Finally, for osmotic stress induced by sorbitol P3 increased yield by 25%, P4 by 35%, and P6 by 50%. In addition, all of these products increased the growth rate (Figure 2D).
The results of our first and second round of screening using yeast as a model system is that we have detected some biostimulant effect for P6, P8, P9, and P11 in drop test assays and for P1, P2, P3, and P4 in BioScreen® assays. P6 and P11 increased resistance to stress in drop tests and BioScreen® assays. None of them promoted yeast growth in the absence of stress. At this stage, we could have discarded the products that were not conferring any tolerance (P5 and P7) but to perform a better validation of the proposed system we undertook the study in the plant model system Arabidopsis thaliana with all the tested products.

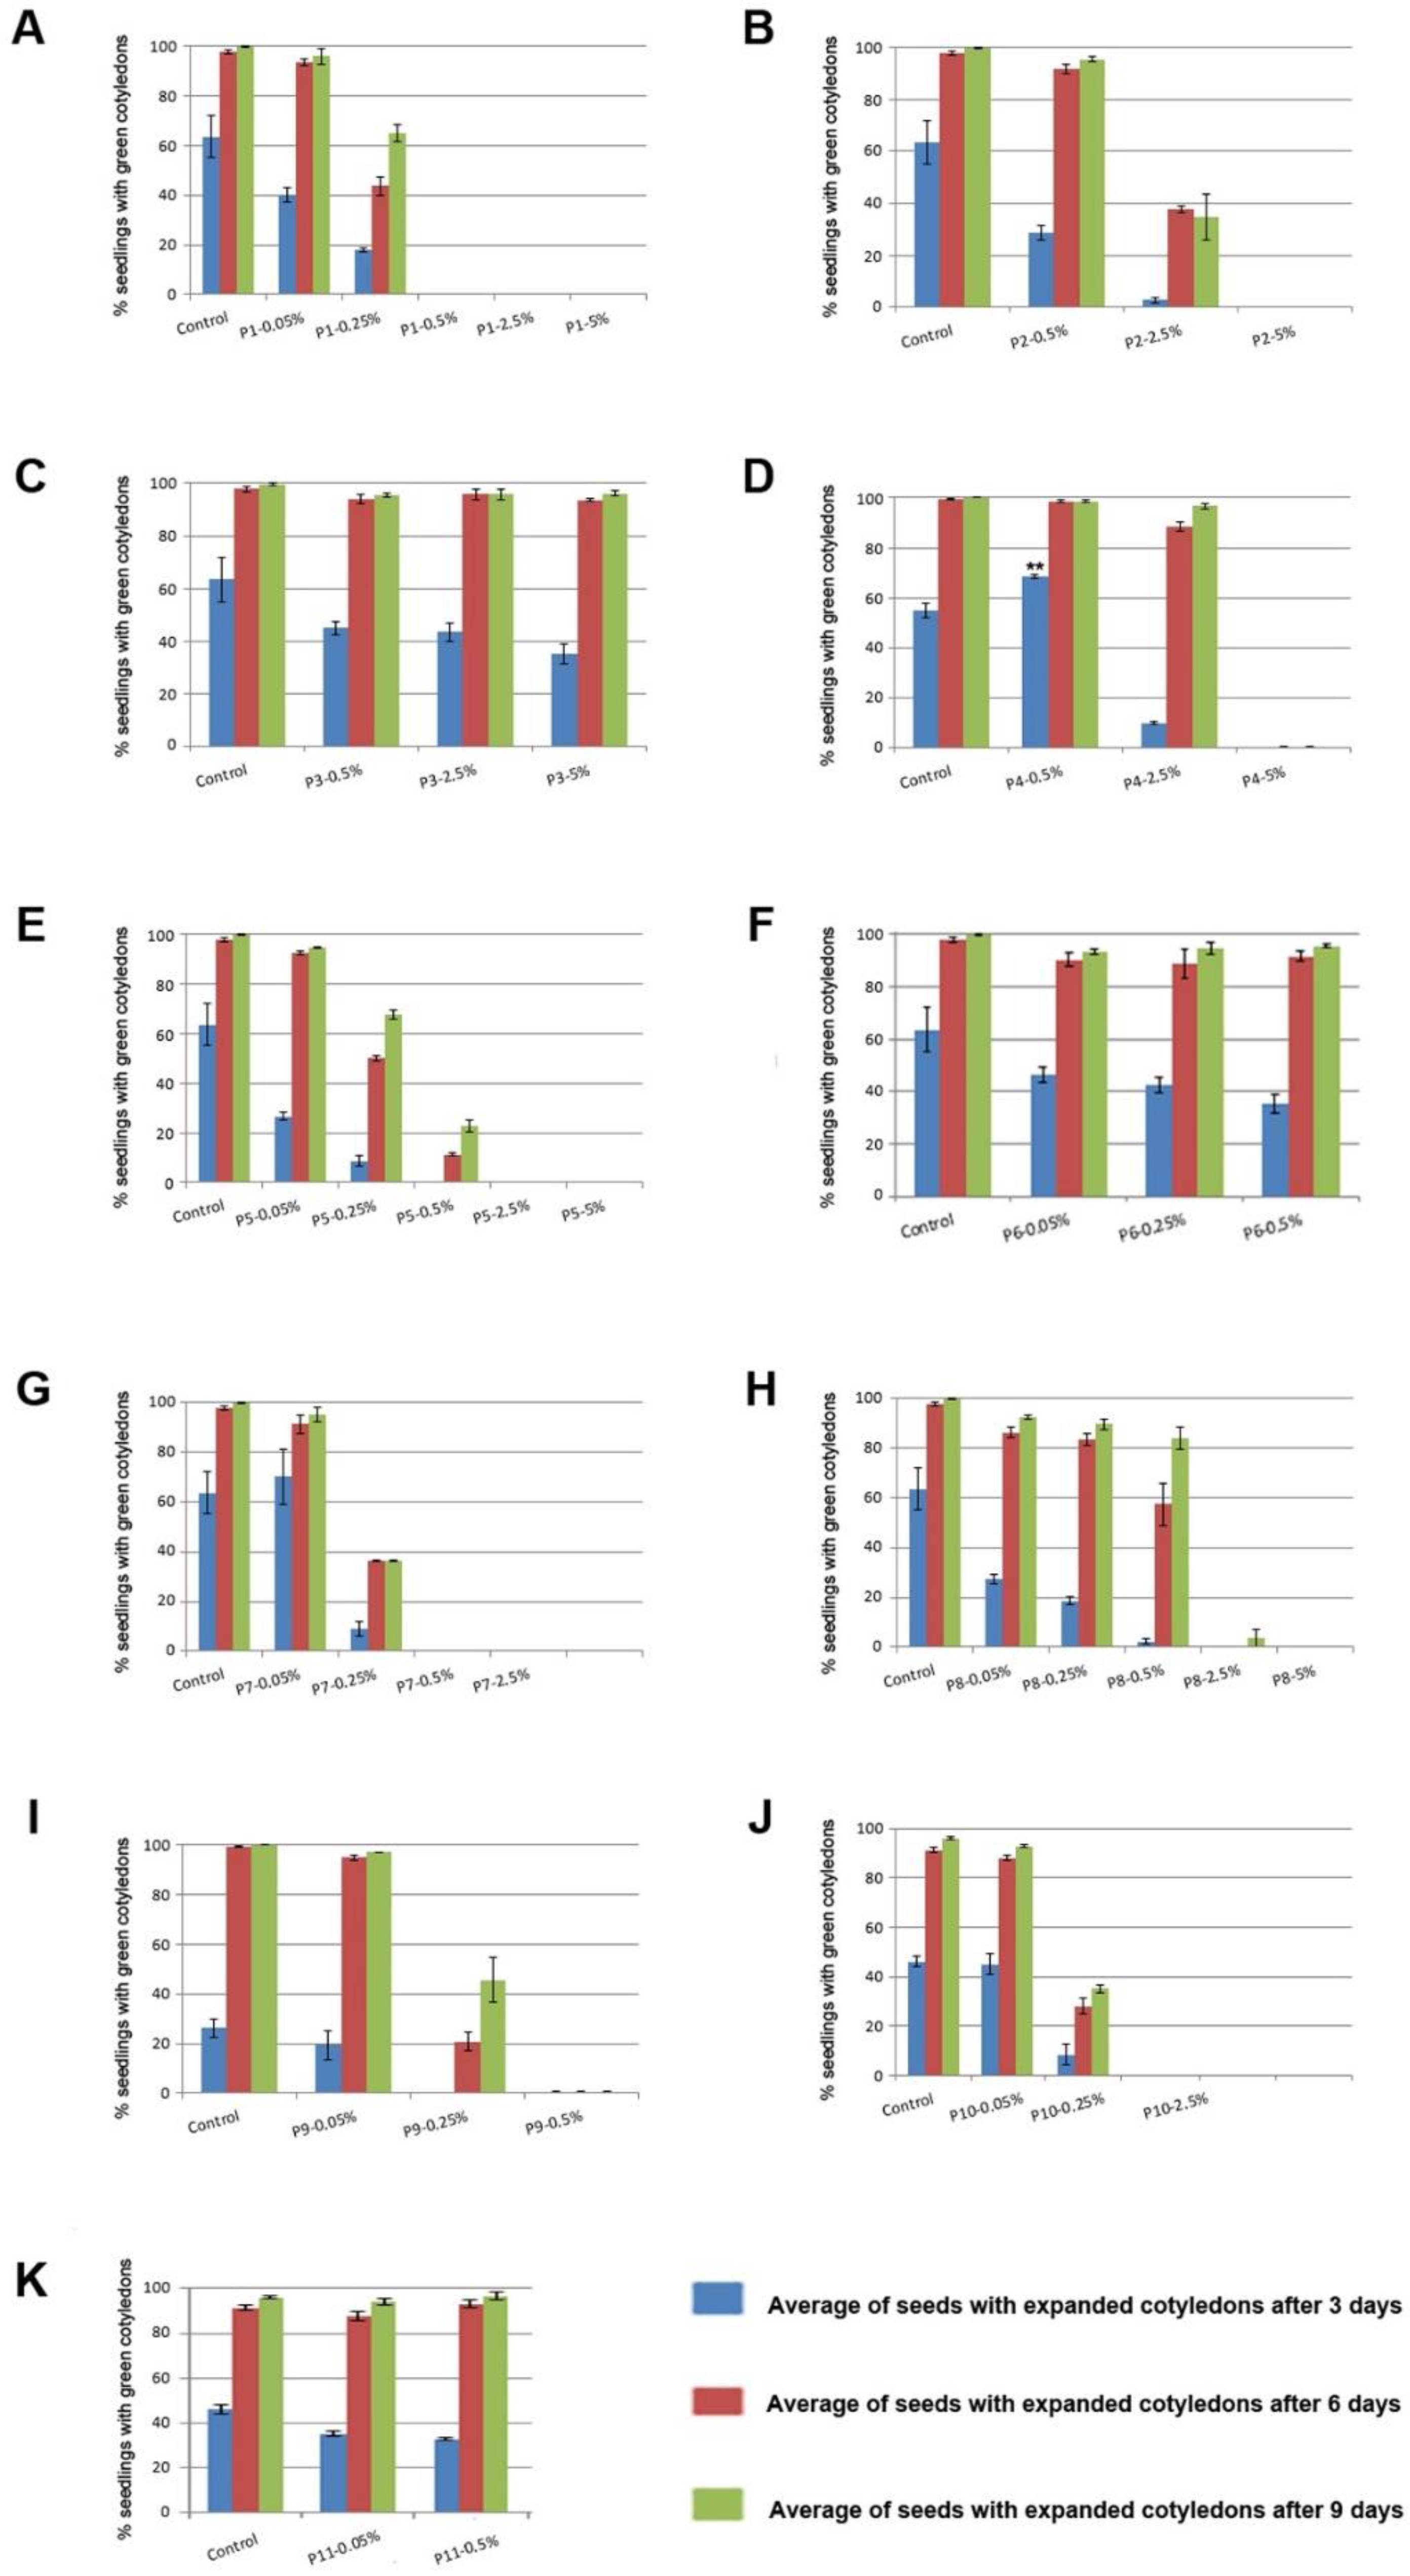
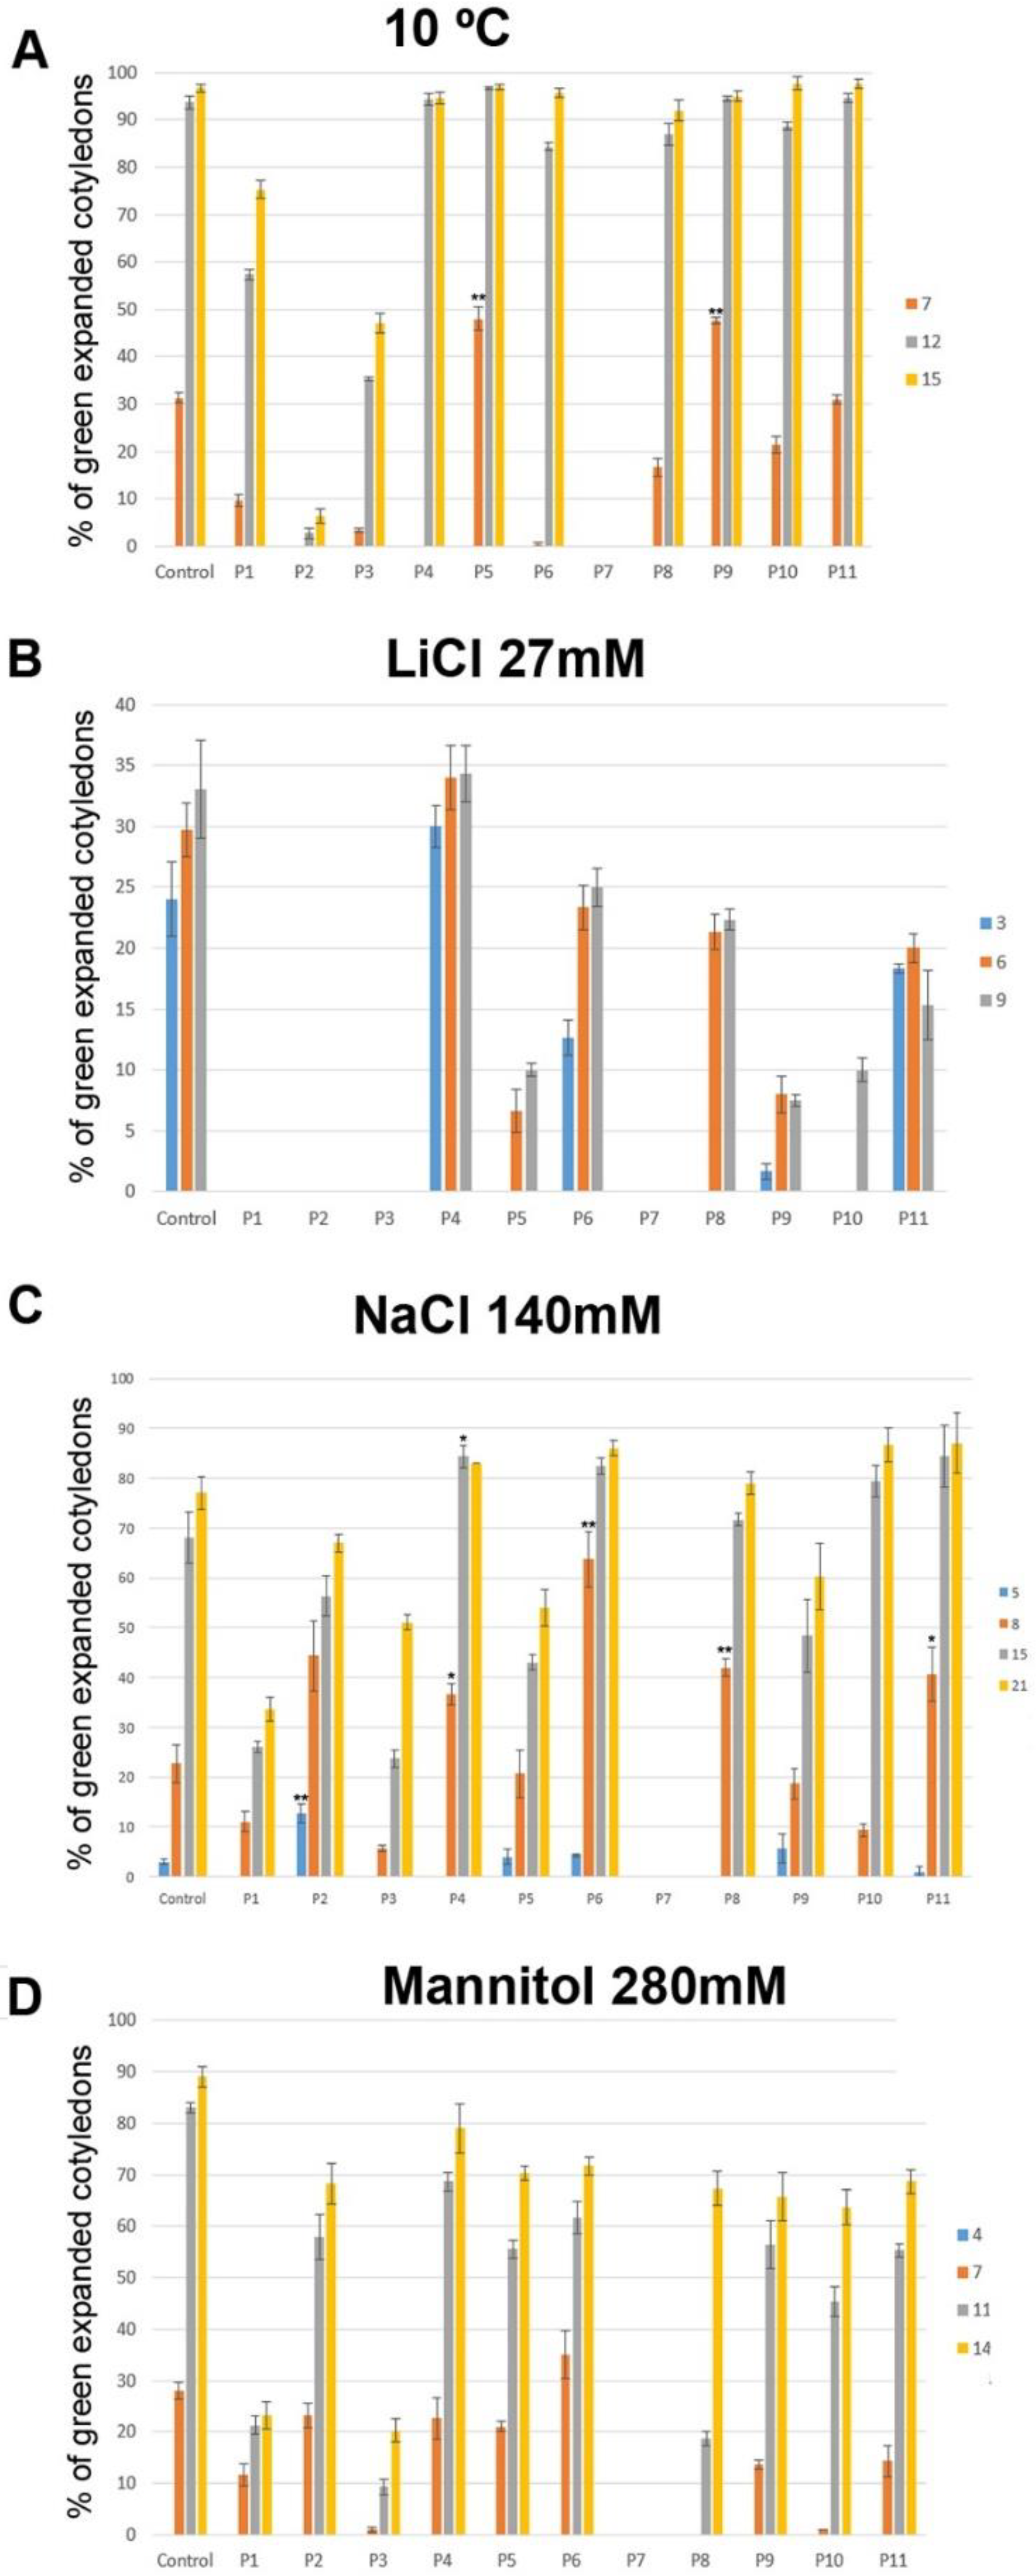
3.4. Biostimulant Effect of the Tested Products in Arabidopsis Germination and Early Development

The first experiment in the plant model system Arabidopsis thaliana consisted of determining the non-toxic concentrations of products for Arabidopsis thaliana germination and early development. The starting concentrations was 5% (w/v) of the biostimulant, decreasing sequentially to 2.5%, 0.5%, 0.25%, 0.05%, or until no deleterious effect in growth was detected. The figures represent the significant thresholds of concentration (Figure 3). Product 4 exhibits a biostimulant effect for the induction of germination in normal conditions without stress and is able to increase germination and development of green cotyledons by 25% after three days (Figure 3D). According to these results, experiments in Arabidopsis thaliana were performed in 0.5% (v/v) for P2, P3, P4, P6, and P11, and 0.05% for P1, P5, P7, P8, P9, and P10.
After determining the working concentration in which we do not observe any deleterious effect for each of the tested products, we evaluated the effect of every product in germination and early development under stress conditions as described in the materials and methods section. Under cold conditions, P5 and P10 induced an improvement of 30% at seven days (Figure 4A). Under NaCl stress, P2 showed a 300% increase in germination and early development, although at longer times development was worse than the control. P4 was increasing early development by 100% after eight days and by 24% after 15 days, therefore accelerating early development, as the increase was sustained in time. P6, P8, and P11 were inducing a significant increase in germination and early development that was observable after eight days (Figure 4C). In stress induced by LiCl or Mannitol, we could not detect any statistically significant effect (Figure 4B,D).

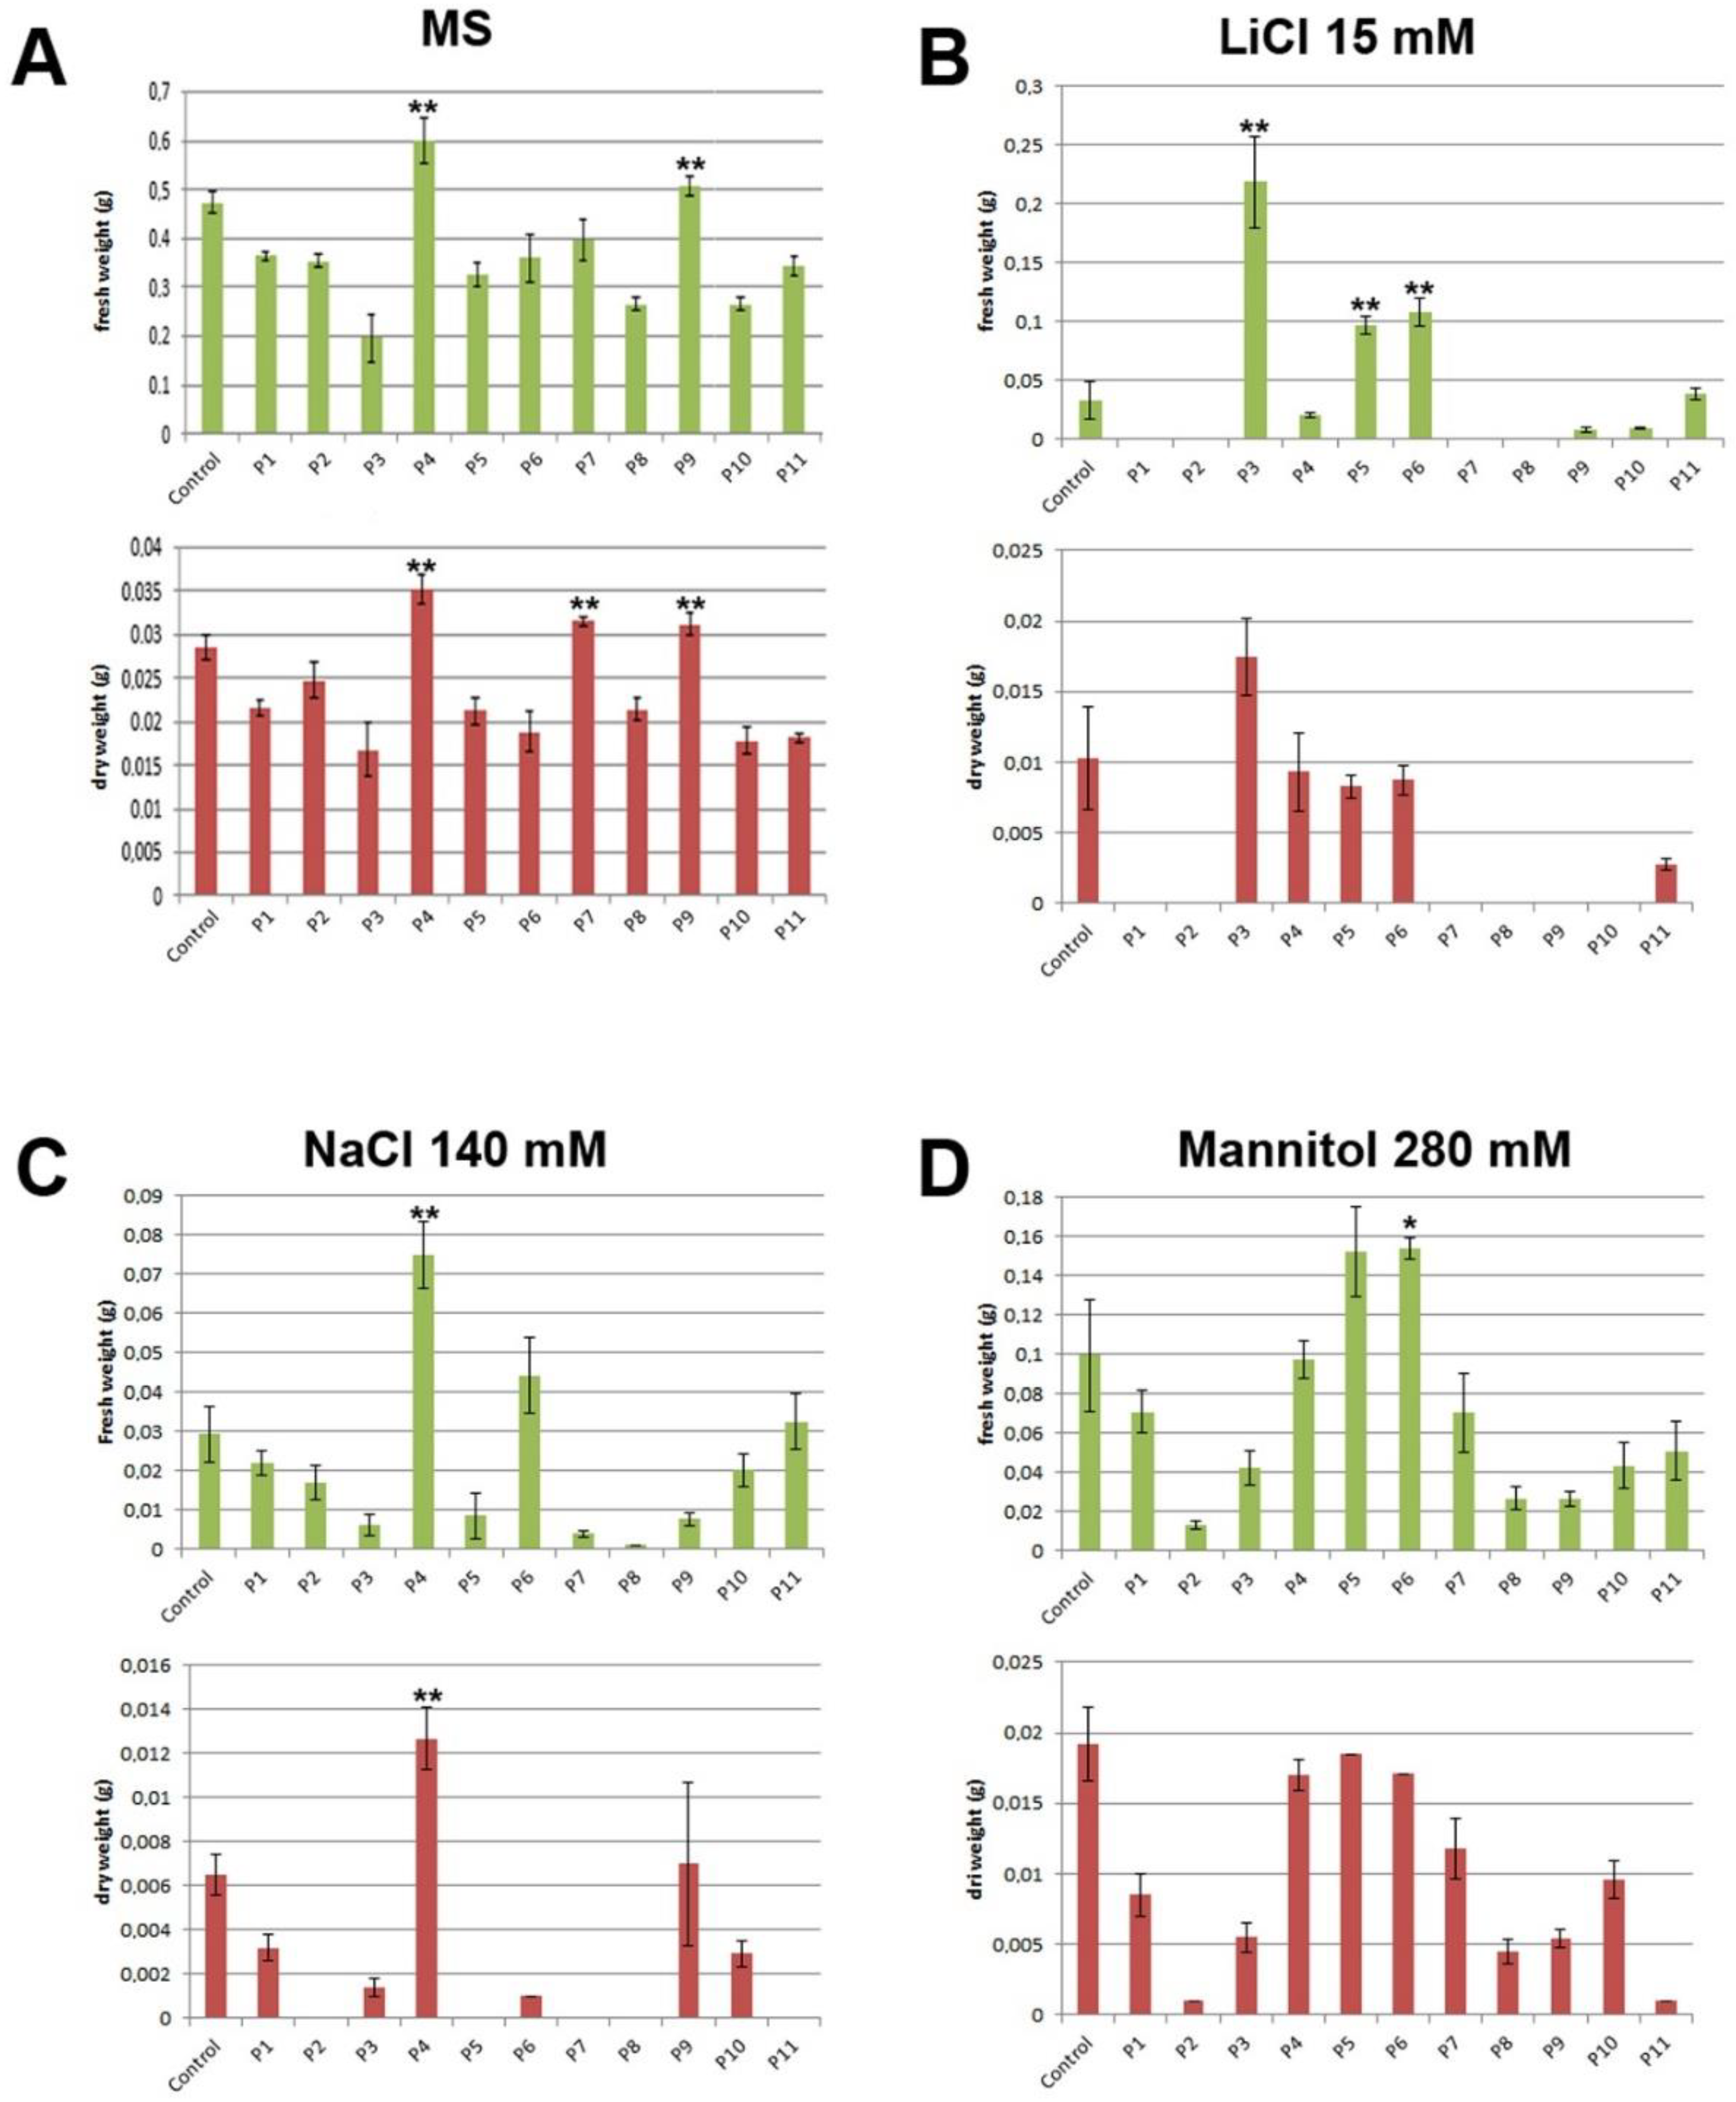
3.5. Biostimulant Effect of the Tested Products in Mass Accumulation

Germination and early development are particular plant physiological stages. A product could have a measurable biostimulant effect during germination or early development, but the same product may not be effective during vegetative growth or vice versa. To assess the effect of a given biostimulant during growth, we germinated Arabidopsis thaliana in MS agar without stress nor any biostimulant and then transferred the plantlets to a six well plate (three plantlets per well) and determined fresh weight and dry weight after three weeks. In a liquid medium without added stress, the addition of P4 to the medium induced a fresh weight gain of about 26% and P9 of about 8%. Regarding dry weight, P4 induced an increase of dry weight of about 30%; P7 and P9 a similar increase of about 15% (Figure 5A).
In addition, we tested the effect of different bioproducts during continuous growth in a liquid MS medium in the presence of salt or osmotic stress induced by NaCl, LiCl, or Mannitol. Product 3 gives an improvement in medium with LiCl of more than 500% of fresh weight (Figure 5B). In stress induced by NaCl, P4 induces an increase of fresh and dry weight of about 100% (Figure 5C). Finally, in mannitol containing a medium of only P6, it induced an increase in fresh weight of about 60%. However, we could not observe any increase in dry weight when comparing to control plants (Figure 5D).
Further, we investigated the biostimulant effect of the 11 products. We have shown that some of the tested products increased the mass accumulation. Another expected effect of a biostimulant is to accelerate development, which can induce an early flowering. Even though plants were growing in liquid media, some of them did not develop until the flowering stage. In the presence of stress, the number of flowering plants was negligible, but in standard MS medium in the presence of the different products, we could observe that the number of flowering plants was different depending on the biostimulant present in the growth medium. Specifically, in the presence of products 3, 4, 5, 6, and 9 plants were flowering earlier than control plants (Figure 6).

4. Discussion

In this report, we describe a method that allows a fast screening of different biostimulants. All the experimentation can be performed in a six-month period with a reduced cost and without requirement of field tests. By doing the first screening in yeast, we took advantage of the fact that yeast grows fast and we could test different conditions in conjunction with a low space requirement. Yeast experiments can be performed within a one to two-month time period. Yeast ion homeostasis is similar to plants [16] and most of the mechanisms related to salt stress are conserved. In fact, in the yeast screening, we detected the biostimulant effect under salt stress of products 1, 2, 3, 4, 6, 8, 9, and 11. Using our methodology, the effect of P4, P6, and P9 on plant development was also assessed and we were able to quantify it, confirming the validity of our approach. On the other hand, P4 increased growth without stress and also increased germination and yield under stress, inducing early flowering. We performed all the assays as a blind test, without any information of the identity of the products. P4 is chitosan, an alkaline extract of crustacean shells. Chemically chitosan is a linear polysaccharide composed of randomly distributed β-(1→4) d-glucosamine and N-acetyl-d-glucosamine. There is published evidence confirming its role as a biostimulant and its ability to induce abiotic and biotic stress tolerance in various crops. Thus, P4 is an internal positive control which confirms the validity of our experimental approach [31].
A recent review suggested that a biostimulant investigation should focus upon finding proof of efficacy and safety and the determination of a broad mechanism of action, without a requirement for the determination of a specific mode of action [19]. The method we present here allows an inference on the broad mechanism of action. There are reports in the literature that descrive biostimulants that increase potassium uptake. For instance, Saa et al. described a biostimulant derived from seaweed that increases potassium uptake (measured as rubidium uptake) and is effective under low potassium concentration in almond [32]. The P3 product, an extract from a seaweed (knotted kelp; Ascophyllum nodosum) increased growth in yeast and plants. Therefore, it is likely to affect a conserved process such as potassium uptake, further confirming the validity of our system.
In other cases, the effect observed in yeast is not conserved in plants. For instance, P1 (an extract from strawberry plants) stimulates yeast’s continuous growth in in the presence of LiCl and NaCl. It has been described that the biostimulant effect can be exerted on the endophytic or non-endophytic bacteria, yeast, and fungi [25].
There were also some products in which we have not been able to detect any remarkable effect in yeast, but presented effect in plants. For instance, in P4 (an extract from chitosan) we detected a deleterious effect in drop tests and only a biostimulant effect on continuous growth in yeast under osmotic stress. However, it presented a strong effect in germination and yield in plants. This may indicate that these products affect plant stress or plant growth response pathways, which are not conserved in yeast.
Under cold conditions, we have obtained disparate results between yeast and plants. Due to technical limitations, we could not measure the effect of cold during continuous growth. However, products with an increasing cold tolerance in a drop test (P6, P8, and P11) are different than those increasing germination and early development in plants (P5 and P9). Cold stress, among other effects, slows the rate of enzymatic reactions and affects membrane fluidity. In yeast, it is known that the most affected processes by cold stress are tryptophan and phosphate uptake [30]. We used a yeast strain that does not require external tryptophan supplementation and tryptophan biosynthesis is similar in plants and yeast. Therefore, the observed differences were probably attributed to physiological differences in phosphate uptake and metabolism between yeast and plants.
Moreover, it is important to remark that for some products we observed deleterious effects. For instance, P7 and P8 in the presence of stress proved to be toxic for plants (Figure 5). Another advantage of our method is that toxicity or adverse effects are also easily detected and products can be discarded at early stages, avoiding subsequent analysis. There are other protocols in the literature to evaluate biostimulants [21], which focus on transcriptome profiling and field test. Our method, although perfectly compatible with such methods, has the advantage of being cheaper and faster, and based on functionality. Our method allows for a fast preliminary screening to detect functional formulations, which may later undergo field trials or molecular assays such as transcriptome profiling, saving budget and time.
Another advantage of our method is related to a general problem of the biostimulant industry: the standardization of the protocols. As biostimulants are derived from natural products there may be differences in the final composition among different stocks of the same product and functionality may change. A yeast drop test assay or a BioScreen® assay is easily standardized and reproducible and can be completed in three to four days. This kind of test can be used to check and quantify the functionality of different stocks. We have performed this test routinely during this project, which has allowed us to discard nonfunctional stocks (i.e., stocks which were not reproducing the previously observed phenotypes) and avoiding methodological errors.

5. Conclusions

By using this method, we have been able to evaluate 11 different products in a short time with low budget and technical requirements. The method also provided preliminary information on the mode of action of the evaluated products, evaluating the effect in two different systems under different conditions of abiotic stress and at different developmental stages. The main advantage is that the presented methodology allows for a fast and cheap screening for bioactive compounds and therefore products without biological effect can be discarded at early stages, avoiding subsequent tests that may be long and expensive. Therefore, this report provides a new and useful tool for the biostimulant community, both industrial and academic.

Author Contributions

R.S. and C.B. performed the experimentsl J.M.M. planned, guided the experiments, and wrote the paper. V.F. prepared and provided the products to be tested.

Funding

This study is a part of the research agreement: “Estudio de estimulación del crecimiento y protector frente al estrés abiótico de diferentes formulaciones en levadura, Arabidopsis y tomate” funded by Agrométodos SA.

Acknowledgments

We want to thank Victor Frias Sr, Mónica Perdices, Pablo Granell, and Manuel Fernández, from Agrométodos SA, for funding this project and allowing us to write and publish this report. We also want to thank Manuel Fernández for the critical reading of the manuscript and for his useful comments.

Conflicts of Interest

This project is the result of a research project funded by the company Agrométodos SA, although the company did not participate in the experimental procedures nor in the evaluation of the results.

References

  1. Christou, P. Sustainable Food Production; Springer: New York, NY, USA, 2013. [Google Scholar]
  2. Park, M. The Fertilizer Industry; International Fertilizer Industry Association: Cambridge, MA, USA, 2001. [Google Scholar]
  3. Filatov, V.P.; Ibiber, V.K. Voprosu o prirode biogennykh stymulyatorov perezhivayushchikh rastitelnykh tkanei. Doklady Akademii Nauk Sssr. 1948, 62, 259–262. [Google Scholar]
  4. Yakhin, O.I.; Lubyanov, A.A.; Yakhin, I.A.; Brown, P.H. Biostimulants in Plant Science: A Global Perspective. Front. Plant Sci. 2017, 7, 2049. [Google Scholar] [CrossRef] [PubMed]
  5. Rouphael, Y.; Spíchal, L.; Panzarová, K.; Casa, R.; Colla, G. High-Throughput Plant Phenotyping for Developing Novel Biostimulants: From Lab to Field or From Field to Lab? Front. Plant Sci. 2018, 9, 1197. [Google Scholar] [CrossRef] [PubMed]
  6. Rouphael, Y.; Colla, G. Synergistic Biostimulatory Action: Designing the Next Generation of Plant Biostimulants for Sustainable Agriculture. Front. Plant Sci. 2018, 9, 1655. [Google Scholar] [CrossRef] [PubMed]
  7. Boyer, J. Plant productivity and environment. Science 1982, 218, 443–448. [Google Scholar] [CrossRef]
  8. Ashraf, M.; Harris, P.J.C. (Eds.) Abiotic Stresses: Plant Resistance through Breeding and Molecular Approaches; Food Products Press: New York, NY, USA, 2005; p. 725. [Google Scholar]
  9. Munns, R.; Tester, M. Mechanisms of salinity tolerance. Annu. Rev. Plant Biol. 2008, 59, 651–681. [Google Scholar] [CrossRef]
  10. Reynolds, M.; Tuberosa, R. Translational research impacting on crop productivity in drought-prone environments. Curr. Opin. Plant Biol. 2008, 11, 171–179. [Google Scholar] [CrossRef]
  11. Mahajan, S.; Tuteja, N. Cold, salinity and drought stresses: An overview. Arch. Biochem. Biophys. 2005, 444, 139–158. [Google Scholar] [CrossRef]
  12. Taibi, K.; del Campo, A.; Vilagrosa, A.; Belles, J.M.; Lopez-Gresa, M.P.; Pla, D.; Calvete, J.J.; López-Nicolás, J.M.; Mulet, J.M. Drought tolerance in Pinus halepensis seed sources as identified by distinctive physiological and molecular markers. Front. Plant Sci. 2017, 8, 1202. [Google Scholar] [CrossRef]
  13. Sakamoto, A.; Murata, N. The role of glycine betaine in the protection of plants from stress: Clues from transgenic plants. Plant Cell Environ. 2002, 25, 163–171. [Google Scholar] [CrossRef]
  14. Ashraf, M.; Foolad, M.R. Roles of glycine betaine and proline in improving plant abiotic stress resistance. Environ. Exp. Bot. 2007, 59, 206–216. [Google Scholar] [CrossRef]
  15. Mulet, J.M.; Alemany, B.; Ros, R.; Calvete, J.J.; Serrano, R. Expression of a plant serine O-acetyltransferase in Saccharomyces cerevisiae confers osmotic tolerance and creates an alternative pathway for cysteine biosynthesis. Yeast 2004, 21, 303–312. [Google Scholar] [CrossRef] [PubMed]
  16. Noctor, G.; Arisi, A.C.M.; Jouanin, L.; Valadier, M.H.; Roux, Y.; Foyer, C.H. The role of glycine in determining the rate of glutathione synthesis in poplar. Possible implications for glutathione production during stress. Physiol. Plant. 1997, 100, 255–263. [Google Scholar] [CrossRef]
  17. Calvo, P.; Nelson, L.; Kloepper, J.W. Agricultural uses of plant biostimulants. Plant Soil 2014, 383, 3–41. [Google Scholar] [CrossRef] [Green Version]
  18. Battacharyya, D.; Babgohari, M.Z.; Rathor, P.; Prithiviraj, B. Seaweed extracts as biostimulants in horticulture. Sci. Hortic. 2015, 196, 39–48. [Google Scholar] [CrossRef]
  19. Chiaiese, P.; Corrado, G.; Colla, G.; Kyriacou, M.C.; Rouphael, Y. Renewable Sources of Plant Biostimulation: Microalgae as a Sustainable Means to Improve Crop Performance. Front. Plant Sci. 2018, 9, 1782. [Google Scholar] [CrossRef]
  20. Traon, D.; Amat, L.; Zotz, F.; du Jardin, P. A Legal Framework for Plant Biostimulants and Agronomic Fertiliser Additives in the EU; European Comission: Brussels, Belgium, 2014. [Google Scholar]
  21. Povero, G.; Mejia, J.F.; Di Tommaso, D.; Piaggesi, A.; Warrior, P. A Systematic Approach to Discover and Characterize Natural Plant Biostimulants. Front. Plant Sci. 2016, 7, 435. [Google Scholar] [CrossRef] [PubMed]
  22. Botstein, D.; Fink, G. Yeast: An Experimental Organism for 21st Century Biology. Genetics 2011, 189, 695–704. [Google Scholar] [CrossRef] [PubMed] [Green Version]
  23. Forsburg, S. The art and design of genetic screens: Yeast. Nat. Rev. Genet. 2001, 2, 659–668. [Google Scholar] [CrossRef]
  24. Montesinos, C.; Gaxiola, R.; Ríos, G.; Forment, J.; Leube, M.; Mulet, J.M.; Naranjo, M.A.; Roldán, M.; Vicente, O.; Kanhonou, R.A.; et al. Functional genomics of salt tolerance: The yeast overexpression approach. In Proceedings of the International Symposium on Managing Greenhouse Crops in Saline Environment, Pisa, Italy, 9–12 July 2003; pp. 31–38. [Google Scholar]
  25. Brown, P.; Saa, S. Biostimulants in agriculture. Front. Plant Sci. 2015, 6, 671. [Google Scholar] [CrossRef] [PubMed]
  26. Provart, N.J.; Alonso, J.; Assmann, S.M.; Bergmann, D.; Brady, S.M.; Brkljacic, J.; Browse, J.; Chapple, C.; Colot, V.; Cutler, S.; et al. 50 years of Arabidopsis research: Highlights and future directions. New Phytol. 2016, 209, 921–944. [Google Scholar] [CrossRef] [PubMed]
  27. Rios, G.; Cabedo, M.; Rull, B.; Yenush, L.; Serrano, R.; Mulet, J.M. Role of the yeast multidrug transporter Qdr2 in cation homeostasis and the oxidative stress response. FEMS Yeast Res. 2013, 13, 97–106. [Google Scholar] [CrossRef] [PubMed] [Green Version]
  28. Brachmann, C.B.; Davies, A.; Cost, G.J.; Caputo, E.; Li, J.; Hieter, P.; Boeke, J.D. Designer deletion strains derived from Saccharomyces cerevisiae S288C: A useful set of strains and plasmids for PCR-mediated gene disruption and other applications. Yeast 1998, 14, 115–132. [Google Scholar] [CrossRef]
  29. Bissoli, G.; Niñoles, R.; Fresquet, S.; Palombieri, S.; Bueso, E.; Rubio, L.; García-Sánchez, M.J.; Fernández, J.A.; Mulet, J.M.; Serrano, R. Peptidyl-prolyl cis-trans isomerase ROF2 modulates intracellular pH homeostasis in Arabidopsis. Plant J. 2012, 70, 704–716. [Google Scholar] [CrossRef] [PubMed] [Green Version]
  30. Vicent, I.; Navarro, A.; Mulet, J.M.; Sharma, S.; Serrano, R. Uptake of inorganic phosphate is a limiting factor for Saccharomyces cerevisiae during growth at low temperatures. FEMS Yeast Res. 2015, 15, fov008. [Google Scholar] [CrossRef] [PubMed]
  31. Malerba, M.; Cerana, R. Chitosan Effects on Plant Systems. Int. J. Mol. Sci. 2016, 17, 996. [Google Scholar] [CrossRef]
  32. Saa, S.; Olivos-Del Rio, A.; Castro, S.; Brown, P.H. Foliar application of microbial and plant based biostimulants increases growth and potassium uptake in almond (Prunus dulcis [Mill.] D. A. Webb). Front. Plant Sci. 2015, 6, 87. [Google Scholar] [CrossRef]
Figure 1. Characterization of the products using drop test assays in Saccharomyces cerevisiae. (A) Yeast growth in yeast extract Peptone Dextrose (YPD) medium containing 0.5% of each product. Drop tests were performed by growing yeast cells until saturation in YPD medium. Cells were then diluted 1:10, 1:100, 1:1000, 1:10,000, and 1:100,000, and spotted onto plates of YPD medium containing different concentrations of each product. Growth was recorded after four or five days. Three independent complete experiments were performed with similar results. (B) Summary of the effect on yeast growth of each bioproduct at different concentrations based on yeast drop test assays. Bioproduct concentration ranged from 5% to 0.005% as indicated in each case. Results are referred to 1:1000 dilutions of a concentrated culture. 0: No growth; =: Same growth as control without biostimulant; ↓: Less growth than control without biostimulant. Nd: Not determined. (C) Summary of the effect on yeast growth of each bioproduct under different stress conditions. Yeast growth was recorded after three days, except for cold stress that was recorded after three weeks. Bioproduct concentrations were 0.5% (v/v) (no asterisk) or 0.05% (v/v) or (w/v) (*). Control plate contained the indicated stress without any biostimulant. Results are referred to 1:1000 dilutions of a yeast concentrated culture. 0: No growth; =: Same growth as control plate; ↓: less growth that control plate; ↑: more growth than control plate. =/↓: weak decrease in growth compared to the control plate: =/↑ weak increase in growth compared to the control plate.
Agronomy 09 00143 g001
Figure 2. Characterization of the products using a continuous growth assay in Saccharomyces cerevisiae. Liquid cell cultures were grown until saturation in YPD liquid medium, then diluted to an initial OD600 of 0.01 in fresh YPD medium containing 0.5% of bioproduct (for products 1, 3, 4, 7, 9, and 11) or 0.05% (for products 2, 5, 6, 8, and 10). Products are defined in Table 1, although experiments were designed and performed as blind-tests. X axis represents time in hours (h) and Y axis represents the optical density at 600 nm (OD 600 nm). (A) Cultures grown under control conditions (YPD without stress), (B) LiCl 0.15 M, (C) NaCl 0.5M, and (D) Sorbitol 1.4 M. Growth was monitored in microtiter plates using the BioScreen® C microbiological workstation with automatic recording of OD600 every 30 min. Each point represents the mean of three replicates, with standard error < 5% in most cases (error bars are not shown for clarity). The black arrow indicates the final position of the control culture grown without any bioproduct. The experiments were reproduced independently three times with similar results.
Agronomy 09 00143 g002
Figure 3. Determination of the effect of the different products for germination and early development. Statistical data from three experiments performed as described in materials and methods are presented. The Y axis represents the mean percentages of seedlings with green expanded cotyledons. Error bars represent the standard error (three independent experiments, n = 100 per experiment). Data were recorded at three days (blue bars), six days (red bars), and nine days (green bars). The X axis indicates the concentration of the indicated product in the MS plate. (A) product 1; (B) product 2; (C) product 3; (D) product 4, (E) product 5; (F) product 6; (G) product 7; (H) product 8; (I) product 9; (J) product 10; and (K) product 11. ** p < 0.01 by Student’s test for increased germination and early development compared to the control.
Agronomy 09 00143 g003
Figure 4. Determination of the effect of the different products for Arabidopsis thaliana germination and early development in the presence of stress. Statistical data from three experiments performed as described in materials and methods are presented. The X axis indicates the tested product. The Y axis represents the mean percentages of seedlings with green expanded cotyledons. Error bars represent the standard error (three independent experiments, n = 100 per experiment). The mean percentages of seedlings with green expanded cotyledons and the standard error are given for seed germination under (A) cold stress (10 °C) after 7 days (orange bars), 12 days (gray bars), and 15 days (yellow bars); (B) salt stress induced by 27 mM LiCl after three days (blue bars), six days (orange bars), and nine days (gray bars); (C) salt stress induced by 140 mM NaCl after 5 days (blue bars), 8 days (orange bars), 15 days (gray bars), and 21 days (yellow bars); (D) osmotic stress induced by 280 mM mannitol after 4 days (blue bars), 7 days (orange bars), 11 days (gray bars), and 14 days (yellow bars). Statistical data from three experiments performed as described in materials and methods are presented. * p < 0.05 by for increased germination and early development compared to the control; ** p < 0.01 by Student’s tests for increased germination and early development compared to the control.
Agronomy 09 00143 g004
Figure 5. Determination of the effect of the different products for mass accumulation in the presence of stress. The fresh weight (upper panels, green bars) and the dry weight (lower panels, red bars) under (A) MS standard medium; (B) salt stress induced by 15 mM LiCl; (C) salt stress induced by 140 mM NaCl; and (D) osmotic stress induced by 280 mM mannitol. Statistical data from three experiments (n = 36 for each experiment) performed as described in materials and methods are presented. Bars represent standard error. * p < 0.05 by Student’s tests respect increased weight compared to the control; ** p < 0.01 by Student’s tests respect increased weight compared to the control.
Agronomy 09 00143 g005
Figure 6. Percentage of flowering plants in liquid medium in the presence of biostimulants. Statistical data from three experiments (n = 18 for each experiment) performed as described in the Materials and Methods section. ** p < 0.01 by Student’s tests respect increased flowering compared to the control.
Agronomy 09 00143 g006
Table 1. Identity of the tested products.
Product NumberDescriptionMajor Component
1Extract from fragaria X ananassa plantsPolysachharides
2Extract from Ascophyllum nodosumPolysachharides
3Concentrated extract from Ascophyllum nodosumPolysachharides
4Extract from chitosanPolysachharides
5Extract from Ascophyllum nodosum and added amino acidsPolysaccharides
6WheyProteins
7Extract from Arthrospira platensis and Arthrospira maximaPolysaccharides
8Humic and fulvic acidHeterogeneus organic molecules
9Extract from Equisetum arvensePolysaccharides
10Extract from compostHeterogeneus organic molecules
11Extract from Ecklonia maximaPolysaccharides

