Article

Impact of Increasing Maize Densities on Agronomic Performances and the Community Stability of Productivity of Maize/Peanut Intercropping Systems

1
Crop Research Institute, Shandong Provincial Key Laboratory of Crop Genetic Improvement, Ecology and Physiology, Shandong Academy of Agricultural Sciences, Jinan 250100, China
2
College of Life Sciences, Shandong Normal University, Jinan 250100, China
3
National Engineering Laboratory of Wheat and Maize, Shandong Academy of Agricultural Sciences, Jinan 250100, China
4
Maize Research Institute, Key Laboratory of Maize Biology and Genetic Breeding in North Huanghuai Plain of Ministry of Agriculture, Shandong Academy of Agricultural Sciences, Jinan 250100, China
5
College of Resources and Environmental Sciences, China Agricultural University, Beijing 100193, China
6
College of Geography and Environment, Shandong Normal University, Jinan 250100, China
7
School of Agriculture, Ludong University, Yantai 264025, China
*
Author to whom correspondence should be addressed.
Submission received: 14 February 2018 / Revised: 18 March 2019 / Accepted: 19 March 2019 / Published: 22 March 2019
(This article belongs to the Section Innovative Cropping Systems)

Abstract

:
Rational crop community structure plays an important role in maximizing the intercropping yield advantage. Effects of increasing maize densities in maize (Zea mays L.)/peanut (Arachis hypogaea L.) intercropping on yields and other agronomic traits, and the community stability of productivity were conducted across three different experimental sites. There were significant and positive correlations between maize densities and both maize grain/biomass yields and corresponding partial land equivalent ratios (LERs) across all three locations; but grain/biomass yields and partial LERs of peanut were all negatively correlated with maize densities in each or across all locations. LERs of grain yields averaged over three locations ranged from 0.89 to 0.98, while LERs of biomass yields ranged from 0.94 to 1.09 (>1.0 except for the maize inter-plant distance of 27 cm), indicating the intercropping advantage on biomass yields but not grain yields. Peanut had significantly lower kernel harvest indexes than those in monoculture. Excessive narrowing maize inter-plant distances reduced the community stability of productivity severely (especially for maize and total LERs) and are more likely to lead to abnormal maize and peanut plants. Therefore, a rational increase of maize densities in intercropping is suggested to keep the balance between maize and peanut and the comprehensive yield advantage.

1. Introduction

For the past two decades, scientists have hailed genetically modified (GM) crops and chemical fertilizer as the magic bullet that will solve the world’s food crisis [1]. Farming system design has always been relatively neglected. To overcome future challenges for human kind in terms of land degradation, climate change and population growth, this will demand an all-embracing approach, including the design of sustainable or climate change-resilient farming systems [2,3,4,5].
Intercropping systems play an important role in increasing crop quality and yield through efficient utilization of land, light, water and soil nutrients [6], and enhancing resilience to present and future climate change (the increase in global surface temperature and water scarcity) and pest, disease and weed damage [3,4]. It is defined as growing individuals of at least two crop species in close proximity at (about) the same time, always leading to harvest at least two different kinds of crop products and higher comprehensive economic benefits. To some extent, sustainable intensification of agriculture by intercropping is a new “Green Revolution” [7].
The benefit obtained from intercropping is frequently attributed to niche complementarity and interspecific facilitation in resource use due to different temporal, spatial, or plant phenological/eco-physiological characteristics [8,9,10,11]. Cultivation and farming system practices, including planting density of the component crops, fertilization and irrigation all influenced the degree of interspecific interactions (competition, complementarity and facilitation), the total yield performance and the relative contribution of the individual components [12,13,14,15,16,17,18]. Yields of crops in intercropping have been reported to fluctuate with component crop populations [17,19,20,21,22]. To obtain better productivity or the optimal yield as a major agronomic goal, population density of the component crop should be at the optimum level since plant density is one of the most important agronomic management decisions determining the degree of competition in the intercropping system [23]. Intercrop components may utilize resources more efficiently than sole crops, thus the optimum plant density in intercrops outweigh the optimum density in sole crop [24]. In addition, the optimum plant density at one experimental location may not be suitable for other sites, due to regional variations in climate (solar radiation, temperature, precipitation, wind etc.) and soil (pH, organic matter, nitrogen, phosphorus, potassium, salt, soil water hold capacity, etc.) conditions [17].
Positive relationships between productivity or the community stability of productivity and species richness were observed in a number of experimental ecosystems, especially in grasslands or for herbaceous plant mixtures [25,26,27,28,29], which suggested that more diverse communities are more stable and more resistant to invasion, e.g., growing different mixtures of rice varieties suffered less blast incidence and exhibited greater yield than homogeneous fields without the need to use fungicides [30], and increasing plant diversity with border crops and intercrops [31,32] or through a “push-pull” strategy [33] reduced insecticide use and/or some specific diseases. Intercropping has been shown to increase crop yields and improve resource utilization in many cases, but it is less well-known how the community stability of productivity is influenced by management schemes e.g., population densities of component crops.
At present, China’s cereal grain self-sufficiency has fallen to less than 90%, its self-sufficiency rate of edible oils and fats is less than 35%, and soybean products almost completely (>85%) rely on imports. Yet the country has little spare land. Driven by an urgent need to both produce more cereal grains and more oils/soy proteins, the Chinese government and scientists recently started to seek answers from intercropping of cereals with legumes. For the first time in 30 years, the General Office of the State Council of China issued a document in 2015 to heavily promote crop intercropping, especially for maize-based intercropping with peanut or soybean in Huang-Huai-Hai plain in China. In addition to the higher productivity and land/resource use efficiency, the legume/maize intercropping is much less risky in that if one crop fails another may still have a good return [21], has lower water consumption and more ecological and environmental benefits compared to sole maize or a cereal-cereal intercropping [34,35,36,37,38].
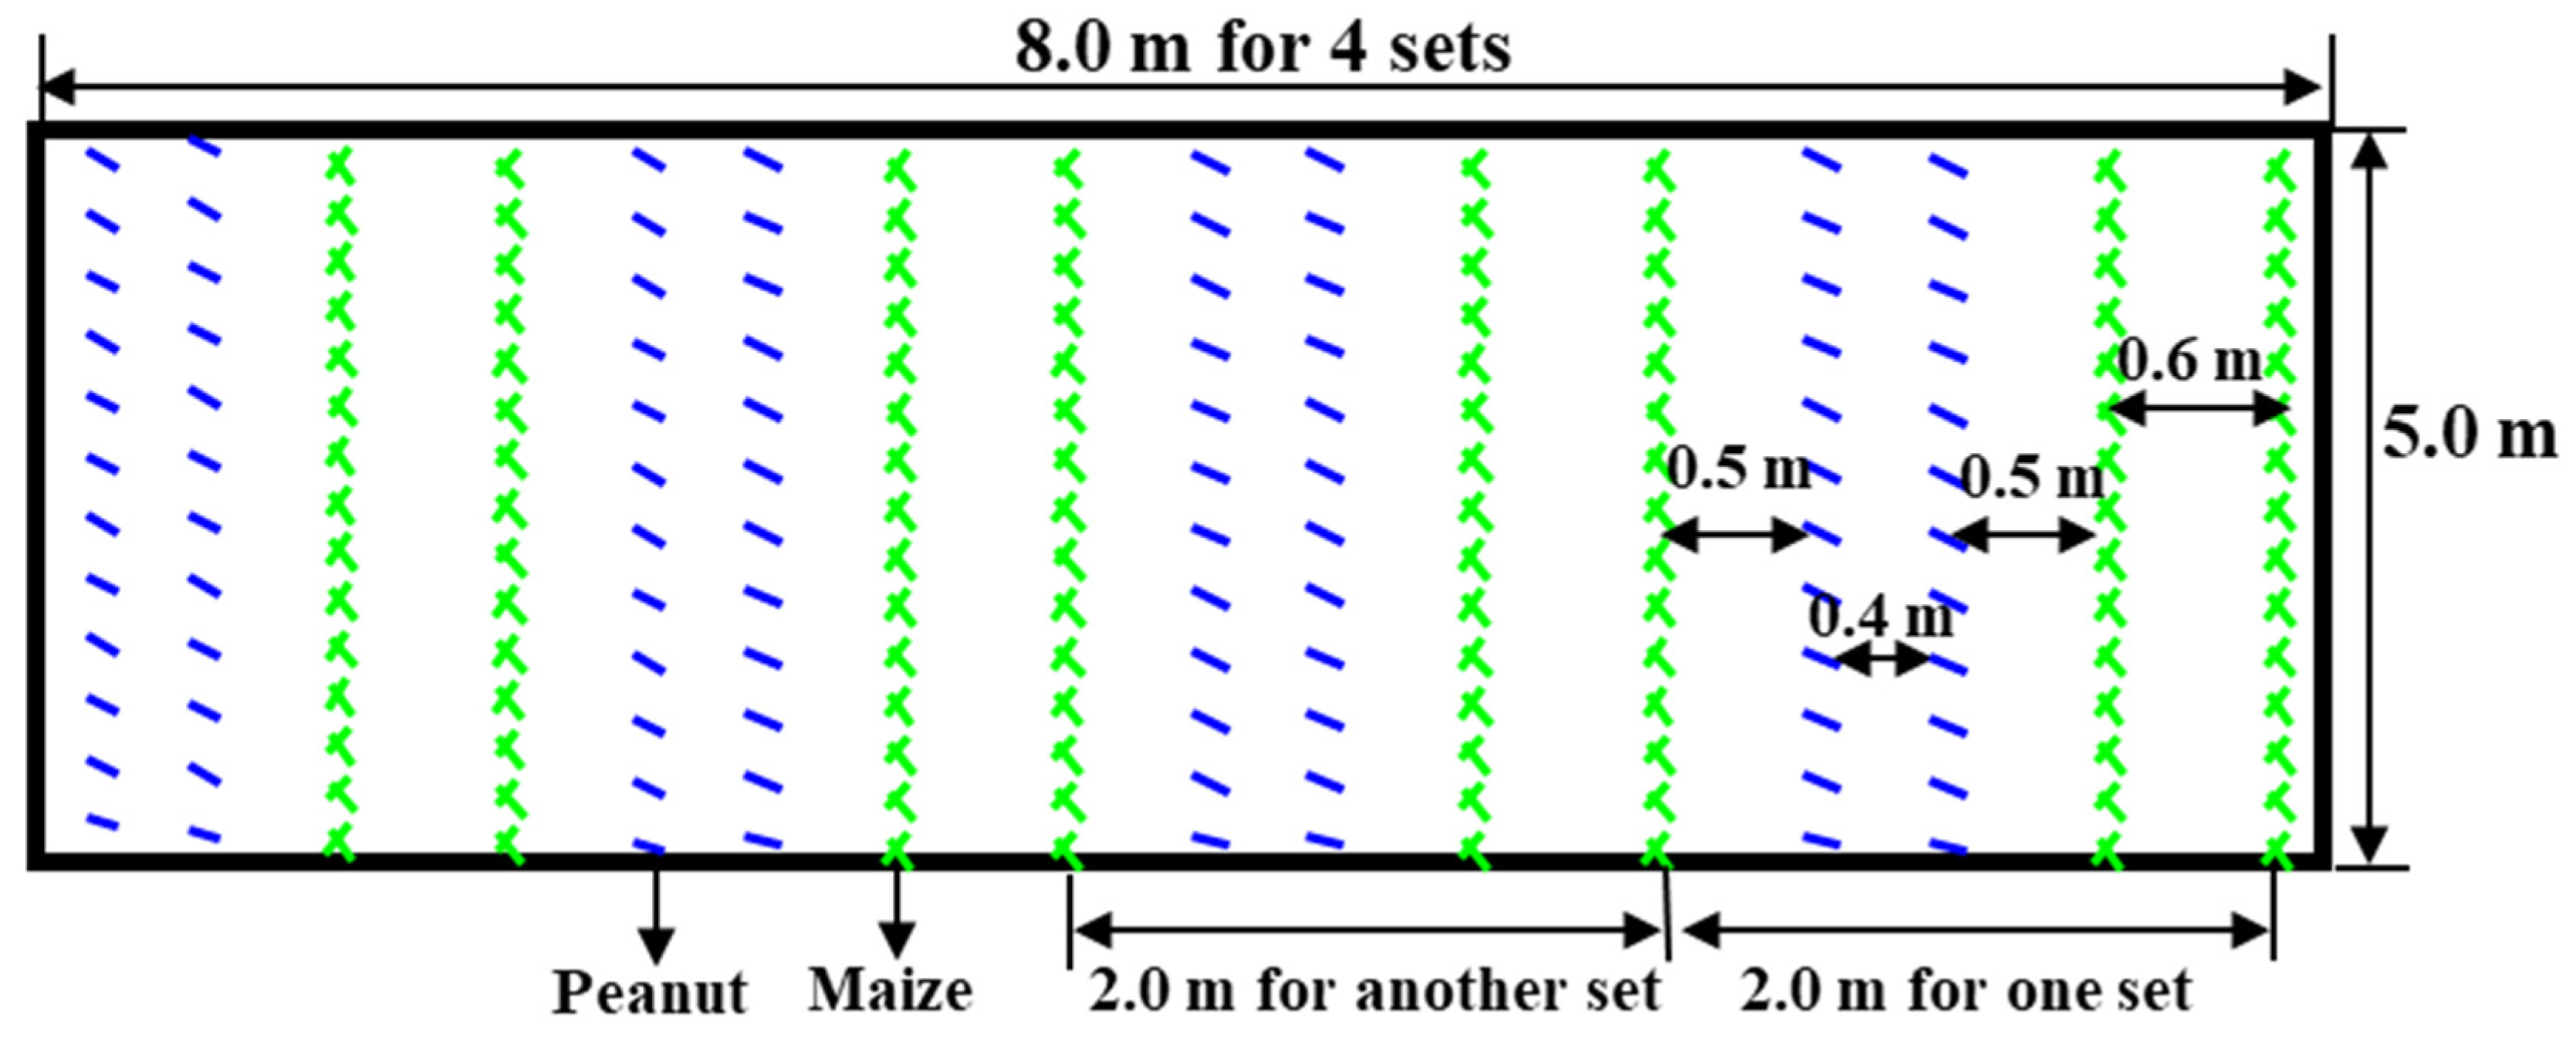
In this study, maize/peanut was selected as a test intercropping system because of its function in the production of cereal grains and oils simultaneously, and its representation for traditional and modern Chinese agriculture. It has evolved from the 1950s to date with changes in social, economic and cultural factors, its planting area in China covers a wide region extending from southern tropical and sub-tropical systems at low latitudes to temperate-cool systems at high latitudes, and it also ranges from arid and semi-arid areas (annual precipitation < 320 mm) to semi-humid and humid areas (annual precipitation > 1000 mm). Meanwhile, it is in harmony with ecological and environmental sustainability, due to the benefits of biological/symbiotic N2 fixation in legume crops for the improvement of soil fertility [22,34,39].
When maize and peanut are intercropped together, optimizing intercropping management practices can maximize the yield of the intercrop system, and assist in the effective use of space and resources. Here, we examine the effects of increasing maize densities in maize/peanut intercropping on grain/biomass yields of maize and peanut, land equivalent ratios (LERs), plant and ear traits of maize, plant, pod and root traits of peanut and the community stability of productivity across three different experimental sites and years, to guide farmers in improving their practices.

2. Materials and Methods

2.1. Study Site

The maize/peanut intercropping field experiment was conducted at three experimental sites belonging to three different cities/counties: Licheng (in 2015), Zhangqiu (in 2016) and Dongying (in 2017). The experimental sites/stations in Licheng, Zhangqiu and Dongying are affiliated to Crop Research Institute, Maize Research Institute and the Yellow River Delta Modern Agriculture Institute of Shandong Academy of Agricultural Sciences of China, respectively. The area across these three experimental sites has a typical continental and warm temperate monsoon climate showing obvious characteristics of coincided rain and heat in the same season, spring and winter are dry and cold, summer is hot and rainy. The annual mean temperature is 12.0–13.6 °C. Cumulative temperatures above 0 and 10 °C are 4500–5000 and 4000–4500 °C, respectively. The frost-free period is 195–210 days. Annual sunshine hours are 2400–2700 h. Annual Precipitation is 500–700 mm and potential evaporation is 1800–2100 mm. During the maize and peanut growing season from June to October, the mean temperature is 25.1 °C and the precipitation is 484.5 mm [40]. Detailed site locations (geographic coordinates) and soil basal properties are presented in Table 1.

2.2. Experimental Design and Crop Management

The experiment was a randomized block design with three replicates. Experimental treatments included mono-cropped maize and peanut, and maize (with different densities) intercropping with peanut. One intercropping set included a 0.8-m peanut strip (two rows of peanut, with a 0.4-m inter-row distance) and a 1.2-m maize strip (two rows of maize with a 0.6-m inter-row distance). The distance between adjacent maize and peanut rows was 0.5 m (Figure 1). Maize occupied 60% of the intercropped area and the peanut occupied 40%. Inter-row distance in mono-cropping was 0.4 m for peanut and 0.6 m for maize. Interplant distance within the same row was 0.2 m for mono- and inter-cropped peanut and 0.27 m for mono-cropped maize. The area of each individual plot was 5.0 × 8.0 m2. There were four intercropping sets in each intercropping plot (Figure 1). Therefore, planting densities in monocultures were 61,728 plants/ha for maize, and 125,000 holes/ha for peanut (with the double-seed sowing), respectively. To test effects of different maize planting densities on yields and other agronomic traits of maize and peanut in the intercropping treatment, the interplant distances within the same row for maize were designed to be 0.10, 0.13, 0.16, 0.20 and 0.27 m, respectively. Correspondingly, intercropped maize densities were 100,000, 76,923, 62,500, 50,000, 37,037 plants/ha, respectively, based on the whole intercropping area occupied by the two crops.
Maize and peanut were simultaneously sown in late June and harvested in early October. Peanut received 112.5 kg/ha N fertilizer in the form of urea, which was 50% of the total N fertilizer application for maize. All the P (140 kg/ha P2O5 fertilizer in the form of calcium superphosphate) and K (120 kg/ha K2O fertilizer in the form of potassium sulfate) fertilizers, and 112.5 kg/ha of the N as urea were evenly broadcast and incorporated into the upper 20 cm of the soil prior to sowing. Only in Dongying, an amount of 15,000 kg/ha fermented cow dung was also applied to the salinized soil before sowing. Another 112.5 kg/ha N for maize was applied at the maize pre-tasseling stage with irrigation. During the growth period all plots were adequately irrigated and weeded manually. No obvious water or pest stress was observed. No pesticides and fungicides were applied to either crop.

2.3. Plant Sampling and Analysis

At maturity, the above-ground grain and biomass yields of maize were measured by harvesting one intercropping strip in each intercropping plot and by harvesting two adjacent/continuous rows of maize in each monoculture plot. Ten harvested maize plants in each plot were collected to investigate agronomic traits, including stem and ear characteristics, the hundred grain weight and harvest index in details. For peanut, the grain and biomass (including straw and grain) yields of peanut were measured by harvesting two adjacent rows of peanut in 2 m length in each intercropping or monoculture plot. The harvested two adjacent rows of peanut with roots and pods pulled out from soils in 1.0 m length in each plot in experimental sites of Licheng and Zhangqiu, and 10 harvested peanut plants with roots and pods in each plot in Dongying were collected to investigate agronomic traits, including stem and pod characteristics, the hundred pod weight, the kernel harvest index and root dry weight in details.

2.4. Calculations

For the intercropping treatment, grain and biomass yields of maize or peanut in the total area were based on the total land area occupied by these two crop species in intercropping. Grain and biomass yields of maize or peanut in the net area were based on the land area actually occupied by only maize or peanut (excluding the area actually occupied by the other crop), i.e., based on per unit of sown row area for only maize or peanut.
YintercropM in total area = yields of maize in net area × the proportion of the land area occupied by maize in intercropping (PM)
YintercropP in total area = yields of peanut in net area × the proportion of the land area occupied by peanut in intercropping (PP)
PM = WM/(WM + WP)
PP = WP/(WM + WP)
where M and P are maize and peanut in the intercropping treatment, respectively; WM and WP are the widths of maize and the companion crop peanut in the intercropping set. In the present study, WM is 1.2 m (two rows of maize) and WP is 0.8 m (two rows of peanut) in each intercropping set. Therefore, values of PM and PP are 0.6 and 0.4, respectively, and PM + PP = 1.0.
The land equivalent ratio (LER) is defined as the relative land area of sole crops needed to produce the same yields as the intercrops and can be calculated for either the individual crop species in intercropping (partial LER), or for the entire intercropped crops involved as a whole [41,42,43].
Partial LERM = YintercropM/YmonocultureM
LER = Partial LERM + Partial LERP
where YintercropM or YintercropP is the yield based on the total land area occupied by the two crop species in the whole intercropping system. An intercropping system exhibits a yield advantage if LER > 1.0, and conversely, if LER < 1.0 a disadvantage occurs. Apparently, in the present study, the intercropped crop exhibits a yield advantage as compared to the mono-cropped if partial LERM > 0.6 for maize and partial LERM > 0.4 for peanut, and conversely a disadvantage occurs.
Partial LERs of grain/biomass yields of intercropped maize or peanut at various maize inter-plant distances (from 10 to 27 cm) were calculated by corresponding grain/biomass yields of intercropped maize or peanut in the total area dividing by grain/biomass yields of mono-cropped maize at the maize inter-plant distance of 27 cm or mono-cropped peanut.
The reciprocal coefficient of variation has been defined as community stability [25], i.e., S = µ/δ, where δ is the standard deviation of productivity and µ is the mean of productivity [26]. For the calculation of community stability, three replicates corresponded to each experimental treatment at each experimental location or in each year, the first replicated value of productivity of a same fixed treatment from three locations/years were collected to calculate µ, δ and S as the first repetition on the spatiotemporal scale, by analogy, the three replicates of community stability were obtained. Therefore, each experimental treatment had three values of S. All data of S from various experimental treatments were subjected to statistical analysis.

2.5. Statistical Analysis

A one-factor randomized block ANOVA process was generally used to analyze the experimental data with-in the same year or experimental location. Repeated-measures ANOVA with year/location as with-in subject factor and cropping system (monoculture vs. intercropping) as between-subjects factors were used to analyze the intact data of each index/parameter from three years/sites’ experiments. Means were separated by Fisher’s protected least significant difference (LSD) at p ≤ 0.05 or 0.01 levels. For overall effectiveness, the paired t test method was used to compare the data sets across locations/years. The Pearson correlation was used to analyze the relationships among various agronomic traits. ANOVA was performed with SAS 8.0 (SAS Institute, Cary, NC, USA), and t-tests and Pearson correlation with SPSS 17.0 (SPSS Incorporation, Chicago, IL, USA).

3. Results

3.1. Grain Yields and Partial LERs of Maize and Peanut and Corresponding LERs of the Whole Intercropping System

Grain yields of maize calculated based on the total land area occupied by the whole intercropping system comprise by two crop species were actually decreased by intercropping with peanut at various maize inter-plant distances as compared to monoculture, especially for the experiment conducted in Dongying (Table 2). Averaged over three locations/years, compared with the initial 8640.7 kg/ha in monoculture, intercropping significantly inhibited maize grain yields by 12.0–26.8%; with the maize density increased (i.e., with the inter-plant distance narrowed) in intercropping, maize grain yields gradually increased from 6325.7 kg/ha at the inter-plant distance of 27 cm to 7602.1 kg/ha at 10 cm. Pearson correlation showed that the maize grain yields in intercropping were positively correlated with maize densities in the experiment conducted in Dongying (r = 0.701, n = 15, p ≤ 0.01) and across all three locations (r = 0.311, n = 45, p ≤ 0.05) (Table 3). Partial LERs of maize in intercropping were all > 0.60 in all these three locations/years (Table 2). It seems that the partial LER was enlarged by increasing maize density in intercropping. Across all three locations, the averaged partial LERs of maize were increased significantly from 0.74 at the inter-plant distance of 27 cm to 0.87 at 13 cm and 0.88 at 10 cm (Table 2); there was a significant and positive correlation between the partial LERs of maize and maize densities (Table 3).
For peanut, grain yields and corresponding partial LERs were all dramatically reduced by intercropping (Table 2). The higher the densities of maize were, the lower the grain yields and partial LERs of peanut (with an exception of several cases in Dongying). Correlations between the grain yields or partial LERs of peanut in intercropping and maize densities in each experimental location and across all three locations were all negative (Table 3). Across three locations, the grain yields and partial LERs of peanut on average were decreased significantly from the initial 2695.6 kg/ha and 0.40 in monoculture to 411.0 kg/ha and 0.15 at the maize inter-plant distance of 27 cm in intercropping, respectively, and decreased further to 144.4 kg/ha and 0.05 at the lowest inter-plant distance (Table 2).
For the LERs of the whole intercropping system, including maize and peanut, in most situations, the LERs in intercropping were <1.0 (Table 2). Statistically, except for a significant reduction from 1.0 in monoculture to 0.87 at the maize inter-plant distance of 27 cm in intercropping in Dongying, no significant differences were observed among different cropping systems or different maize inter-plant distances (Table 2), and no significant correlations were found between the LERs in intercropping and maize densities (Table 3).
By comparison of performances of these three experimental locations/years, Licheng (in 2015) had highest grain yields and partial LERs of maize and total LERs, and lowest peanut grain yields; Zhangqiu (in 2016) had lowest maize grain yields, partial LERs of peanut and total LERs; Donying (in 2017) had lowest maize partial LERs and highest grain yields and partial LERs of peanut (Table 2).

3.2. Biomass Yields and Partial LERs of Maize and Peanut and Corresponding LERs of the Whole Intercropping System

Statistically, compared with mono-cropped maize, biomass yields of maize in total area occupied by the whole intercropping system were not influenced by intercropping in Licheng, and responded to intercropping at the maize inter-plant distance of 27 cm in Zhangqiu and at 27 and 20 cm in Dongying (Table 4). Maize biomass yields averaged over three experimental sites were decreased significantly by intercropping from the initial 14,352.8 kg/ha in monoculture to 11,803.6 kg/ha by 17.8% at the maize inter-plant distance of 20 cm, and decreased further to 10,328.3 kg/ha by 28.0% at the 27 cm inter-plant distance; among different intercropping treatments, increasing maize density enhanced the averaged maize biomass yields over three locations gradually from 10,328.3 kg/ha at the 27 cm inter-plant distance to the maximum 13,683.9 kg/ha at 10 cm. Significant positive effects on maize biomass yields as affected by narrowing the maize inter-plant distances (i.e., increasing maize densities) in intercropping were observed between 27 or 20 cm and 10 cm in Licheng, between 27 and 16 cm in Dongying, and between 27 and 10 cm averaged over three locations/years. Significant positive correlations were observed between the maize biomass yields in intercropping and maize densities in Licheng and across three locations (Table 3). All partial LERs of intercropped maize ranged 0.67–1.14, which were higher than 0.60 (Table 4). There was a trend that increasing maize densities by narrowing the maize inter-plant distances in intercropping increased partial LERs. The partial LERs of intercropped maize varied from 0.67 to 0.81 at the maize inter-plant distance of 27 cm and varied from 0.85 to 1.14 at the smallest 10 cm distance. Averaged over different experimental locations, the partial LER of intercropped maize gradually increased from 0.73 at the 27 cm inter-plant distance to 0.83 at 20 cm, 0.89 at 16 and 13 cm and 0.97 at 10 cm; there were significant differences between 27 cm and 16 cm or below (Table 4). There were significantly positive correlations between the partial LERs of intercropped maize and maize densities in Licheng and across three locations (Table 3).
Biomass yields of intercropped peanut in the total area varied from 594.8 to 2140.5 kg/ha, which were significantly lower than those in monoculture varying from 5212.6 to 10,710.1 kg/ha (Table 4). Simultaneously, the partial LERs of intercropped peanut varied from 0.08 to 0.24, which were significantly lower than 0.40. Statistically, the biomass yields and partial LERs of intercropped peanut were all negatively correlated with maize densities in each experimental location or across three locations (Table 3).
Across all three locations/years, LERs of the whole intercropping system ranged from 0.90 to 1.26 and were higher than 1.0 in the majority of cases (Table 4). The LERs of intercropped maize at the maize inter-plant distance of 27 cm in Zhangqiu and Dongying were all < 1.0, which led to the averaged LER over three locations (0.94) < 1.0, while the LERs on average (1.02–1.09) were all > 1.0 at the inter-plant distance of 27 cm below in intercropping. Except for the LER of intercropped maize at 10 cm inter-plant distance (1.26) was significantly higher than 1.0 and higher than 1.01 at 27 cm in intercropping in Licheng no significant differences were found in LERs among different cropping systems or maize inter-plant distances (Table 4), and no significant Pearson correlations were found between the LERs in intercropping and maize densities (Table 3).
By comparison of performances of these three experimental sites/years, Licheng (in 2015) had relatively higher grain yields and partial LERs of maize and total LERs, and lower peanut grain yields; Zhangqiu (in 2016) had relatively higher peanut grain yields and lower maize grain yields and total LERs; Donying (in 2017) had relatively lower maize partial LERs and higher partial LERs of peanut (Table 4).

3.3. Maize Plant and Ear Traits

When averaging over three locations, compared with monoculture intercropping at various maize densities did not significantly influence plant and ear heights of maize (Table 5). Intercropping significantly increased the ear length and ear axis diameter (at the maize inter-plant distance of 27 cm), the bald tip length (at ≤ 16 cm) and the hundred grain weight (at 27 and 20 cm), but significantly decreased the ear length, the ear axis diameter, rows per ear and kernels per row (at 10 cm), the stem thickness (at ≤ 16 cm), the ear diameter (at 13 and 10 cm), and the harvest index (at 16 and 10 cm). With the increase of maize densities by narrowing the inter-plant maize distance in intercropping, the stem thickness, ear length, ear diameter, ear axis diameter, rows per ear, kernels per ear and the hundred grain weight decreased gradually (with very few exceptions), in contrast, the bald tip length increased (Table 5; Figure 2).
Different experimental locations/years had significant impacts on plant and ear traits of maize except for the ear diameter. There were significant interactions between experimental locations/years and treatments in the ear height, ear length, bald tip length, ear diameter and ear axis diameter (Table 5).

3.4. Peanut Plant, Pod and Root traits

Intercropping with maize at the maize inter-plant distance of 27 cm significantly increased the main stem height and kernel rate per pod of peanut compared to monoculture, but no effects of intercropping at other maize inter-plant distances were observed in this study, averaged over three locations (Table 6). As shown in Figure 3 and Table 6, all of the peanut in intercropping had (significantly in the majority of cases) lower branching number, pod number per plant, hundred pod weight, double kernel rate, kernel harvest index and root dry weight than those in monoculture and increasing maize density in intercropping resulted in further reduction of these parameters.
Different experimental locations/years had significant impacts on plant, pod and root traits of peanut except for the kernel rate per pod. Significant interactions between experimental locations/years and treatments were observed in the pod number per plant, hundred pod weight and double kernel rate (Table 6).

3.5. Community Stability of Productivity

Compared with monoculture, intercropping significantly reduced the community stability of grain yields of maize from the initial 21.2 to 6.0–8.1 at the maize inter-plant distances ≤ 16 cm, and of peanut from the initial 4.4 to 1.5 at the maize inter-plant distance of 20 cm, 1.1 at 13 cm and 0.95 at 10 cm (Table 7). No significant differences were observed in the community stability of biomass yields of both maize and peanut.
For intercropped maize, the maize inter-plant distances of 27 and 20 cm led to relatively higher community stability of grain/biomass yields and partial LERs than those ≤ 16 cm (Table 7). For intercropped peanut, increasing maize density significantly decreased the community stability of grain partial LERs from 3.8 at the maize inter-plant distance of 27 cm to 1.4 at 13 cm and 1.1 at 10 cm, and significantly decreased the community stability of biomass partial LERs from 7.6 at 27 cm to 2.9 at 20 cm, 4.3 at 16 cm, and 2.7 at 10 cm. Pearson correlation analysis showed that the community stability of grain partial LERs in intercropping were negatively correlated with maize densities (r = −0.633, n = 15, p = 0.0114). Paired t test showed that the community stability of biomass partial LERs is significantly higher than that of grain partial LERs (n = 15, p = 0.0011).
For total LERs, intercropping achieved significantly higher community stability of total grain LERs at the maize inter-plant distance of 27 cm than those ≤ 16 cm, and significantly higher community stability of total biomass LERs at the 20 cm than those at other distances (Table 7).

4. Discussion

Increasing intercrop density dramatically influences the competitive dynamics between component crop species because dominance is always enhanced [17]. In a recent maize/pea intercropping study, the increase of maize planting density could improve the yield of intercropped maize and the partial LER of maize but decreased the grain yields of intercropped pea and corresponding partial LERs [22]. Similar results were obtained from three different experimental locations/years in this current study, which confirmed that increasing maize densities in maize/peanut intercropping enhanced maize grain/biomass yields but reduced the companion peanut grain/biomass yields (Table 2 and Table 4). Therefore, there was a competitive and balanced relationship between the two crop species restricting each other [44], the higher maize yields were achieved at the expense of peanut yields. No matter how the maize densities (i.e., maize inter-plant distances) or yields of maize and peanut changed, there were no significant changes in LERs at most situations or averaged over three locations. The comprehensive yield effect of the whole intercropping system is stable and there is an equilibrium effect.
LERs of grain yields averaged over three locations ranged from 0.89 to 0.98 (<1.0) among various maize inter-plant distances, while LERs of biomass yields ranged from 0.94 to 1.09 (>1.0 except for the maize inter-plant distance of 27 cm) (Table 2 and Table 4). Paired t test showed LERs of biomass yields were all significantly higher than those of grain yields for each experimental site (n = 15) or for each maize inter-plant distance across three locations (n = 9). All these results indicated that the intercropping of maize/peanut was not beneficial to the accumulation of grain yields but had some advantages on biomass yields. Paired t test showed that the partial LERs of grain yields of peanut were all significantly lower than those of biomass yields for each experimental site (n = 15) or for each maize inter-plant distance across three locations (n = 9), and the partial LERs of grain yields of maize were also significantly lower than those of biomass yields in Licheng (n = 15) and at the maize inter-plant distance of 16 cm (n = 9), which corresponded to the grain yield disadvantage of the whole intercropping system. Maize-legume intercrops could substantially increase forage quantity and quality and decrease the requirement for protein supplements [45]. Since LERs of biomass yields are > 1.0, there is potential for maize silage and peanut forage production.
Harvest index (the ratio of grain yield to biological yield or biomass) is an important agronomic index to reflect the ability of a cereal crop to translocate photosynthates to grains [46]. In a maize/peanut intercropping, the dry matter distributed toward the stem and leaf of intercropped maize was reduced as compared to the sole maize, intercropping promoted the distribution of photosynthetic assimilates toward the grain and increased the harvest index by 0.7–3.0% [47]. In a relay intercropping of wheat/maize reported by Zhou et al. (2017) [48], the over-yielding of intercropped wheat (especially for border rows) was mainly attributed to more aboveground biomass across the whole growing season and the increased harvest index. In the present study, according to the paired t tests between partial/total LERs of grain and biomass yields mentioned above and the calculation formulas of the partial LER and total LER, it was mainly the reduced harvest indexes of intercropped peanut compared to monoculture that led to lower partial LERs of grain yields of peanut than those of biomass yields and the disadvantage of grain yields of the whole intercropping system (Table 2, Table 4 and Table 6). Shading was found to impair nutrient acquisition in intercropping systems of wheat with alfalfa or soybean [49], and of maize with soybean [50], mainly due to reduced photosynthetic capacity and below-ground root and above-ground shoot biomass accumulation of the shaded crop as compared with monoculture. Therefore, shading induced by maize in the present study may play an important role in decreasing not only peanut biomass, but also leading to less translocation of dry matter from vegetative organs to peanut grains. Obvious reductions in hundred pod weights, double kernel rates and especially the pod number per plant possibly explain the decrease in the harvest index of intercropped peanut. Compared with peanut, the maize harvest index was less affected by intercropping (Table 5 and Table 6).
There exists the optimum crop planting density in intercropping. Craufurd (2000) [51] noted that poor management of planting density could be detrimental to intercropping. Plant densities that are too low limit the potential yield, and that are too high lead to increased stress on the plant, and increased interplant competition for light, water and nutrients [52] which also decreases the yield. In South Africa, three maize densities (18,500, 24,700 and 37,000 plants/ha) and two dry bean arrangements (single and double row arrangement) were intercropped together, maize density of 18,500 plants/ha achieved significantly lower maize yield than 24,700 and 37,000 plants/ha, and that of 37,000 plants/ha with double row of dry bean is recommended [19]. In Wolaita Zone Southern Ethiopia of Africa, intercropping of maize (44,444 plants/ha) with common bean (93,750 plants/ha) obtained both higher agronomic and economic advantage than sole crops and the intercropping with bean at 62,500 plants/ha [21]. In field trails on the loess Plateau, China, the dry matter production and leaf area index of maize increased as the plant density increased irrespective of whether it was grown in monoculture or intercropping; while the greatest LER was observed in two rows of maize intercropping with two rows of soybean at low density [17]. In our study, the rational increase of maize densities in intercropping from the inter-plant distance of 27 to 20 cm increased LERs (Table 2 and Table 4), especially for the averaged LER of the biomass yield over three locations, which was enhanced from 0.94 (<1.0) to 1.03, showing the intercropping yield advantage. Willey and Osiru (1972) [24] determined that a higher density of component intercrops resulted in greater intercropping advantages in a maize/bean intercropping. However, further increase in maize planting densities by narrowing the maize inter-plant distances (≤16 cm) didn’t lead to significantly higher LERs of grain/biomass yields than those at 20 cm (Table 2 and Table 4), unfortunately wasted maize seeds and reduced the community stability of productivity severely (especially for maize and total LERs), compared to monoculture and intercropping at the maize inter-plant distances of 27 and 20 cm (Table 7). A maize/sweet potato intercropping study in northern Uganda showed similar results that Land Equivalent Ratios of >1.2 were obtained at maize intercrop densities of 41,666 and 55,555 but not at 88,888 plants/ha [20]. Simultaneously, the 
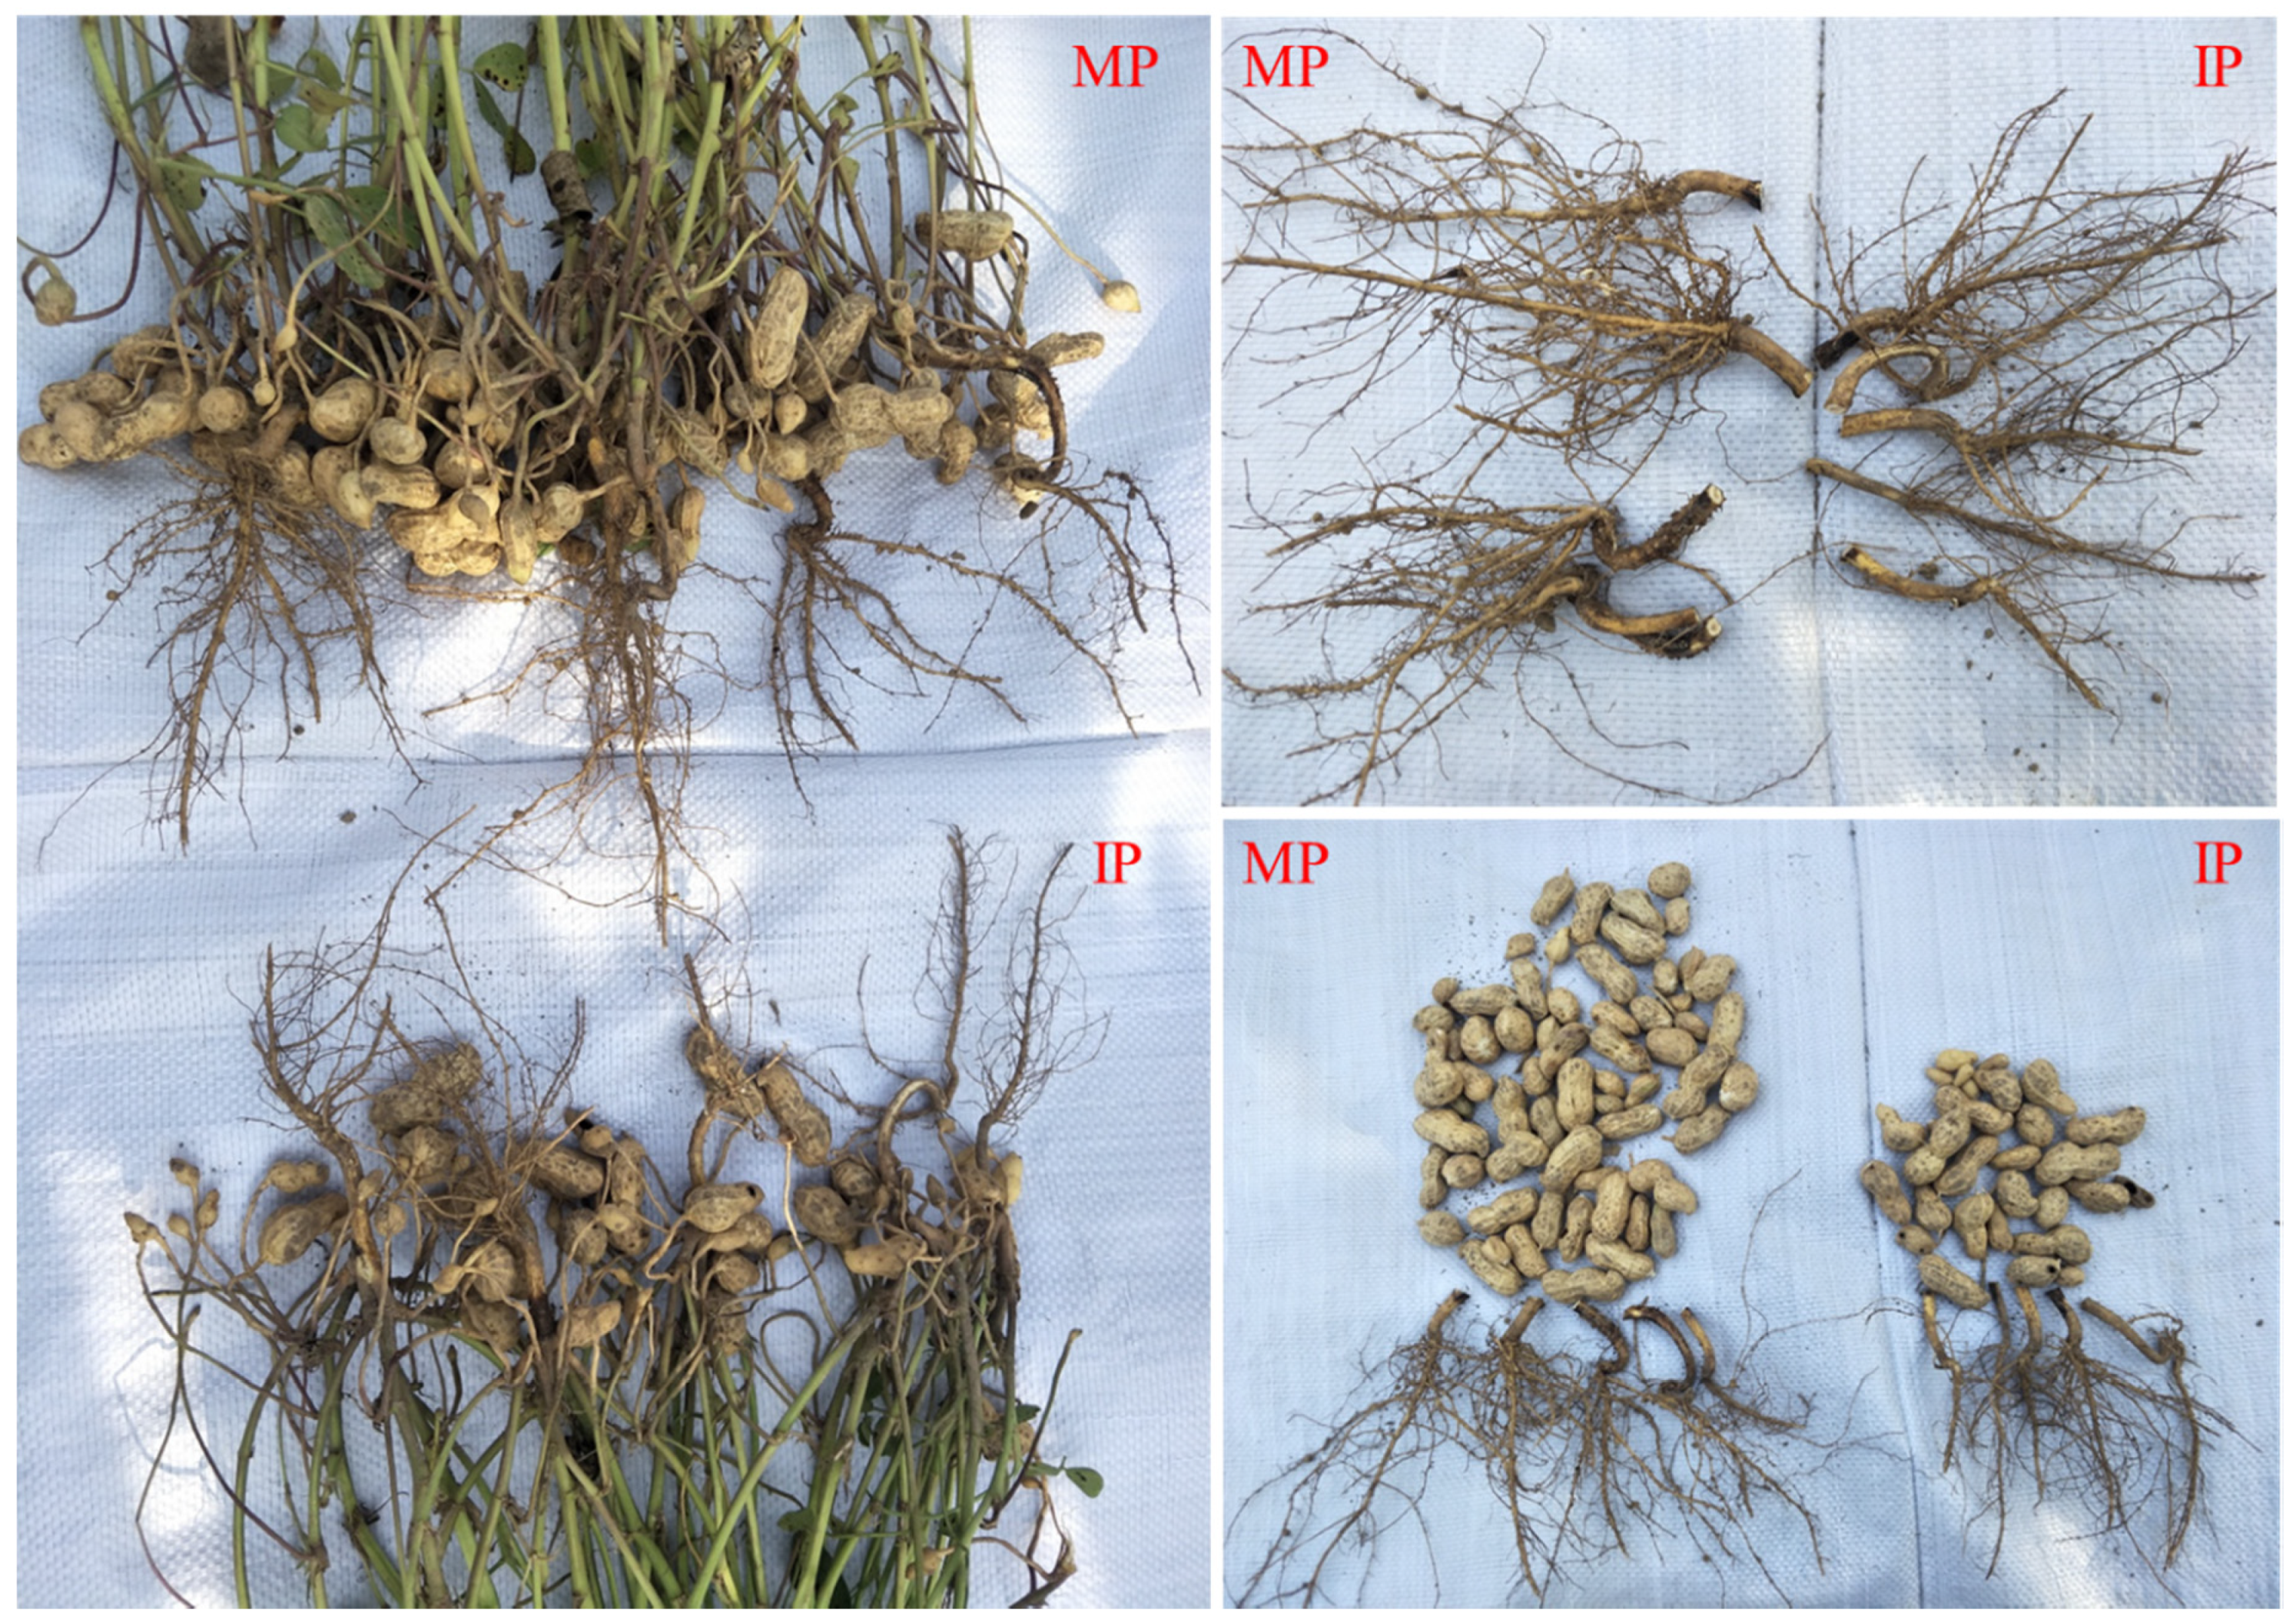
β-carotene content and yield in sweet potato roots were significantly reduced by high maize density. In the present study, the excessive increase in maize densities are more likely to lead to abnormal maize ears with long bald tips, low seed setting rates and irregular grain/seed shortcomings and peanut with relative much stalks and leaves but little pods bearing (Figure 2 and Figure 3), and whether the corresponding grain nutritional quality also deteriorate is worth further investigation.
Three limitations existed in this current study. (1) No yield platform was found for maize or peanut in intercropping with increasing the maize density. The possible reason is the actual maximum maize density is not high enough. (2) At harvest, the actual maize planting density was not determined. (3) Lack of corresponding density treatments on monocropped maize. All partial LERs of maize were calculated based on the performance of maize in conventional monoculture at the inter-plant distance of 27 cm, which was convenient for mechanical single seed sowing and widely adopted by local farmers.
Yang et al. (2018) [22] reported that net returns and benefit to cost ratios of maize/pea intercropping were increased with an increase of maize planting density. The economic benefits of maize/peanut intercropping as affected by maize planting densities were not investigated in the present study. The maize/peanut intercropping required more labor in their production than sole cropping. Consequently, like the maize/pea intercropping [22], the grain yield, net returns and benefit to cost rations of maize/peanut intercropping may be similar or even lower than sole maize. However, the inclusion of annual legumes in cropping systems via either cereal/legume intercropping or cereal-legume rotations can significantly reduce the use of synthetic N and P fertilizer, as the legumes fix N2 from the atmosphere to reduce the requirement for inorganic nitrogen in crop production, and secret H+ and organic acids to mobilize soil sparingly soluble P to facilitate P uptake by maize [34,35,53,54,55,56,57]. Furthermore, such a cereal/legume intercropping system can provide significant ecological and environmental benefits by also lowering the environmental carbon footprint [38,58,59,60], and enhancing soil and ecological sustainability and/or resilience to climate change and pest, disease and weed damage [3,4,10,61,62,63].

5. Conclusions

The increase of maize densities in maize/peanut intercropping enhanced maize productivity at the cost of peanut. The higher the maize density, the higher the maize yields and the lower the peanut yields. The comprehensive yield effect of the whole intercropping system (i.e., LER) is relatively stable and less affected. Intercropping of maize/peanut was not beneficial to the accumulation of grain yields (LERs < 1.0) but had some advantages on biomass yields (LERs > 1.0). Shading by maize decreased not only the peanut biomass, but also the kernel harvest index. The higher the maize density, the lower the harvest index of peanut. It was mainly the reduced kernel harvest indexes of intercropped peanut that led to lower partial LERs of grain yields than those of biomass yields of peanut and the grain yield accumulation disadvantage of the whole intercropping system. Excessive narrowing maize inter-plant distances (from the initial 27 cm to be ≤ 16 cm) wasted maize seeds, unfortunately reduced the community stability of productivity severely (especially for maize and total LERs) and are more likely to produce abnormal maize ears and peanut with relative much stalks and leaves but little pods bearing. Therefore, the maize density in maize/peanut intercropping is not “the more the better”, a rational increase of maize densities is suggested to maintain the balance between maize and peanut and the comprehensive yield advantage.

Author Contributions

Methodology, H.X. (Huasen Xu) and R.Y.; investigation, L.W., Y.X. (Yanfang Xue), W.K., Y.X. (Yanhui Xue), J.W. and Z.L.; resources, X.W. and X.G.; writing—original draft preparation, H.X. (Haiyong Xia); writing—review and editing, H.X. (Haiyong Xia).

Funding

This research was financially supported by the National Key Research and Development Program of China (2016YFD0300202, 2017YFD0300407), the National Natural Science Foundation of China (31501834), the Shandong Provincial Key Research and Development Program of China (2017CXGC0304, 2016CYJS05A01-4), the Young Scientist Research Foundation of the Shandong Academy of Agricultural Sciences of China (SAAS, 2014QNM07), the Project Granted to Dr. Haiyong Xia by Shandong Provincial Key Laboratory of Crop Genetic Improvement, Ecology and Physiology, the Shandong Provincial Innovation Project for Agricultural Key Technology Application: Research and Demonstration of Annual Planting Patterns and Key Technologies for Green Improvement of Grain, Industrial and Forage Crops Production, the SAAS Innovation Project (CXGC2016B04), and the Corn Innovation Team of Shandong Provincial Modern Agricultural Industry and Technology System (SDAIT-01-021-11, SDAIT-02-11).

Acknowledgments

We thank the reviewers for valuable comments and suggestions and editors for valuable work.

Conflicts of Interest

The authors declare no conflict of interest.

References

  1. Chen, X.; Zhang, Y.; Tong, Y.; Xue, Y.; Liu, D.; Zhang, W.; Deng, Y.; Meng, Q.; Yue, S.; Yan, P.; et al. Harvesting more grain zinc of wheat for human health. Sci. Rep. 2017, 7, 7016. [Google Scholar] [CrossRef] [PubMed]
  2. Cui, Z.; Zhang, H.; Chen, X.; Zhang, C.; Ma, W.; Huang, C.; Zhang, W.; Mi, G.; Miao, Y.; Li, X.; et al. Pursuing sustainable productivity with millions of smallholder farmers. Nature 2018, 555, 363–366. [Google Scholar] [CrossRef]
  3. Altieri, M.A.; Nicholls, C.I.; Henao, A.; Lana, M.A. Agroecology and the design of climate change-resilient farming systems. Agron. Sustain. Dev. 2015, 35, 869–890. [Google Scholar] [CrossRef]
  4. Altieri, M.A.; Nicholls, C.I.; Montalba, R. Technological approaches to sustainable agriculture at a crossroads: An agroecological perspective. Sustainability 2017, 9, 349. [Google Scholar] [CrossRef]
  5. Mockshell, J.; Kamanda, J. Beyond the Agroecologial and Sustainable Agricultural Intensification Debate: Is Blended Sustainability the Way Forward? Discussion Paper; German Development Institute: Bonn, Germany, 2017; pp. 1–25. [Google Scholar]
  6. Brooker, R.W.; Bennett, A.E.; Cong, W.-F.; Daniell, T.J.; George, T.S.; Hallett, P.D.; Hawes, C.; Iannetta, P.P.M.; Jones, H.G.; Karley, A.J.; et al. Improving intercropping: A synthesis of research in agronomy, plant physiology and ecology. New Phytol. 2015, 206, 107–117. [Google Scholar] [CrossRef] [PubMed]
  7. Martin-Guay, M.-O.; Paquette, A.; Dupras, J.; Rivest, D. The new Green Revolution: Sustainable intensification of agriculture by intercropping. Sci. Total Environ. 2018, 615, 767–772. [Google Scholar] [CrossRef]
  8. Xue, Y.; Xia, H.; Christie, P.; Zhang, Z.; Li, L.; Tang, C. Crop acquisition of phosphorus, iron and zinc from soil in cereal/legume intercropping systems: A critical review. Ann. Bot. 2016, 117, 363–377. [Google Scholar] [CrossRef] [PubMed]
  9. Duchene, O.; Vian, J.; Celette, F. Intercropping with legume for agroecological cropping systems: Complementarity and facilitation processes and the importance of soil microorganisms. A review. Agric. Ecosyst. Environ. 2017, 240, 148–161. [Google Scholar] [CrossRef]
  10. Faucon, M.-P.; Houben, D.; Lambers, H. Plant functional traits: Soil and ecosystem services. Trends Plant Sci. 2017, 22, 385–394. [Google Scholar] [CrossRef]
  11. Dong, N.; Tang, M.-M.; Zhang, W.-P.; Bao, X.-G.; Wang, Y.; Christie, P.; Li, L. Temporal differentiation of crop growth as one of the drivers of intercropping yield advantage. Sci. Rep. 2018, 8, 3110. [Google Scholar] [CrossRef]
  12. Fridley, J.D. Diversity effects on production in different light and fertility environments: An experiment with communities of annual plants. J. Ecol. 2003, 91, 396–406. [Google Scholar] [CrossRef]
  13. Hauggaard-Nielsen, H.; Andersen, M.K.; Jørnsgaard, B.; Jensen, E.S. Density and relative frequency effects on competitive interactions and resource use in pea-barley intercrops. Field Crops Res. 2006, 95, 256–267. [Google Scholar] [CrossRef]
  14. Fan, Z.; Chai, Q.; Huang, G.; Yu, A.; Huang, P.; Yang, C.; Tao, Z.; Liu, H. Yield and water consumption characteristics of wheat/maize intercropping with reduced tillage in an Oasis region. Eur. J. Agron. 2013, 45, 52–58. [Google Scholar] [CrossRef]
  15. Daneshnia, F.; Amini, A.; Chaichi, M.R. Berseem clover quality and basil essential oil yield in intercropping system under limited irrigation treatments with surfactant. Agric. Water Manag. 2016, 164, 331–339. [Google Scholar] [CrossRef]
  16. Forey, O.; Metay, A.; Wery, J. Differential effect of regulated deficit irrigation on growth and photosynthesis in young peach trees intercropped with grass. Eur. J. Agron. 2016, 81, 106–116. [Google Scholar] [CrossRef]
  17. Ren, Y.; Liu, J.; Wang, Z.; Zhang, S. Planting density and sowing proportions of maize–soybean intercrops affected competitive interactions and water-use efficiencies on the Loess Plateau, China. Eur. J. Agron. 2016, 72, 70–79. [Google Scholar] [CrossRef]
  18. Zhang, D.; Zhang, C.; Tang, X.; Li, H.; Zhang, F.; Rengel, Z.; Whalley, W.; Davies, W.; Shen, J. Increased soil phosphorus availability induced by faba bean root exudation stimulates root growth and phosphorus uptake in neighbouring maize. New Phytol. 2016, 209, 823–831. [Google Scholar] [CrossRef]
  19. Nthabiseng, T.R.; Irvine, K.M.; Moshibudi, P.M. Response of a maize or dry bean intercrop to maize density and dry bean arrangement under rainfed conditions. Int. J. Agron. Agric. Res. 2015, 6, 18–29. [Google Scholar]
  20. Asiimwe, A.; Tabu, I.M.; Lemaga, B.; Tumwegamire, S. Effect of maize intercrop plant densities on yield and β-carotene contents of orange-fleshed sweetpotatoes. Afr. Crop Sci. J. 2016, 24, 75–87. [Google Scholar] [CrossRef]
  21. Habte, A.; Kassa, M.; Sisay, A. Maize (Zea mays L.)-common bean (Phaseolus vulgaris L.) intercropping response to population density of component crop in Wolaita Zone Southern Ethiopia. J. Nat. Sci. Res. 2016, 6, 69–74. [Google Scholar]
  22. Yang, C.; Fan, Z.; Chai, Q. Agronomic and economic benefits of pea/maize intercropping systems in relation to N fertilizer and maize density. Agronomy 2018, 8, 52. [Google Scholar] [CrossRef]
  23. Peksen, E.; Gulumser, A. Dwarf bean (Phaseolus vulgaris L.) affected by planting arrangements, planting rates and relative time of sowing. Int. J. Curr. Microbiol. Appl. Sci. 2013, 2, 290–299. [Google Scholar]
  24. Willey, R.W.; Osiru, D.S.O. Studies on mixtures of maize and beans (Phaseolus vulgaris) with particular reference to plant population. J. Agric. Sci. 1972, 79, 517–529. [Google Scholar] [CrossRef]
  25. Tilman, D. The ecological consequences of changes in biodiversity: A search for general principles. Ecology 1999, 80, 1455–1474. [Google Scholar] [CrossRef]
  26. Lehman, C.; Tilman, D. Biodiversity, stability, and productivity in competitive communities. Am. Nat. 2000, 156, 534–552. [Google Scholar] [CrossRef] [PubMed]
  27. Li, L.; Tilman, D.; Lambers, H.; Zhang, F. Plant diversity and overyielding: Insights from belowground facilitation of intercropping in agriculture. New Phytol. 2014, 203, 63–69. [Google Scholar] [CrossRef]
  28. Von Cossel, M.; Lewandowski, I. Perennial wild plant mixtures for biomass production: Impact of species composition dynamics on yield performance over a five-year cultivation period in southwest Germany. Eur. J. Agron. 2016, 79, 74–89. [Google Scholar] [CrossRef]
  29. Bonin, C.L.; Fidel, R.B.; Banik, C.; Laird, D.A.; Mitchell, R.; Heaton, E.A. Perennial biomass crop establishment, community characteristics, and productivity in the upper US Midwest: Effects of cropping systems seed mixtures and biochar applications. Eur. J. Agron. 2018, 201, 121–128. [Google Scholar] [CrossRef]
  30. Zhu, Y.; Chen, H.; Fan, J.; Wang, Y.; Li, Y.; Chen, J.; Fan, J.; Yang, S.; Hu, L.; Leung, H.; et al. Genetic diversity and disease control in rice. Nature 2000, 406, 718–722. [Google Scholar] [CrossRef] [PubMed]
  31. Wan, N.-F.; Cai, Y.-M.; Shen, Y.-J.; Ji, X.-Y.; Wu, X.-W.; Zheng, X.-R.; Cheng, W.; Li, J.; Jiang, Y.-P.; Chen, X.; et al. Increasing plant diversity with border crops reduces insecticide use and increases crop yield in urban agriculture. eLife 2018, 7, e35103. [Google Scholar] [CrossRef] [Green Version]
  32. Damicone, J.P.; Edelson, J.V.; Sherwood, J.L.; Myers, L.D.; Motes, J.E. Effects of border crops and intercrops on control of cucurbit virus diseases. Plant Dis. 2007, 91, 509–516. [Google Scholar] [CrossRef] [PubMed]
  33. Khan, Z.R.; Ampong-Nyarko, K.; Chiliswa, P.; Hassanali, A.; Kimani, S.; Lwande, W.; Overholt, W.A.; Overholt, W.A.; Picketta, J.A.; Smart, L.E.; et al. Intercropping increases parasitism of pests. Nature 1997, 388, 631–632. [Google Scholar] [CrossRef]
  34. Hauggaard-Nielsen, H.; Gooding, M.; Ambus, P.; Corre-Hellou, G.; Crozat, Y.; Dahlmann, C.; Dibet, A.; von Fragstein, P.; Pristeri, A.; Monti, M.; et al. Pea-barley intercropping for efficient symbiotic N2-fixation, soil N acquisition and use of other nutrients in European organic cropping systems. Field Crops Res. 2009, 113, 64–71. [Google Scholar] [CrossRef]
  35. Li, C.J.; Li, Y.Y.; Yu, C.B.; Sun, J.H.; Christie, P.; An, M.; Zhang, F.S.; Li, L. Crop nitrogen use and soil mineral nitrogen accumulation under different crop combinations and patterns of strip intercropping in northwest China. Plant Soil 2011, 342, 221–231. [Google Scholar] [CrossRef] [Green Version]
  36. Mao, L.; Zhang, L.; Li, W.; van der Werf, W.; Sun, J.; Spiertz, H.; Li, L. Yield advantage and water saving in maize/pea intercrop. Field Crops Res. 2012, 138, 11–20. [Google Scholar] [CrossRef]
  37. Pelzer, E.; Bazot, M.; Makowski, D.; Corre-Hellou, G.; Naudin, C.; Al Rifaï, M.; Baranger, E.; Bedoussac, L.; Biarnès, V.; Boucheny, P.; et al. Pea-wheat intercrops in low-input conditions combine high economic performances and low environmental impacts. Eur. J. Agron. 2012, 40, 39–53. [Google Scholar] [CrossRef]
  38. Liu, C.; Cutforth, H.; Chai, Q.; Gan, Y.T. Farming tactics to reduce the carbon footprint of crop cultivation in semiarid areas. A review. Agron. Sustain. Dev. 2016, 36, 69. [Google Scholar] [CrossRef]
  39. Hu, F.L.; Zhao, C.; Feng, F.X.; Chai, Q.; Mu, Y.P.; Zhang, Y. Improving N management through intercropping alleviates the inhibitory effect of mineral N on nodulation in pea. Plant Soil 2017, 412, 235–251. [Google Scholar] [CrossRef]
  40. Sun, X.; Long, Z.; Song, G.; Chen, C. Effects of climate change on cropping pattern and yield of summer maize-winter wheat in Huang-Huai-Hai Plain. Sci. Agric. Sin. 2017, 50, 2476–2487. (In Chinese) [Google Scholar]
  41. He, Y.; Ding, N.; Shi, J.; Wu, M.; Liao, H.; Xu, J. Profiling of microbial PLFAs: Implications for interspecific interactions due to intercropping which increase phosphorus uptake in phosphorus limited acidic soils. Soil Biol. Biochem. 2013, 57, 625–634. [Google Scholar] [CrossRef]
  42. Tang, X.; Placella, S.A.; Daydé, F.; Bernard, L.; Robin, A.; Journet, E.-P.; Justes, E.; Hinsinger, P. Phosphorus availability and microbial community in the rhizosphere of intercropped cereal and legume along a P-fertilizer gradient. Plant Soil 2016, 407, 119–134. [Google Scholar] [CrossRef]
  43. Darch, T.; Giles, C.D.; Blackwell, M.S.A.; George, T.S.; Brown, L.K.; Menezes-Blackburn, D.; Shand, C.A.; Stutter, M.I.; Lumsdon, D.G.; Mezeli, M.M.; et al. Inter- and intra-species intercropping of barley cultivars and legume species, as affected by soil phosphorus availability. Plant Soil 2018, 427, 125–138. [Google Scholar] [CrossRef]
  44. Wang, Y.Q.; Zhao, Z.G.; Li, J.P.; Zhang, M.; Zhou, S.L.; Wang, Z.M.; Zhang, Y.H. Does maize hybrid intercropping increase yield due to border effects? Field Crops Res. 2017, 214, 283–290. [Google Scholar] [CrossRef]
  45. Javanmard, A.; Nasab, A.D.M.; Javanshir, A.; Moghaddam, M.; Janmohammadi, H. Forage yield and quality in intercropping of maize with different legumes as doube-cropped. J. Food Agric. Environ. 2009, 7, 163–166. [Google Scholar]
  46. Hay, R. Harvest index: A review of its use in plant breeding and crop physiology. Ann. Appl. Biol. 1995, 126, 197–216. [Google Scholar] [CrossRef]
  47. Jiao, N.-Y.; Chen, M.-C.; Ning, T.-Y.; Li, Z.-J. Effects of maize intercropping with peanut on dry matter accumulation and distribution of maize. J. Anhui Agric. Sci. 2007, 35, 11782–11783. (In Chinese) [Google Scholar]
  48. Zhou, T.; Xu, K.; Liu, W.; Zhang, C.; Chen, Y.; Yang, W. More aboveground biomass, phosphorus accumulation and remobilization contributed to high productivity of intercropping wheat. Int. J. Plant Prod. 2017, 11, 407–424. [Google Scholar]
  49. Whitehead, M.; Isaac, M.E. Effects of shade on nitrogen and phosphorus acquisition in cereal–legume intercropping systems. Agriculture 2012, 2, 12–24. [Google Scholar] [CrossRef]
  50. Gong, W.Z.; Jiang, C.D.; Wu, Y.S.; Chen, H.H.; Liu, W.Y.; Yang, W.Y. Tolerance vs. avoidance: Two strategies of soybean (Glycine max) seedlings in response to shade in intercropping. Phytosynthetica 2015, 53, 259–268. [Google Scholar] [CrossRef]
  51. Craufurd, P.Q. Effect of plant density on the yield of sorghum-cowpea and pearl millet-cowpea intercrops in northern Nigeria. Exp. Agric. 2000, 36, 379–395. [Google Scholar] [CrossRef]
  52. Ayisi, K.; Mpangane, P. Growth and Symbiotic Activities of Cowpea Cultivars in Sole and Binary Cultures with Maize; ACIAR: Canberra, Australia, 2004; pp. 94–97. [Google Scholar]
  53. Li, L.; Li, S.-M.; Sun, J.-H.; Zhou, L.-L.; Bao, X.-G.; Zhang, H.-G.; Zhang, F.-S. Diversity enhances agricultural productivity via rhizosphere phosphorus facilitation on phosphorus-deficient soils. Proc. Natl. Acad. Sci. USA 2007, 104, 11192–11196. [Google Scholar] [CrossRef] [Green Version]
  54. Latati, M.; Blavet, D.; Alkama, N.; Laoufi, H.; Drevon, J.J.; Gérard, F.; Pansu, M.; Ounane, S.M. The intercropping cowpea-maize improves soil phosphorus availability and maize yields in an alkaline soil. Plant Soil 2014, 385, 181–191. [Google Scholar] [CrossRef]
  55. Grant, C.A.; O’Donovan, J.T.; Blackshaw, R.E.; Harker, K.N.; Johnson, E.N.; Gan, Y.; Lafond, G.P.; May, W.E.; Turkington, T.K.; Lupwayi, N.Z.; et al. Residual effects of preceding crops and nitrogen fertilizer on yield and crop and soil N dynamics of spring wheat and canola in varying environments on the Canadian prairies. Field Crops Res. 2016, 192, 86–102. [Google Scholar] [CrossRef]
  56. Wang, X.; Deng, X.; Pu, T.; Song, C.; Yong, T.; Yang, F.; Sun, X.; Liu, W.; Yan, Y.; Du, J.; et al. Contribution of interspecific interactions and phosphorus application to increasing soil phosphorus availability in relay intercropping systems. Field Crops Res. 2017, 204, 12–22. [Google Scholar] [CrossRef]
  57. Li, X.-F.; Wang, C.-B.; Zhang, W.-P.; Wang, L.-H.; Tian, X.-L.; Yang, S.-C.; Jiang, W.-L.; Ruijven, J.v.; Li, L. The role of complementarity and selection effects in P acquisition of intercropping systems. Plant Soil 2018, 422, 479–493. [Google Scholar] [CrossRef]
  58. Chai, Q.; Qin, A.Z.; Gan, Y.T.; Yu, A.Z. Higher yield and lower carbon emission by intercropping maize with rape, pea, and wheat in arid irrigation areas. Agron. Sustain. Dev. 2014, 34, 535–543. [Google Scholar] [CrossRef]
  59. Gan, Y.; Liang, C.; Hamel, C.; Cutforth, H.; Wang, H. Strategies for reducing the carbon footprint of field crops for semiarid areas. A review. Agron. Sustain. Dev. 2011, 31, 643–656. [Google Scholar] [CrossRef]
  60. Gan, Y.T.; Liang, C.; Chai, Q.; Lemke, R.L.; Campbell, C.A.; Zentner, R.P. Improving farming practices reduces the carbon footprint of spring wheat production. Nat. Commun. 2014, 5, 5012. [Google Scholar] [CrossRef] [PubMed] [Green Version]
  61. Wang, Z.-G.; Jin, X.; Bao, X.-G.; Li, X.-F.; Zhao, J.-H.; Sun, J.-H.; Christie, P.; Li, L. Intercropping enhances productivity and maintains the most soil fertility properties relative to sole cropping. PLoS ONE 2014, 9, e113984. [Google Scholar]
  62. Oelbermann, M.; Regehr, A.; Echarte, L. Changes in soil characteristics after six seasons of cereal-legume intercropping in the Southern Pampa. Geod. Region. 2015, 4, 100–107. [Google Scholar] [CrossRef]
  63. Weiner, J. Applying plant ecological knowledge to increase agricultural sustainability. J. Ecol. 2017, 105, 865–870. [Google Scholar] [CrossRef] [Green Version]
Figure 1. Diagrammatic representation of the strip intercropping.
Agronomy 09 00150 g001
Figure 2. Maize ears (10 plants) in intercropping at various maize inter-plant distances and in monoculture, and corresponding peanut pods (two adjacent rows of peanut in 1.0 m length) in Licheng.
Agronomy 09 00150 g002
Figure 3. Peanut (five plants) in intercropping (at the maize inter-plant distance of 10 cm, IP) and in monoculture (MP) in Dongying.
Agronomy 09 00150 g003
Table 1. Detailed site locations (geographic coordinates) and soil basal properties in the 0–20 cm soil layers.
YearExperimental SiteGeographic CoordinateAltitude (m)Soil TypepH (2.5:1 Water: Soil Ratio)Organic Matter (g/kg)Total Nitrogen (g/kg)Alkaline Hydrolysis Nitrogen (mg/kg)Olsen P (mg/kg)Exchangeable Potassium (mg/kg)Total Salt (g/kg)
2015Licheng117°04′ E, 36°42′ N48.0Fluvo-aquic soil7.720.7-44.514.8162.6-
2016Zhangqiu117°32′ E, 36°43′ N40.7Brown soil7.915.4-39.845.968.5-
2017Dongying118°39′ E, 37°19′ N22.3Fluvo-aquic soil8.811.21.7-22.6230.61.9
Table 2. Grain yields and partial land equivalent ratios (LERs) of maize and peanut and corresponding LERs of the whole intercropping system as affected by different cropping systems and maize densities across different locations/years.
Cropping SystemInter-Plant Distance (cm)Maize Density (plant/ha)Grain Yields 1 (kg/ha)Partial LERs 2
2015-Licheng2016-Zhangqiu2017-DongyingMeanANOVA2015-Licheng2016-Zhangqiu2017-DongyingMeanANOVA
Maize
Monoculture2761,7288816.2a8212.1a8893.9a8640.7ALocation (L) = 0.00150.60b0.60b0.60d0.60C
Intercropping2737,0377097.3a5808.0b6071.7d6325.7CTreatment (T) = 0.00250.81a0.71ab0.69cd0.74BL = 0.0297
2050,0007947.5a7196.5ab6437.1cd7193.7BCL × T = 0.84280.90a0.88a0.73bc0.84ABT = 0.0002
1662,5008453.1a6004.0b6994.3bcd7150.5BC 0.95a0.73ab0.79ab0.83ABL × T = 0.8678
1376,9238091.8a6822.9ab7522.6b7479.1B 0.91a0.83a0.85a0.87A
10100,0008603.0a6854.5ab7348.8bc7602.1B 0.97a0.85a0.83a0.88A
Mean 8168.2A6816.3B7211.4B7398.6 0.86A0.77B0.75B0.79
Peanut
Monoculture2761,7282013.0a2894.9a3178.9a2695.6AL < 0.00010.40a0.40a0.40a0.40A
Intercropping2737,037327.2b330.5b575.3bc411.0BT < 0.00010.16b0.12b0.18bc0.15BL < 0.0001
2050,000237.9bc218.9b755.8b404.2BL × T = 0.00140.12c0.08c0.25b0.15BT < 0.0001
1662,500122.2c176.7b354.4c217.7C 0.06d0.06c0.12cd0.08CL × T = 0.0067
1376,923110.4c62.4b359.7c177.5C 0.06d0.02d0.12cd0.06C
10100,00080.5c32.7b319.9c144.4C 0.04d0.01d0.10d0.05C
Mean 481.9C619.4B924.0A675.1 0.14B0.11C0.19A0.15
LERs
Monoculture2761,7281.00a1.00a1.00a1.00A
Intercropping2737,0370.97a0.83a0.87b0.89AL = 0.0369
2050,0001.02a0.95a0.98ab0.98AT = 0.4205
1662,5001.01a0.79a0.91ab0.90AL × T = 0.9710
1376,9230.97a0.86a0.97ab0.93A
10100,0001.01a0.86a0.93ab0.94A
Mean 1.00A0.88B0.94AB0.94
Values are means of three replicates. Values followed by the same lowercase letters at the same experimental location are not significantly different among different treatments at the 5% level by Fisher’s protected LSD (vertical comparison); values followed by the same capital letters are not significantly different among different treatments (vertical comparison) or among different experimental locations/years (horizontal comparison) at the 5% level by Fisher’s protected LSD. ANOVA are the probabilities (p values) of the source of variation. 1 Grain yields of intercropped maize and peanut were calculated based on total land areas occupied by the whole intercropping system comprised of the two crop species. 2 Partial LERs of mono-cropped maize or peanut were the proportions of land areas occupied by corresponding maize or peanut in the whole intercropping system; partial LERs of intercropped maize or peanut were calculated by grain yields of intercropped maize or peanut dividing by grain yields of mono-cropped maize at the maize inter-plant distance of 27 cm or mono-cropped peanut.
Table 3. Pearson correlation coefficients between grain/biomass yields and maize densities in intercropping, and between partial/total land equivalent ratios (LERs) of grain/biomass yields and maize densities in intercropping in each experimental location (n = 15) and across all three locations/years (n = 45).
Year/LocationMaizePeanutLERs
Grain YieldsBiomass YIeldsPartial LERs of Grain YieldsPartial LERs of Biomass YieldsGrain YieldsBiomass YieldsPartial LERs of Grain YieldsPartial LERs of Biomass YieldsLERs of Grain YieldsLERs of Biomass Yields
2015-Lichengns0.531 *ns0.615 *−0.828 **−0.722 **−0.810 **−0.707 **nsns
2016-Zhangqiunsnsnsns−0.923 **−0.953 **−0.937 **−0.937 **nsns
2017-Dongying0.701 **nsnsns−0.609 *−0.623 *−0.565 *−0.586 *nsns
Across all three locations0.311 *0.434 **0.321 *0.413 **−0.508 **−0.547 **−0.578 **−0.605 **nsns
“ns”, “*” and “**” indicate not significant, and significant correlations at p ≤ 0.05 and p ≤ 0.01, respectively.
Table 4. Biomass yields and partial land equivalent ratios (LERs) of maize and peanut and corresponding LERs of the whole intercropping system as affected by different cropping systems and maize densities across different locations/years.
Cropping SystemInter-Plant Distance (cm)Maize Density (plant/ha)Biomass Yields 1 (kg/ha)Partial LERs 2
2015-Licheng2016-Zhangqiu2017-DongyingMeanANOVA2015-Licheng2016-Zhangqiu2017-DongyingMeanANOVA
Maize
Monoculture2761,72813,914.6ab13,648.5a15,495.3a14,352.8ALocation (L) = 0.03210.6c0.6b0.6c0.6C
Intercropping2737,03711,295.6b9479.7b10,209.5c10,328.3CTreatment (T) = 0.00490.81bc0.70ab0.67bc0.73BCL = 0.0330
2050,00012,534.6b11,866.8ab11,009.4bc11,803.6BCL × T = 0.76960.90b0.87ab0.72abc0.83ABT = 0.0003
1662,50013,862.5ab10,785.4ab13,506.3ab12,718.1AB 0.99ab0.79ab0.89a0.89AL × T = 0.9001
1376,92313,617.7ab11,479.4ab12,779.8abc12,625.6AB 0.97ab0.85ab0.85ab0.89A
10100,00015,930.3a12,343.3ab12,778.1abc13,683.9AB 1.14a0.93a0.85ab0.97A
Mean 13,525.9A11,600.5B12,629.7AB12,585.4 0.90A0.79B0.76B0.82
Peanut
Monoculture2761,7285212.6a10,710.1a7164.3a7695.7AL < 0.00010.4a0.4a0.4a0.4A
Intercropping2737,0371018.9b2140.5b1733.6bc1631.0BT < 0.00010.20b0.20b0.24b0.21BL < 0.0001
2050,000841.4b1733.7bc2095.0b1556.7BL × T < 0.00010.16bc0.16c0.30b0.21BT < 0.0001
1662,500719.6b1587.1bc1174.3c1160.4C 0.14cd0.15c0.17c0.15CL × T = 0.0073
1376,923594.8b1273.6cd1198.1c1022.2C 0.12d0.12d0.17c0.13CD
10100,000601.8b846.7d1176.3c874.9C 0.12d0.08e0.16c0.12D
Mean 1498.2C3048.6A2423.6B2323.5 0.19B0.19B0.24A0.20
LERs
Monoculture2761,7281.00b1.00a1.00a1.00A
Intercropping2737,0371.01b0.90a0.91a0.94AL = 0.1024
2050,0001.06ab1.03a1.02a1.04AT = 0.4956
1662,5001.13ab0.94a1.06a1.04AL × T = 0.9625
1376,9231.09ab0.97a1.02a1.02A
10100,0001.26a1.01a1.01a1.09A
Mean 1.09A0.98B1.00AB1.02
Values are means of three replicates. Values followed by the same lowercase letters at the same experimental location are not significantly different among different treatments at the 5% level by Fisher’s protected LSD (vertical comparison); values followed by the same capital letters are not significantly different among different treatments (vertical comparison) or among different experimental locations/years (horizontal comparison) at the 5% level by Fisher’s protected LSD. ANOVA are the probabilities (p values) of the source of variation. 1 Biomass yields of intercropped maize and peanut were calculated based on total land areas occupied by the whole intercropping system comprised of the two crop species; biomass yields of maize were only the above-ground biomass and those of peanut included the above-ground biomass and also the below-ground pods. 2 Partial LERs of mono-cropped maize or peanut were the proportions of land areas occupied by corresponding maize or peanut in the whole intercropping system; partial LERs of intercropped maize or peanut were calculated by biomass yields of intercropped maize or peanut dividing by biomass yields of mono-cropped maize at the maize inter-plant distance of 27 cm or mono-cropped peanut.
Table 5. Maize plant and ear traits as affected by different cropping systems and maize densities across different locations/years.
Cropping SystemInter-Plant Distance (cm)Maize Density (plant/ha)2015-Licheng2016-Zhangqiu2017-DongyingMeanANOVA2015-Licheng2016-Zhangqiu2017-DongyingMeanANOVA
Plant Height (cm)Ear Height (cm)
Monoculture2761,728272.3ab273.8c250.4a265.5ALocation (L) < 0.0001119.4bc106.8b104.2a110.1AL < 0.0001
Intercropping2737,037262.6b276.6bc251.9a263.7ATreatment (T) = 0.8338111.8c115.6ab100.0a109.1AT = 0.3131
2050,000273.3ab284.0a243.9a267.1AL × T = 0.5686114.8c119.9a95.4a110.0AL × T = 0.0481
1662,500274.2a281.4ab247.8a267.8A 119.5bc113.9ab97.3a110.2A
1376,923269.4ab279.7abc255.1a268.1A 123.9ab114.6ab104.4a114.3A
10100,000274.8a284.0a246.9a268.6A 132.3a110.4ab102.7a115.1A
Mean 271.1B279.9A249.3C266.8 120.3A113.5B100.7C111.5
Stem thickness (mm)Ear length (cm)
Monoculture2761,72818.2a19.9a21.5ab19.9AL < 0.000120.4b-16.4bc18.4BCL < 0.0001
Intercropping2737,03719.7a21.0ab21.2ab20.7AT < 0.000122.6a-18.3a20.5AT < 0.0001
2050,00018.1ab20.2a22.0a20.1AL × T < 0.550021.0ab-17.3ab19.2ABL × T = 0.0087
1662,50016.4bc17.9b21.0ab18.5B 19.2bc-16.3bc17.7C
1376,92315.9c17.9b20.1ab18.0BC 17.5cd-16.7bc17.1CD
10100,00014.9c17.2b19.6b17.2C 15.7d-15.9c15.8D
Mean 17.2C19.0B20.9A19.0 19.4A-16.8B18.1
Bald tip length (cm)Ear diameter (mm)
Monoculture2761,7281.9c-0.46a1.2CL < 0.000150.6b-49.1ab49.8ABL = 0.5245
Intercropping2737,0371.8c-0.77a1.3CT = 0.000452.8a-49.6a51.2AT < 0.0001
2050,0002.3bc-0.56a1.4BCL × T = 0.001050.7b-49.9a50.3ABL × T = 0.0381
1662,5002.8ab-0.72a1.8AB 48.9b-48.4ab48.7BC
1376,9233.3a-0.57a1.9A 46.3c-49.0ab47.6CD
10100,0003.5a-0.73a2.1A 45.3c-46.6b45.9D
Mean 2.6A-0.6B1.6 49.1A-48.8A48.9
Ear axis diameter (mm)Rows per ear
Monoculture2761,72825.5b-27.3ab26.4BCL < 0.000114.8a-15.1a14.9AL = 0.0020
Intercropping2737,03727.7a-28.5ab28.1AT = 0.000114.5ab-14.3a14.4AT = 0.0231
2050,00025.7b-29.1a27.4ABL × T = 0.036514.5ab-14.4a14.5AL × T = 0.0793
1662,50024.6b-27.4ab26.0C 13.6ab-15.2a14.4A
1376,92324.1b-29.1a26.6BC 13.0bc-15.2a14.1A
10100,00022.3c-26.4b24.3D 12.0c-14.1a13.1B
Mean 25.0B-28.0A26.5 13.7B-14.7A14.2
Kernels per rowHundred grain weight (g)
Monoculture2761,72836.1ab-31.3a33.7ABCL = 0.005630.5b35.6b35.6ab33.9BL < 0.0001
Intercropping2737,03739.5a-33.6a36.5AT = 0.007235.4a37.8a38.6ab37.3AT = 0.0001
2050,00037.5a-32.6a35.1ABL × T = 0.072733.1ab36.4b38.8a36.1AL × T = 0.9020
1662,50034.5ab-31.2a32.8BCD 30.2b33.9c36.4ab33.5B
1376,92331.8bc-31.9a31.9CD 30.2b33.1c34.5b32.6B
10100,00029.0c-31.6a30.3D 31.4b32.9c35.1ab33.1B
Mean 34.7A-32.0B33.4 31.8C35.0B36.5A34.4
Harvest index
Monoculture2761,7280.63a0.60a0.58a0.61AL = 0.0518
Intercropping2737,0370.63a0.61a0.60a0.61AT = 0.0118
2050,0000.63a0.61a0.59a0.61AL × T = 0.4839
1662,5000.61a0.56a0.52a0.56B
1376,9230.60a0.59a0.59a0.60AB
10100,0000.54b0.56a0.58a0.56B
Mean 0.61A0.59AB0.58B0.59
Values are means of three replicates. Values followed by the same lowercase letters at the same experimental location are not significantly different among different treatments at the 5% level by Fisher’s protected LSD (vertical comparison); values followed by the same capital letters are not significantly different among different treatments (vertical comparison) or among different experimental locations/years (horizontal comparison) at the 5% level by Fisher’s protected LSD. ANOVA are the probabilities (p values) of the source of variation.
Table 6. Peanut plant, pod and root traits (harvesting two adjacent rows in 1.0 m length in Licheng and Zhangqiu, and 10 plants in Dongying) as affected by different cropping systems and maize densities across different locations/years.
Cropping SystemInter-Plant Distance (cm)Maize Density (plant/ha)2015-Licheng2016-Zhangqiu2017-DongyingMeanANOVA2015-Licheng2016-Zhangqiu2017-DongyingMeanANOVA
The Main Stem Height (cm)Branching Number
Monoculture2761,72857.4a63.4b47.7ab56.1BLocation (L) < 0.00015.9a8.8a9.6a8.1AL < 0.0001
Intercropping2737,03760.0a65.5ab53.8a59.8ATreatment (T) = 0.25335.3a8.2ab9.6a7.7ABT = 0.1146
2050,00056.8a67.0ab47.4b57.0ABL × T = 0.34975.6a8.0b9.5a7.7ABL × T = 0.8135
1662,50059.9a66.5ab45.5b57.3AB 5.2a8.2ab9.0a7.5AB
1376,92356.3a68.6a49.8ab58.2AB 5.0a8.4ab8.4a7.3B
10100,00057.0a65.0ab47.2b56.4B 4.9a7.9b9.1a7.3B
Mean 57.9B66.0A48.6C57.5 5.3C8.2B9.2A7.6
Pod number per plantHundred pod weight (g)
Monoculture2761,7286.3a14.2a17.2a12.6AL < 0.0001136.6a116.1a129.0a127.2AL < 0.0001
Intercropping2737,0372.9b3.6b6.0bc4.2BCT < 0.0001111.5a106.9a127.6a115.3AT < 0.0001
2050,0002.2bc3.9b8.0b4.7BL × T = 0.0001105.6ab70.4b120.0ab98.6BL × T = 0.0015
1662,5001.8c3.4bc5.1c3.4BCD 69.1c59.4b107.7ab78.7C
1376,9231.4c2.6bc5.3bc3.1CD 75.2bc29.9c101.7b68.9CD
10100,0001.8c1.6c3.9c2.4D 54.2c28.1c110.7ab64.3D
Mean 2.7C4.9B7.6A5.1 92.1B68.4C116.1A92.2
Double kernel rate (%) 1Kernel rate per pod (%) 2
Monoculture2761,72858.1a43.9a54.0a52.0AL < 0.000170.8a69.6bc68.3b70.0BCL = 0.9957
Intercropping2737,03752.5ab39.4a55.5a49.1ABT < 0.000173.2a72.8a72.4a72.8AT = 0.0414
2050,00052.5ab25.6b52.6ab43.6ABL × T = 0.036673.5a72.1ab70.7ab72.1ABL × T = 0.5815
1662,50031.7b27.4b43.2bc34.1CD 70.2a71.6abc72.9a71.6ABC
1376,92335.9ab8.4c41.1c28.5D 72.0a71.6abc71.2ab71.6ABC
10100,00057.4ab12.8c53.8a41.3BC 66.7a69.0c71.3ab69.0C
Mean 48.0A26.3B50.0A41.4 71.1A71.1A71.1A71.1
Kernel harvest index 3Root dry weight (g)
Monoculture2761,7280.39a0.27a0.44a0.37AL < 0.000132.8a-18.2a25.5AL < 0.0001
Intercropping2737,0370.32a0.15b0.33b0.27BT < 0.000127.7ab-14.2ab21.0BT = 0.0002
2050,0000.28ab0.13bc0.35b0.25BL × T = 0.266521.0bc-13.6bc17.3BCL × T = 0.4539
1662,5000.17c0.11c0.29b0.19C 22.2bc-10.5bc16.3C
1376,9230.18bc0.05d0.30b0.18CD 19.8bc-11.2bc15.5C
10100,0000.13c0.04d0.27b0.15D 19.5c-9.9c14.7C
Mean 0.25B0.12C0.33A0.23 23.8A 13.0B18.4
Values are means of three replicates. Values followed by the same lowercase letters at the same experimental location are not significantly different among different treatments at the 5% level by Fisher’s protected LSD (vertical comparison); values followed by the same capital letters are not significantly different among different treatments (vertical comparison) or among different experimental locations/years (horizontal comparison) at the 5% level by Fisher’s protected LSD. ANOVA are the probabilities (p values) of the source of variation. 1 Double kernel rate (%) indicated the number of pods with double kernels as a percentage of the total number of pods. 2 Kernel rate per pod (%) indicated the proportion of kernel weights to pod (kernel + shell) weights of peanut. 3 Kernel harvest index indicated the proportion of the kernel weight to the sum weights of pods, stems and leaves of peanut.
Table 7. Community stability of productivity (grain/biomass yields and/or partial/total land equivalent ratios (LERs)) as affected by different cropping systems and maize densities in the maize/peanut intercropping system.
Cropping SystemInter-Plant Distance (cm)Maize Density (plant/ha)MaizePeanutLERs
Grain YieldsBiomass YieldsPartial LERs-GrainPartial LERs-BiomassGrain YieldsBiomass YieldsPartial LERs-GrainPartial LERs-BiomassLERs-GrainLERs-Biomass
Monoculture2761,72821.2A15.6A--4.4A2.7A----
Intercropping2737,03712.8AB10.9A17.8A13.8A3.1AB3.1A3.8A7.6A18.1A13.7B
2050,00014.2AB32.9A13.0A11.6A1.5B2.4A2.1AB2.9B13.5AB30.1A
1662,5006.0B4.6A6.2A4.9A2.9AB2.4A2.9AB4.3B5.1B5.6B
1376,9237.8B6.7A8.0A8.4A1.1B2.7A1.4B4.8AB8.7B11.2B
10100,0008.1B8.3A8.0A7.9A0.95B2.9A1.1B2.7B7.1B9.3B
Values are means of three replicates. Values followed by the same capital letters are not significantly different among different treatments (vertical comparison) at the 5% level by Fisher’s protected LSD.

