Article

Phenolic Composition and Antioxidant Activities of Soybean (Glycine max (L.) Merr.) Plant during Growth Cycle

1
Institute of Sciences of Food Production, National Research Council, 10095 Grugliasco, Italy
2
Institute of Animal Reproduction and Food Research, Polish Academy of Sciences, Tuwima Street 10, 10-748 Olsztyn, Poland
3
Department of Veterinary Sciences, University of Turin, 10095 Grugliasco, Italy
*
Author to whom correspondence should be addressed.
Submission received: 5 March 2019 / Revised: 18 March 2019 / Accepted: 21 March 2019 / Published: 23 March 2019

Abstract

:
It is important to identify the growth stage at which the plant has the maximum antioxidant properties for the production of bioactive compounds from crops or agricultural by-products or for forage as a possible source of antioxidants in livestock. Therefore, we investigated the phenolic composition and antioxidant capacity of the aerial part of soybean at seven stages classified as vegetative stages (V5 and V6) and reproductive stages (R1, R2, R3, R4, and R5). Aqueous-methanol extracts were evaluated for their total phenolic content (TPC), ferric-reducing antioxidant power (FRAP), Trolox equivalent antioxidant capacity (TEAC), antioxidant activity as determined by photochemiluminescence assay (PCL-ACL), Fe2+ chelating ability, and antiradical activity against DPPH. The extracts with the highest TPC content were obtained at stages V6 and R5. The phenolic compounds profile, as determined by DAD-HPLC, was characterized by 19 compounds, that differed significantly by growth stage (p < 0.05). Antioxidant tests showed significant differences among stages (p < 0.05). The lowest TEAC value was found for the R2 stage and the highest values for the R3 and R1 stages. FRAP values ranged from 623 to 780 μmol Fe2+/g extract. PCL-ACL values ranged from 516 to 560 μmol Trolox eq./g extract; Fe2+ chelation ability ranged from 36.5 to 51.7%. The highest antiradical activity against DPPH was found in the extract from the V5 stage, which had the lowest EC50 value. The extracts of soybean plant can be used in pharmacy for the production of nutraceuticals by virtue of their good antioxidant activity and content of flavonols and other bioactive constituents.

1. Introduction

Soybean (Glycine max (L.) Merr.) is one of the most important plant proteins sources consumed by humans and animals. It is attracting growing interest as a source of high-protein forage in Europe [1], North America [2], South Asia [3], and Japan [4]. The few studies that have examined the antioxidant activities and phenolic profiles of soybean seed found that soybean varieties differ in their antioxidant properties, total phenolic contents, anthocyanin and flavonoid levels [5,6,7,8,9,10,11]. It has also been demonstrated that health benefits can be derived from the antioxidant activities of some varieties of soybean, especially in their seed coat [12,13,14] or hulls, as alternative source of bioactive compounds [15].
There is abundant research on the phenolic composition and antioxidant activities of soybean seed and its by-products (e.g., soy milk, tofu, and fermented products) for the prevention of certain cancers, osteoporosis, chronic renal disease, coronary heart disease, and for their anti-atherosclerotic activity [6,12,16]. It has been reported that isoflavones (e.g., genistein and daidzein) in soybean seeds may have either weak antiestrogenic or proestrogenic effects [17]. Isoflavones (daidzein and genistein) are believed responsible for these observed health benefits. The isoflavone content has been determined in a variety of soy-based foods and especially in non-fermented soy foods, where isoflavones are present mainly as β-glycoside conjugates (genistin and daidzin) [18]. Previous research found that the flavonoids in soy leaves are mainly kaempferol glycosides with only trace amounts of malonyl-genistin and genistin, whereas those in soybean are mainly isoflavone glycosides and derivatives with malonyl-genistin, which is the most abundant, followed by malonyl-glycitin, genistin, daidzin, daidzein, genistein, and glycitin in decreasing order [19]. Soybean seed is rich in glycosides (genistin, daidzin, glycitin) and malonyl-glycosides (malonyl-glycitin and malonyl-genistin). These glycosides possess similar antioxidant activities, as determined by FRAP and DPPH assays, and have weaker antioxidant activities, as determined by low-density lipoprotein oxidation assay, than their corresponding aglycones (genistein and daidzein) [6]. Bennett et al. [20] reported that genistein, daidzein, and glycitein are the main isoflavones of soybean seeds, can be synthesized by the phenylpropanoid pathway, and then stored in vacuoles as conjugates. This is influenced by environmental conditions during seed fill and it is cultivar-dependent [21,22].
The impact of elevated thermal stress on isoflavone and tocopherol accumulation in soybean seeds has been studied at specific growth stages (none, pre-emergence, vegetative, early reproductive (R1–R4), late-reproductive (R5–R8)) [23]. It was demonstrated that high thermal stress reduces total isoflavone concentration compared to control seeds. Isoflavone response to thermal stress occurred at all growth stages and was greatest when stress occurred during stages R5–R8. The contribution of glycitein and daidzein to total isoflavone content was increased in comparison with the concentrations found in the control soybean seeds when plants were subjected to stress at all growth stages and also at stages R5–R8. Tsukamoto et al. [24] found that the isoflavone content of soybean varieties significantly decreased in the seeds harvested after growing at high temperatures, whereas at cool temperatures it was increased during the onset and duration of seed fill.
The content of tocopherol, isoflavone, TPC, total antioxidative capacity, and free radical scavenging activity have been determined in immature soybean seeds harvested at three reproductive stages (R5, R6 and R7) [25]. There was a reduction in TPC, total antioxidant capacity, and free radical-scavenging activity and an increase in content of isoflavone isomers and tocopherol in late-harvested seeds. The major form of isoflavone at all reproductive stages was genistein, which increased from 84 to 808 μg/g DM at R4 stage and at complete maturity, respectively. At the same reproductive stages, DPPH scavenging activity, FRAP, and TPC decreased from 59 to 44%, from 55 to 21 mmol/kg DM, and from 3.1 to 1.3 mg of GAE/g, respectively. Kumar et al. [26] assessed isoflavones, vitamin C, TPC, FRAP, DPPH radical-scavenging activity in soybean genotypes with varying seed coat color (yellow, green, and black). The authors concluded that soybean with green or yellow seed coat had lower free radical-scavenging activity than black soybean, while black and green soybean exhibited comparatively higher FRAP values than yellow soybean.
Malenčić et al. [27] evaluated the TPC and antioxidant ability of the seeds of 20 soybean hybrids and found a positive linear correlation between antioxidant activity and contents of total tannins, proanthocyanidins, and TPC. They observed higher levels of all polyphenol classes in the extracts of soybean hybrids with the highest antioxidant activity. Moreover, they reported that because the majority of the single-cross hybrids were poor in tannins, they could be recommended as a good source for ensiled livestock feed. Whent et al. [28] studied the antioxidant properties and chemical composition of eight soybean cultivars grown in different locations and showed that an antioxidant property may respond to individual environmental factors differently. No difference in TPC (range, 1.2–2.1 mg of GAE/g of whole soybean) was observed in any soybean cultivars grown under three different environmental conditions. Total isoflavones in the soybean samples ranged from 0.37 to 0.90 μmol/g of soybean among all genotypes grown in the different environments. The concentration of daidzein, genistein, and glycitein in all soybean samples ranged from 29.3 to 107.7 μg/g, from 15.3 to 83.0 μg/g, and from 25.8 to 95.8 μg/g, respectively.
Because the polyphenolic contents and antioxidant capacities of crops, including perilla [29], quinoa [30] and safflower [31] may also vary in the whole plant during growth, it is important to identify the growth stage at which the plant has the maximum antioxidant properties for the production of bioactive compounds from crops or agricultural by-products or for forage as a possible source of antioxidants in livestock. The feeding value of soybean forage and the effects of plant ageing on chemical composition, gross energy, in vitro true digestibility, neutral detergent fiber digestibility, and fatty acid profile have been documented in the literature [1]. The innovative aspect of the present study was to characterize the antioxidant activities and phenolic composition of the soybean plant during its growth cycle, because, to the best of our knowledge, no research has been reported in literature about the change of these parameters during plant ageing.

2. Materials and Methods

2.1. Chemicals

Ferrous chloride, sodium persulfate, the Folin-Ciocalteau’s phenol reagent, catechin, caffeic acid, rutin, quercetin, 2,2′-azinobis-(3-ethylbenzothiazoline-6-sulfonic acid) (ABTS), 2,2-diphenyl-1-picrylhydrazyl (DPPH), 2,4,6-tri(2-pyridyl)-s-triazine, and 6-hydroxy-2,5,7,8-tetramethyl-chroman-2-carboxylic acid (Trolox) were obtained from Sigma-Aldrich (St. Louis, MO, USA). Daidzin, daidzein, genistein, and kaempferol were obtained from Extrasynthese (Genay, France). Methanol, acetonitrile, and all other chemicals were acquired from Avantor Performance Materials (Gliwice, Poland).

2.2. Plant Material and Growth Conditions

Soybean seeds of the cultivar Eiko, with a high content of crude protein (436 g/kg), were purchased from Sipcam Italia S.p.A. (Pero, Milan, Italy). The study was carried out at the Department of Agriculture, Forestry, and Food Sciences of the University of Turin. Field trials were carried out in Grugliasco, Piedmont, Italy (45°03′57.9″ N 7°35′36.9″ E, 293 m a.s.l.) in sandy soil, low in organic matter with moderately alkaline pH, and taxonomically classified as entisol according to the United States Department of Agriculture soil classification system [32]. The climate of the study site is temperate sub-continental, characterized by two main rainy periods in spring and autumn. During the growing season, the total precipitation varies from 76.2 mm/month (May) to 139.0 mm/month (July), and the mean relative humidity and mean temperature is 68.6% and 20.3 °C, respectively. The soybean stands were seeded in the spring in an experimental field (4 m wide and 14 m long). Sampling was performed without any borders, in order to obtain representative samples not affected by border effects. No fertilizers or irrigation were applied after sowing. The herbage samples were collected with edging shears (0.1 m cutting width) at seven progressive stages of development classified as vegetative stages (V5 and V6) and reproductive stages (R1, R2, R3, R4, and R5), respectively [33]. Two sample replicates for each stage were cut to a 1–2 cm stubble height from two subplots measuring 4 m2 each. Sampling was done in the morning after dew had evaporated and was never carried out on rainy days.

2.3. Extraction

After milling, the lyophilized plants were mixed with 80% (v/v) methanol at a ratio of 1:10 (w/v). Extractions were performed in tightly closed glass vessels placed in a shaking water bath (SW22, Julabo, Seelbach, Germany) at 65 °C for 15 min and then filtered. Extraction was repeated from the precipitates twice more. The supernatants were then combined for each sample, and methanol was evaporated under vacuum using a rotary evaporator at 50 °C (Rotavapor R-200, Büchi Labortechnik, Flawil, Switzerland). The remaining water was removed by lyophilization (Lyph Lock 6, Labconco, Kansas City, MO, USA). Mass balance was carried out to calculate yield (%) of extraction.

2.4. Determination of Total Phenolic Content
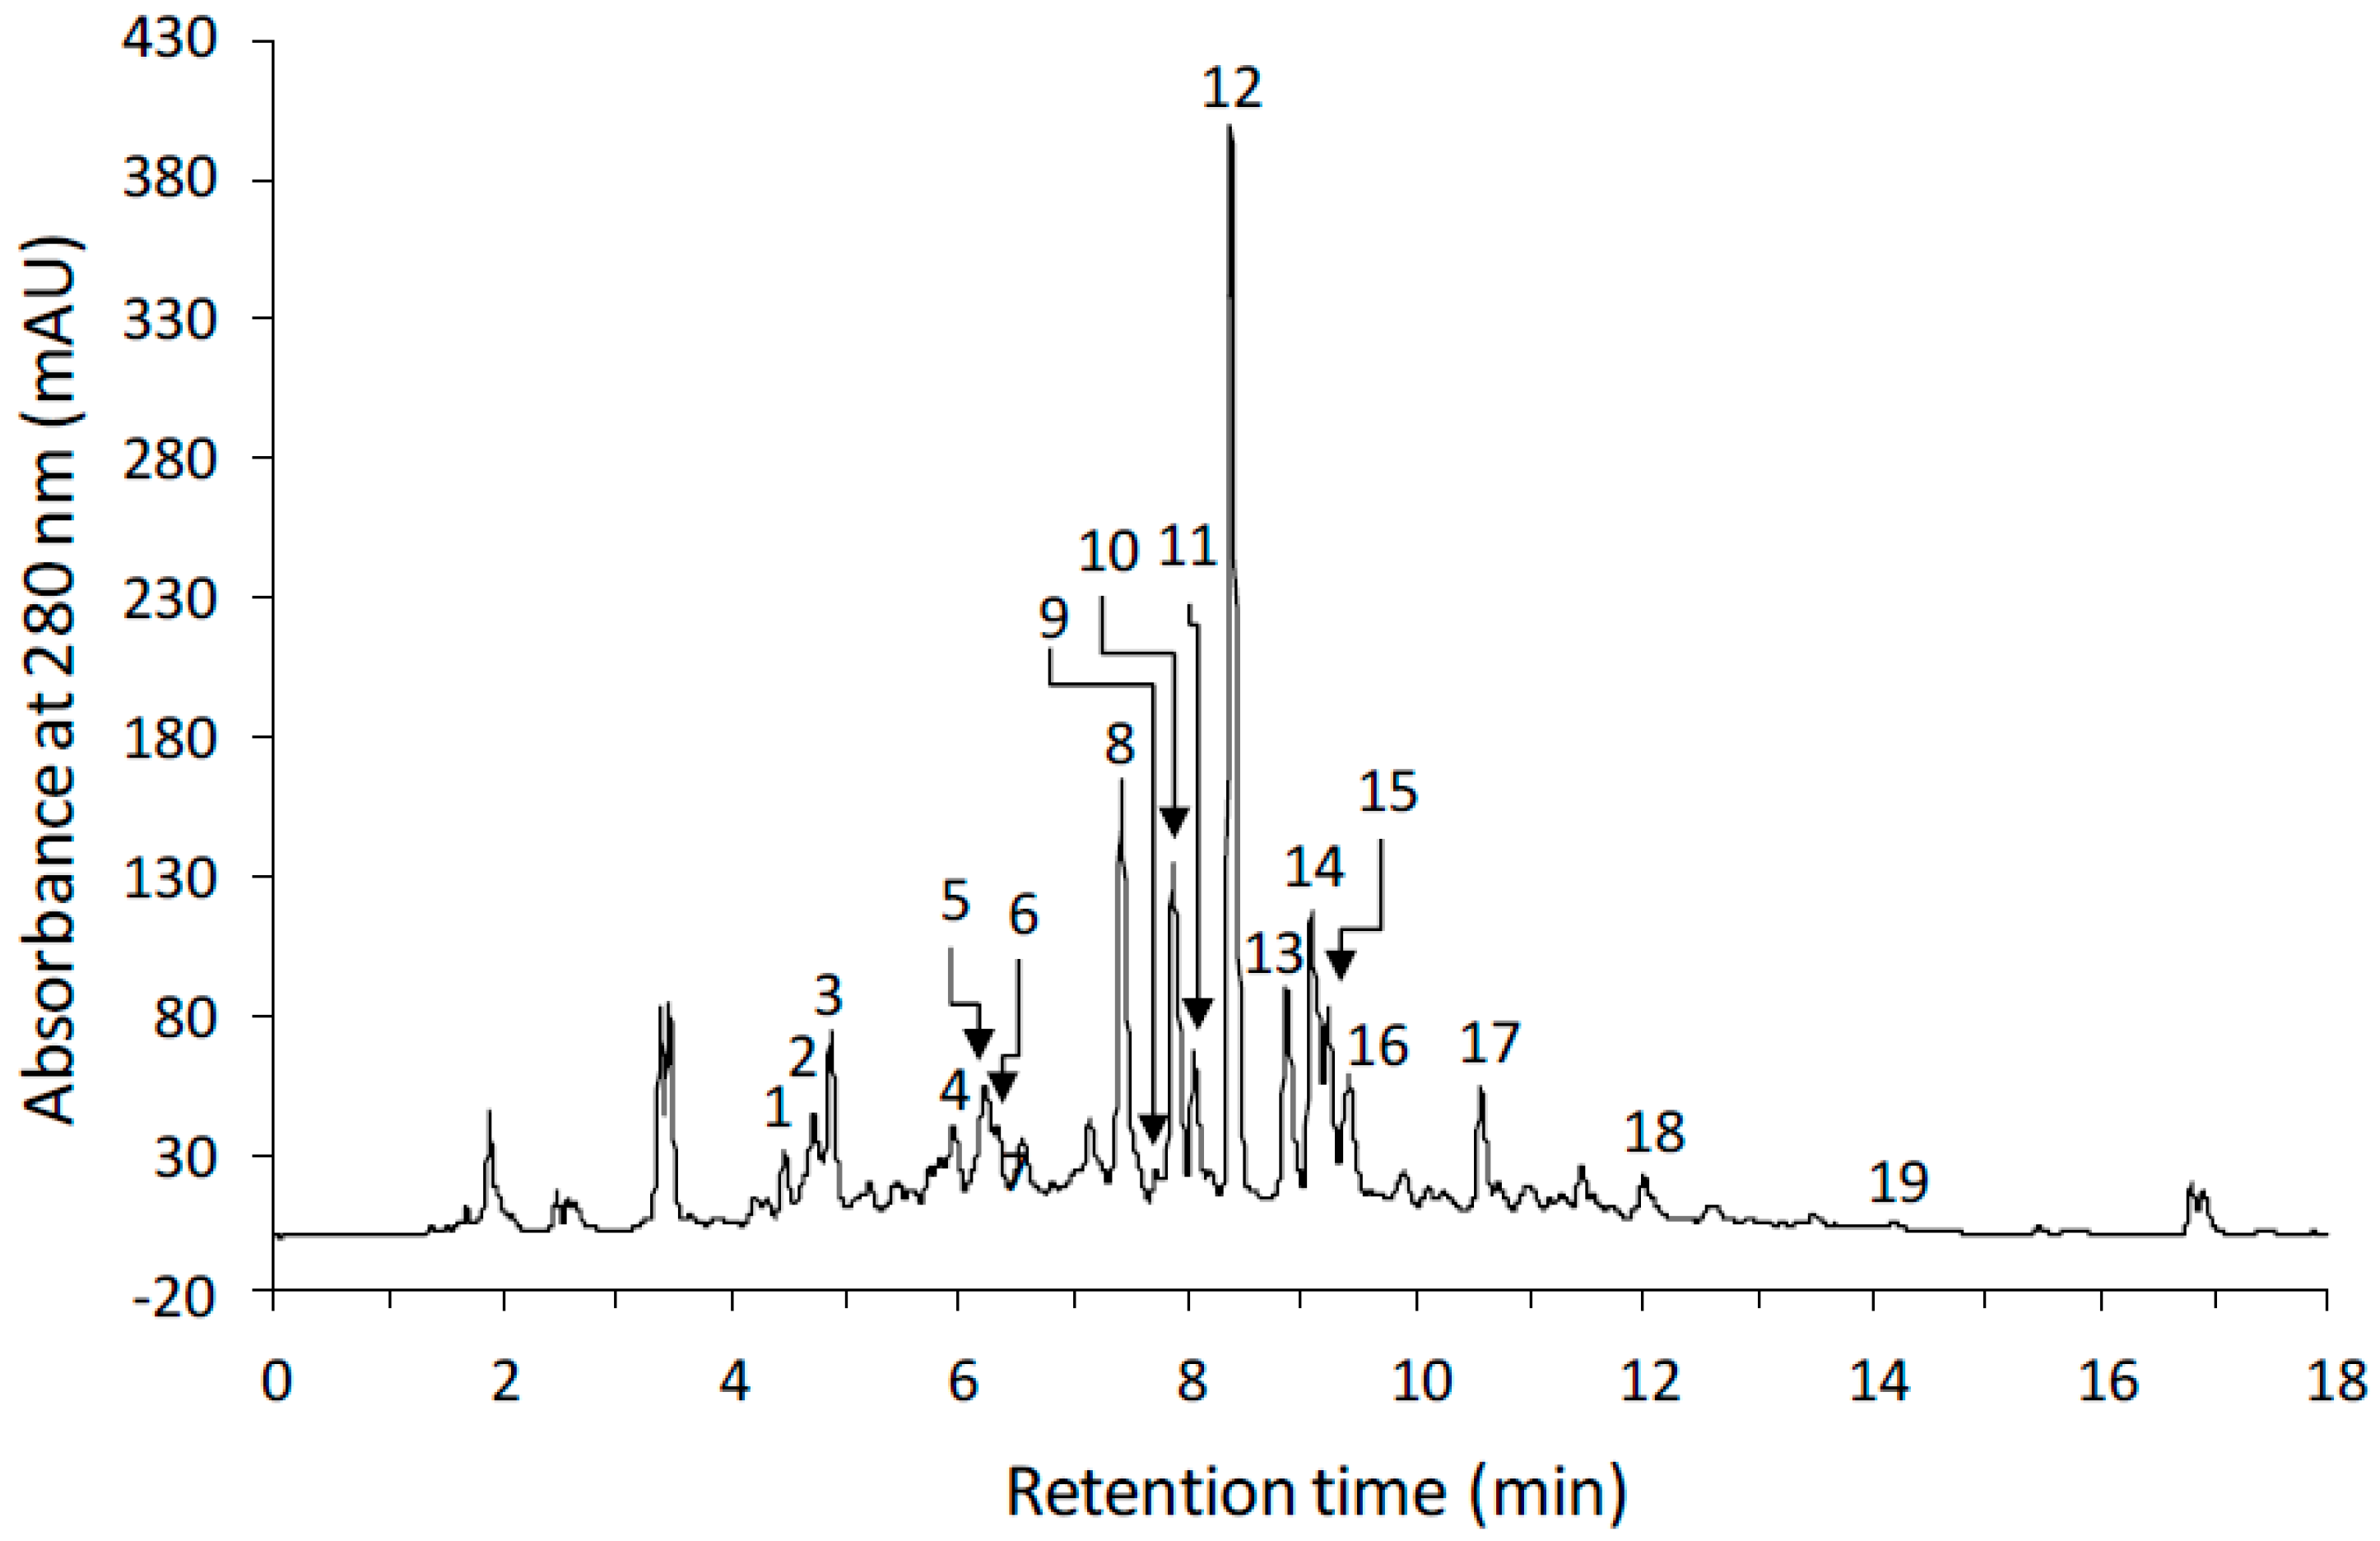
Colorimetric reaction with Folin-Ciocalteu’s reagent (FCR) was performed to determine the content of phenolic compounds in soybean samples [34]. The reaction mixtures consisted of 0.25 mL of samples dissolved in methanol (1.25 mg/mL), 0.25 mL of FCR, 0.5 mL of saturated solution of Na2CO3, and 4 mL of water and were left to stand in the dark for 25 min. After centrifugation (MPW-350R, MPW Med. Instruments, Warsaw, Poland) for 5 min at 5000× g, absorbance of the supernatants was recorded at λ = 725 nm (DU-7500 spectrophotometer, Beckman Instruments, Fullerton, CA, USA). TPC results were calculated on the basis of the calibration curve for catechin and were expressed as equivalents of standard per g of extract or per g of plant fresh matter.

2.5. HPLC Analysis

Phenolic compounds of soybean extracts were separated using a high-performance liquid chromatography (HPLC) Shimadzu system (Shimadzu, Kyoto, Japan), which consisted of a CBM-20A controller, a DGU-20A5R degassing unit, two LC-30AD pumps, a SIL-30AC autosampler, an SPD-M30A diode array detector, and a CTO-20AC column oven [35]. Portions of 10 μL of extract solutions in 80% (v/v) methanol were injected into a Luna C8(2) column (4.6 × 150 mm, particle size 3 μm, Phenomenex, Torrance, CA, USA). The compounds were eluted in linear gradient system of solvent A (acetonitrile-water-trifluoroacetic acid, 5:95:0.1, v/v/v) and B (acetonitrile-trifluoroacetic acid, 100:0.1, v/v): 0–18 min, 0–60% B. The flow rate was 1 mL/min and the oven temperature 25°C. Detection was carried out by scanning over a wavelength range from 200 to 600 nm. The contents of individual phenolic compounds were expressed on the basis of the calibration curves of the corresponding standards or structurally related substances.

2.6. Trolox Equivalent Antioxidant Capacity

The TEAC of soybean samples was determined according to a previously described method [36]. Trolox was used as standard; the results were expressed as μmol Trolox equivalents per g of extract or per g of fresh matter of plant.

2.7. Ferric-Reducing Antioxidant Power

The FRAP reagent was prepared using a previously described method [37]. FRAP results were expressed as μmol Fe2+ equivalents per g of extract or per g of fresh matter using the calibration curve for FeSO4.

2.8. Photochemiluminescence Assay

The scavenging activity of soybean samples was evaluated by a photochemiluminescence (PCL-ACL) method [38] in which superoxide radical anions (O2•−) are generated from luminol. Soybean extracts were dissolved in methanol (0.25 mg/mL). The reactions were carried out using kits for the determination of antioxidant capacity of lipid-soluble substances (Analytik Jena, Jena, Germany) mixing 2.3 mL of methanol (reagent 1), 200 μL of buffer solution (reagent 2), 25 μL of luminol (reagent 3), and 10 μL of sample. Measurement was performed on a Photochem device with PCLsoft software (Analytik Jena). Trolox was used to prepare the calibration curve. The results are expressed as µmol of Trolox equivalents per g of extract or per g of fresh matter of plant.

2.9. Fe2+ Chelation Ability

Ferrous ion chelating ability of soybean extracts was determined by a method with ferrozine [39], that was modified for reaction on multi-well plates [40]. Briefly, 200 μL of aqueous solution of extract (0.25 mg/mL) and 20 μL of 0.4 mM FeCl2 × 4H2O were pipetted into each well. Added to this were 40 μL of 5 mM ferrozine; after 10 min absorbance was read at λ = 562 nm using an Infinite M1000 microplate reader (Tecan, Männedorf, Switzerland). Chelating ability is expressed as percentage of Fe2+ bound.

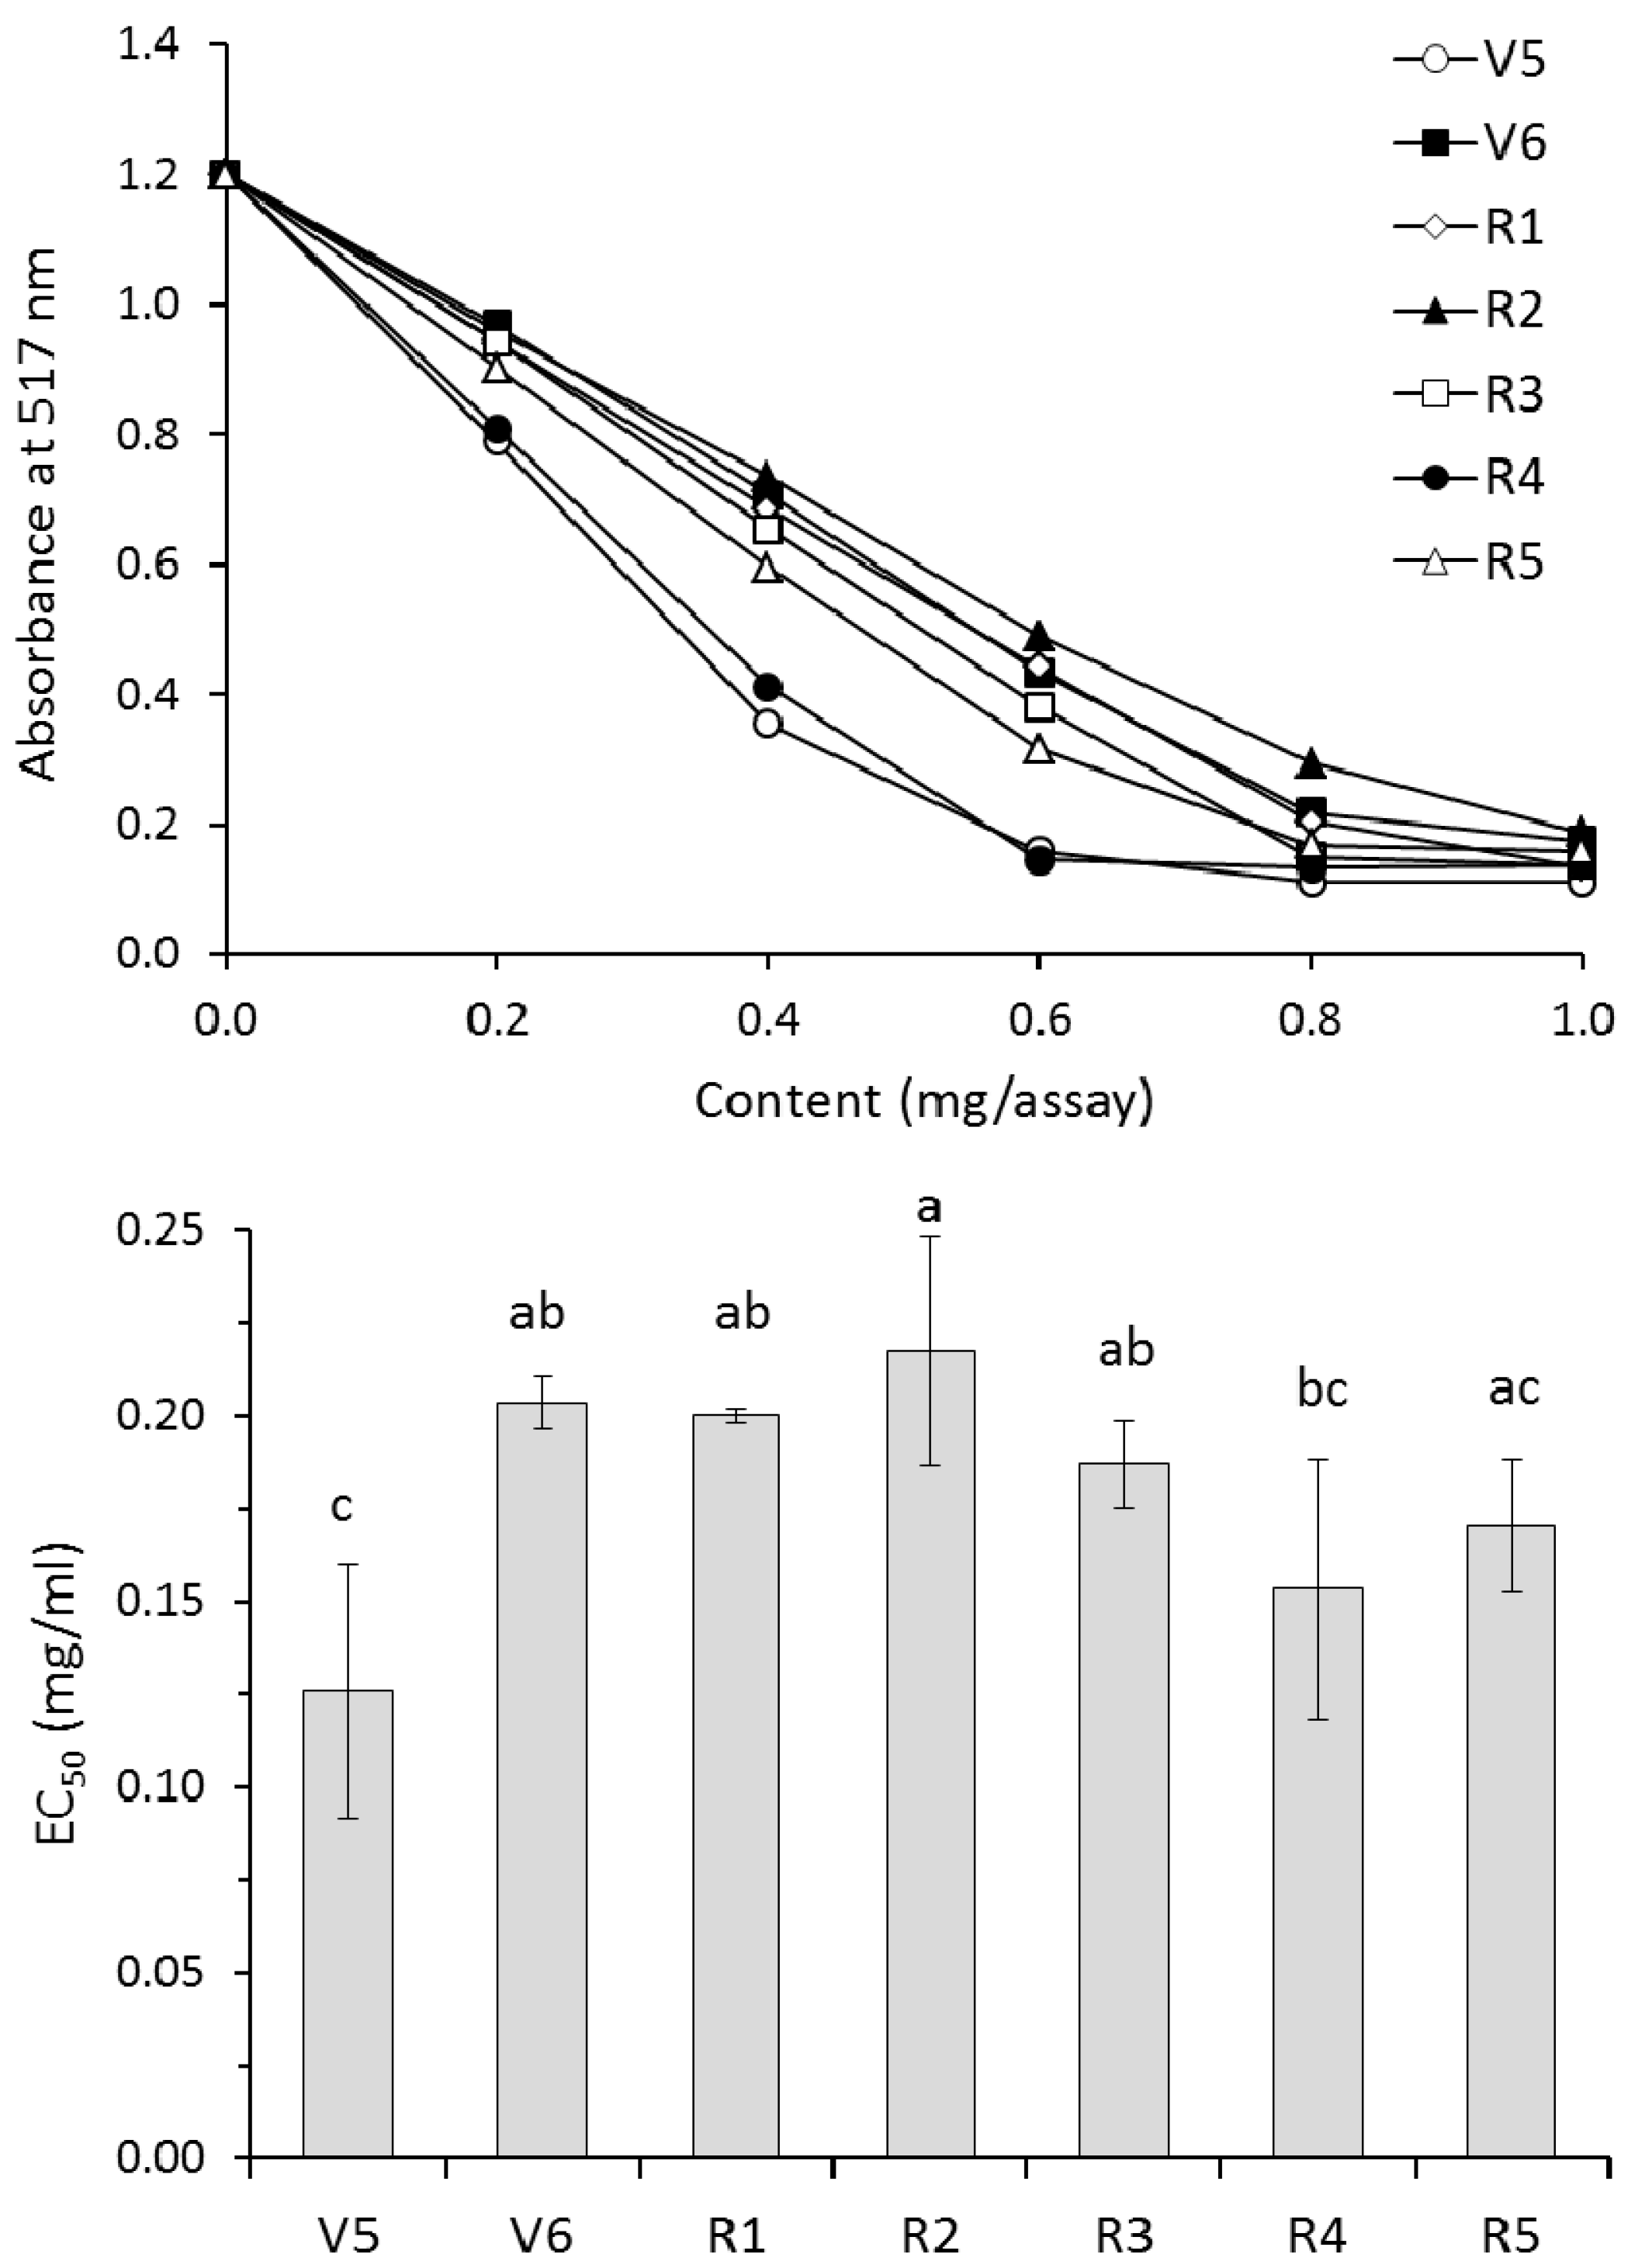
2.10. Scavenging of the DPPH Radical

The ability of soybean extracts to scavenge DPPH was evaluated according to a previously described method [41]. Methanolic solutions of extracts (range, 2–10 mg/mL) were prepared. Portions of 100 μL of these solutions were mixed with 0.25 mL of 1 mM DPPH and 2 mL of methanol. Absorbance of mixtures was read at λ = 517 nm after left standing for 20 min. The results were plotted as absorbance values vs. sample concentration (mg/assay). Additionally, EC50 values were defined as concentration of extract (mg/mL reaction mixture) needed to scavenge 50% of initial DPPH and were estimated.

2.11. Statistical Analysis

The HPLC separation was conducted in duplicate. Antioxidant assays were performed in at least three repetitions. Results are presented as means ± standard deviation (SD). One-way ANOVA and Fisher’s least significant difference test at a level of p < 0.05 were used to determine the significance of differences between mean values. To determine the relation between results of total phenolics ant antioxidant assays the Pearson correlation was used. Statistical analysis was performed with GraphPad Prism version 6.04 for Windows (GraphPad Software, San Diego, CA, USA).

3. Results

Table 1 reports the extraction yield and TPC of the soybean plant at different growth stages expressed on the extract and the fresh matter. The highest extraction yield was obtained at the V6 stage (p < 0.05). The TPC ranged from 42.2 to 50.4 mg catechin eq./g extract, with the highest values observed for stages V6, R4, and R5. The results reported for the plants were also the highest TPC for these three growth stages plus V5 (p < 0.05). The TPC was lowest for extracts obtained from the R1–R3 stages; the lowest TPC values expressed on plant were observed for stages R2 and R3.
The phenolic compound profile, as determined by DAD-HPLC, was characterized by 19 compounds (Figure 1): seven hydroxycinnamic acid derivatives (compounds from 1 to 7), five flavonol derivatives (compounds 8, 10, 11, 13, 14), three isoflavone derivatives (compounds from 15 to 17), rutin (compound 12), daidzin (compound 9), daidzein (compound 18), and genistein (compound 19). The content of several phenolic compounds differed significantly by growth stage (p < 0.05) when the results were expressed on the plant extract (compounds 5, 7, 8, 9, 11, 12, 14, 18) (Table 2) and when they were expressed on the fresh matter of soybean (compounds 5, 7, 9, 12, 14, 18) (Table 3). HPLC revealed that the predominant compounds in all samples were 12 (rutin), 10 (flavonol, expressed as kaempferol equivalents), and 8 (flavonol, expressed as quercetin equivalents). The sum of flavonols differed by growth stage, with the lowest value recorded for stage V6 and highest for stage V5 (p < 0.05), while the sum of phenolic compounds, sum of hydroxycinnamic acids, and sum of isoflavones did not differ significantly (p ≥ 0.05) across the growth cycle.
Table 3 presents the antioxidant activity of each growth stage determined as TEAC, FRAP, PCL-ACL, and Fe2+ chelating ability. All antioxidant tests showed significant differences between growth stages (p < 0.05). TEAC was lowest for stage R2, when expressed on the extract and on the fresh matter, and highest for stages R3 and R1 when the results were expressed on the extract and on the fresh matter, respectively. FRAP values ranged from 623 to 780 μmol Fe2+/g extract and from 21.4 to 28.5 μmol Fe2+/g FM; PCL-ACL values ranged from 516 to 560 μmol Trolox eq./g extract and from 17.6 to 21.8 μmol Trolox eq./g FM. Finally, Fe2+ chelating ability ranged from 36.5% for stage R5 to 51.7% for stage R3. Figure 2 shows the antiradical activity against DPPH radical expressed as the EC50 value, which differed significantly at different growth stages (p < 0.05). The highest antiradical activity was obtained for extract from stage V5 with the lowest EC50 value (0.126 mg/mL); the highest EC50 value (0.218 mg/mL) was found for stage R2.
The content of total phenolic in the extracts was not correlated with their antioxidant activity determined with ABTS, FRAP, DPPH, PCL-ACL and Fe2+ chelation.

4. Discussion

As far as TPC content of soybean is concerned, Riedl et al. [42] reported a significant variation in TPC of soybean by environmental factors (e.g., precipitation/irrigation and temperature), while Slavin et al. [43] found that TPC did not differ in five experimental lines of lipid-altered soybeans and ranged from 2.1 to 2.6 mg GAE/g of seeds. Chung et al. [44] reported that TPC was significantly different between nine soybean varieties and ranged from 2.9 to 3.9 mg of GAE/g of seeds. These values are not comparable with our data due to the different method used and different plant material investigated.
The phenolic profile of four cultivars of soybean herbages were investigated by Šibul et al. [45]. These authors analyzed this plant material (including stem, leaves and hull without seeds), comparable with the R4 reproductive stage, and found for DPPH radical assay EC50 values under 0.12 mg/mL in all investigated cultivars that resulted lower than those found in our study at similar stage. Moreover, the most abundant detected compounds found by Šibul et al. [45] were quinic acid, isoflavones (genistein and daidzein), and flavonoid glycosides and aglycones, while we found high amount of rutin and low content of genistein and daidzein. The huge amount of rutin in comparison with other phenolic compounds found in aerial part of soybean at different growth stages was in contrast with literature data on soybean seed [46]. These authors determined the number of total flavonoids in the seed extracts of different genotypes, only reached up to 0.61 g rutin/kg dry plant material; moreover, they reported that antioxidant activity increased proportionally to the phenolic content. In our study lowest values of TEAC, FRAP and PCL-ACL were found in R2 growth stage characterized by the lowest TPC content.
The influence of the growth period on the content of phenolic compounds and antioxidant capacity of soybean was reported by several authors. According to Song et al. [47], kaempferol glycosides were increasingly synthesized from the vegetative to beginning seed stage but decreased rapidly at stages of full seed and beginning maturity. The extensively synthesized daidzein and genistein were shown during seed growth at the beginning and full pod.
The results of Lee et al. [48], showed that the total contents of daidzein, glycitein, and genistein in soybean leaves have positively correlated with the growth period. In our study, the highest content of isoflavones was observed at vegetative stages (Table 3). In the study of Seao et al. [49] the highest contents of individual isoflavones (daidzein, glycitein, genistein, and genistein) in seeds at the growth period of beginning maturity were higher than those at the growth period of beginning full seed and full maturity. At the beginning of maturity, the soybean seeds showed the stronger antioxidant potential than at the growth period of beginning full seed and full maturity [49]. In the cited work, the DPPH and ABTS assays were performed. In our research reproductive stage R4 was also characterized by high results of ABTS and FRAP assays (Table 4).
According to literature data, the changes of phenolic compounds in soybean can be related to expression of glycosyltransferases during germination [50], growth of cell wall [51], pollen development [52], and early flowering from plants [53]. Legume species have a unique enzymatic mechanism causing production of the isoflavones [54]. These key enzymes that redirect phenylpropanoid pathway intermediates from flavonoids to isoflavonoids are the cytochrome P450 monooxygenase and isoflavone synthase (IFS). Strong correlations were shown with the activation of isoflavonoid biosynthesis because the soybean grows to fill the pod cavity and nodulation occurs at R5–R6 growth stages [52].
In our previous study, the highest values of the TEAC were obtained for the aerial part of perilla (Perilla frutescens L.) in the two last stages of growth. The lowest value of FRAP was observed at the medium vegetative stage [29]. Quinoa (Chenopodium quinoa Willd.) exhibited the lowest FRAP results at the late vegetative stage and the highest TEAC results at the early vegetative stage [30]. The highest values of FRAP were noted in the two last stages of development (full branching ang early flowering) of safflower (Carthamus tinctorius L.) [31].

5. Conclusions

Taken together, our results show that the phenolic composition of the aerial part of soybean differs significantly across the growth cycle. The sum of flavonols was highest in stage V5 and lowest in stage V6. All antioxidant tests showed significant differences between extracts of different growth stages. Generally, the most active extracts were obtained from the V5 and R3 stages. The extracts of soybean plant can be used in pharmacy for the production of nutraceuticals by virtue of their good antioxidant activity and content of flavonols and other bioactive constituents. A future area of focus would be to investigate the specific antioxidative activity of the biomolecules present in the soybean plant at different growth stages.

Author Contributions

Conceptualization, P.G.P. and G.M.; methodology, R.A., M.K., and M.J.; validation, R.A. and M.K.; formal analysis, E.L., M.K., and M.J.; investigation, P.G.P., F.G., and M.K.; resources, R.A. and M.K.; data curation, E.L., M.J., and M.K.; writing—original draft preparation, P.P.G. and M.K.; writing—review and editing, P.G.P., F.G., and M.K.; supervision, R.A.; funding acquisition, R.A. and G.M.

Funding

This research received no external funding.

Acknowledgments

Authors would like to express their thanks to the Italian National Research Council for a visiting grant to R.A. in the framework of a free exchange program between the Polish Academy of Sciences and the Italian National Research Council.

Conflicts of Interest

The authors declare no conflict of interest.

References

  1. Peiretti, P.G.; Meineri, G.; Longato, E.; Tassone, S. Nutritive value and fatty acid content of soybean plant [Glycine max (L.) Merr.] during its growth cycle. Ital. J. Anim. Sci. 2018, 17, 347–352. [Google Scholar] [CrossRef]
  2. Seiter, S.; Altemose, C.E.; Davis, M.H. Forage soybean yield and quality responses to plant density and row distance. Agron. J. 2004, 96, 966–970. [Google Scholar] [CrossRef]
  3. Chang, S.R.; Lu, C.H.; Lur, H.S.; Hsu, F.H. Forage yield, chemical contents, and silage quality of manure soybean. Agron. J. 2012, 104, 130–136. [Google Scholar] [CrossRef]
  4. Touno, E.; Kaneko, M.; Uozumi, S.; Kawamoto, H.; Deguchi, S. Evaluation of feeding value of forage soybean silage as a substitute for wheat bran in sheep. Anim. Sci. J. 2014, 85, 46–52. [Google Scholar] [CrossRef]
  5. Đurović, S.; Nikolić, B.; Luković, N.; Jovanović, J.; Stefanović, A.; Šekuljica, N.; Mijin, D.; Knežević-Jugović, Z. The impact of high-power ultrasound and microwave on the phenolic acid profile and antioxidant activity of the extract from yellow soybean seeds. Ind. Crops Prod. 2018, 122, 223–231. [Google Scholar] [CrossRef]
  6. Lee, C.H.; Yang, L.; Xu, J.Z.; Yeung, S.Y.V.; Huang, Y.; Chen, Z.Y. Relative antioxidant activity of soybean isoflavones and their glycosides. Food Chem. 2005, 90, 735–741. [Google Scholar] [CrossRef]
  7. Mujić, I.; Šertović, E.; Jokić, S.; Sarić, Z.; Alibabić, V.; Vidović, S.; Živković, J. Isoflavone content and antioxidant properties of soybean seeds. Croat. J. Food Sci. Technol. 2011, 3, 16–20. [Google Scholar]
  8. Takahashi, R.; Ohmori, R.; Kiyose, C.; Momiyama, Y.; Ohsuzu, F.; Kondo, K. Antioxidant activities of black and yellow soybeans against low density lipoprotein oxidation. J. Agric. Food Chem. 2005, 53, 4578–4582. [Google Scholar] [CrossRef]
  9. Takahata, Y.; Ohnishi-Kameyama, M.; Furuta, S.; Takahashi, M.; Suda, I. Highly polymerized procyanidins in brown soybean seed coat with a high radical-scavenging activity. J. Agric. Food Chem. 2001, 49, 5843–5847. [Google Scholar] [CrossRef]
  10. Xu, B.; Chang, S.K. Characterization of phenolic substances and antioxidant properties of food soybeans grown in the North Dakota−Minnesota region. J. Agric. Food Chem. 2008, 56, 9102–9113. [Google Scholar] [CrossRef]
  11. Zhang, R.F.; Zhang, F.X.; Zhang, M.W.; Wei, Z.C.; Yang, C.Y.; Zhang, Y.; Tang, X.J.; Deng, Y.Y.; Chi, J.W. Phenolic composition and antioxidant activity in seed coats of 60 Chinese black soybean (Glycine max L. Merr.) varieties. J. Agric. Food Chem. 2011, 59, 5935–5944. [Google Scholar] [CrossRef]
  12. Do, M.H.; Lee, S.S.; Jung, P.J.; Lee, M.H.I. Intake of fruits, vegetables, and soy foods in relation to breast cancer risk in Korean women: A case-control study. Nutr. Cancer 2007, 57, 20–27. [Google Scholar] [CrossRef]
  13. Inagaki, S.; Morimura, S.; Shigematsu, T.; Kida, K.; Akutagawa, H. Apoptosis induction by vinegar produced from boiled extract of black soybeans in human monoblastic leukemia U937 cells: Difference in sensitivity to cell toxicity compared to normal lymphocytes. Food Sci. Technol. Res. 2005, 11, 311–317. [Google Scholar] [CrossRef]
  14. Shinomiya, K.; Tokunaga, S.; Shigemoto, Y.; Kamei, C. Effects of seed coat extract of black soybeans on radial maze performance in rats. Clin. Exp. Pharmacol. Physiol. 2005, 32, 757–760. [Google Scholar] [CrossRef] [PubMed]
  15. Giri, G.F.; Viarengo, G.; Furlán, R.L.; Suárez, A.G.; Véscovi, E.G.; Spanevello, R.A. Soybean hulls, an alternative source of bioactive compounds: Combining pyrolysis with bioguided fractionation. Ind. Crops Prod. 2017, 105, 113–123. [Google Scholar] [CrossRef]
  16. Astadi, I.R.; Astuti, M.A.; Santoso, U.; Nugraheni, P.S. In vitro antioxidant activity of anthocyanins of black soybean seed coat in human low density lipoprotein (LDL). Food Chem. 2009, 112, 659–663. [Google Scholar] [CrossRef]
  17. Wang, H.; Murphy, P.A. Isoflavone content in commercial soybean foods. J. Agric. Food Chem. 1994, 42, 1666–1673. [Google Scholar] [CrossRef]
  18. Coward, L.; Barnes, N.C.; Setchell, K.D.; Barnes, S. Genistein, daidzein, and their beta-glycoside conjugates: Antitumor isoflavones in soybean foods from American and Asian diets. J. Agric. Food Chem. 1993, 41, 1961–1967. [Google Scholar] [CrossRef]
  19. Ho, H.M.; Chen, R.Y.; Leung, L.K.; Chan, F.L.; Huang, Y.; Chen, Z.Y. Difference in flavonoid and isoflavone profile between soybean and soy leaf. Biomed. Pharmacother. 2002, 56, 289–295. [Google Scholar] [CrossRef]
  20. Bennett, J.O.; Yu, O.; Heatherly, L.G.; Krishnan, H.B. Accumulation of genistein and daidzein, soybean isoflavones implicated in promoting human health, is significantly elevated by irrigation. J. Agric. Food Chem. 2004, 52, 7574–7579. [Google Scholar] [CrossRef] [PubMed]
  21. Hoeck, J.; Fehr, W.; Murphy, P.; Welke, G. Influence of genotype and environment on isoflavone contents of soybean. Crop Sci. 2000, 40, 48–51. [Google Scholar] [CrossRef]
  22. Lee, S.; Ahn, J.; Kim, S.; Kim, J.; Han, S.; Jung, M.; Chung, I. Variation in isoflavone of soybean cultivars with location and storage duration. J. Agric. Food Chem. 2003, 51, 3382–3389. [Google Scholar] [CrossRef]
  23. Chennupati, P.; Seguin, P.; Liu, W. Effects of high temperature stress at different development stages on soybean isoflavone and tocopherol concentrations. J. Agric. Food Chem. 2011, 59, 13081–13088. [Google Scholar] [CrossRef] [PubMed]
  24. Tsukamoto, C.; Shimada, S.; Igita, K.; Kudou, S.; Kokubun, M.; Okubo, K.; Kitamura, K. Factors affecting isoflavone content in soybean seeds: Changes in isoflavones, saponins, and composition of fatty acids at different temperatures during seed development. J. Agric. Food Chem. 1995, 43, 1184–1192. [Google Scholar] [CrossRef]
  25. Kumar, V.; Rani, A.; Dixit, A.K.; Bhatnagar, D.; Chauhan, G.S. Relative changes in tocopherols, isoflavones, total phenolic content, and antioxidative activity in soybean seeds at different reproductive stages. J. Agric. Food Chem. 2009, 57, 2705–2710. [Google Scholar] [CrossRef]
  26. Kumar, V.; Rani, A.; Dixit, A.K.; Pratap, D.; Bhatnagar, D. A comparative assessment of total phenolic content, ferric reducing-anti-oxidative power, free radical-scavenging activity, vitamin C and isoflavones content in soybean with varying seed coat colour. Food Res. Int. 2010, 43, 323–328. [Google Scholar] [CrossRef]
  27. Malenčić, D.; Maksimović, Z.; Popović, M.; Miladinović, J. Polyphenol contents and antioxidant activity of soybean seed extracts. Bioresour. Technol. 2008, 99, 6688–6691. [Google Scholar] [CrossRef] [PubMed]
  28. Whent, M.; Hao, J.; Slavin, M.; Zhou, M.; Song, J.; Kenworthy, W.; Yu, L. Effect of genotype, environment, and their interaction on chemical composition and antioxidant properties of low-linolenic soybeans grown in Maryland. J. Agric. Food Chem. 2009, 57, 10163–10174. [Google Scholar] [CrossRef] [PubMed]
  29. Gai, F.; Peiretti, P.G.; Karamać, M.; Amarowicz, R. Changes in the total polyphenolic content and antioxidant capacities of perilla (Perilla frutescens L.) plant extracts during the growth cycle. J. Food Qual. 2017, 2017, 7214747. [Google Scholar] [CrossRef]
  30. Gai, F.; Peiretti, P.G.; Karamać, M.; Amarowicz, R. Changes in antioxidative capacity and phenolic compounds in quinoa (Chenopodium quinoa Willd.) plant extracts during growth cycle. In Quinoa: Cultivation, Nutritional Properties and Effects on Health, 1st ed.; Peiretti, P.G., Gai, F., Eds.; Nova Science Publishers, Inc.: New York, NY, USA, 2019. [Google Scholar]
  31. Peiretti, P.G.; Gai, F.; Karamać, M.; Amarowicz, R. Antioxidant activities and phenolic composition of safflower (Carthamus tinctorius L.) plant during their growth cycle. In Agricultural Research Updates; Gorawala, P., Mandhatri, S., Eds.; Nova Science Publishers, Inc.: New York, NY, USA, 2017; Volume 19, pp. 23–39. [Google Scholar]
  32. United States Department of Agriculture. Soil taxonomy: A basic system of soil classification for making and interpreting soil surveys. In Agriculture Handbook Number 436, 2nd ed.; USDA, Natural Resources Conservation Service: Washington, DC, USA, 1999. [Google Scholar]
  33. Fehr, W.R.; Caviness, C.E.; Burmood, D.T.; Pennington, J.S. Stage of development descriptions for soybeans, Glycine max (L.) Merrill. Crop Sci. 1971, 11, 929–931. [Google Scholar] [CrossRef]
  34. Karamać, M.; Kosińska, A.; Estrella, I.; Hernández, T.; Dueñas, M. Antioxidant activity of phenolic compounds identified in sunflower seeds. Eur. Food Res. Technol. 2012, 235, 221–230. [Google Scholar] [CrossRef] [Green Version]
  35. Janiak, M.A.; Slavova-Kazakova, A.; Kancheva, V.D.; Ivanova, M.; Tsrunchev, T.; Karamać, M. Effects of γ-Irradiation of wild thyme (Thymus serpyllum L.) on the phenolic compounds profile of its ethanolic extract. Pol. J. Food Nutr. Sci. 2017, 67, 309–316. [Google Scholar] [CrossRef]
  36. Benzie, I.E.F.; Strain, J.J. Ferric reducing/antioxidant power assay: Direct measure of total antioxidant activity of biological fluids and modified version for simultaneous measurement of total antioxidant power and ascorbic acid concentration. Meth. Enzymol. 1990, 299, 15–27. [Google Scholar]
  37. Re, R.; Pellegrini, N.; Proteggente, A.; Pannala, A.; Yang, M.; Rice-Evans, C. Antioxidant activity applying an improved ABTS radical cation decolorization assay. Free Radic. Biol. Med. 1999, 26, 1231–1237. [Google Scholar] [CrossRef]
  38. Popov, I.; Lewin, G. Oxidants and antioxidants part B—Antioxidative homeostasis: Characterization by means of chemiluminescent technique. Methods Enzymol. 1999, 300, 437–456. [Google Scholar]
  39. Karamać, M.; Pegg, R.B. Limitations of the tetramethylmurexide assay for investigating the Fe(II) chelation activity of phenolic compounds. J. Agric. Food Chem. 2009, 57, 6425–6431. [Google Scholar] [CrossRef] [PubMed]
  40. Karamać, M.; Kosińska-Cagnazzo, A.; Kulczyk, A. Use of different proteases to obtain flaxseed protein hydrolysates with antioxidant activity. Int. J. Mol. Sci. 2016, 17, 1027. [Google Scholar] [CrossRef] [PubMed]
  41. Brand-Williams, W.; Cuvelier, M.E.; Berset, C. Use of a free-radical method to evaluate antioxidant activity. Lebensm.-Wiss. Technol. 1995, 28, 25–30. [Google Scholar] [CrossRef]
  42. Riedl, K.M.; Lee, J.H.; Renita, M.; St Martin, S.K.; Schwartz, S.J.; Vodovotz, Y. Isoflavone profiles, phenol content, and antioxidant activity of soybean seeds as influenced by cultivar and growing location in Ohio. J. Sci. Food Agric. 2007, 87, 1197–1206. [Google Scholar] [CrossRef]
  43. Slavin, M.; Cheng, Z.; Luther, M.; Kenworthy, W.; Yu, L. Antioxidant properties and phenolic, isoflavone, tocopherol, and carotenoid composition of Maryland-grown soybean lines with altered fatty acid profiles. Food Chem. 2009, 114, 20–27. [Google Scholar] [CrossRef]
  44. Chung, H.; Hogan, S.; Zhang, L.; Rainey, K.; Zhou, K. Characterization and comparison of antioxidant properties and bioactive components of Virginia soybeans. J. Agric. Food Chem. 2008, 56, 11515–11519. [Google Scholar] [CrossRef] [PubMed]
  45. Šibul, F.; Orčić, D.; Vasić, M.; Anačkov, G.; Nađpal, J.; Savić, A.; Mimica-Dukić, N. Phenolic profile, antioxidant and anti-inflammatory potential of herb and root extracts of seven selected legumes. Ind. Crops Prod. 2016, 83, 641–653. [Google Scholar] [CrossRef]
  46. Malenčić, D.; Popović, M.; Miladinović, J. Phenolic content and antioxidant properties of soybean (Glycine max (L.) Merr.) seeds. Molecules 2007, 12, 576–581. [Google Scholar] [CrossRef] [PubMed]
  47. Song, H.H.; Ryu, H.W.; Kyung Jun Lee, K.J.; Jeong, I.J.; Kim, D.S.; Sei-Ryang Oh, S.-R. Metabolomics investigation of flavonoid synthesis in soybean leaves depending on the growth stage. Metabolomics 2014, 10, 833–841. [Google Scholar] [CrossRef]
  48. Lee, J.H.; Ha, T.J.; Baek, I.-Y.; Ko, J.M.; Cho, K.M.; Im, M.-H.; Choung, M.-G. Characterization of isoflavones accumulation in developing leaves of soybean (Glycine max) cultivars. J. Korean Soc. Appl. Biol. Chem. 2009, 52, 139–143. [Google Scholar] [CrossRef]
  49. Seo, W.D.; Jae Eun Kang, J.E.; Sik-Won Choi, S.-W.; Kwang-Sik Lee, K.-S.; Lee, M.-J.; Lee, J.H. Comparison of nutritional components (isoflavone, protein, oil, and fatty acid) and antioxidant properties at the growth stage of different parts of soybean [Glycine max (L.) Merrill]. Food Sci. Biotechnol. 2017, 26, 339–347. [Google Scholar] [CrossRef] [PubMed]
  50. Taylor, L.P.; Strenge, D.; Miller, K.D. The role of glycosylation in flavonol-induced pollen germination. In Flavonoids in The Living System; Manthey, J.A., Buslig, B.S., Eds.; Plenum Press: New York, NY, USA, 1998; pp. 35–44. [Google Scholar]
  51. Cosgrove, D.J. Growth of the plant cell wall. Nat. Rev. Mol. Cell Biol. 2005, 6, 850–861. [Google Scholar] [CrossRef]
  52. Pourcel, L.; Grotewold, E. Participation of phytochemicals in plant development and growth. In Plant-Derived Natural Products; Osbourn, A.E., Lanzotti, V., Eds.; Springer: New York, NY, USA, 2009; pp. 269–279. [Google Scholar]
  53. Wang, Y.W.; Wang, W.C.; Jin, S.H.; Wang, J.; Wang, B.; Hou, B.K. Over-expression of a putative poplar glycosyltransferase gene, PtGT1, in tobacco increases lignin content and causes early flowering. J. Exp. Bot. 2012, 7, 2799–2808. [Google Scholar] [CrossRef]
  54. Yu, O.; Jung, W.; Shi, J.; Croes, R.A.; Fader, G.M.; Mc Gonigle, B.; Odell, J.T. Production of the isoflavones genistein and daidzein in non-legume dicot and monocot tissues. Plant Physiol. 2000, 124, 781–793. [Google Scholar] [CrossRef] [PubMed]
Figure 1. HPLC chromatogram of the phenolic compounds present in the soybean plant extract.
Agronomy 09 00153 g001
Figure 2. Antiradical activity of the soybean plant extracts against the DPPH at different growth stages. Means of EC50 with different letters are significantly different (p < 0.05).
Agronomy 09 00153 g002
Table 1. Yield of extraction (%) and total phenolic content (TPC) of the soybean plant extract and fresh matter (FM) at different growth stages.
Growth StageDays after SeedingExtraction YieldTPC
(mg Catechin eq./g Extract)(mg Catechin eq./g FM)
V53419.2 ± 0.3 bc 147.7 ± 2.6 ab1.75 ± 0.09 ab
V64121.0 ± 1.5 ab50.4 ± 1.1 a1.95 ± 0.002 a
R15518.7 ± 1.4 bc44.3 ± 0.8 bc1.63 ± 0.002 bc
R26219.2 ± 0.5 bc42.2 ± 2.3 c1.49 ± 0.09 cd
R36917.6 ± 1.4 c43.8 ± 1.1 bc1.40 ± 0.04 d
R47417.6 ± 1.1 c49.6 ± 3.7 a1.78 ± 0.10 ab
R57818.1 ± 0.1 c50.4 ± 2.2 a1.82 ± 0.18 ab
1 Means with the different letters in the same column are significantly different (p < 0.05).
Table 2. Phenolic compound content in soybean plant extract (mg/g) at different growth stages.
No.tR (min)λMax (nm)CompoundContent
V5V6R1R2R3R4R5
14.46328Hydroxycinnamic acid 10.34 ± 0.21 a0.47 ± 0.33 a0.39 ± 0.04 a0.50 ± 0.12 a0.45 ± 0.02 a0.44 ± 0.03 a0.45 ± 0.12 a
24.73328Hydroxycinnamic acid 11.23 ± 0.20 a1.37 ± 0.45 a1.08 ± 0.26 a1.38 ± 0.08 a1.27 ± 0.07 a0.98 ± 0.08 a1.21 ± 0.20 a
34.86328Hydroxycinnamic acid 11.54 ± 0.23 a1.43 ± 1.08 a1.41 ± 0.01 a1.72 ± 0.41 a1.54 ± 0.09 a1.64 ± 0.02 a1.52 ± 0.43 a
45.95315Hydroxycinnamic acid 10.53 ± 0.08 a0.53 ± 0.36 a0.54 ± 0.01 a0.67 ± 0.10 a0.57 ± 0.06 a0.57 ± 0.02 a0.57 ± 0.08 a
56.22321Hydroxycinnamic acid 10.71 ± 0.09 bc1.21 ± 0.12 a0.76 ± 0.03 bc0.94 ± 0.22 ab0.73 ± 0.06 bc0.63 ± 0.10 c0.70 ± 0.07 bc
66.33325Hydroxycinnamic acid 10.52 ± 0.06 a0.52 ± 0.19 a0.47 ± 0.04 a0.56 ± 0.10 a0.54 ± 0.06 a0.53 ± 0.03 a0.53 ± 0.08 a
76.54327Hydroxycinnamic acid 10.82 ± 0.14 ab0.96 ± 0.13 a0.69 ± 0.08 b0.81 ± 0.03 ab0.76 ± 0.10 ab0.67 ± 0.07 b0.79 ± 0.10 ab
87.42256,353Flavonol 26.80 ± 0.33 ab3.80 ± 2.97 b5.62 ± 0.04 ab6.97 ± 0.52 a6.02 ± 0.88 ab7.00 ± 0.89 a6.32 ± 1.02 ab
97.71251,295Daidzin0.67 ± 0.17 ab0.91 ± 0.49 ab1.50 ± 0.89 a1.11 ± 0.02 ab0.75 ± 0.10 ab0.59 ± 0.01 ab0.54 ± 0.12 b
107.87265,346Flavonol 34.19 ± 0.33 a3.27 ± 0.70 a3.97 ± 0.45 a4.32 ± 0.10 a3.97 ± 0.70 a4.37 ± 0.29 a3.89 ± 0.57 a
118.05255,353Flavonol 22.50 ± 0.12 a1.34 ± 1.08 b2.14 ± 0.01 ab2.46 ± 0.10 a2.28 ± 0.28 ab2.51 ± 0.20 a2.19 ± 0.32 ab
128.37257,355Rutin32.89 ± 1.10 a23.12 ± 5.08 b24.45 ± 0.72 b28.09 ± 1.91 ab23.23 ± 2.69 b29.18 ± 4.32 ab25.55 ± 4.43 ab
138.87265,348Flavonol 33.40 ± 0.15 a2.23 ± 1.12 a3.07 ± 0.54 a3.13 ± 0.14 a2.70 ± 0.23 a3.09 ± 0.26 a2.78 ± 0.40 a
149.08263,349Flavonol 35.02 ± 0.17 a2.61 ± 1.81 b3.91 ± 0.30 ab4.24 ± 0.20 ab3.78 ± 0.46 ab4.06 ± 0.39 ab3.70 ± 0.40 ab
159.23259Isoflavone 41.49 ± 0.2 a1.37 ± 1.11 a2.48 ± 1.06 a2.16 ± 0.02 a1.53 ± 0.07 a1.24 ± 0.07 a1.11 ± 0.16 a
169.41268Isoflavone 40.57 ± 0.01 a0.62 ± 0.23 a0.56 ± 0.13 a0.56 ± 0.01 a0.46 ± 0.06 a0.52 ± 0.04 a0.48 ± 0.06 a
1710.56260Isoflavone 40.68 ± 0.19 a0.67 ± 0.57 a1.44 ± 0.61 a1.30 ± 0.10 a0.96 ± 0.04 a0.90 ± 0.16 a0.85 ± 0.13 a
1811.99259Daidzein0.10 ± 0.05 c0.25 ± 0.23 bc0.71 ± 0.33 a0.67 ± 0.03 a0.52 ± 0.01 ab0.62 ± 0.05 ab0.53 ± 0.08 ab
1914.10260Genistein0.05 ± 0.01 a0.06 ± 0.05 a0.11 ± 0.10 a0.11 ± 0.01 a0.11 ± 0.01 a0.08 ± 0.01 a0.05 ± 0.01 a
Sum of compounds64.05 ± 3.80 a46.75 ± 17.13 a55.30 ± 5.46 a61.71 ± 3.91 a52.17 ± 5.56 a59.61 ± 7.02 a53.76 ± 8.75 a
Sum of hydroxycinnamic acids5.69 ± 1.00 a6.49 ± 2.15 a5.33 ± 0.39 a6.59 ± 1.05 a5.86 ± 0.46 a5.46 ± 0.36 a5.76 ± 1.07 a
Sum of flavonols54.8 ± 2.19 a36.4 ± 12.76 b43.2 ± 1.96 ab49.2 ± 2.98 ab42.0 ± 5.24 ab50.2 ± 6.34 ab44.4 ± 7.14 ab
Sum of isoflavones3.56 ± 0.62 a3.88 ± 2.22 a6.80 ± 3.12 a5.90 ± 0.12 a4.33 ± 0.14 a3.95 ± 0.32 a3.56 ± 0.54 a
1 Expressed as caffeic acid equivalents; 2 expressed as quercetin equivalents; 3 expressed as kaempferol equivalents; 4 expressed as genistein equivalents. Means with different letters in the same row are significantly different (p < 0.05). Number of compounds correspond to peak number in Figure 1.
Table 3. Phenolic compounds content in soybean plant fresh matter (µm/g) at different growth stages.
No.tR (min)λMax (nm)CompoundContent
V5V6R1R2R3R4R5
14.46328Hydroxycinnamic acid 112.5 ± 7.7 a18.1 ± 12.3 a14.3 ± 1.1 a17.7 ± 4.2 a14.3 ± 0.7 a16.0 ± 0.9 a16.5 ± 5.1 a
24.73328Hydroxycinnamic acid 145.2 ± 7.1 a53.1 ± 16.2 a39.7 ± 8.8 a48.8 ± 2.9 a40.5 ± 2.3 a35.2 ± 2.2 a43.8 ± 9.7 a
34.86328Hydroxycinnamic acid 156.2 ± 8.5 a55.0 ± 40.4 a52.1 ± 1.5 a60.8 ± 14.7 a49.4 ± 3.0 a59.0 ± 0.3 a55.4 ± 18.5 a
45.95315Hydroxycinnamic acid 119.4 ± 2.9 a20.5 ± 13.6 a19.8 ± 0.0 a23.5 ± 3.7 a18.4 ± 2.0 a20.5 ± 0.4 a20.6 ± 4.2 a
56.22321Hydroxycinnamic acid 126.0 ± 3.1 c47.0 ± 5.8 a27.9 ± 1.5 bc33.3 ± 7.9 b23.2 ± 2.2 bc22.6 ± 3.2 c25.2 ± 3.8 bc
66.33325Hydroxycinnamic acid 118.9 ± 2.0 a19.9 ± 7.0 a17.3 ± 1.0 a19.9 ± 3.7 a17.2 ± 2.0 a18.9 ± 0.9 a19.2 ± 3.8 a
76.54327Hydroxycinnamic acid 130.1 ± 4.9 ab37.3 ± 6.1 a25.5 ± 2.5 b28.6 ± 1.0 ab24.4 ± 3.4 b24.3 ± 2.1 b28.5 ± 5.0 ab
87.42256,353Flavonol 2249 ± 12 a146 ± 112 a207 ± 6 a246 ± 20 a193 ± 29 a252 ± 27 a229 ± 50 a
97.71251,295Daidzin24.5 ± 6.3 ab35.2 ± 18.1 ab54.8 ± 31.8 a39.0 ± 0.9 ab24.1 ± 3.0 ab21.2 ± 0.7 b19.7 ± 5.3 b
107.87265,346Flavonol 3153 ± 12 a127 ± 24 a146 ± 14 a153 ± 4 a127 ± 23 a157 ± 8 a141 ± 28 a
118.05255,353Flavonol 291.5 ± 4.2 a51.6 ± 40.5 a78.8 ± 1.9 a86.9 ± 4.0 a72.9 ± 9.4 a90.5 ± 5.4 a79.4 ± 15.9 a
128.37257,355Rutin1203 ± 39 a895 ± 176 bc902 ± 8 bc991 ± 72 abc743 ± 90 c1050 ± 136 ab928 ± 211 abc
138.87265,348Flavonol 3124 ± 5 a86 ± 42 a113 ± 17 a110 ± 6 a87 ± 8 a111 ± 7 a101 ± 20 a
149.08263,349Flavonol 3184 ± 6 a101 ± 68 b144 ± 8 ab150 ± 8 ab121 ± 15 ab146 ± 11 ab134 ± 22 ab
159.23259Isoflavone 454.5 ± 7.5 a52.5 ± 41.7 a91.1 ± 37.2 a76.2 ± 0.3 a48.9 ± 2.0 a44.5 ± 1.7 a40.4 ± 8.1 a
169.41268Isoflavone 421.0 ± 0.4 a24.3 ± 9.4 a20.6 ± 4.2 a19.6 ± 0.3 a14.8 ± 2.0 a18.5 ± 1.2 a17.4 ± 3.2 a
1710.56260Isoflavone 424.9 ± 7.0 a25.8 ± 21.5 a52.9 ± 21.5 a45.7 ± 3.3 a30.5 ± 1.1 a32.4 ± 5.3 a30.9 ± 6.4 a
1811.99259Daidzein3.7 ± 1.6 c9.7 ± 8.9 bc26.0 ± 11.6 a23.6 ± 0.9 a16.7 ± 0.1 abc22.4 ± 1.3 ab19.1 ± 3.8 ab
1914.10260Genistein1.7 ± 0.4 a2.1 ± 2.0 a4.2 ± 3.5 a4.0 ± 0.1 a3.5 ± 0.3 a3.0 ± 0.2 a1.8 ± 0.1 a
Sum of compounds2343 ± 136 a1806 ± 622 a2038 ± 160 a2177 ± 148 a1669 ± 187 a2145 ± 213 a1951 ± 424 a
Sum of hydroxycinnamic acids208 ± 30 a251 ± 78 a197 ± 10 a233 ± 38 a187 ± 16 a197 ± 9 a209 ± 50 a
Sum of flavonols2005 ± 77 a1406 ± 462 b1592 ± 40 ab1736 ± 113 ab1343 ± 175 b1806 ± 195 ab1612 ± 347 ab
Sum of isoflavones130 ± 22 a150 ± 83 a250 ± 110 a208 ± 3 a139 ± 4 a142 ± 9 a129 ± 27 a
1 Expressed as caffeic acid equivalents; 2 expressed as quercetin equivalents; 3 expressed as kaempferol equivalents; 4 expressed as genistein equivalents. Means with different letters in the same row are significantly different (p < 0.05). Number of compounds correspond to peak number in Figure 1.
Table 4. Antioxidant activity of soybean plant extract and fresh matter (FM) at different growth stages.
Growth StageTEAC 1FRAP 2PCL-ACL 3Fe2+ Chelating Ability
(μmol Trolox eq./g Extract)(μmol Trolox eq./g FM)(μmol Fe2+/g Extract)(μmol Fe2+/g FM)(μmol Trolox eq./g Extract)(μmol Trolox eq./g FM)(%)
V5190 ± 20 c6.93 ± 0.71 ab780 ± 19 a28.5 ± 0.7 a552 ± 1 a20.2 ± 0.1 ab49.1 ± 5.2 ab
V6201 ± 5 bc7.82 ± 0.03 ab694 ± 10 ab26.9 ± 1.0 a560 ± 38 a21.8 ± 2.0 a41.6 ± 6.4 bcd
R1229 ± 39 bc8.43 ± 1.28 a651 ± 61 bc24.0 ± 1.8 ab517 ± 5 a19.1 ± 0.2 ab39.9 ± 4.7 cd
R2177 ± 11 c6.26 ± 0.41 b623 ± 3 bc22.0 ± 0.2 b516 ± 36 a18.2 ± 1.4 ab46.4 ± 1.3 bc
R3245 ± 21 ab7.82 ± 0.62 ab670 ± 77 ab21.4 ± 2.6 b552 ± 2 a17.6 ± 0.2 b51.7 ± 2.7 a
R4220 ± 12 bc7.93 ± 0.29 ab712 ± 77 ab25.6 ± 2.3 ab534 ± 30 a19.2 ± 0.7 ab39.2 ± 2.2 cd
R5219 ± 26 bc7.90 ± 0.95 ab666 ± 56 ab24.1 ± 3.3 ab531 ± 61 a19.3 ± 3.3 ab36.5 ± 0.8 d
1 Trolox equivalent antioxidant capacity; 2 Ferric-reducing antioxidant power; 3 Photochemiluminescence-antioxidant capacity of lipid-soluble substances; Means with different letters in the same column are significantly different (p < 0.05).

