The Growth and Development of ‘Mini Chal’ Tomato Plug Seedlings Grown under Various Wavelengths Using Light Emitting Diodes


1
Division of Applied Life Science, Graduate School of Gyeongsang National University, Jinju 52828, Korea
2
Department of Agricultural Plant Science, College of Agriculture & Life Science, Gyeongsang National University, Jinju 52828, Korea
3
Institute of Agriculture & Life Science, Gyeongsang National University, Jinju 52828, Korea
4
Research Institute of Life Science, Gyeongsang National University, Jinju 52828, Korea
*
Author to whom correspondence should be addressed.
Agronomy 2019, 9(3), 157; https://0-doi-org.brum.beds.ac.uk/10.3390/agronomy9030157
Submission received: 11 February 2019
/
Revised: 19 March 2019
/
Accepted: 21 March 2019
/
Published: 25 March 2019
(This article belongs to the Section Horticultural and Floricultural Crops)
Abstract
:This study aimed to determine the effects of various light qualities (green (G), ultraviolet-A (UV-A), and far-red (Fr)) on the growth and development of tomato plug seedlings. The ‘Mini Chal’ tomato (Solanum lycopersicum L.) seedlings were used as the plant material to which various light qualities were supplied. Fluorescent lamp (FL), combined FL and diniconazole (Dini), and R3B7 (red (R):blue (B) = 30:70) were used as the control. The different light treatments for this experiment were as follows: two G light ratios added to R3B7 (G20 and G40), three UV-A light intensities added to R3B7 (UV 0.4, UV 0.6, and UV 0.8), and three Fr light ratios added to R3B7 (Fr1, Fr2, and Fr3). Plants grown in UV 0.4 and Dini were the shortest, followed by plants grown in R3B7. R3B7 induced higher specific leaf weight than G, UV-A, and Fr did. The position of the first flower cluster was the highest for plants in FL and Fr1, and the lowest for plants in R3B7 and UV 0.6. In conclusion, different light treatments heavily affected the growth and development of ‘Mini Chal’ tomato seedlings. R3B7 was the most effective light treatment for producing high quality seedlings in a closed-type plant production system that develop well after transplanting.
1. Introduction
Light is the most essential environmental factor for growth and development of plant that are photoautotrophs [1]. The quality and intensity of artificial and natural lights all play a role in the photosynthetic assimilation products in leaves. Many studies have reported that plant growth and development are affected by the light quality, including photosynthetically active radiation (PAR) (especially red (R) and blue (B) wavelengths) as well as ultraviolet (UV), and Far-red (Fr) [2,3,4,5,6,7].
Different lights induce differing responses in plants. The effects of R and B wavelengths of the PAR have been studied in many crops; B light usually inhibits stem elongation and promotes leaf expansion, while R light affects the shoot and stem growth, and have great potential for use as a light quality to drive photosynthesis [8,9]. Recently, research has been being conducted for the effects of green (G) light in many plants [10]. It is reported that G light drove CO2-fixation deeper in spinach leaves compared to R and B lights [11]. Arabidopsis thaliana seedlings grown under a combination of G, R, and B lights were taller than those grown under monochromatic R or B lights [12]. In addition, as the proportion of G light increased in the combination of B, R, and G light, fresh weight and dry weight of tomato plants and fruit increased [13]. It is reported that UV-B inhibited stem elongation and leaf expansion [14]. However, high-intensity UV-B irradiation could damage growing seedlings, developing leaves, and also humans [15,16,17,18,19,20]. Therefore, UV-B may be of limited use in agriculture. Despite its lower reactivity, UV-A may be an alternative, reaching the deeper tissues [21]. UV-A is also safer to humans. Therefore, research of UV-A application in agriculture is necessary. R and Fr lights are absorbed by the phytochrome. The Pr form of phytochromes absorbs R light, which turns it into an inactive form that absorbs Fr light (Pfr), which is converted back to the Pr form upon absorbing Fr light [22,23]. The low R:Fr ratio occurring within crowded plant communities induce shade avoidance syndrome in plants. Wasabia japonica seedlings treated with R and Fr mixtures had lower shoot biomass, dry matter content, and thicker leaves, compared to those treated with mixed R and B lights [5].
In recent years, LED use has increased in agriculture, especially in grafting and healing processes in plug seedlings’ farms. However, the growth response of seedlings to LEDs is not yet well known. Furthermore, most of the research on the light quality to date has focused on leafy vegetables, flowers, and herbs [24,25,26], not on fruit and vegetable plug seedlings. Further research is necessary to relate the growth and development of plug seedlings with the light quality.
Thus, we aimed to determine the effects of various light qualities in this study (G, UV-A, and Fr) on the growth and development of tomato plug seedlings and produce the high quality seedlings that have high compactness in a closed-type plant production system (CPPS).
2. Materials and Methods
2.1. Plant Materials and Growth Conditions
Seeds of ‘Mini Chal’ tomato (Solanum lycopersicum L.) were sown in 40-cell plug trays (54 × 28 × 4.8 cm, Bumnong Co. Ltd., Jeongeup, Republic of Korea) filled with a commercial growing medium on 6 March 2018, and grown in a CPPS (C1200H3, FC Poibe Co. Ltd., Seoul, Republic of Korea) that was set up at 25 ± 1 °C, 50 ± 10% relative humidity (RH), and 200 µmol·m−2·s−1 photosynthetic photon flux density (PPFD) using fluorescent lamps (FL, FHF32SSEX-D, OSRAM GmbH, Munich, Germany) for 8 days before being treated with different light qualities. On the 9th day after sowing, 3 replicates of 20 seedlings per treatment were used for this experiment. The growth conditions were 25/18 °C respective day and night temperatures, 50 ± 10% RH, and 200 µmol·m−2·s−1 PPFD on the basis of the upper leaves of the plants with a 12/12-h light/dark photoperiod. The photosynthetic photon flux density was measured and adjusted at the top of the plant once every three days using a photometer (HD2101.2, Delta Ohm SrL, Caselle, Italy) measuring the range of 400–700 nm wavelength. UV-A and far-red photon flux density (PFD) were measured using a spectroradiometer (ILT950, International Light Technologies Inc., Peabody, MA, USA). The nutrient solution was supplied by sub-irrigation every day at 08:30 a.m. [27], with 6.5 pH and 0.5–1.5 dS·m−1 electrical conductivity (EC) that gradually increased in concentration (Table 1). Plug trays were rearranged daily after irrigation to provide a uniform distribution of light wavelengths and intensities. Seedlings were grown for 21 days after treatment (DAT) with various light qualities.
At 21 DAT, the seedlings were transplanted into slab-type rockwool media (Grodan Co. Ltd., Roermond, The Netherlands) in a glasshouse. Three seedlings were planted per slab. The mean temperature and RH were approximately 21.2 °C and 53.3%, respectively. The nutrient solution was automatically drip-irrigated [27] 2–3 times a day for 10 min, while pH and EC were respectively kept at 6.5 and 1.5–2.0 dS·m−1.
2.2. Light Quality Treatments
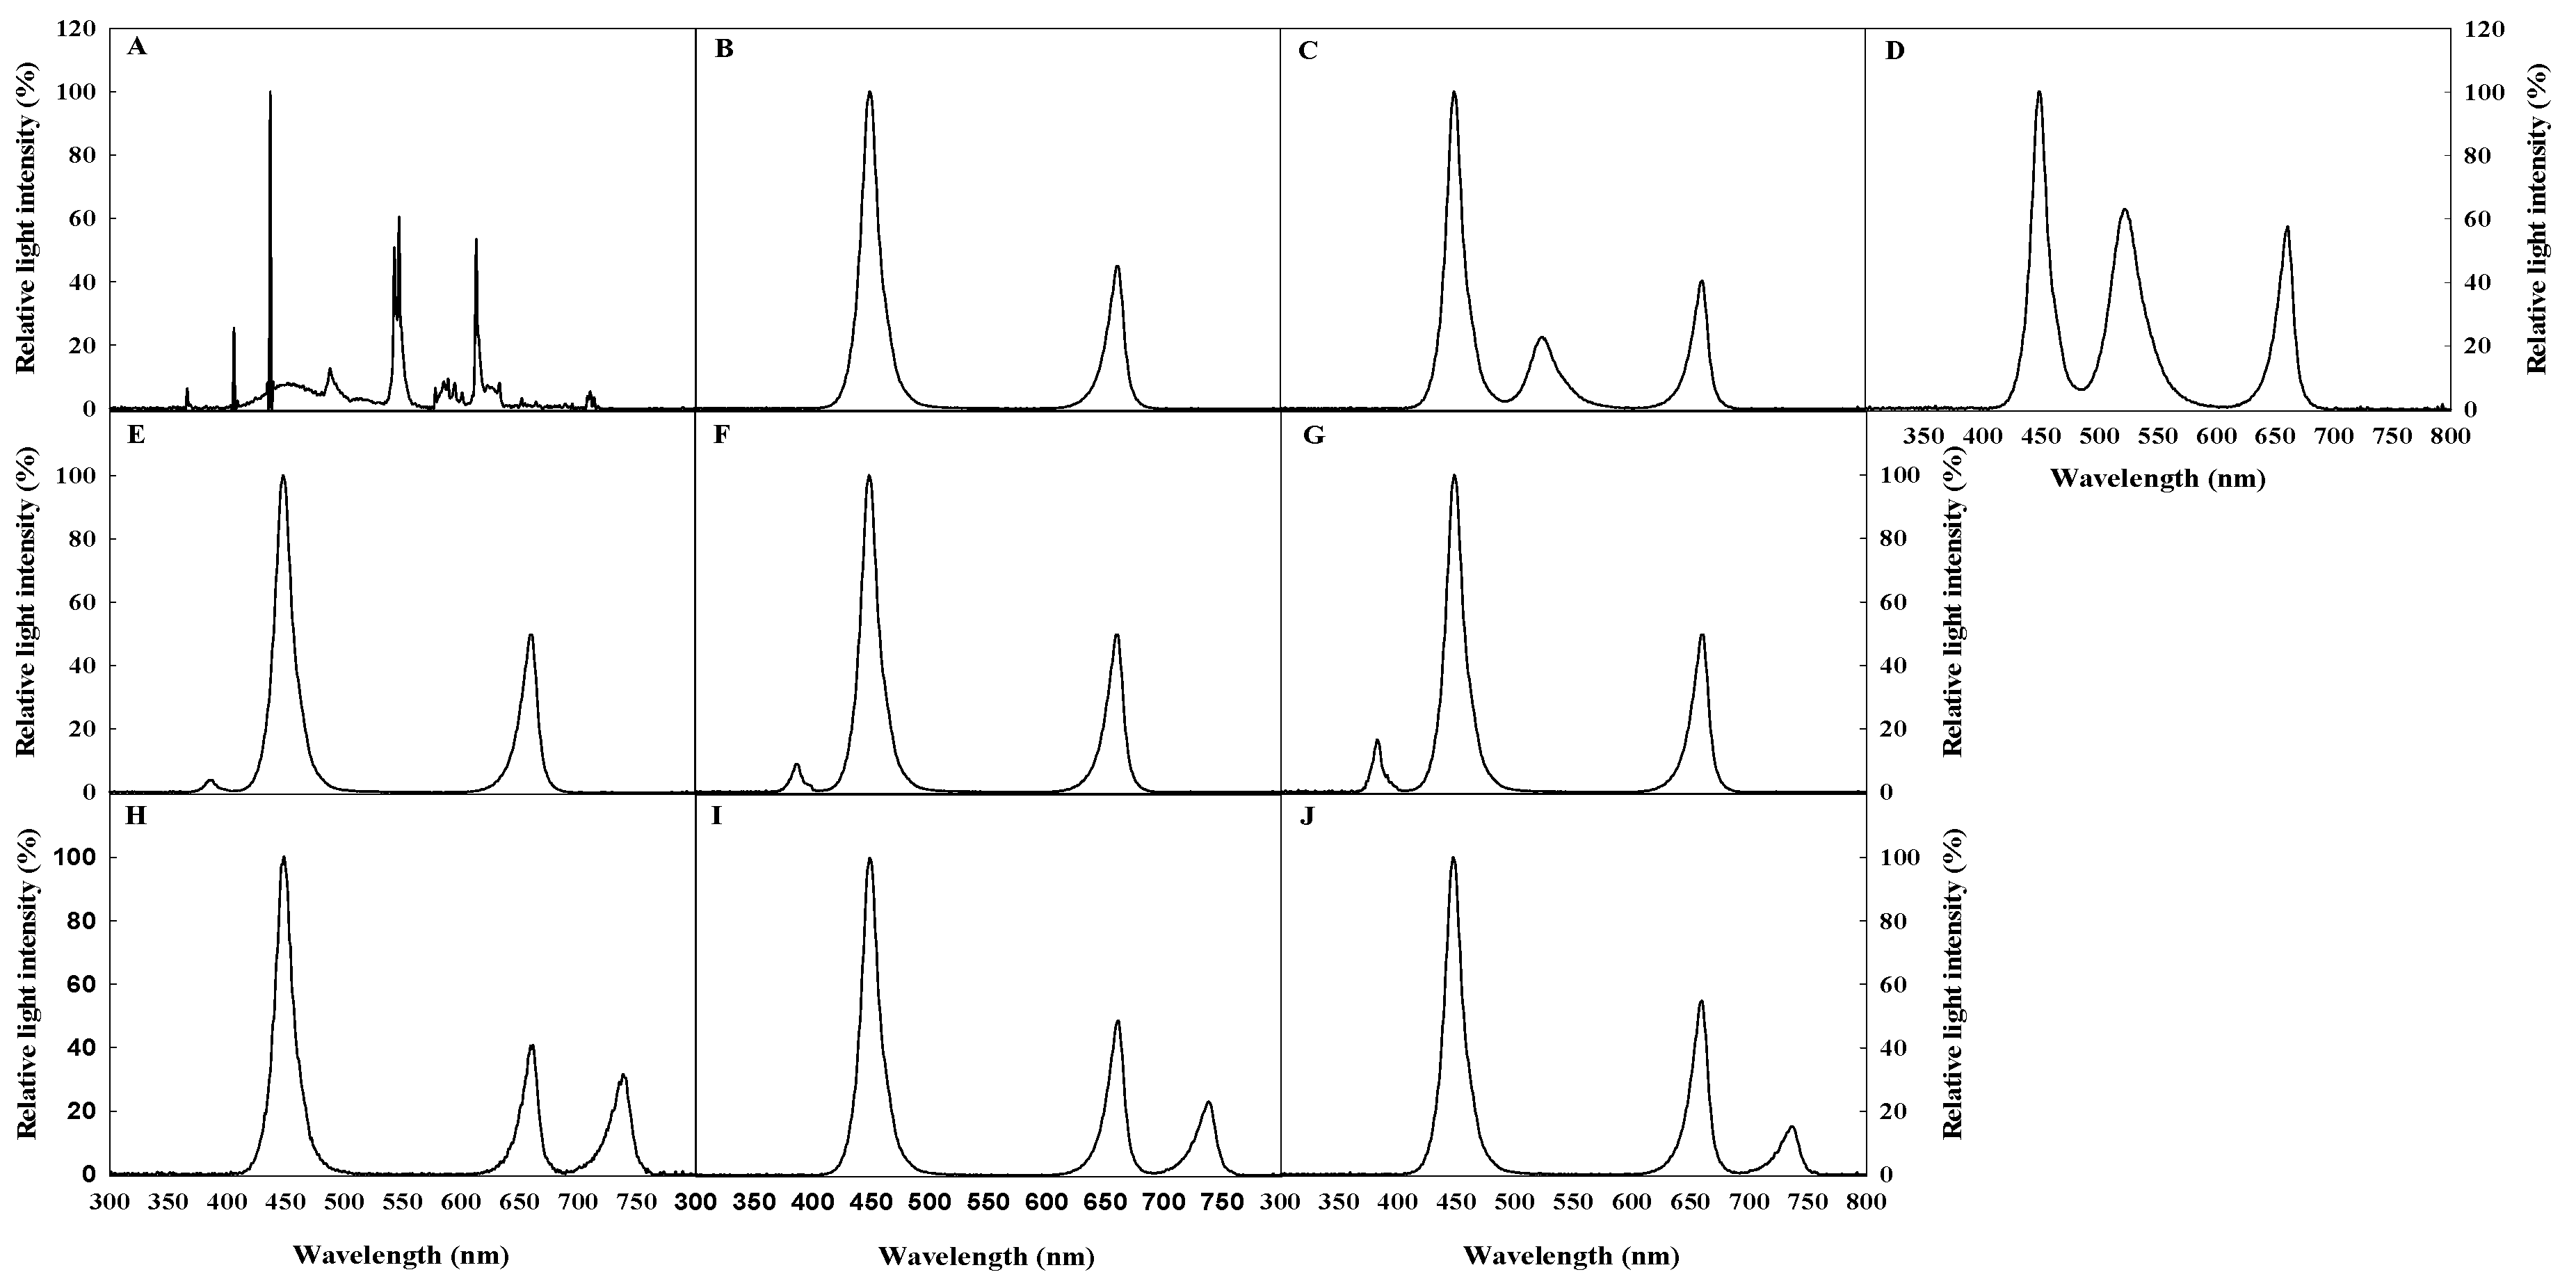
To examine how G, UV-A, and Fr lights affected the growth and development of tomato plug seedlings, FL, FL with foliar spray of diniconazole (Dini) (Binnali, Dongbang Agro Co. Ltd., Seoul, Republic of Korea), and R3B7 (R:B = 30:70) were used as the control. R3B7 was selected as superior light quality to improve the seedling quality from our previous study in which tomato plug seedlings were grown under various mixing ratios of R and B LED. To compare the effects of chemicals used to suppress plant height and to enhance the quality of seedlings at the farm readily, seedlings in Dini had diniconazole supplied as a single 150 mg·L−1 foliar spray when two true leaves appeared on a seedling. The different light treatments for this experiment were as follows: G light added to R3B7 (R:G:B = 20:20:60 (G20) and R:G:B = 20:40:40 (G40)), UV-A light added to R3B7 (R3B7 + UV-A 0.4 W·m−2 (UV 0.4), R3B7 + UV-A 0.6 W·m−2 (UV 0.6), and R3B7 + UV-A 0.8 W·m−2 (UV 0.8)), and Fr light added to R3B7 (R:B:Fr = 20:60:20 (Fr1), R:B:Fr = 26:60:14 (Fr2), and R:B:Fr = 30:60:10 (Fr3)). These ratios of the above light quality were expressed by the ratio of PFD of each light quality. The light spectral distribution was measured using a spectroradiometer (ILT950, International Light Technologies Inc., Peabody, MA, USA) at five points (center and four edges) on top of the plant (Figure 1).
2.3. Measurements of Plant Growth Characteristics
Plant growth parameters, such as the plant height, stem diameter, number of leaves, leaf area, leaf shape index, specific leaf weight (SLW), soil plant analysis development (SPAD) value, fresh and dry weights of stem and leaf, dry matter content, compactness, and chlorophyll fluorescence (Fv/Fm) were measured 21 DAT. The stem diameter was measured 1 cm above the medium surface using digital vernier calipers (CD-20CPX, Mitutoya Corp., Kawasaki, Japan). The number of leaves was measured by counting all plant leaves except for the cotyledons. The leaf area was measured using a leaf area meter (LI-3000, LI-COR Inc., Lincoln, NE, USA). The SPAD value was measured on the fifth leaf from the top using a chlorophyll meter (SPAD-502, Konica Minolta Inc., Osaka, Japan), immediately prior to harvesting the samples. The fresh weight was measured with an electronic scale (EW 220-3NM, Kern&Sohn GmbH., Balingen, Germany). The dry weight was measured after drying the divided samples of the stem, leaf, and root for 72 h in a drying oven (Venticell-222, MMM Medcenter Einrichtungen GmbH., Munich, Germany) at 70 °C. The Fv/Fm was measured using a portable saturation-pulse chlorophyll fluorometer (PAM-2100, Heinz Walz GmbH, Effeltrich, Germany).
After transplanting, the flowering speed, position of flower clusters, flower cluster height, and fruit yields of first and second flower cluster were measured 73 days after transplanting. The flowering speed was calculated as the percentage of the flowering of first flower in first or second flower cluster in a total of 9 plants per treatment. The position of flower clusters were measured by examining the number of nodes on which the flower clusters were placed, and the unit was node. Flower cluster height measured the height from soil surface to flower cluster, and the unit is cm.
The Leaf shape index, SLW, dry matter content, and compactness of tomato seedlings were calculated using the following formulae:
Leaf shape index = leaf length/leaf width
SLW (mg·cm−2) = dry weight of leaf (mg)/total leaf area (cm2)
Dry matter content (%) = (dry weight of shoot (g)/fresh weight of shoot (g) × 100
Compactness (mg·cm−1) = dry weight of shoot (mg)/plant height (cm)
2.4. Statistical Analysis
A randomized complete block design with 3 replications and 5 plants in each replication was employed in the experiment during the seedling period. After transplanting, a completely randomized design with 3 replications and 3 plants in each replication was employed in a Venlo-type glasshouse. The statistical analysis was carried out using the statistical analysis system program (SAS 9.1, SAS Institute Inc., Cary, NC, USA). The experimental results were subjected to an analysis of variance (ANOVA) and Duncan’s multiple range tests. Graphing was performed with the SigmaPlot program (SigmaPlot 12.0, Systat Software Inc., San Jose, CA, USA).
3. Results and Discussion
3.1. Growth Characteristics
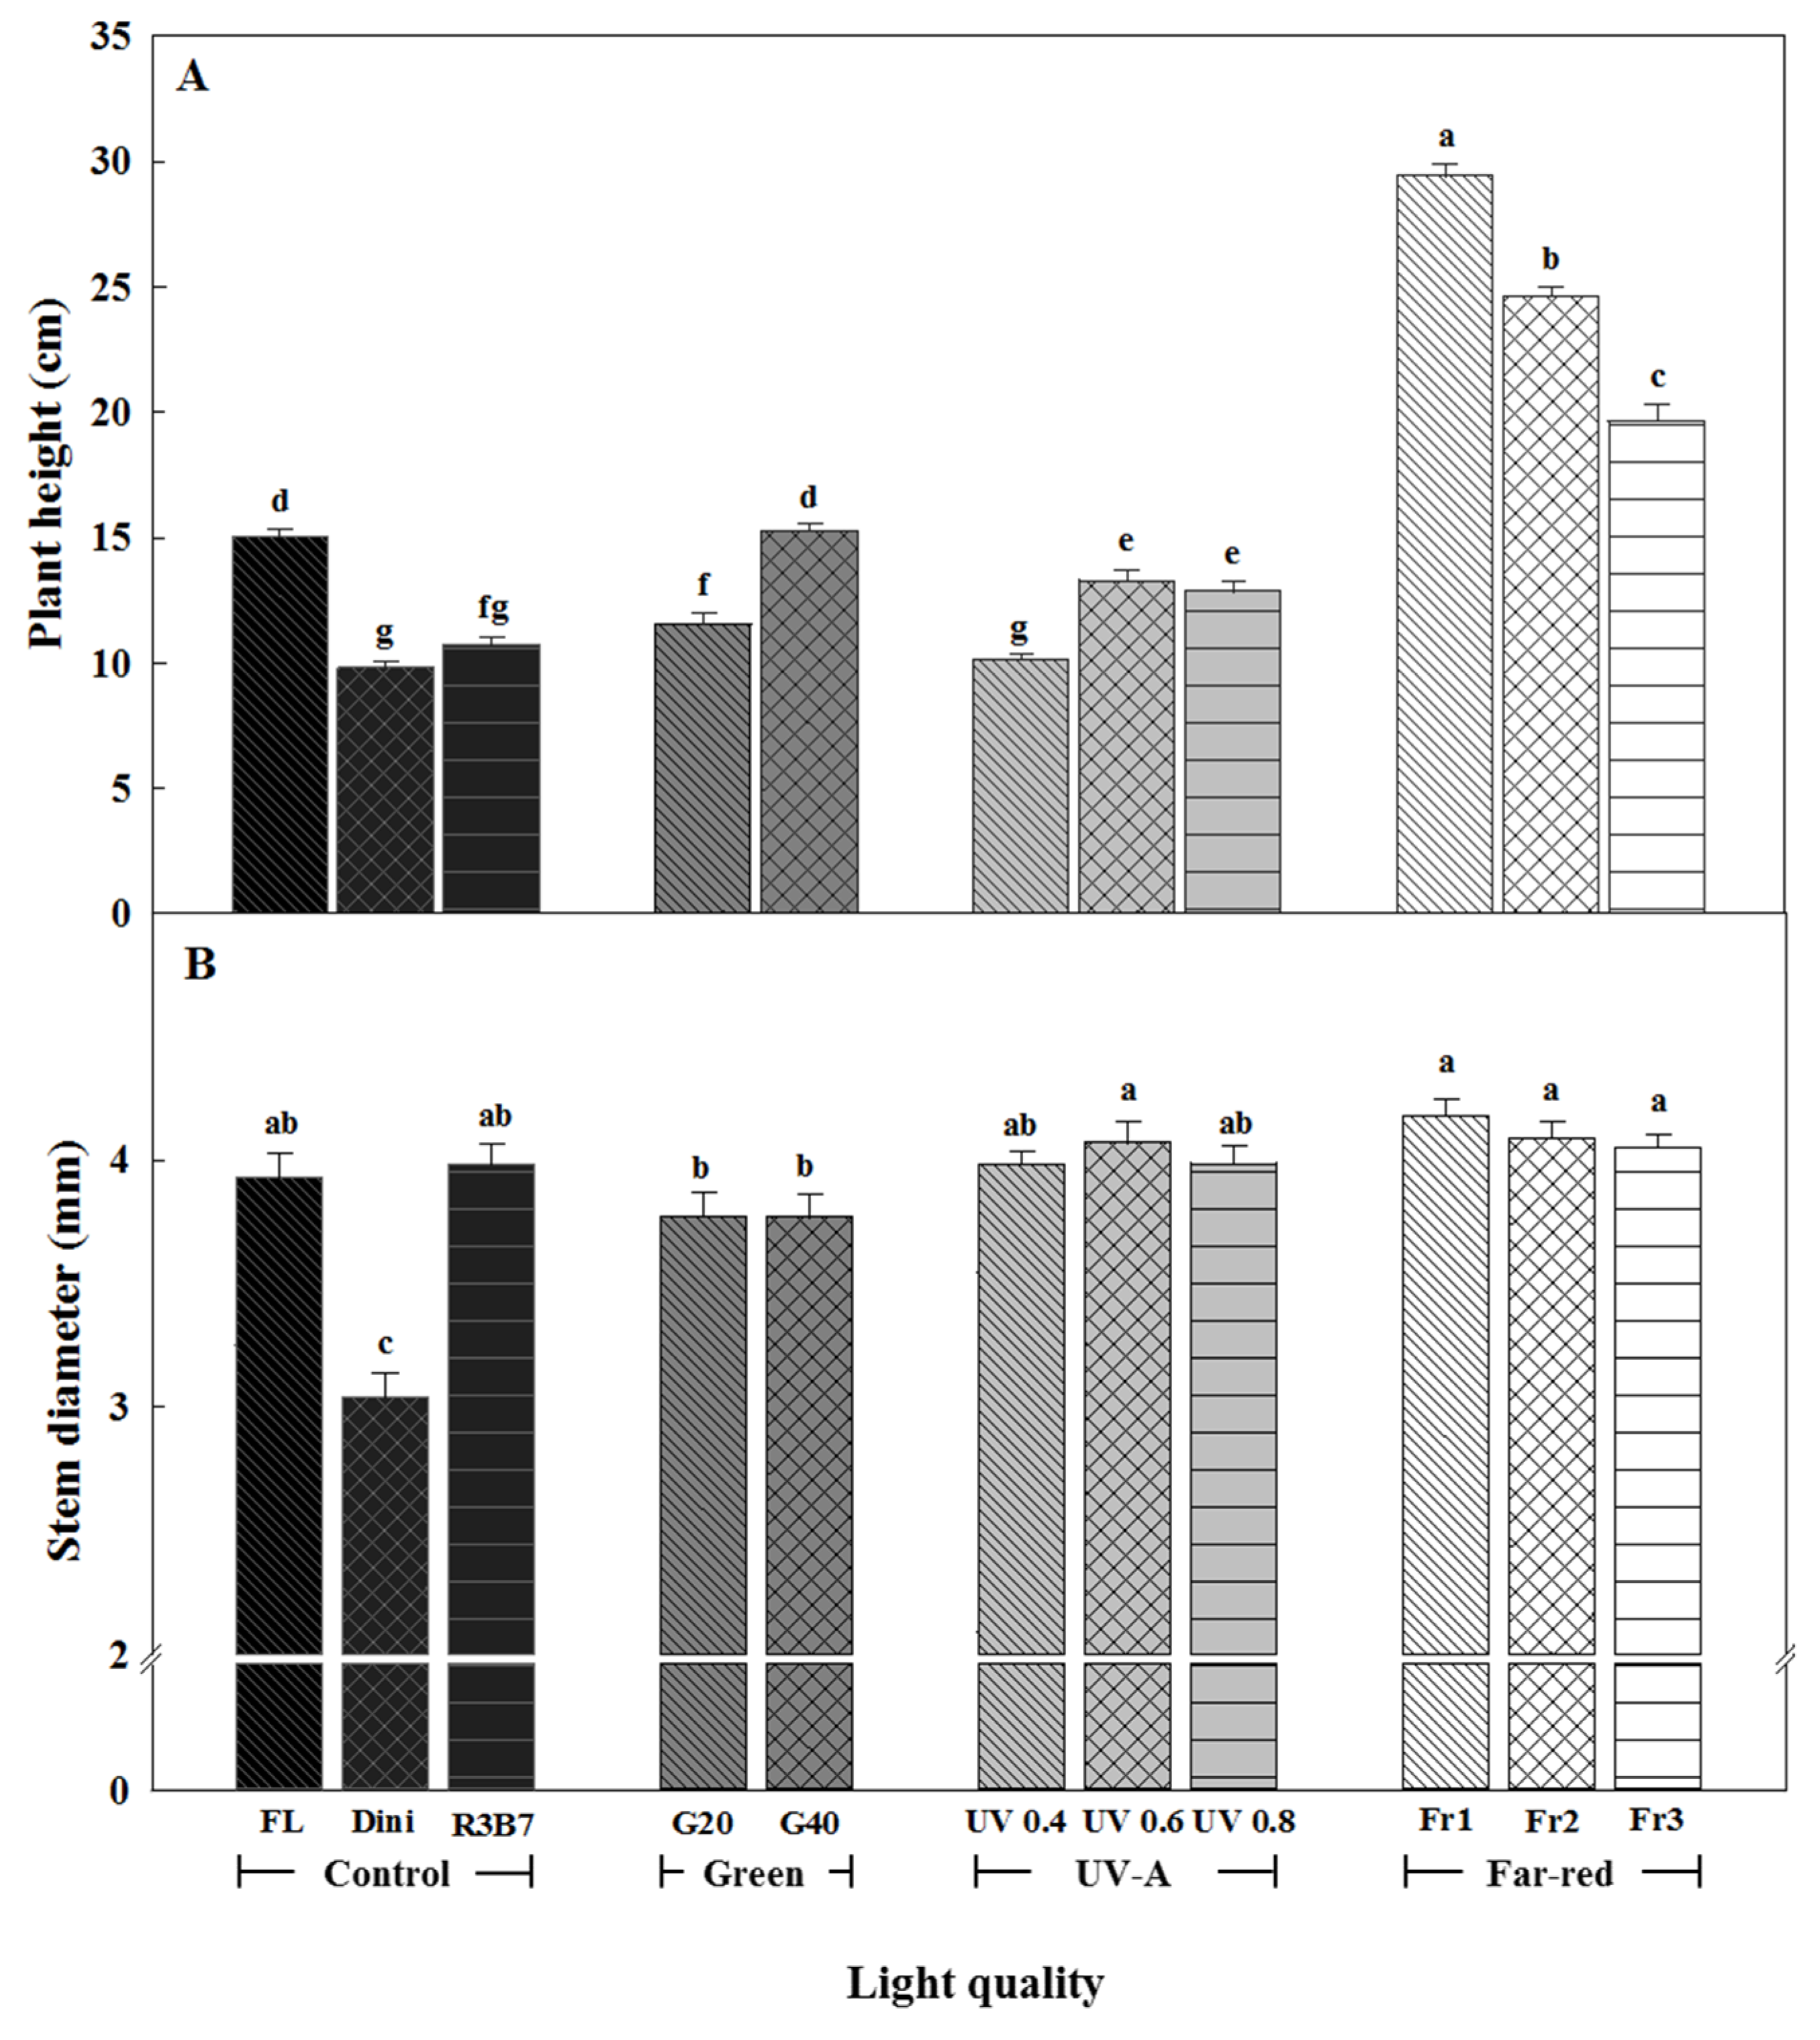
The height and stem diameter of tomato plug seedlings measured 21 DAT are presented in Figure 2. In fruit-vegetables, high quality seedlings are characterized by short height and thick stems.
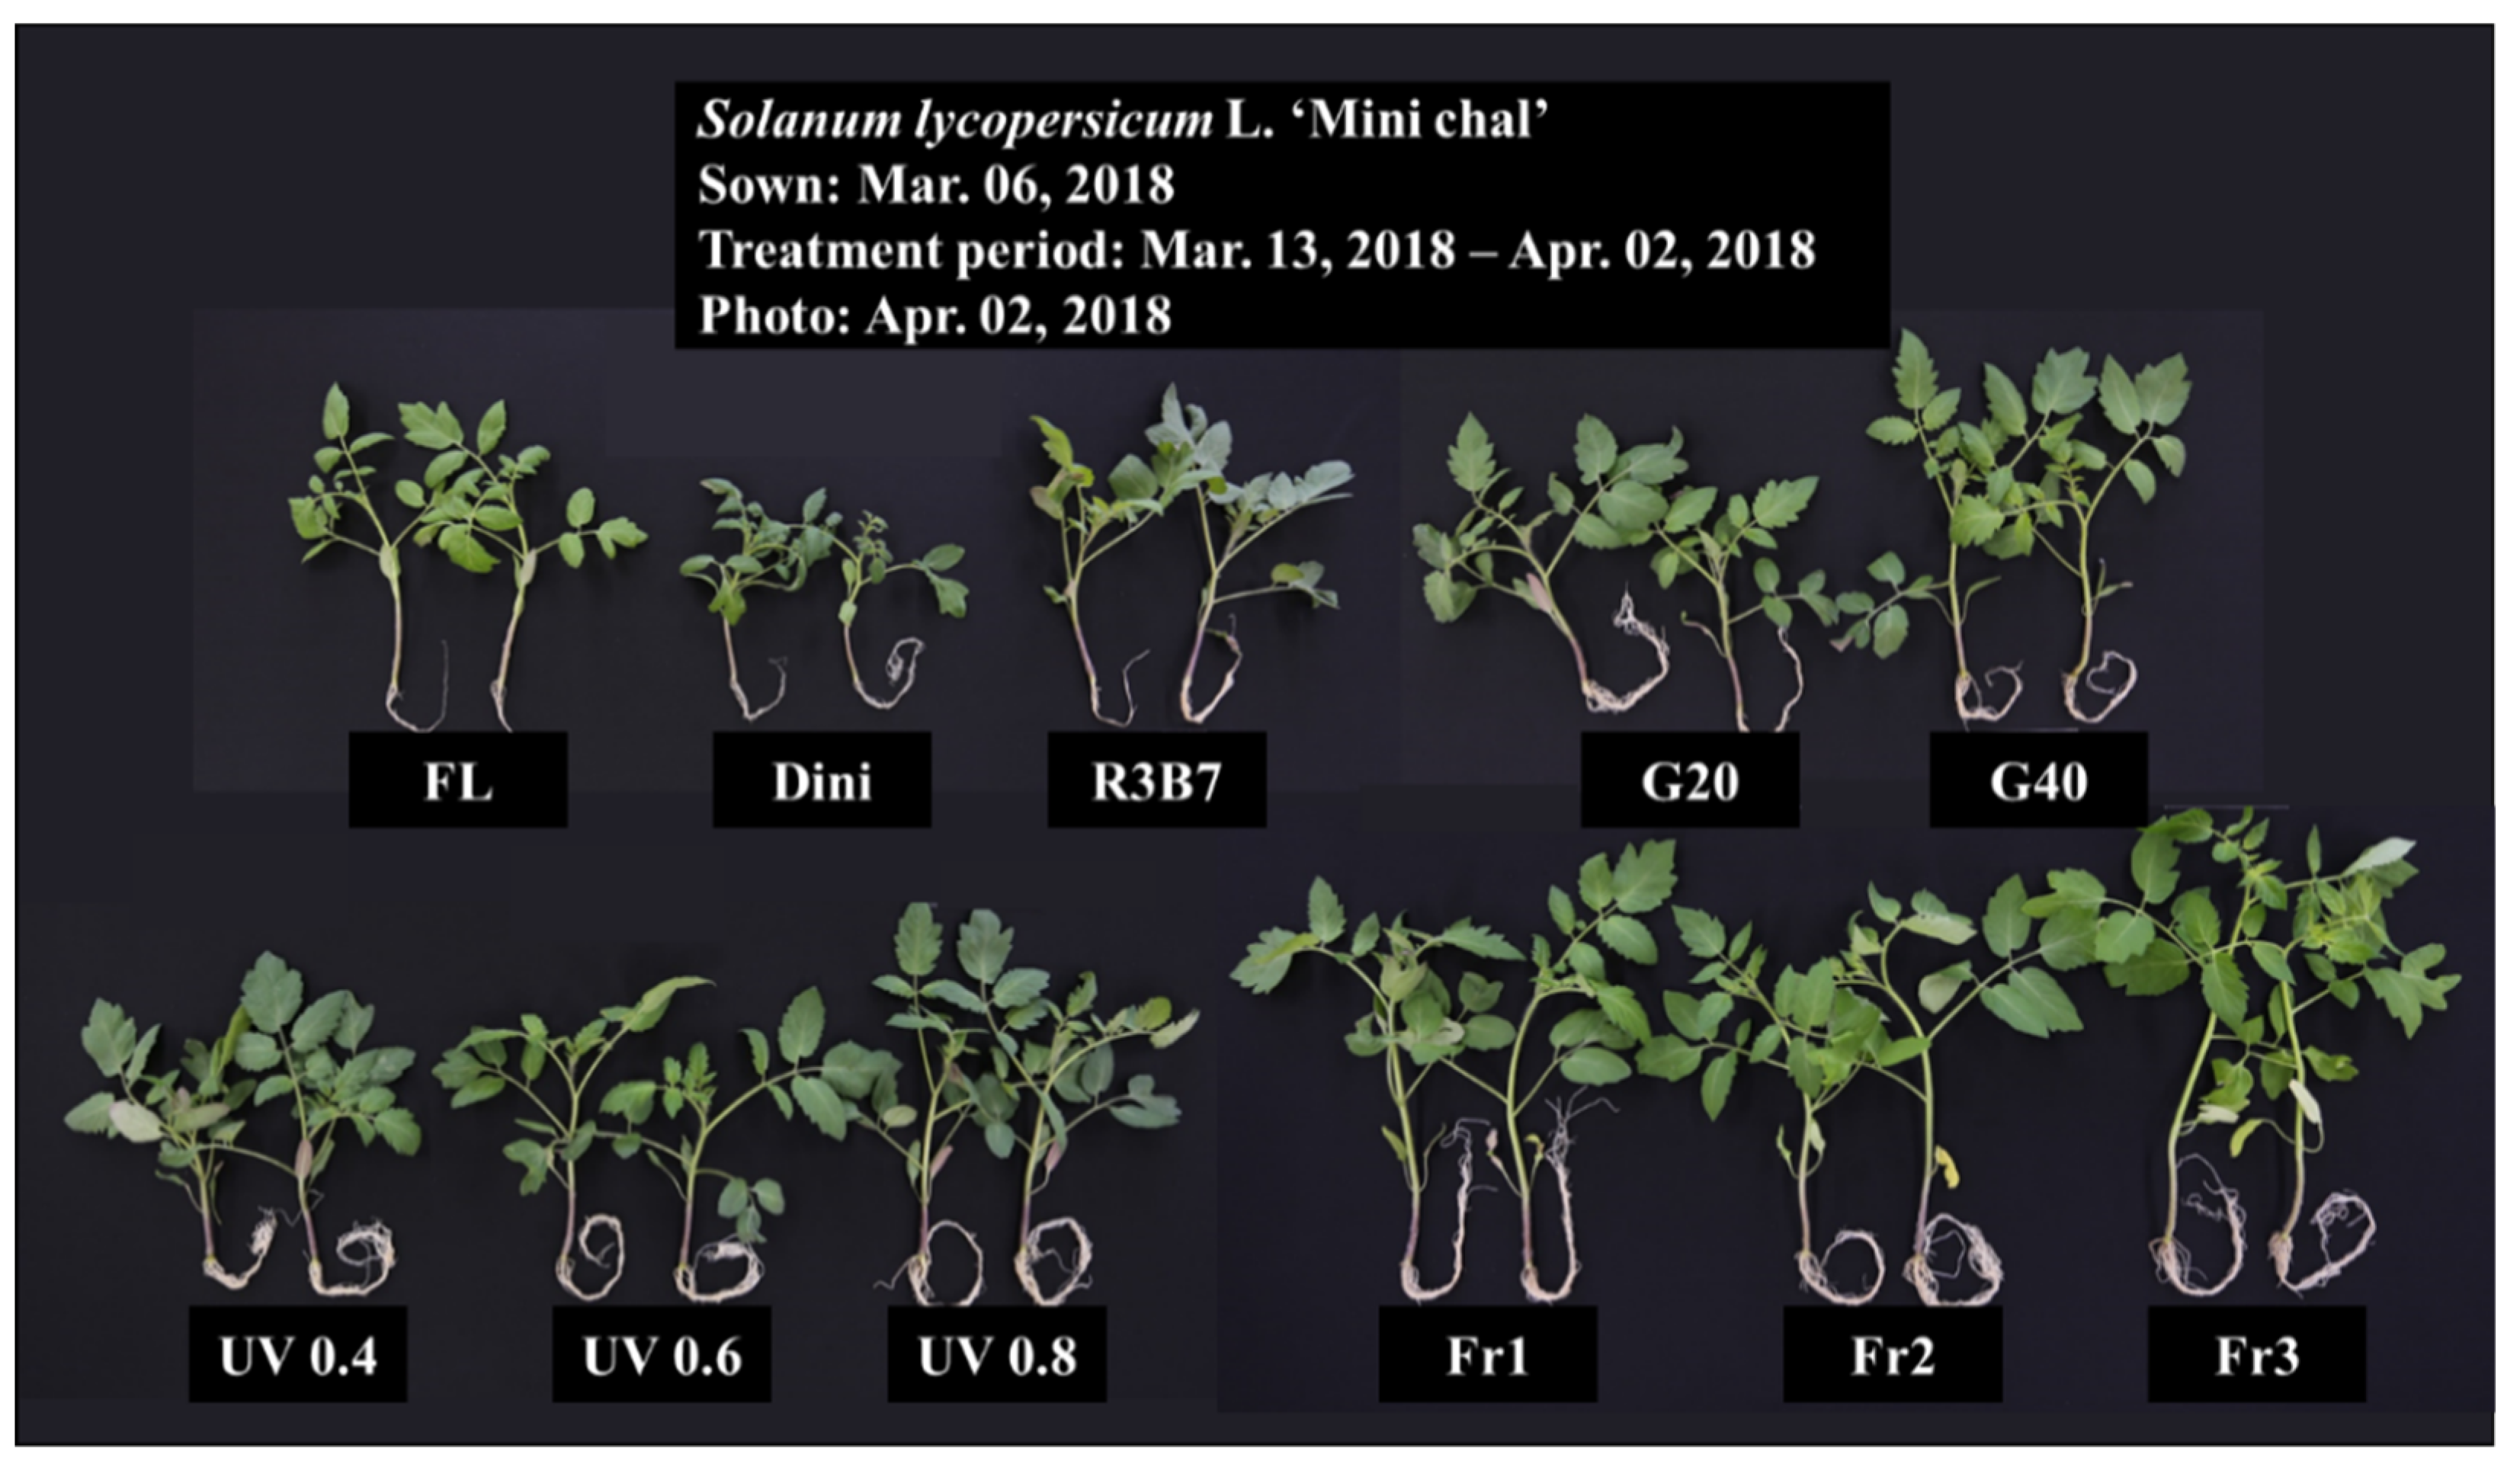
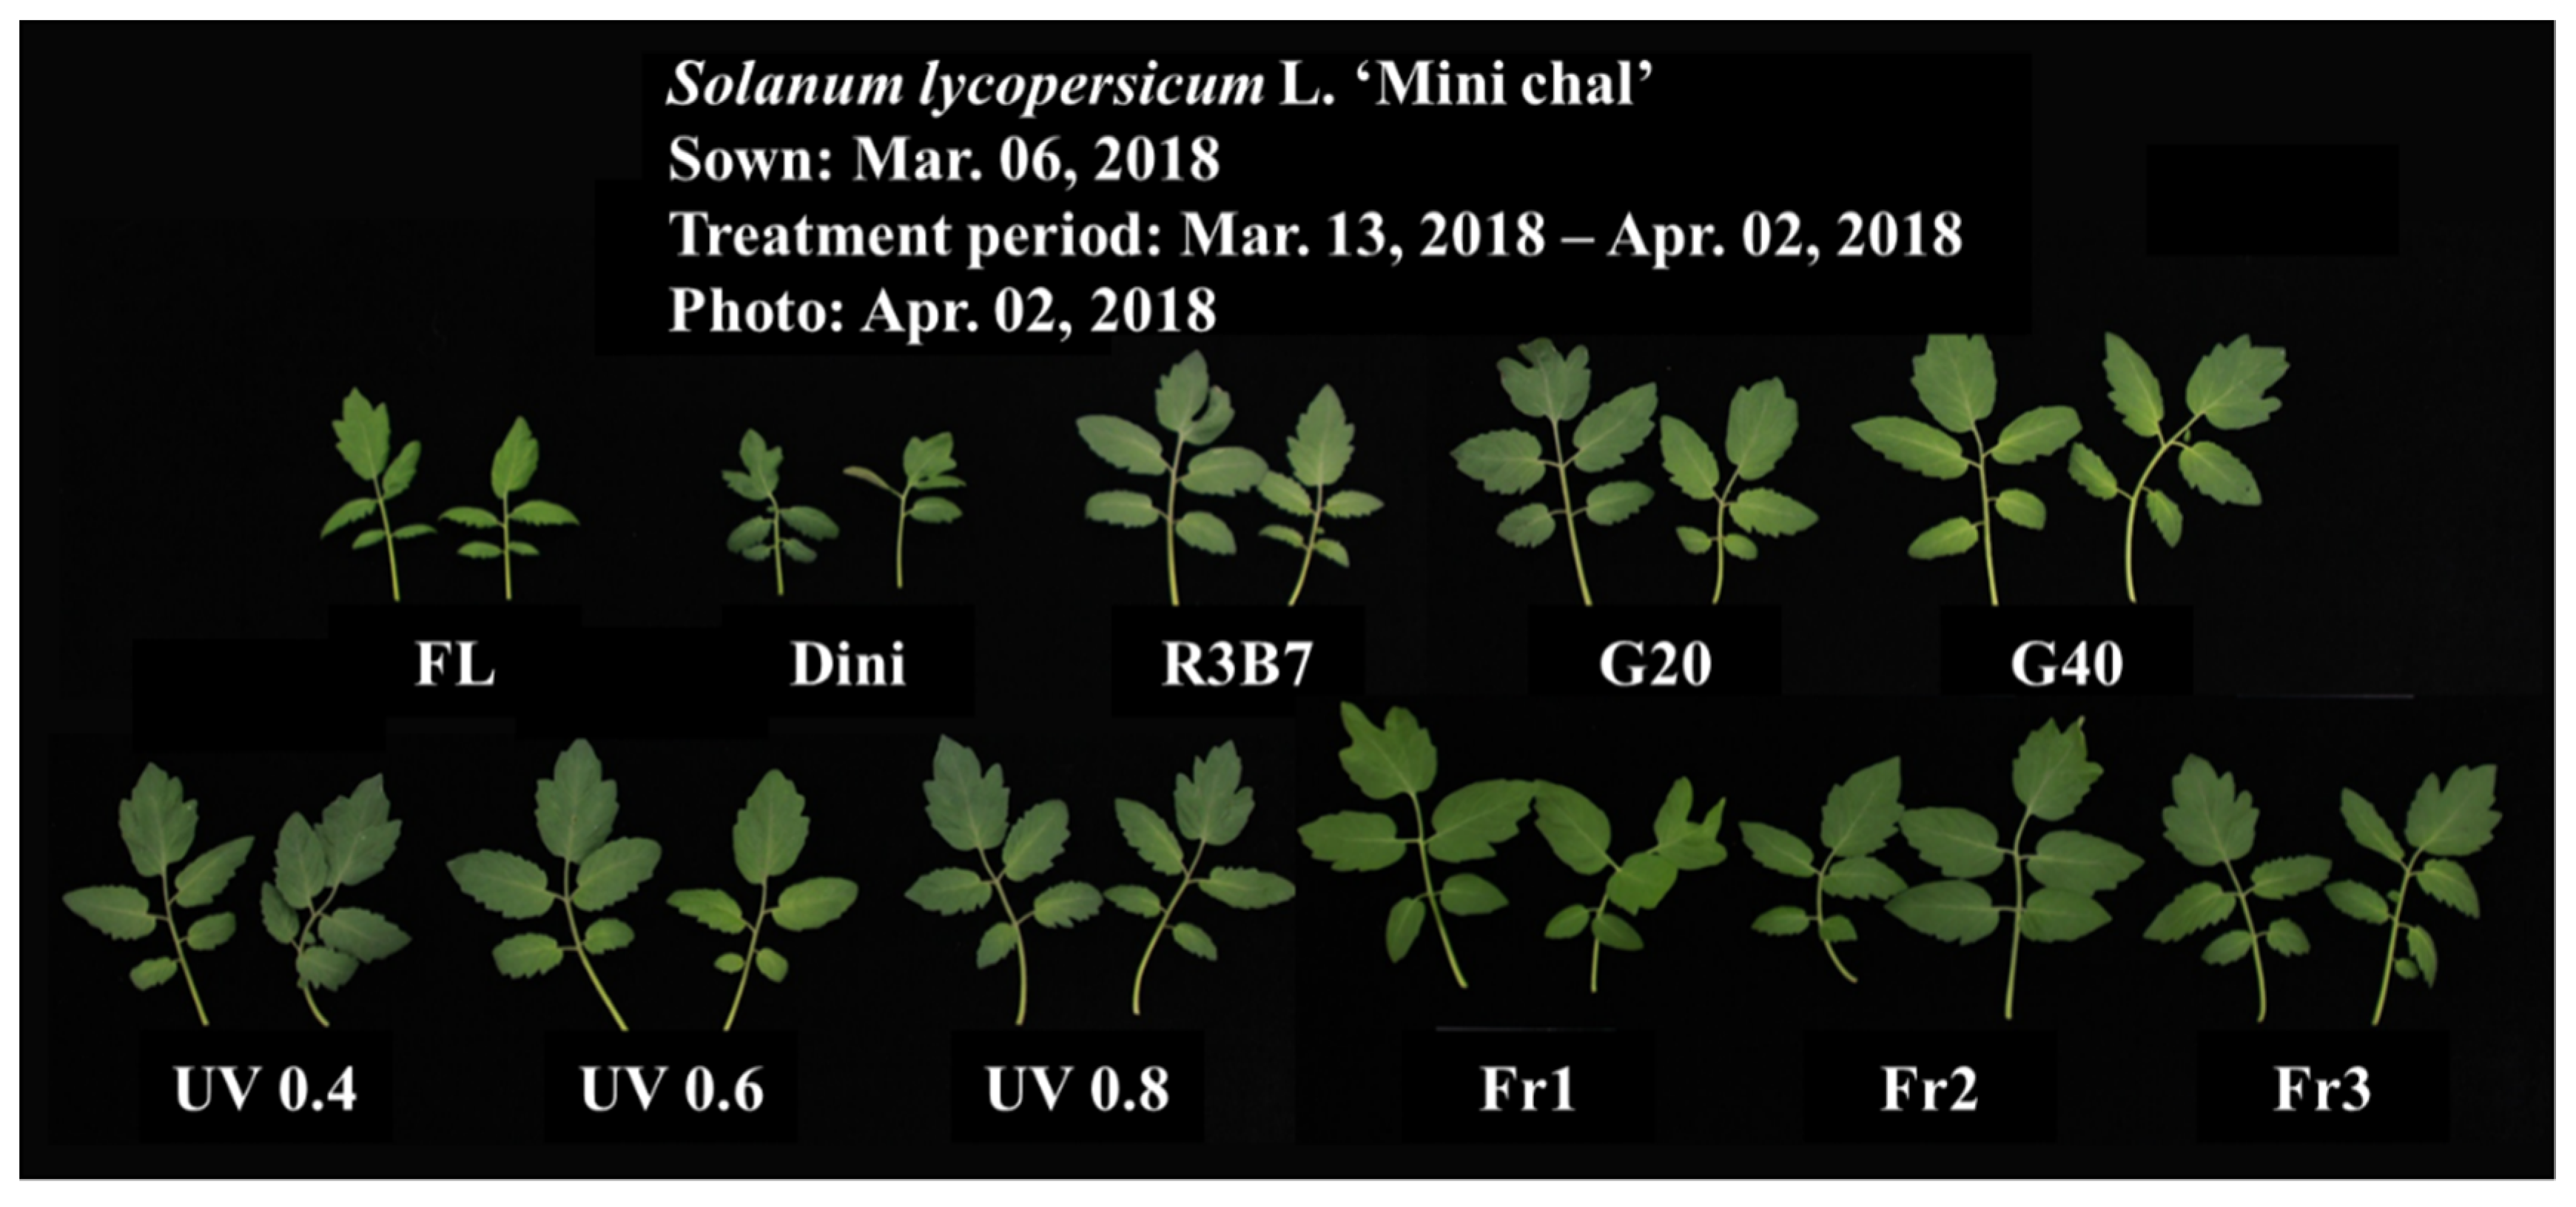
Plant heights grown in UV 0.4 and Dini were the shortest, followed by plants grown in R3B7, while Fr1 produced the tallest plants (Figure 2A and Figure 3). With the exception of G40, adding G or UV-A lights to R3B7 resulted in shorter plants than those in FL. Fr treatments induced stem elongation. Increasing the R/Fr ratio resulted in shorter stems, but the stems were not as short as for plants in the control (FL, Dini or R3B7). Increasing the G light ratio led to increases in the plant height. Seedlings treated with FL or G40 were similar in height, which is thought to be due to the similar PFD between FL and G40. This result indicates that G light does not inhibit plant growth. It is reported that Arabidopsis thaliana seedlings grown under a combination of G, R, and B lights were longer than those grown under monochromatic R or B light [12]. In addition, the hypocotyl length of Arabidopsis thaliana seedlings decreased as the ratio of B/G lights increased in a cryptochrome-dependent manner [28,29]. These observations are in agreement with our results that increasing the G light ratio leads to increases in plant height. B and UV light are absorbed by cryptochrome and phototrophic photoreceptors, and the stimulation of each wavelength is recognized, affecting plant growth through light signal transduction pathways [30,31,32]. B light usually inhibits stem elongation [33,34,35]. Mixed R and B lights were more inhibitive of seedling growth than monochromatic R and B LEDs were [8] or [14] or [36,37]. Therefore, the shortest plant height in tomato plug seedling resulting in R3B7 and UV 0.4 except for Dini are thought to be due to the higher ratio of B light than in other treatments. The light treatments in our study were formed by adding LEDs to 3:7 R:B light combinations. UV-A at a high intensity of 0.6 and 0.8 W·m−2 resulted in taller plants than UV 0.4. It is reported that UV-A induced height increases in some sorghum varieties, in contrast to other varieties [38]. UV-B had the same effect on basil [39]. Additionally, there is substantial variation in the investigated response of different crops to UV-B, which include soybean, wheat, rice, and maize [40,41,42,43,44]. Fr treatments significantly elongated plants compared to other treatments. It is reported that a low R/Fr ratio induced shade avoidance responses in plants [2]. When plants detect a low R/FR ratio, they exhibit shade avoidance characteristics, such as increased stem elongation, reduced stem diameter, and decreased root biomass [45,46]. Our results show decreases in the plant height as the R/Fr ratio increased, which agrees with this report. In addition, it was observed that light treatments without Fr inhibited plant height elongation.
The stem diameter was the greatest for plants in UV 0.6 and Fr treatments, and the smallest for plants in Dini (Figure 2B). UV 0.4 and R3B7 could be suitable light treatments for production of high quality seedlings as they produced short plants with thick stems. Seedlings grown under light environments with added G light had relatively long and thin stems, which are considered bad qualities for seedlings. There was less difference in stem diameters between plants in the UV-A group and those in FL and R3B7. This result indicates that UV-A irradiation does not affect the stem diameter. It is reported that UV-A led to stem biomass accumulation, although there was no mention of the stem thickness [47]. Regardless of the R/Fr ratio, all light treatments with Fr produced plants with thick stems. Combining R and Fr lights has been reported to affect the plant biomass differently compared to combined R and B lights or only R light [48] or [5]. In ‘Mini Chal’ tomato, Fr treatments increased the stem thickness. This result is considered to be due to the fact that the stem is thickened by the rapid growth of the plant by Fr. In this result, stem diameter was much less affected by treatments than plant height. This phenomenon means that various light qualities in plants have more influence on elongation than growth in volume.
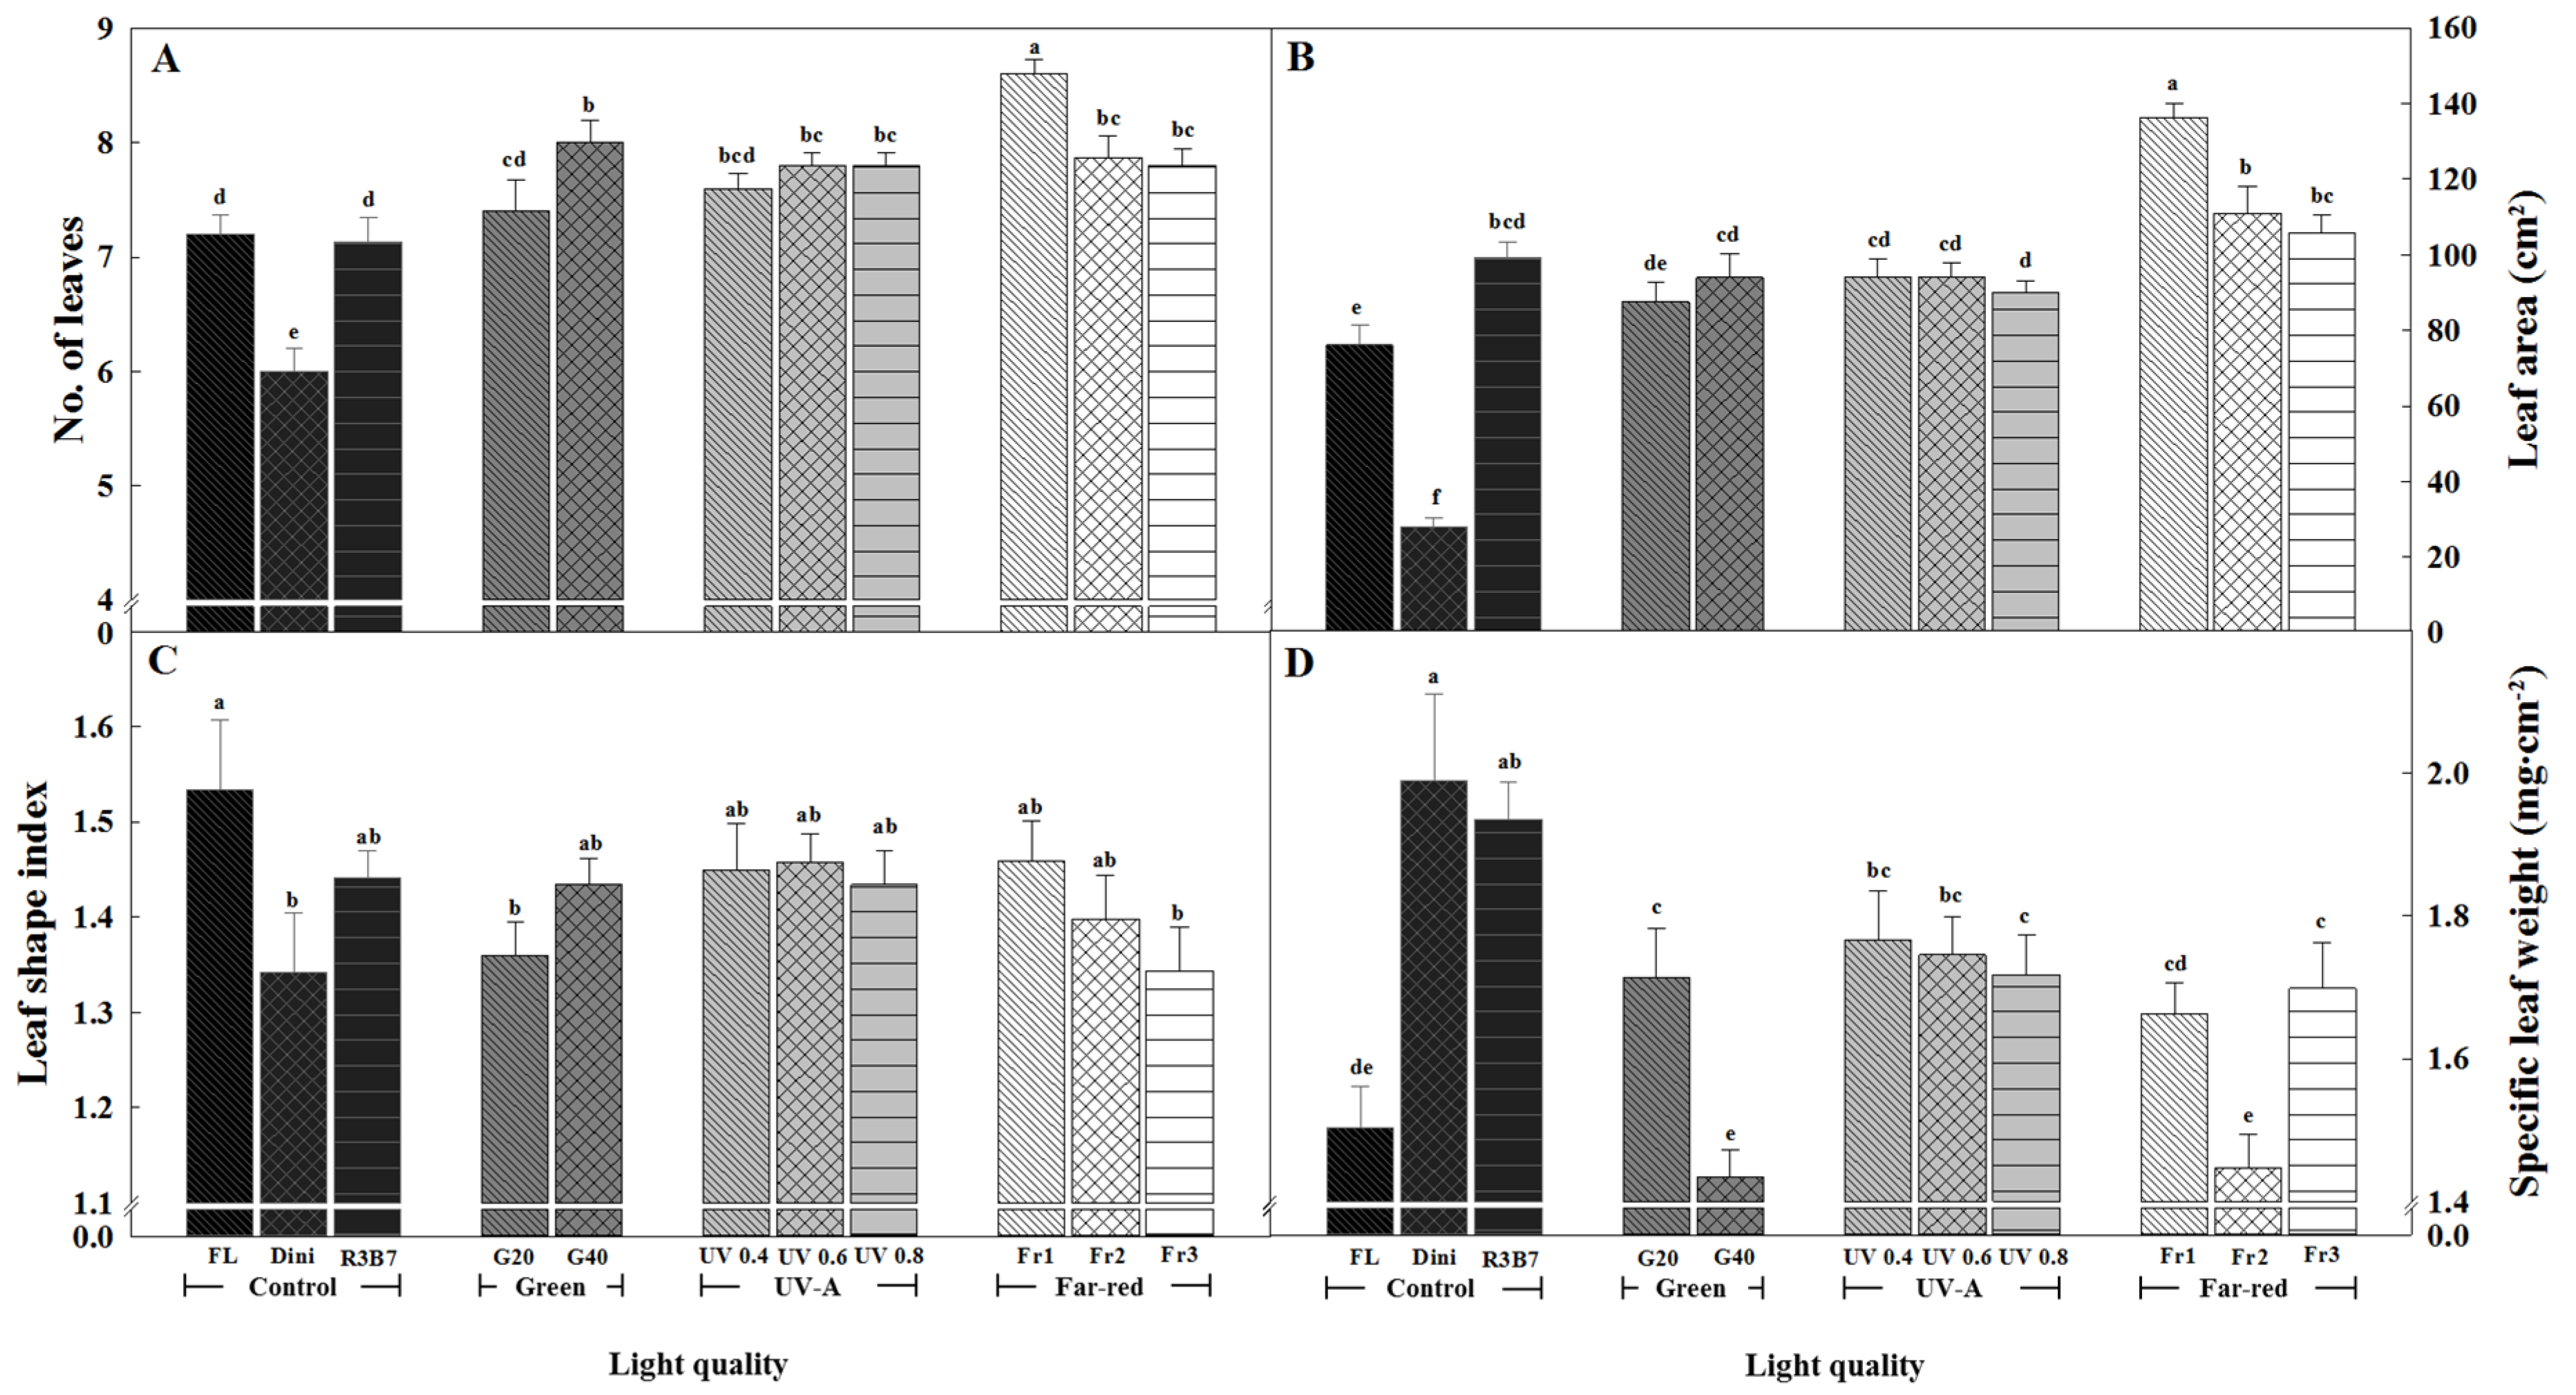
Leaves are responsible for photosynthesis, fixing CO2 and accumulating starch for plant growth [49]. Leaf characteristics, such as the number of leaves, leaf area, leaf shape index, and SLW of tomato plug seedlings measured 21 DAT are presented in Figure 4.
The number of leaves was the highest for plants in Fr1, and the lowest for plants in Dini, followed by FL and R3B7 (Figure 4A). The number of leaves was positively correlated to the G light ratio. The UV-A group produced plants with more leaves than the control group, and there were no significant differences among plants in different UV-A treatments. These increases in the number of leaves are similar to those of cucumber, tomato, and hot pepper plug seedlings treated with UV-B [50], as well as basil [39]. It is reported that a low R/Fr inhibited bud outgrowth and reduced branching in many species [51]. However, there are other studies that report that bud outgrowth timing has not been affected by a low R/Fr ratio in many species [52,53,54,55,56]. Therefore, growth responses to Fr vary according to the plant. In this study, it was observed that a lower R/Fr resulted in a higher number of leaves.
The leaf area was the greatest for plants grown in Fr1 and the lowest for plants grown in Dini. The number of leaves for plants in Fr2 and Fr3 were similar to that of plants in G and UV-A groups, but the total leaf area was greater. The leaf growth response of dicotyledonous species to R/Fr significantly varies, and it depends on the phytochrome genes PhyB and PhyD that absorb R and Fr lights [57,58,59]. The leaf area of plants in G, UV-A, and Fr treatments was greater than that for plants in FL and Dini. The leaf area of plants in G and UV-A treatments was similar to that of plants in R3B7, indicating that UV-A does not significantly affect the leaf area. The wide leaves observed in the UV-A treatments are thought to be the result of combined R and B lights because R3B7 produced similarly wide leaves in seedlings. It was found that UV-A increases the total leaf area in Glycine max and some Sorghum bicolor varieties [38] or [47]. It is thought that this response to UV-A is mediated by cryptochromes that absorb B/UV and play a role in shade avoidance [60]. However, in our results, the different intensities of UV-A did not change the leaf area.
The shape, size, and thickness of leaves are plastically changed by the light environment [61,62,63]. The leaf shape index was the highest for plants in FL and the lowest for plans in Dini, G20, and Fr3 (Figure 4C and Figure 5). A higher leaf shape index value indicates a longer leaf shape, and a lower value indicates a squatter leaf. G40 produced seedlings with longer and narrower leaves than G20 did. In green leaf lettuce, a high G light ratio (40%) added to a 5:5 R and B LED environment resulted in high leaf shape index values, while a low G light ratio (20%) resulted in the lowest index value [64]. These results are similar with our result, and the relationship between changes in the leaf shape and G light is not yet clear. There were no differences in the leaf shape between seedlings in UV-A and R3B7. A high R/Fr ratio induced the formation of wide, short leaves.
The SLW was presented to indicate the leaf thickness. If the leaves are wide and thin, gas exchange (CO2, O2, and H2O) is promoted, but it dries quickly. Therefore, the leaves should be wide and thick. Therefore, leaf thickness is important for increasing the water availability in plants [49]. The SLW was the greatest for seedlings in Dini, followed by those in R3B7, and the lowest for plants in G40 and Fr2. The results demonstrated that the SLW is inversely proportional to the ratio of G light. It was reported that G light added to mixed R and B lights induces plant architecture as if it were grown under the shade. The SLW of Arabidopsis thaliana was lower for plants in shade than for those in light [65]. G light also actively promotes cell division, thereby increasing leaf expansion. As a result, G light is more effective in widening leaves than thickening them [66]. The SLW decreased with increasing UV intensity. It was reported that UV-A irradiation of Phyllanthus tenellus increased the thickness of the palisade parenchyma and abaxial epidermis, but not of the spongy mesophyll and adaxial epidermis [67]. Our results show the opposite result, where leaf thickness decreases at UV-A intensities exceeding 0.6 W·m−2. Despite cucumber and hot pepper seedlings treated with UV-B treated 10 times every 2 days for 90 min immediately after sunset seeing increased leaf thickness, tomato plants did not see the same increases [50]. These results are thought to be characteristic of tomato crops. Compared to R3B7, Fr treatments reduced the leaf thickness of seedlings. It is reported that R/Fr ratios of 0.7 and 1.3 decreased the leaf thickness of Phaseolus vulgaris [68]. High R/Fr ratios resulting in thinner leaves have been widely reported [68] or [69,70,71]. Therefore, it is consistent that Fr decreased the leaf thickness in ‘Mini Chal’ tomato.
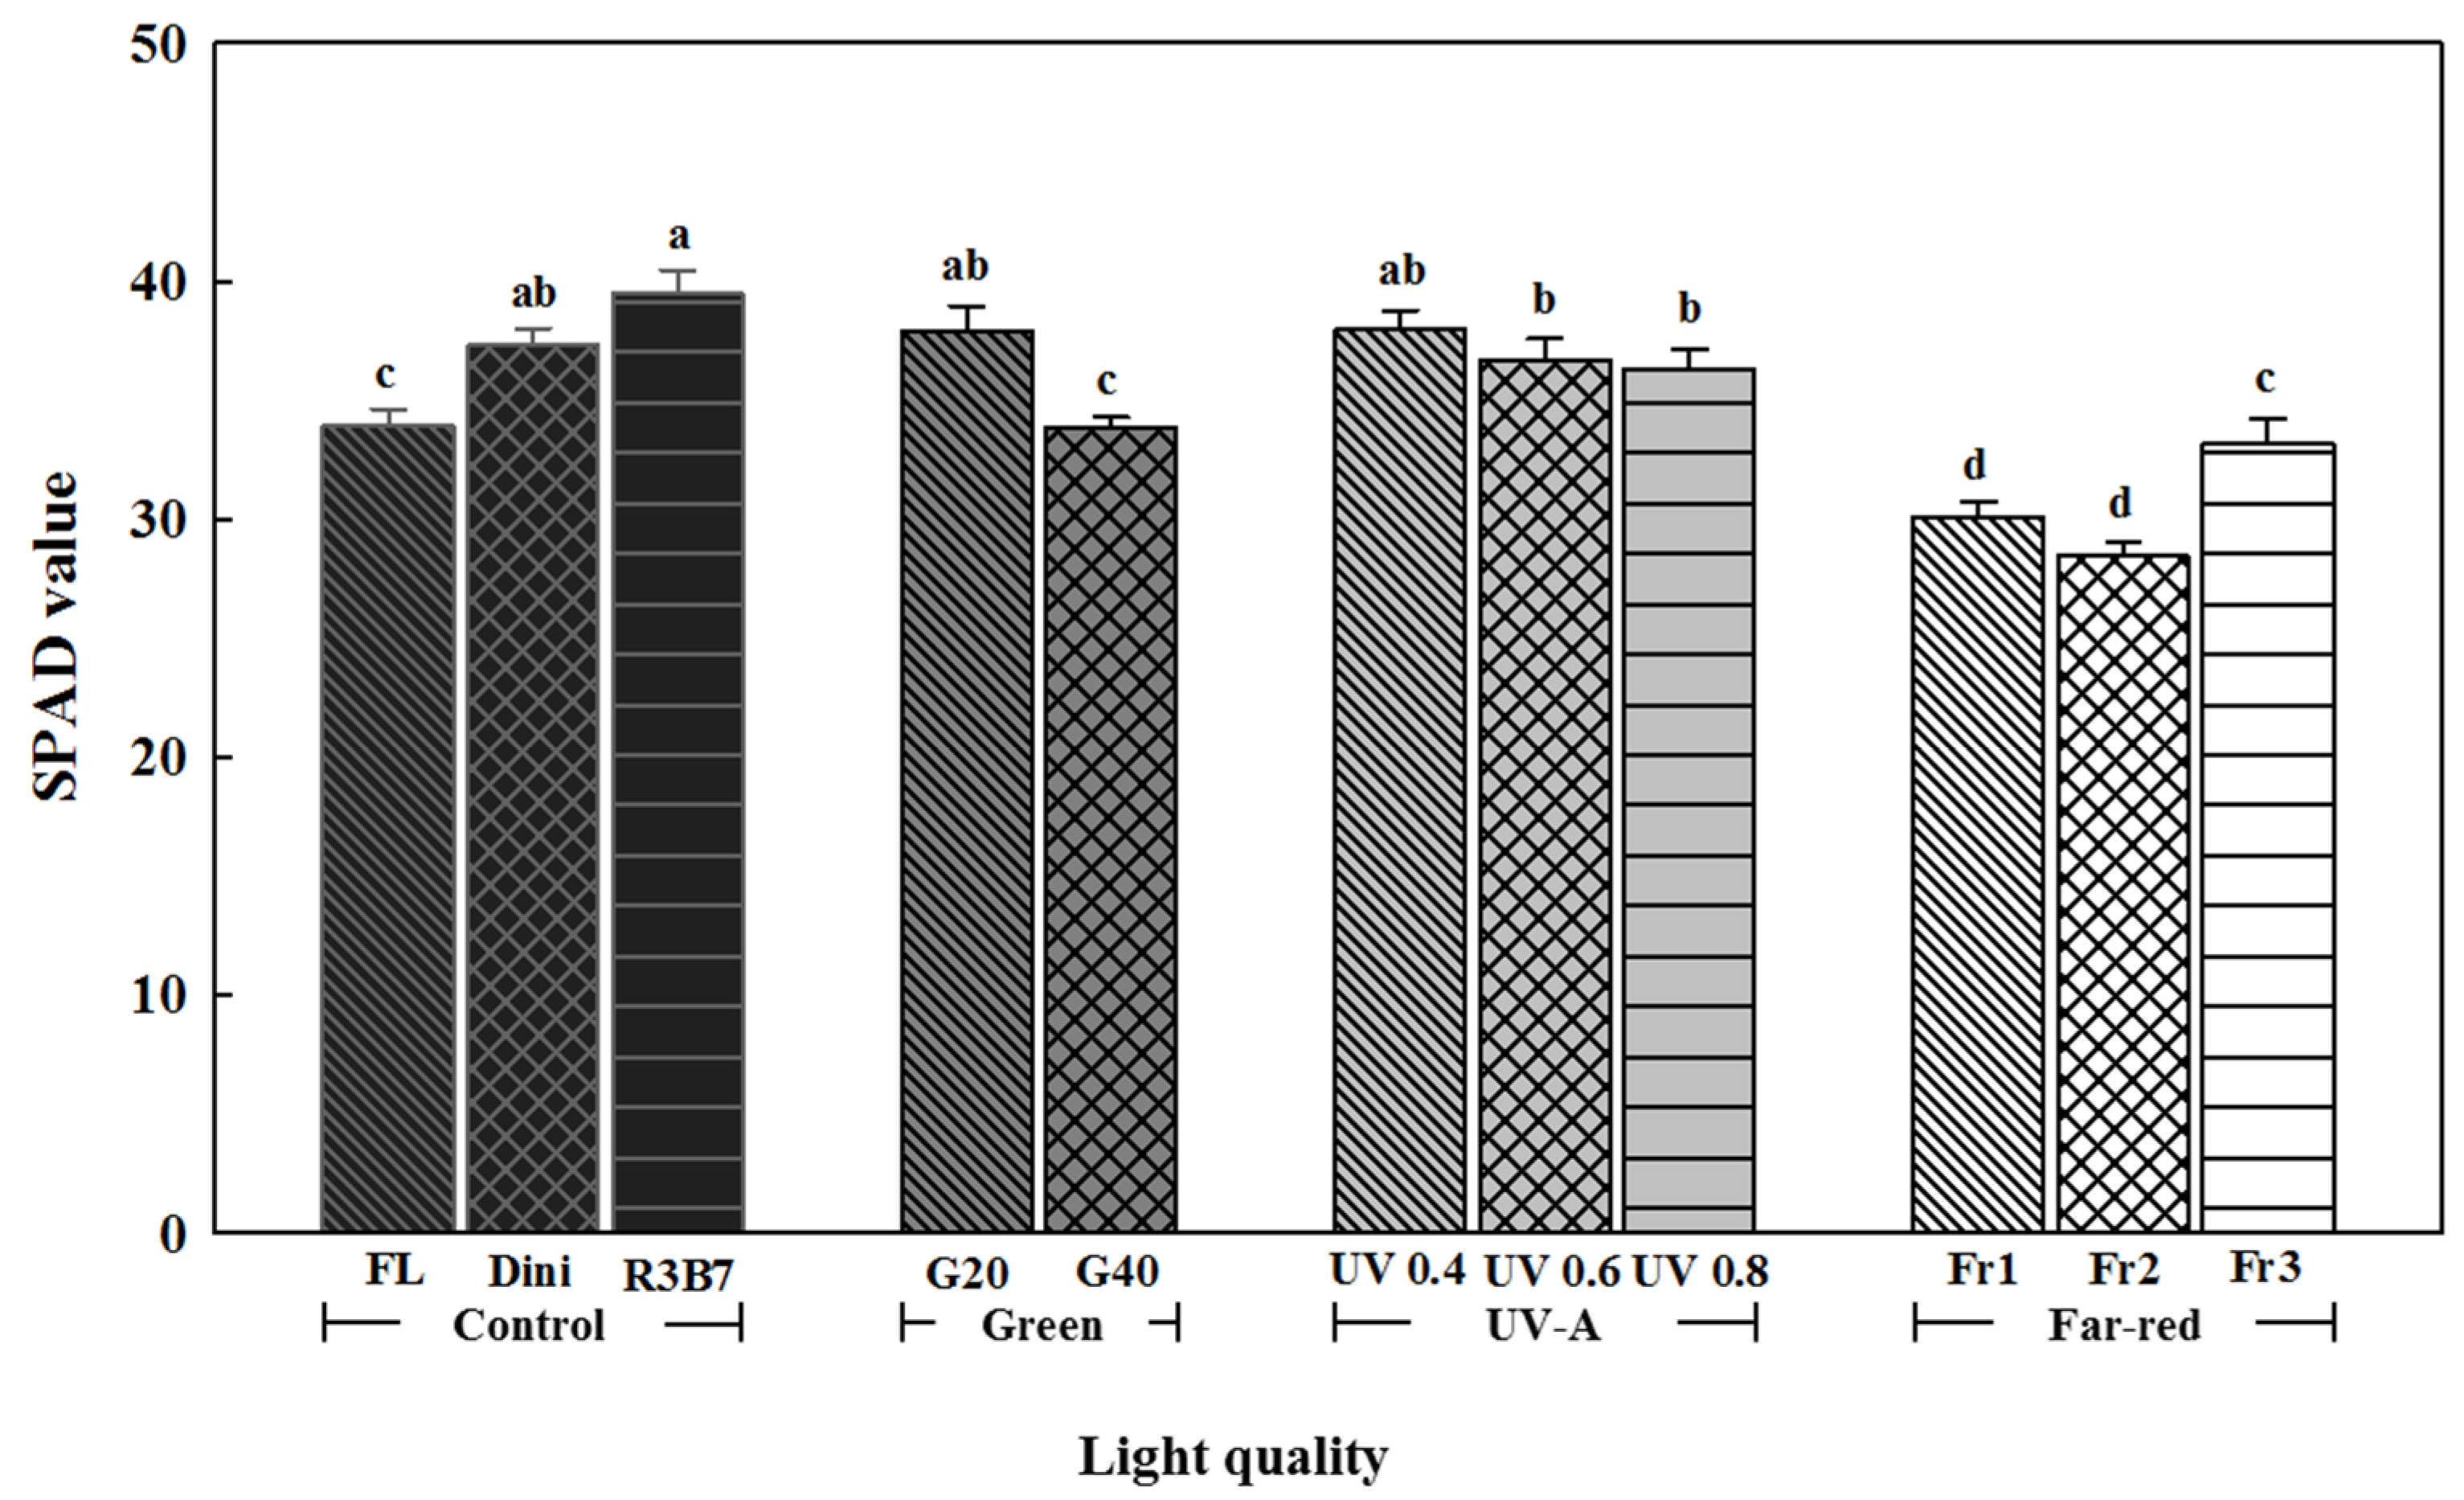
The SPAD value often correlated with actual chlorophyll content. Therefore, it is usually used as an index to represent the chlorophyll content of leaves, and was the highest for plants in R3B7 and the lowest for plants in Fr1 and Fr2 (Figure 6). It is known that B light stimulates the biosynthesis of pigments, such as chlorophyll [72,73]. Studies report that mixed R and B lights enhanced the chlorophyll content [74,75]. As the ratio of G light increased, the SPAD value decreased. In two cultivars of lettuce, monochromatic G LEDs decreased the SPAD value [31]. Warm-white LEDs with a high percentage of G light reduced the SPAD value in young Phalaenopsis and Doritaenopsis plants [76]. This seems to be related with the leaf thinning induced by high G ratio light environments. The SPAD value of plants in UV-A was higher than that of plants in FL but lower than that of plants under R3B7. As the UV intensity increased, the SPAD value decreased. Chlorophyll destruction and biosynthesis inhibition were reported to be typical of UV-B damage [77]. UV-B irradiation to rice and gourd decreased the chlorophyll content, which was similar to our results [77,78]. The low ratio of R/Fr reduced the SPAD value. Fr1 and Fr2 had the lowest SPAD values. These results were considered to be due to large and thin leaves as seedlings grow rapidly by a low R/Fr ratio (Figure 4B,D).
Fr1 produced seedlings with the greatest fresh and dry weights, while Dini led to the lowest fresh and dry weights (Table 2). This is because seedlings in Fr1 had the longest plant height and the widest leaves, while seedlings in Dini had the shortest plant height and narrowest leaves (Figure 2A and Figure 4B). The Fr induction of stem elongation and leaf expansion led to the higher fresh weights of seedlings in Fr. Seedlings grown in R3B7 were similar in plant height to those in Dini, G20, and UV 0.4, but were heavier in stem fresh weight. Seedlings in R3B7 also had similar leaf area and higher SLW than seedlings in Fr2 and Fr3 (Figure 4B,D), but were heavier in fresh and dry weight of leaves. Seedlings grown in G and UV-A had similar fresh weight of stems as seedlings grown in R3B7, but the fresh weight of leaves differed because the leaf area and SLW were lower for seedlings in G and UV-A than for seedlings in R3B7. The dry weight showed similar tendencies as the fresh weight in our study. Studies using hot pepper, sowthistle, and ice plant have also shown these results [31] or [79,80].
Previous research has defined high quality seedlings to have a high dry matter content and low shoot/root ratio, high specific leaf area, and short hypocotyl length [81]. The compactness of a seedling indicates the degree of seedling quality and is calculated by dividing the shoot dry weight by the plant height. Therefore, if a plant is short and has a high dry weight, it has a high compactness. Dry matter content was the greatest for seedlings in R3B7 and the lowest for seedlings in FL, G40, and Fr2 (Figure 7A). Compactness was the greatest for plants in R3B7 and UV 0.4, and the lowest for plants in Dini (Figure 7B). Both the dry matter content and compactness were superior for seedlings in R3B7. As the ratio of G light increased, the dry matter content and compactness decreased. The dry matter content and compactness of plants in G40 were similar to those of plants in FL. Therefore, these results indicated that longer plant height and lower dry weight of shoot by higher G ratio compared to R3B7 resulted in low compactness (Figure 2A and Table 2). High intensity UV-A decreased the dry matter content and compactness. These results suggest that the lower dry weight of total shoot by higher UV-A intensity resulted in negative effects in dry matter content and compactness (Table 2). At a high R/Fr ratio, dry matter content was similar to that of plants in FL or Dini but lower than that of plants in R3B7. Although the fresh and dry weights of seedlings in Fr2 were higher than those of seedlings in FL, the dry matter content was similar between seedlings in Fr2 and FL. These results indicate that Fr affects the growth of plant biomass rather than dry matter content accumulation. As a result, dry matter content and compactness showed great tendency in R3B7.
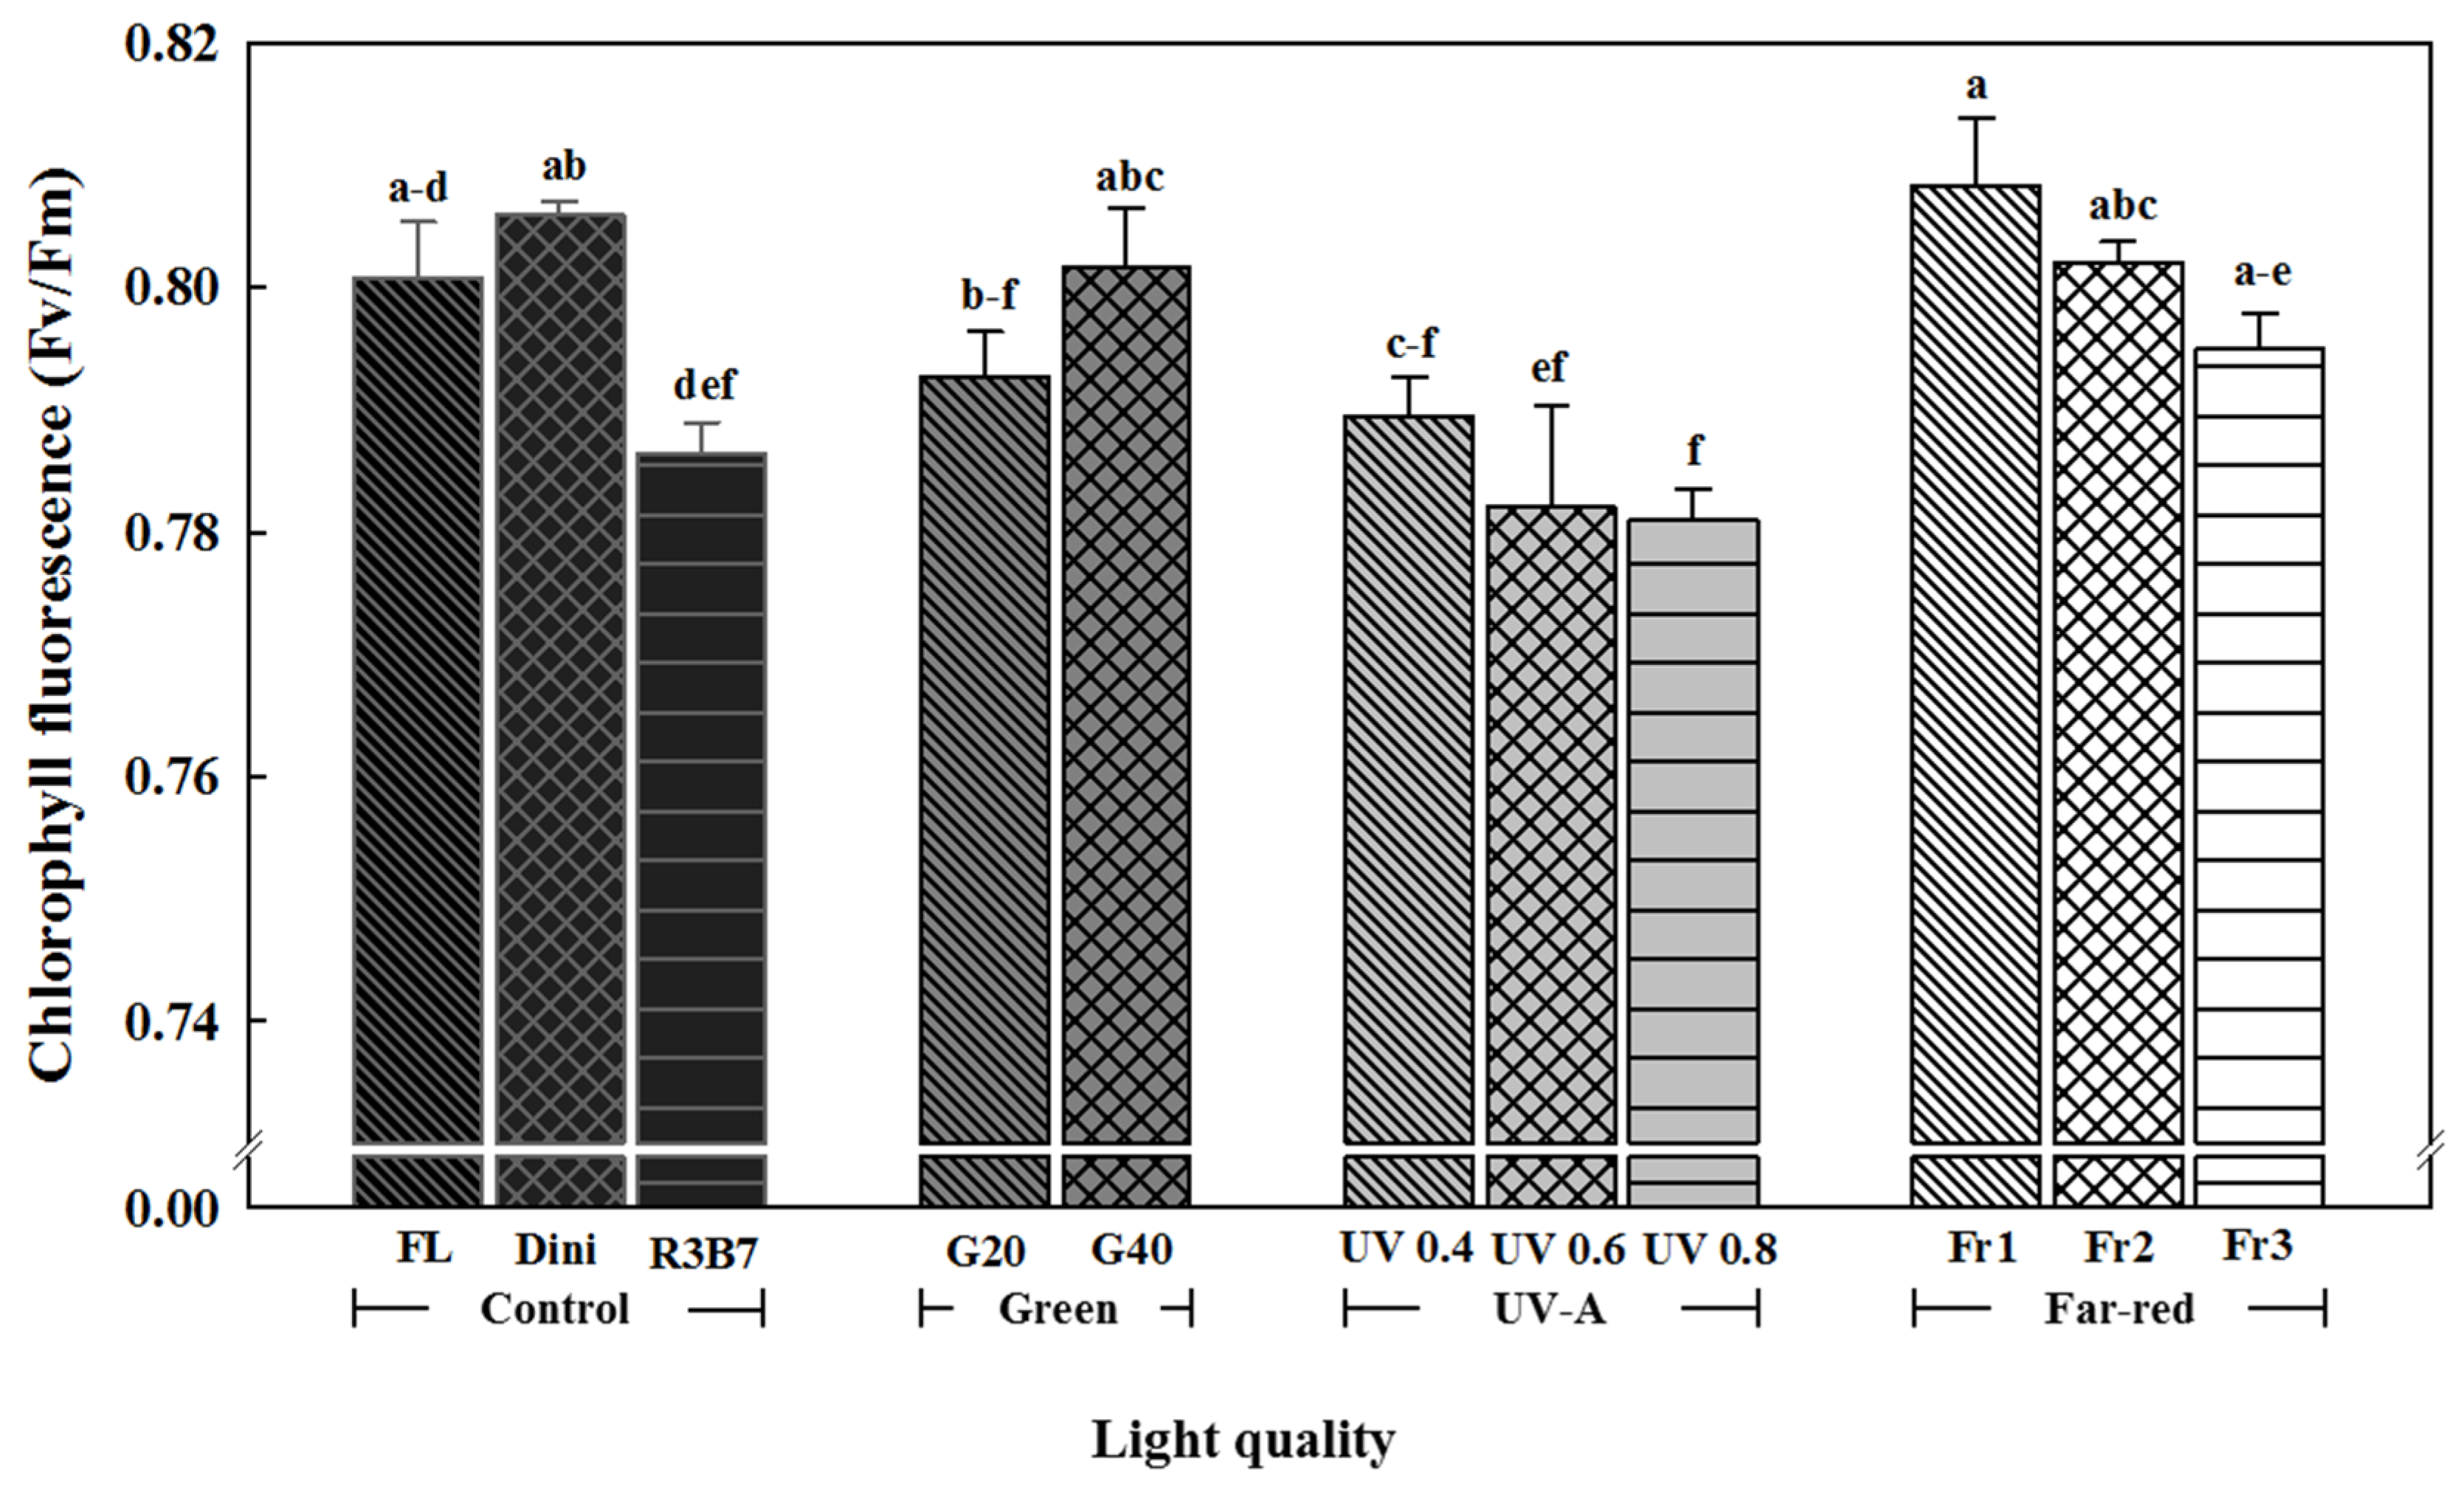
The chlorophyll fluorescence value (Fv/Fm) is an index of the stress on photosynthetic tissues of plants [82]. The Fv/Fm value of 0.83 indicates that the plant is healthy [83]. Chlorophyll fluorescence analysis is to analyze the physiological state of plants using a non-destructive method. It can analyze the effects of various environmental stresses on the photosynthetic tissues of plants [82]. Higher chlorophyll fluorescence value means more efficiency for the photosynthesis and transportation of sugar into the plant [84]. When plants are exposure to extreme stresses, PS II activity is decreased and the Fv/Fm value decreases by photoinhibition [85,86,87]. Chlorophyll fluorescence was the greatest for plants in Fr1 and the lowest for plants in UV 0.8 (Figure 8). The Fv/Fm value increased with increasing G light. These results show that the ratio of B light in R3B7 is the highest, and it is thought that plants are the most stressed in R3B7 treatment due to the high energy of B [31,32] or [88]. This phenomenon was similar in other crops such as ice plant, Phalaenopsis, and lettuce [32] or [89,90]. Plants in all UV-A treatments had low Fv/Fm values. UV usually has a shorter wavelength and higher energy than B light; therefore, seedlings obtained more light stress when irradiated with UV-A light of a higher intensity [31,32] or [88]. As a result, it was confirmed that UV-A contributes to the stress of tomato plug seedlings. Low R/Fr ratio induced a higher Fv/Fm value in plants than R3B7. These results were similar to those of chlorophyll fluorescence 11 days after treatment in lettuce treated with R/Fr ratios of 0.7, 1.2, 4.1 and 8.6 [91].
3.2. Development of Tomato Plants after Transplanting
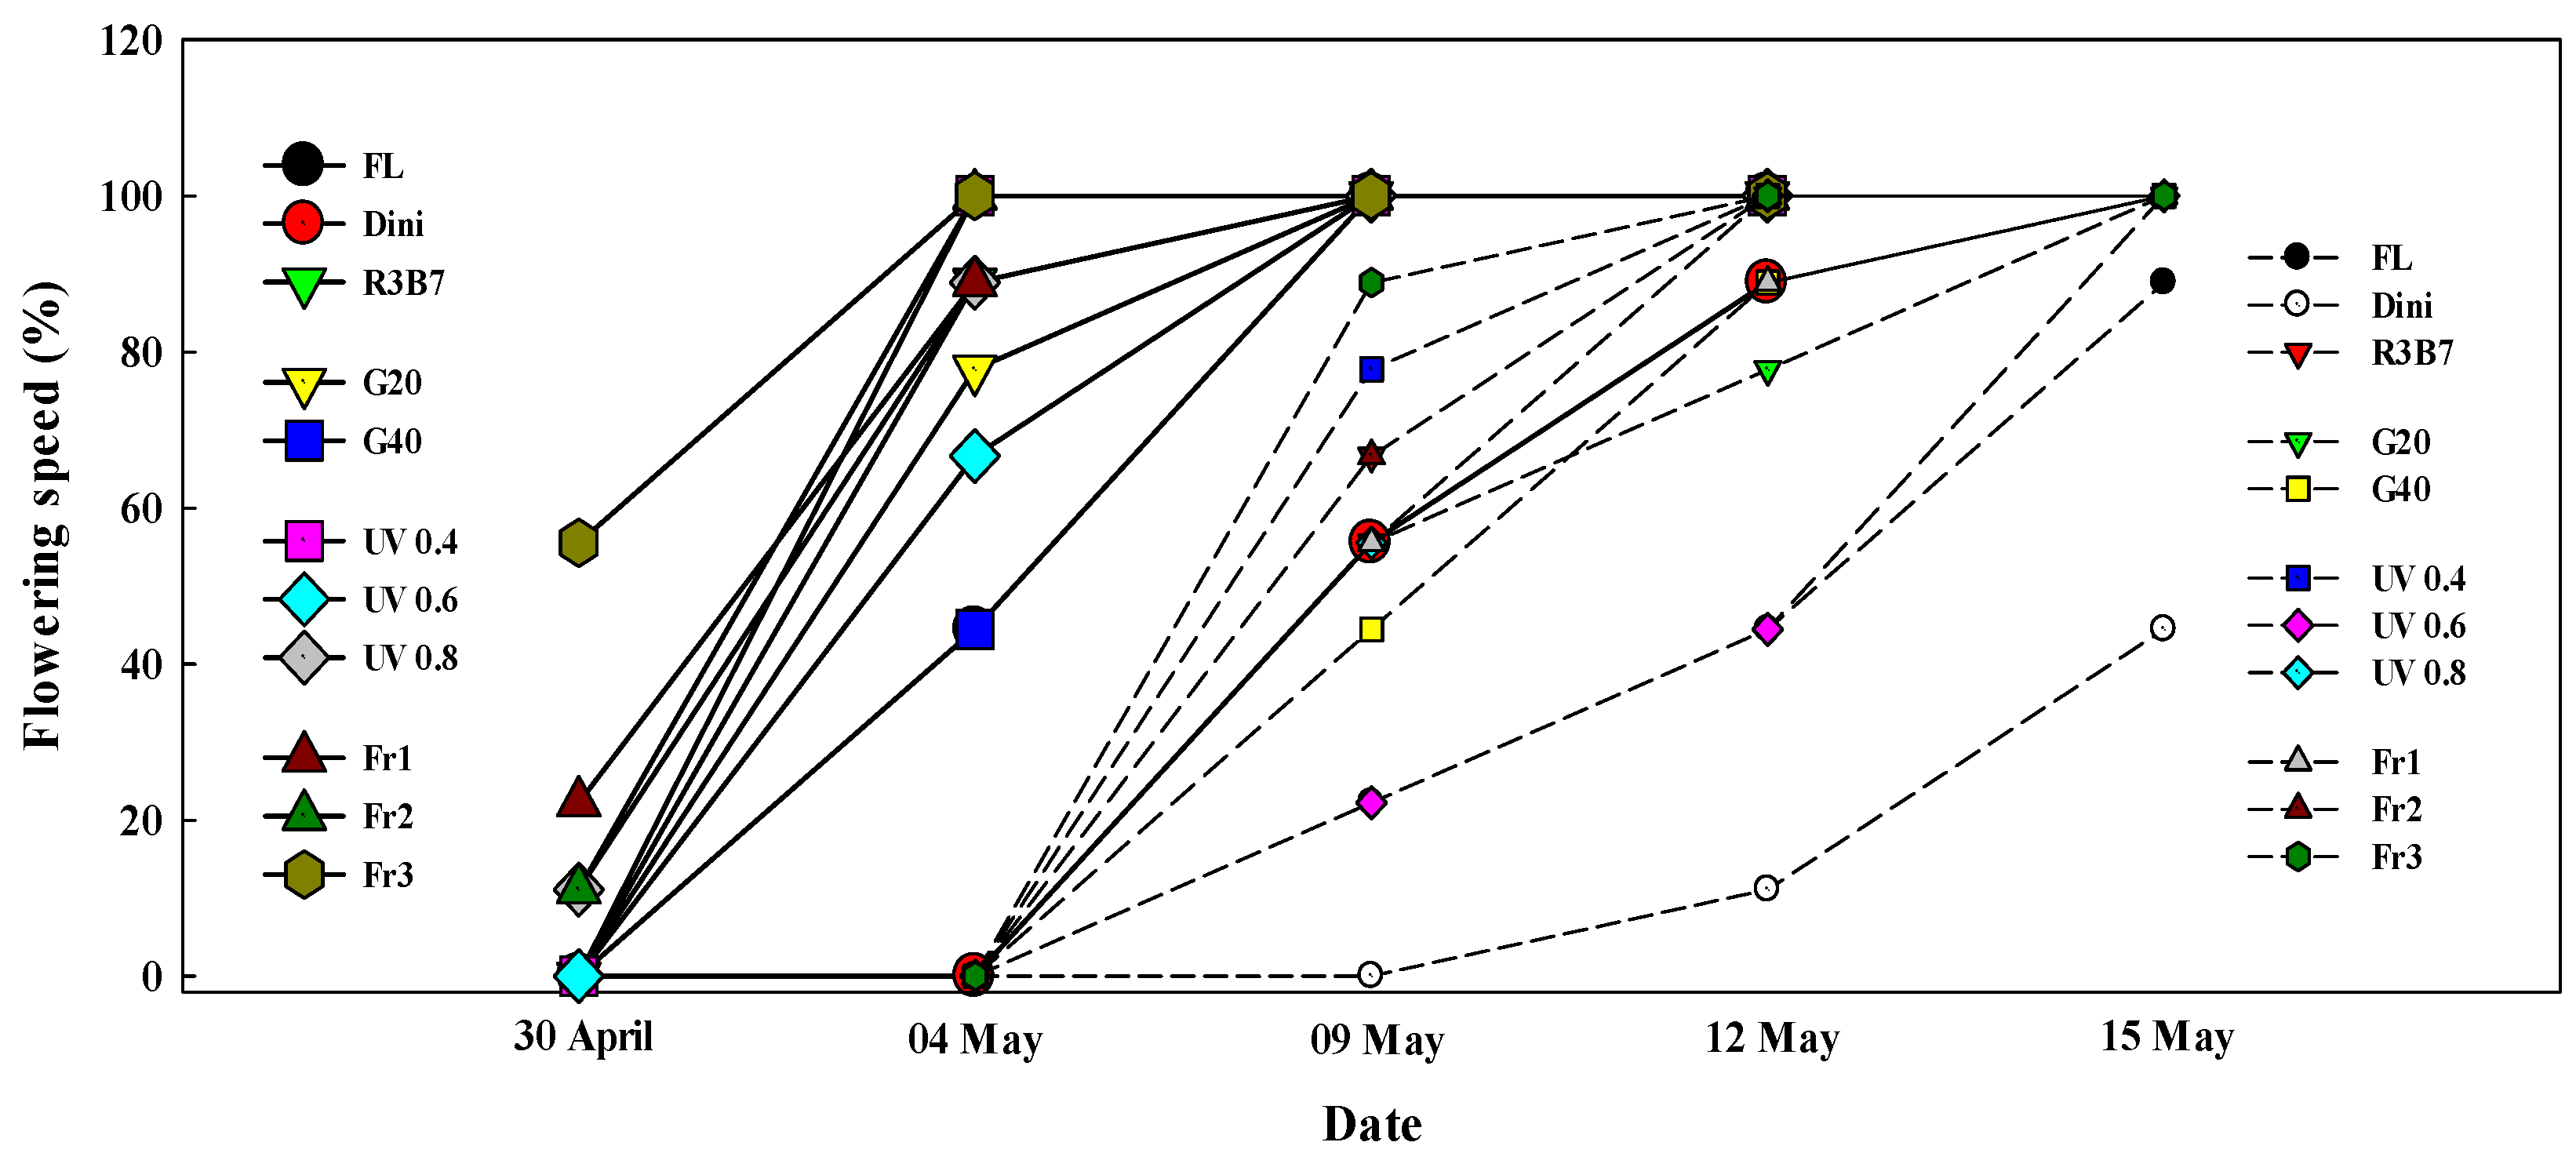
The flowering speed of tomato affected by different light qualities after transplanting is presented in Figure 9. The flowering speed of the first flower cluster was high in Fr1, Fr3, and UV 0.4. In the second flower cluster, flowering speed was high in R3B7, UV0.4, Fr2, and Fr3. Flowering was the most delayed in Dini. One notable point was that Fr treatments accelerated flowering when plants in Fr treatments had less dry matter content and lower compactness compared to plants in R3B7. UV-B treatments delayed flowering initiation in Vigna radiata L. Wilczek cv. KM-2 because plants got stressed [92,93,94]. However, in our study, UV 0.4 induced faster flowering than the other treatments, which is thought to be due to the low intensity of UV-A in UV 0.4.
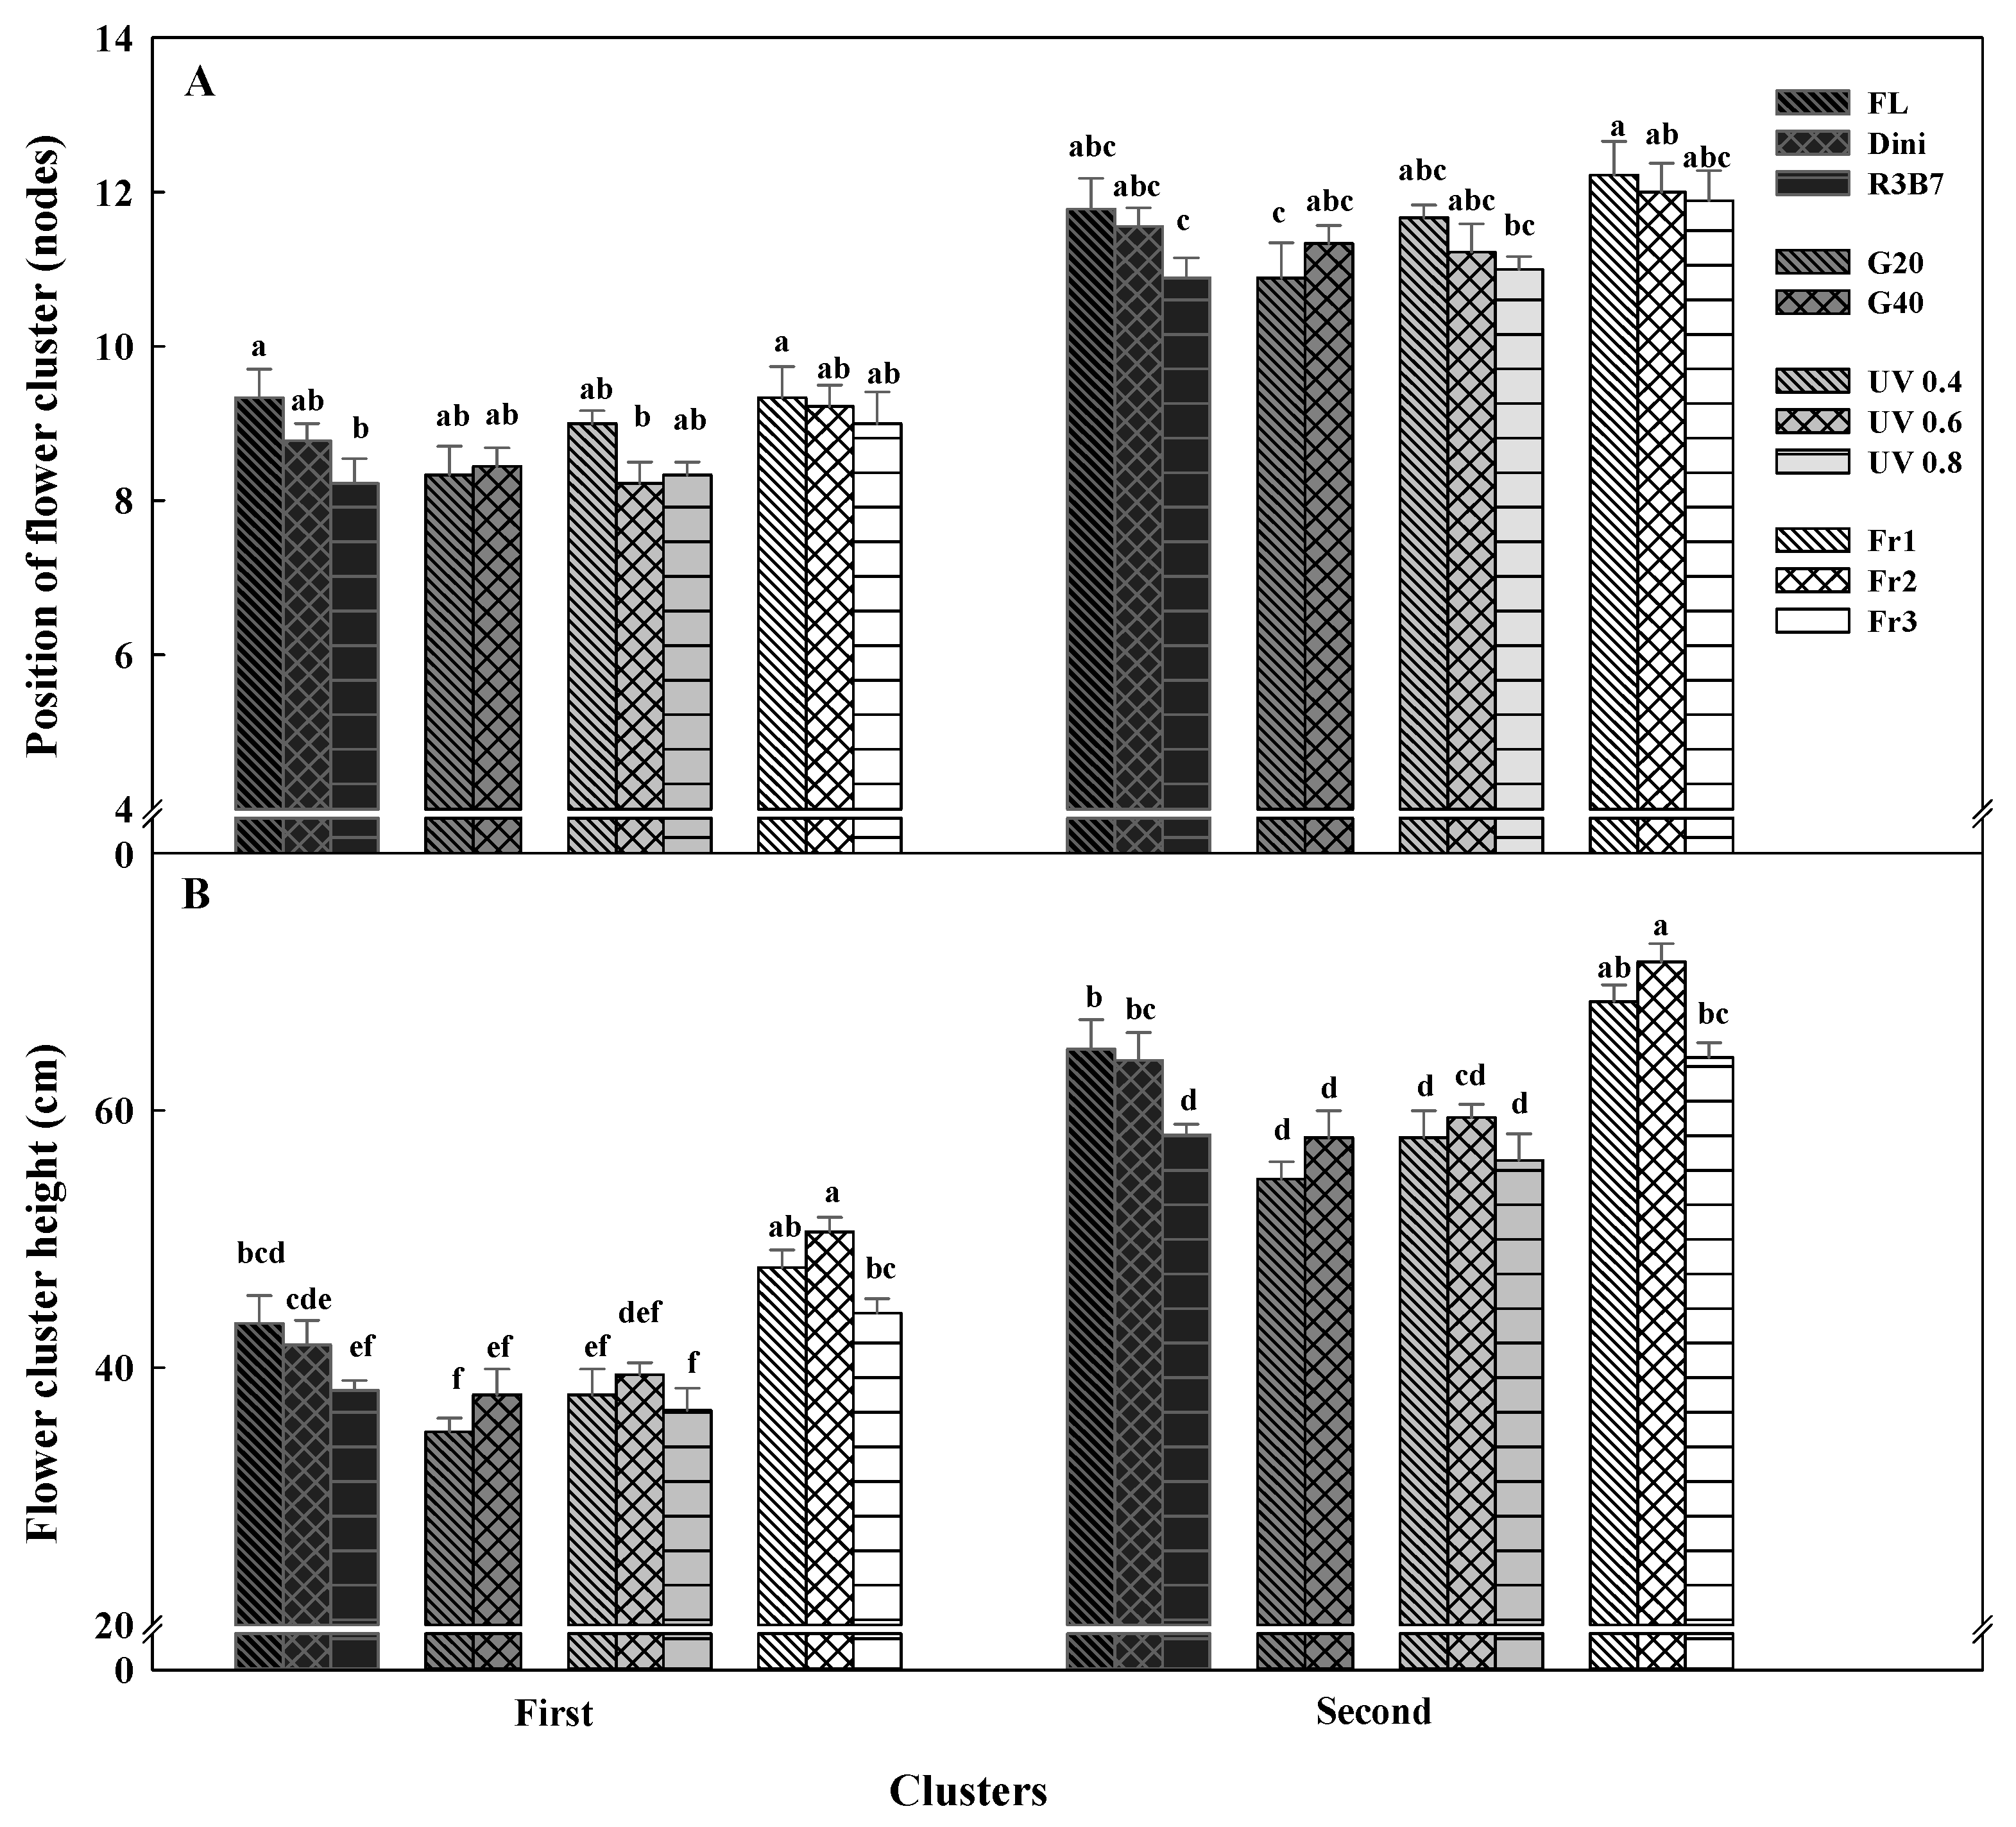
The position of the flower cluster and flower cluster height of tomato seedlings are shown in Figure 10. In tomato cultivation, a low position of flower cluster improves labor efficiency in fruit harvesting. The position of the first flower cluster was the highest for plants in FL and Fr1, and the lowest for plants in R3B7 and UV 0.6 (Figure 10A). The position of the second flower cluster was the highest for seedlings in Fr1 and the lowest for seedlings in R3B7 and G20. The first and second flower cluster heights tended to be high for plants grown in Fr 2 and low for plants in R3B7, G, and UV-A (Figure 10B). It is thought that the height in the early seedling period affects the height at harvest. As a result, Fr1 and Fr2, which produced tallest seedlings with their low R/Fr ratio, produced plants with highest flower cluster heights. R3B7, G20, and UV 0.4, which produced shorter seedlings, maintained a lower flower cluster height. Therefore, it can be concluded that light treatments that limit seedling heights also lower the flower cluster height.
The fruit yields of first and second flower cluster of tomato plants after transplanting are shown in Figure 11. The fruit yield of first flower cluster was the greatest in FL and Fr3 and the lowest in Fr 1. There was no significant difference in the other treatments. The fruit yield of second flower cluster was the greatest in R3B7. The fruit yields when irradiated G or Fr lights to tomato plug seedlings showed a lower tendency in the second flower cluster than control or UV-A group. Comprehensively, the yields up to second flower cluster showed excellent tendency in FL and R3B7. These results show that the yields are different even though they were cultivated in the same environment after various LED treatment. Therefore, if FL or R3B7 is applied to the tomato plug seedlings, it will be possible to increase the initial fruit yield after transplanting.
4. Conclusions
The growth and development of ‘Mini Chal’ tomato seedlings were influenced by different light treatments. G, UV-A, and Fr light elongated the plant height of the seedlings and reduced the SLW, resulting in a decrease in the SPAD value compared to R3B7. In addition, the dry matter content and compactness of the seedlings were reduced compared to R3B7, which negatively affected the quality of the seedling.
These findings suggest that R3B7 is the most effective light treatment among treated light qualities in this study for producing high quality seedlings. It was also demonstrated that high quality seedlings can be produced in CPPS using a combination of LEDs, which can be widely applied in the agricultural industry.
In conclusion, the growth and development of ‘Mini Chal’ tomato seedlings were significantly affected by different light qualities. When considering the quality and development of seedlings after transplanting, it is more effective to apply R and B LEDs in a 30:70 ratio than the other treatment. The results of our study can be utilized in plug seedling farms and CPPS.
Author Contributions
Conceptualization, S.J.H.; methodology, S.J.H. and H.M.K.; formal analysis, H.M.K.; resources, S.J.H.; data curation, H.M.K.; writing—original draft preparation, H.M.K.; writing—review and editing, S.J.H.; project administration, S.J.H.; funding acquisition, S.J.H. and H.M.K.
Funding
This research was funded by the Agrobio-Industry Technology Development Program; Ministry of Food, Agriculture, Forestry, and Fisheries; Republic of Korea (Project No. 319008-01).
Conflicts of Interest
The authors declare no conflicts of interest.
References
- Jenkins, G.I. The UV-B photoreceptor UVR8: From structure to physiology. Plant Cell 2014, 26, 21–37. [Google Scholar] [CrossRef]
- Grime, J.P. Plant Strategies and Vegetation Processes; Wiley: Chichester, UK, 1979. [Google Scholar]
- Shiga, T.; Shoji, K.; Shimada, H.; Hashida, S.N.; Goto, F.; Yoshihara, T. Effect of light quality on rosmarinic acid content and antioxidant activity of sweet basil, Ocimum basilicum L. Plant Biotechnol. 2009, 26, 255–259. [Google Scholar] [CrossRef]
- Johkan, M.; Shoji, K.; Goto, F.; Hashida, S.; Yoshihara, T. Blue light-emitting diode light irradiation of seedlings improves seedling quality and growth after transplanting in red leaf lettuce. HortScience 2010, 45, 1809–1814. [Google Scholar] [CrossRef]
- Kim, H.R.; You, Y.H. Effects of red, blue, white, and far-red LED source on growth responses of Wasabia japonica seedlings in plant factory. Korean J. Hortic. Sci. Technol. 2013, 31, 415–422. [Google Scholar] [CrossRef]
- Lin, K.H.; Huang, M.Y.; Huang, W.D.; Hsu, M.H.; Yang, Z.W.; Yang, C.M. The effects of red, blue, and white light-emitting diodes on the growth development, and edible quality of hydroponically grown lettuce (Lactuca sativa L. var. capitata). Sci. Hort. 2013, 150, 86–91. [Google Scholar] [CrossRef]
- Verdaguer, D.; Jansen, M.A.; Llorens, L.; Morales, L.O.; Neugart, S. UV-A radiation effects on higher plants: Exploring the known unknown. Plant Sci. 2017, 255, 72–81. [Google Scholar] [CrossRef]
- Yorio, N.C.; Goins, G.D.; Kagie, H.R.; Wheeler, R.M.; Sager, J.C. Improving spinach, radish, and lettuce growth under red light-emitting diodes (LEDs) with blue light supplementation. HortScience 2001, 36, 380–383. [Google Scholar] [CrossRef] [PubMed]
- Shin, K.S.; Murthy, H.N.; Heo, J.W.; Hahn, E.J.; Paek, K.Y. The effect of light quality on the growth and development of in vitro cultured Doritaenopsis plants. Acta Physiol. Plant 2008, 30, 339–343. [Google Scholar] [CrossRef]
- Klein, R.M. Effects of green light on biological systems. Biol. Rev. 1992, 67, 199–284. [Google Scholar] [CrossRef] [PubMed]
- Sun, J.; Nishio, J.N.; Vogelmann, T.C. Green light drives CO2 fixation deep within leaves. Plant Cell Physiol. 1998, 39, 1020–1026. [Google Scholar] [CrossRef]
- Folta, K.M. Green light stimulates early stem elongation, antagonizing light-mediated growth inhibition. Plant Physiol. 2004, 135, 1407–1416. [Google Scholar] [CrossRef] [PubMed]
- Kaiser, E.; Weerheim, K.; Schipper, R.; Dieleman, J.A. Partial replacement of red and blue by green light increases biomass and yield in tomato. Sci. Hortic. 2019, 249, 271–279. [Google Scholar] [CrossRef]
- Robson, T.M.; Klem, K.; Urban, O.; Jansen, M.A. Re-interpreting plant morphological responses to UV-B radiation. Plant Cell Environ. 2015, 38, 856–866. [Google Scholar] [CrossRef] [PubMed]
- Bornman, J.F.; Reuber, S.; Cen, Y.-P.; Weissenböck, G. Ultraviolet radiation as a stress factor and the role of protective pigments. In Plants and UV-B: Responses to Environmental Change; Lumsden, P.J., Ed.; Cambridge University Press: Cambridge, UK, 1997; pp. 157–168. [Google Scholar]
- Burchard, P.; Bilger, W.; Weissenböck, G. Contribution of hydroxycinnamates and flavonoids to epidermal shielding of UV-A and UV-B radiation in developing rye primary leaves as assessed by ultraviolet-induced chlorophyll fluorescence measurements. Plant Cell Environ. 2000, 23, 1373–1380. [Google Scholar] [CrossRef] [Green Version]
- Bilger, W.; Johnsen, T.; Schreiber, U. UV-excited chlorophyll fluorescence as a tool for the assessment of UV-protection by the epidermis of plants. J. Exp. Bot. 2001, 52, 2007–2014. [Google Scholar] [CrossRef] [PubMed]
- Kolb, C.; Käser, M.; Kopecký, J.; Zotz, G.; Riederer, M.; Pfündel, E. Effects of natural intensities of visible and ultraviolet radiation on epidermal ultraviolet screening and photosynthesis in grape leaves. Plant Physiol. 2001, 127, 863–875. [Google Scholar] [CrossRef] [PubMed]
- Schnitzler, J.-P.; Jungblut, T.P.; Heller, W.; Köfferlein, M.; Hutzler, P.; Heinzmann, U.; Schmelzer, E.; Ernst, D.; Langebartels, C.; Sandermann, H., Jr. Tissue localization of UV-B-screening pigments and of chalcone synthase mRNA in needles of scots pine seedlings. New Phytol. 1996, 132, 247–258. [Google Scholar] [CrossRef]
- Schmitz-Hoerner, R.; Weissenböck, G. Contribution of phenolic compounds to the UV-B screening capacity of developing barley primary leaves in relation to DNA damage and repair under elevated UV-B levels. Phytochemistry 2003, 64, 243–255. [Google Scholar] [CrossRef]
- McKenzie, R.; Smale, D.; Kotkamp, M. Relationship between UVB and erythemally weighted radiation. Photochem. Photobiol. Sci. 2004, 3, 252–256. [Google Scholar] [CrossRef] [PubMed]
- Nagatani, A. Phytochrome: Structural basis for its functions. Curr. Opin. Plant Biol. 2010, 13, 565–570. [Google Scholar] [CrossRef] [PubMed]
- Quail, P.H. Phytochromes. Curr. Biol. 2010, 20, R503–R504. [Google Scholar] [CrossRef] [PubMed]
- Choi, M.K.; Baek, G.Y.; Kwon, S.J.; Yoon, Y.C.; Kim, H.T. Effect of LED light wavelength on lettuce growth, vitamin C and anthocyanin contents. Prot. Hortic. Plant Fact. 2014, 23, 19–25. [Google Scholar] [CrossRef]
- Im, J.U.; Yoon, Y.C.; Seo, K.W.; Kim, K.H.; Moon, A.K.; Kim, H.T. Effect of LED light wavelength on chrysanthemum growth. Prot. Hortic. Plant Fact. 2013, 22, 49–54. [Google Scholar] [CrossRef]
- Lee, J.E.; Shin, Y.S.; Do, H.W.; Cheung, J.D.; Kang, Y.H. Effect of seedling quality and growth after transplanting of Korean melon nursed under LED light sources and intensity. Prot. Hortic. Plant Fact. 2016, 4, 294–301. [Google Scholar] [CrossRef]
- Sonneveld, C.; Straver, N. Nutrient Solutions for Vegetables and Flower Grow in Water on Substrates; Research Station for Floriculture and Glasshouse Vegetables: Aalsmeer/Naaldwijk, The Netherlands, 1994; Volume 8, p. 45. [Google Scholar]
- Banerjee, R.; Schleicher, E.; Meier, S.; Viana, R.M.; Pokorny, R.; Ahmad, M.; Bittl, R.; Batschauer, A. The signaling state of Arabidopsis cryptochrome 2 contains flavin semiquinone. J. Biol. Chem. 2007, 282, 14916–14922. [Google Scholar] [CrossRef]
- Bouly, J.P.; Schleicher, E.; Dionisio-Sese, M.; Vandenbussche, F.; Van Der Straeten, D.; Bakrim, N.; Meier, S.; Batschauer, A.; Galland, P.; Bittl, R. Cryptochrome blue light photoreceptors are activated through interconversion of flavin redox states. J. Biol. Chem. 2007, 282, 9383–9391. [Google Scholar] [CrossRef]
- Zhang, C.; Chun, I.; Park, Y.; Kim, I. Effect of timings and light intensities of supplemental red light on the growth characteristics of cucumber and tomato plug seedlings. J. Bio-Environ. 2003, 12, 173–179. [Google Scholar]
- Son, K.H.; Park, J.H.; Kim, D.I.; Oh, M.M. Leaf shape index, growth, and phytochemicals in two leaf lettuce cultivars grown under monochromatic light-emitting diodes. Korean J. Hortic. Sci. Technol. 2012, 30, 664–672. [Google Scholar] [CrossRef]
- Kim, Y.J.; Kim, H.M.; Hwang, S.J. Growth and phytochemical contents of ice plant as affected by light quality in a closed-type plant production system. Korean J. Hortic. Sci. Technol. 2016, 34, 878–885. [Google Scholar]
- Cosgrove, D.J. Rapid suppression of growth by blue light: Occurrence, time course, and general characteristics. Plant Physiol. 1981, 67, 584–590. [Google Scholar] [CrossRef]
- Gaba, V.; Black, M. Photocontrol of hypocotyl elongation in de-etiolated Cucumis sativus L. rapid responses to blue light. Photochem. Photobiol. 1983, 38, 469–472. [Google Scholar] [CrossRef]
- Meijer, G. Rapid growth inhibition of gherkin hypocotyls by blue light. Acta Bot. Neerl. 1968, 17, 9–14. [Google Scholar] [CrossRef]
- Chen, X.L.; Guo, W.Z.; Xue, X.Z.; Wang, L.C.; Qiao, X.J. Growth and quality responses of ‘Green Oak Leaf’ lettuce as affected by monochromic or mixed radiation provided by fluorescent lamp (FL) and light-emitting diode (LED). Sci. Hortic. 2014, 172, 168–175. [Google Scholar] [CrossRef]
- Hernández, R.; Kubota, C. Physiological responses of cucumber seedlings under different blue and red photon flux ratios using LEDs. Environ. Exp. Bot. 2016, 121, 66–74. [Google Scholar] [CrossRef]
- Kataria, S.; Guruprasad, K.N. Intraspecific variations in growth, yield and photosynthesis of sorghum varieties to ambient UV (280–400 nm) radiation. Plant Sci. 2012, 196, 85–92. [Google Scholar] [CrossRef] [PubMed]
- Johnson, C.B.; Kirby, J.; Naxakis, G.; Pearson, S. Substantial UV-B-mediated induction of essential oils in sweet basil (Ocimum basilicum L.). Phytochemistry 1999, 51, 507–510. [Google Scholar] [CrossRef]
- Dai, Q.J.; Peng, S.B.; Chavez, A.Q.; Vergara, B.S. Intraspecific responses of 188 rice cultivars to enhanced UV-B radiation. Environ. Exp. Bot. 1994, 34, 422–433. [Google Scholar] [CrossRef]
- Li, Y.; Zu, Y.Q.; Chen, H.Y.; Chen, J.J.; Yang, J.L.; Hu, Z.D. Intraspecific responses in crop growth and yield of 20 wheat cultivars to enhanced ultraviolet-B radiation under field conditions. Field Crops Res. 2000, 67, 25–33. [Google Scholar]
- Li, Y.; Zu, Y.Q.; Chen, J.J.; Chen, H.Y. Intraspecific responses in crop growth and yield of 20 soybean cultivars to enhanced ultraviolet-B radiation under field conditions. Field Crops Res. 2002, 78, 1–8. [Google Scholar]
- Hidema, J.; Kumagai, T. Sensitivity of rice to ultraviolet-B radiation. Ann. Bot. 2006, 97, 933–942. [Google Scholar] [CrossRef] [PubMed]
- Li, Y.; He, L.; Zu, Y. Intraspecific variation in sensitivity to ultraviolet-B radiation in endogenous hormones and photosynthetic characteristics of 10 wheat cultivars grown under field conditions. S. Afr. J. Bot. 2010, 76, 493–498. [Google Scholar] [CrossRef] [Green Version]
- Page, E.R.; Tollenaar, M.; Lee, E.A.; Lukens, L.; Swanton, C.J. Shade avoidance: An integral component of crop-weed competition. Weed Res. 2010, 50, 281–288. [Google Scholar] [CrossRef]
- Afifi, M.; Swanton, C. Maize seed and stem roots differ in response to neigh-boring weeds. Weed Res. 2011, 51, 442–450. [Google Scholar] [CrossRef]
- Zhang, L.; Allen, L.H.; Vaughan, M.M.; Hauser, B.A.; Boote, K.J. Solar ultraviolet radiation exclusion increases soybean internode lengths and plant height. Agric. For. Meteorol. 2014, 184, 170–178. [Google Scholar] [CrossRef]
- Schuerger, A.C.; Brown, C.S.; Stryjewski, E.C. Anatomical features of pepper plants (Capsicum annuum L.) grown under red light-emitting diodes supplemented with blue or far-red light. Ann. Bot. 1997, 79, 273–282. [Google Scholar] [CrossRef]
- Tsukaya, H. Leaf shape: Genetic controls and environmental factors. Int. J. Dev. Biol. 2004, 49, 547–555. [Google Scholar] [CrossRef]
- Kwon, J.K.; Lee, J.H.; Choi, Y.H.; Yu, I.H.; Hwang, G.C. Effects of UV-B and growth inhibitor on overgrowth retardation and growth and yield after planting in fruit-vegetable plug seedlings. Prot. Hortic. Plant Fact. 2003, 12, 252–258. [Google Scholar]
- Demotes-Mainard, S.; Péron, T.; Corot, A.; Bertheloot, J.; Le Gourrierec, J.; Pelleschi-Travier, S.; Crespel, L.; Morel, P.; Huché-Thélier, L.; Boumaza, R. Plant responses to red and far-red lights, applications in horticulture. Environ. Exp. Bot. 2016, 121, 4–21. [Google Scholar] [CrossRef] [Green Version]
- Lötscher, M.; Nösberger, J. Branch and root formation in Trifolium repens is influenced by the light environment of unfolded leaves. Oecologia 1997, 111, 499–504. [Google Scholar] [CrossRef]
- Wan, C.G.; Sosebee, R.E. Tillering responses to red: Far-red light ratio during different phenological stages in Eragrostis curvula. Environ. Exp. Bot. 1998, 40, 247–254. [Google Scholar] [CrossRef]
- Linkosalo, T.; Lechowicz, M.J. Twilight far-red treatment advances leaf bud burst of silver birch (Betula pendula). Tree Physiol. 2006, 26, 1249–1256. [Google Scholar] [CrossRef] [PubMed]
- Finlayson, S.A.; Krishnareddy, S.R.; Kebrom, T.H.; Casal, J.J. Phytochrome regulation of branching in Arabidopsis. Plant Physiol. 2010, 152, 1914–1927. [Google Scholar] [CrossRef] [PubMed]
- Ugarte, C.C.; Trupkin, S.A.; Ghiglione, H.; Slafer, G.; Casal, J.J. Low red/far-red ratios delay spike and stem growth in wheat. J. Exp. Bot. 2010, 61, 3151–3162. [Google Scholar] [CrossRef] [Green Version]
- Reed, J.W.; Nagpal, P.; Poole, D.S.; Furuya, M.; Chory, J. Mutations in the gene for the red/far-red light receptor phytochrome B alter cell elongation and physiological responses throughout Arabidopsis development. Plant Cell 1993, 5, 147–157. [Google Scholar] [CrossRef]
- Devlin, P.F.; Patel, S.R.; Whitelam, G.C. Phytochrome E influences internode elongation and flowering time in Arabidopsis. Plant Cell 1998, 10, 1479–1487. [Google Scholar] [CrossRef]
- Kozuka, T.; Horiguchi, G.; Kim, G.T.; Ohgishi, M.; Sakai, T.; Tsukaya, H. The different growth responses of the Arabidopsis thaliana leaf blade and the petiole during shade avoidance are regulated by photoreceptors and sugar. Plant Cell Physiol. 2005, 46, 213–223. [Google Scholar] [CrossRef]
- Keller, M.M.; Jaillais, Y.; Pedmale, U.V.; Moreno, J.E.; Chory, J.; Ballaré, C.L. Cryptochrome 1 and phytochrome B control shade-avoidance responses in Arabidopsis via partially independent hormonal cascades. Plant J. 2011, 67, 195–207. [Google Scholar] [CrossRef]
- Givnish, T.J. Adaptation to sun and shade: A whole-plant perspective. Aust. J. Plant Physiol. 1988, 15, 63–92. [Google Scholar] [CrossRef]
- Smith, H.; Whitelam, G.C. The shade avoidance syndrome: Multiple responses mediated by multiple phytochromes. Plant Cell Environ. 1997, 20, 840–844. [Google Scholar] [CrossRef]
- Yano, S.; Terashima, I. Separate localization of light signal perception for sun or shade type chloroplast and palisade tissue differentiation in Chenopodium album. Plant Cell Physiol. 2001, 42, 1303–1310. [Google Scholar] [CrossRef]
- Cha, M.K.; Cho, J.H.; Cho, Y.Y. Growth of leaf lettuce as affected by light quality of LED in closed-type plant factory system. Prot. Hortic. Plant Fact. 2013, 12, 291–297. [Google Scholar] [CrossRef]
- Cookson, S.J.; Granier, C. A dynamic analysis of the shade-induced plasticity in Arabidopsis thaliana rosette leaf development reveals new components of the shade-adaptative response. Ann. Bot. 2005, 97, 443–452. [Google Scholar] [CrossRef] [PubMed]
- Son, K.H.; Oh, M.M. Growth, photosynthetic and antioxidant parameters of two lettuce cultivars as affected by red, green, and blue light-emitting diodes. Hort. Environ. Biotechnol. 2015, 56, 639–653. [Google Scholar] [CrossRef]
- Victório, C.P.; Leal-Costa, M.V.; Schwartz Tavares, E.; Machado Kuster, R.; Salgueiro Lage, C.L. Effects of supplemental UV-A on the development, anatomy and metabolite production of Phyllanthus tenellus cultured in vitro. Photochem. Photobiol. 2011, 87, 685–689. [Google Scholar] [CrossRef]
- Barreiro, R.; Guiamét, J.J.; Beltrano, J.; Montaldi, E.R. Regulation of the photosynthetic capacity of primary bean leaves by the red:far-red ratio and photosynthetic photon flux density of incident light. Physiol. Plant 1992, 85, 97–101. [Google Scholar] [CrossRef]
- Pushnik, J.C.; Miller, G.W.; Jolley, V.D.; Brown, J.C.; Davis, T.D.; Barnes, A.M. Influences of ultra-violet (UV)-blue light radiation on the growth of cotton. II. Photosynthesis, leaf anatomy, and iron reduction. J. Plant Nutr. 1987, 10, 2283–2297. [Google Scholar] [CrossRef]
- Kasperbauer, M.J.; Peaslee, D.E. Morphology and photosynthetic efficiency of tobacco leaves that received end-of-day red or far red light during development. Plant Physiol. 1973, 52, 440–442. [Google Scholar] [CrossRef]
- Boardman, N.K. Comparative photosynthesis of sun and shade plants. Annu. Rev. Plant Physiol. 1977, 28, 355–377. [Google Scholar] [CrossRef]
- Li, Q.; Kubota, C. Effects of supplemental light quality on growth and phytochemicals of baby leaf lettuce. Environ. Exp. Bot. 2009, 67, 59–64. [Google Scholar] [CrossRef]
- Carvalho, R.F.; Takaki, M.; Azevedo, R.A. Plant pigments: The many faces of light perception. Acta Physiol. Plant 2011, 33, 241–248. [Google Scholar] [CrossRef]
- Son, K.H.; Oh, M.M. Leaf shape, growth, and antioxidant phenolic compounds of two lettuce cultivars grown under various combinations of blue and red light-emitting diodes. HortScience 2013, 48, 988–995. [Google Scholar] [CrossRef]
- Son, K.H.; Kim, E.Y.; Oh, M.M. Growth and development of cherry tomato seedlings grown under various combined ratios of red to blue LED lights and fruit yield and quality after transplanting. Prot. Hortic. Plant Fact. 2018, 27, 54–63. [Google Scholar] [CrossRef]
- Lee, H.B.; An, S.K.; Lee, S.Y.; Kim, K.S. Vegetative growth characteristics of Phalaenopsis and Doritaenopsis plants under different artificial lighting sources. Hortic. Sci. Technol. 2017, 35, 21–29. [Google Scholar]
- Teramura, A.H.; Ziska, L.H.; Sztein, A.E. Changes in growth and photosynthetic capacity of rice with increased UV-B radiation. Physiol. Plant 1991, 83, 373–380. [Google Scholar] [CrossRef]
- Kim, H.Y. Effect of UV-B radiation on growth and pigments in gourd (Lagenaria siceraria) plant. J. NERI 2004, 9, 39–43. [Google Scholar]
- Kim, H.C.; Cho, Y.H.; Ku, Y.G.; Bae, J.H. Seedling qualities of hot pepper according to seedling growth periods and growth and yield after planting. Korean J. Hortic. Sci. Technol. 2015, 33, 839–844. [Google Scholar] [CrossRef]
- Kim, H.M.; Kang, J.H.; Jeong, B.R.; Hwang, S.J. Light quality and photoperiod affect growth of sowthistle (Ixeris dentata Nakai) in a closed-type plant production system. Korean J. Hortic. Sci. Technol. 2016, 34, 67–76. [Google Scholar] [CrossRef]
- Kitaya, Y.; Niu, G.; Kozai, T.; Ohashi, M. Photosynthetic photon flux, photoperiod, and CO2 concentration affect growth and morphology of lettuce plug transplants. HortScience 1998, 33, 988–991. [Google Scholar] [CrossRef]
- Kang, S.B.; Jang, H.I.; Lee, I.B.; Park, J.M.; Moon, D.K. Effect of waterlogging condition on the photosynthesis of ‘Campbell Early’ grapevine. Korean J. Hortic. Sci. Technol. 2008, 26, 372–379. [Google Scholar]
- Choi, Y.H.; Kwon, J.K.; Lee, J.H.; Kang, N.J.; Cho, M.W.; Kang, J.S. Effect of night and daytime temperatures on growth and yield of paprika ‘Fiesta’ and ‘Jubilee’. J. Bio-Envrion. Control 2004, 13, 226–232. [Google Scholar]
- Calatayud, A.; Roca, D.; Martinez, P.F. Spatial–temporal variations in rose leaves under water stress conditions studied by chlorophyll fluorescence imaging. Plant Physiol. Biochem. 2006, 44, 564–573. [Google Scholar] [CrossRef]
- Demmig, B.; Björkman, O. Comparison of the effect of excessive light on chlorophyll fluorescence (77 K) and photon yield of O2 evolution in leaves of higher plants. Planta 1987, 171, 171–184. [Google Scholar] [CrossRef]
- Schreiber, U.; Bilger, W. Progress in Chlorophyll Fluorescence Research: Major Developments during the Past Years in Retrospect; Progress in Botany/Fortschritte der Botanik; Springer: Berlin/Heidelberg, Germany, 1993; pp. 151–173. [Google Scholar]
- Long, S.P.; Humphries, S.; Ealkowski, P.G. Photoinhibition of photosynthesis in nature. Annu. Rev. Plant Biol. 1994, 45, 633. [Google Scholar] [CrossRef]
- Zhang, D.H.; Wang, Q.P.; Xue, Z.Y. Photoluminescence of ZnO films excited with light of different wavelength. Appl. Surf. Sci. 2003, 207, 20–25. [Google Scholar] [CrossRef]
- Ouzounis, T.; Fretté, X.; Ottosen, C.O.; Rosenqvist, E. Spectral effects of LEDs on chlorophyll fluorescence and pigmentation in Phalaenopsis ‘Vivien’ and ‘Purple Star’. Physiol. Plant. 2015, 154, 314–327. [Google Scholar] [CrossRef] [PubMed]
- Wang, J.; Lu, W.; Tong, Y.; Yang, Q. Leaf morphology, photosynthetic performance, chlorophyll fluorescence, stomatal development of lettuce (Lactuca sativa L.) exposed to different ratios of red light to blue light. Front. Plant Sci. 2016, 7, 250. [Google Scholar] [CrossRef] [PubMed]
- Lee, M.J.; Park, S.Y.; Oh, M.M. Growth and cell division of lettuce plants under various ratios of red to far-red light-emitting diodes. Hortic. Environ. Biotechnol. 2015, 56, 186–194. [Google Scholar] [CrossRef]
- Caldwell, M.M.; Bjorn, L.O.; Bornman, J.F.; Flint, S.D.; Kulandaivelu, G.; Teramura, A.H.; Tevini, M. Effects of increased solar ultraviolet radiation on terrestrial ecosystems. Photochem. Photobiol. 1998, 46, 40–52. [Google Scholar] [CrossRef]
- Musil, C.F.; Chimphango, S.B.; Dakora, F.D. Effects of elevated ultraviolet-B radiation on native and cultivated plants of southern Africa. Ann. Bot. 2002, 90, 127–137. [Google Scholar] [CrossRef] [PubMed]
- Rajendiran, K.; Ramanujam, M.P. Improvement of biomass partitioning, flowering and yield by triadimefon in UV-B stressed Vigna radiata (L.) Wilczek. Biol. Plant. 2004, 48, 145–148. [Google Scholar] [CrossRef]
Figure 1.
The spectral distribution of lights used in the experiment: A, FL (Fluorescent lamp); B, R3B7 (red:blue = 30:70); C, G20 (red:green:blue = 20:20:60); D, G40 (red:green:blue = 20:40:40); E, UV 0.4 (red:blue = 30:70 + UV-A 0.4 W·m−2); F, UV 0.6 (red:blue = 30:70 + UV-A 0.6 W·m−2); G, UV 0.8 (red:blue = 30:70 + UV-A 0.8 W·m−2); H, Fr1 (red:blue:far-red = 20:60:20); I, Fr2 (red:blue:far-red = 26:60:14); and J, Fr3 (red:blue:far-red = 30:60:10). These ratios of the above light quality were expressed by the ratio of photon flux density of each light quality.

Figure 2.
The effects of the light quality on the plant height (A) and stem diameter (B) of ‘Mini Chal’ tomato (Solanum lycopersicum L.) measured 21 days after start of treatment. Refer to Figure 1 for details on the light quality. Vertical bars indicate the mean ± standard deviation (SD) (n = 15). Different letters above bars indicate significant differences by Duncan’s multiple range test at p = 0.05.

Figure 3.
Plug seedlings of ‘Mini Chal’ tomato (Solanum lycopersicum L.) treated with different light qualities at 21 days after start of treatment. Refer to Figure 1 for details on the light quality.
Figure 3.
Plug seedlings of ‘Mini Chal’ tomato (Solanum lycopersicum L.) treated with different light qualities at 21 days after start of treatment. Refer to Figure 1 for details on the light quality.

Figure 4.
The effects of the light quality on the number of leaves (A), leaf area (B), leaf shape index (C), and specific leaf weight (D) of ‘Mini Chal’ tomato (Solanum lycopersicum L.) measured 21 days after start of treatment. Refer to Figure 1 for details on the light quality. Vertical bars indicate the mean ± SD (n = 15). Different letters above bars indicate significant differences by Duncan’s multiple range test at p = 0.05.

Figure 5.
The leaf shapes of ‘Mini Chal’ tomato (Solanum lycopersicum L.) treated with different light qualities 21 days after start of treatment. Refer to Figure 1 for details on the light quality.
Figure 5.
The leaf shapes of ‘Mini Chal’ tomato (Solanum lycopersicum L.) treated with different light qualities 21 days after start of treatment. Refer to Figure 1 for details on the light quality.

Figure 6.
The effects of the light quality on the SPAD value of ‘Mini Chal’ tomato (Solanum lycopersicum L.) measured 21 days after start of treatment. Refer to Figure 1 for details on the light qualities. Vertical bars indicate the mean ± SD (n = 15). Different letters above the bars indicate significant differences by Duncan’s multiple range test at p = 0.05.

Figure 7.
The effects of the light quality on the dry matter content (A) and compactness (B) of ‘Mini Chal’ tomato (Solanum lycopersicum L.) measured 21 days after start of treatment. Refer to Figure 1 for details on the light quality. Vertical bars indicate the mean ± SD (n = 15). Different letters above bars indicate significant differences by Duncan’s multiple range test at p = 0.05.

Figure 8.
The effects of the light quality on the chlorophyll fluorescence of ‘Mini Chal’ tomato (Solanum lycopersicum L.) measured 21 days after start of treatment. Refer to Figure 1 for details on the light quality. Vertical bars indicate the mean ± SD (n = 3). Different letters above bars indicate significant differences by Duncan’s multiple range test at p = 0.05.

Figure 9.
The effects of the light quality on the flowering speed of the first flower cluster (solid line) and second flower cluster (dotted line) of ‘Mini Chal’ tomato (Solanum lycopersicum L.) after transplanting. Refer to Figure 1 for details on the light quality.
Figure 9.
The effects of the light quality on the flowering speed of the first flower cluster (solid line) and second flower cluster (dotted line) of ‘Mini Chal’ tomato (Solanum lycopersicum L.) after transplanting. Refer to Figure 1 for details on the light quality.

Figure 10.
The effects of the light quality on the position of flower cluster (A) and flower cluster height (B) of the first and second fruit setting nodes of ‘Mini Chal’ tomato (Solanum lycopersicum L.) measured 73 days after transplanting. Refer to Figure 1 for details on the light quality. Vertical bars indicate the mean ± SD (n = 9). Different letters above bars indicate significant differences by Duncan’s multiple range test at p = 0.05.

Figure 11.
The effects of light quality on yield of first flower cluster (A) and yield of second flower cluster (B) of ‘Mini Chal’ tomato (Solanum lycopersicum L.) measured after transplanting. Refer to Figure 1 for details on the light quality. Vertical bars indicate the mean ± SD (n = 9). Different letters above bars indicate significant differences by Duncan’s multiple range test at p = 0.05.


Table 1.
The composition of the nutrient solution used in the experiment.
| Chemical | Concentration (mg·L−1) | Chemical | Concentration (mg·L−1) |
|---|---|---|---|
| Ca(NO3)2·4H2O | 1274.4 | Fe-EDTA | 6.20 |
| KNO3 | 525.2 | H3BO3 | 1.84 |
| KH2PO4 | 204.0 | CuSO4·5H2O | 0.16 |
| MgSO4·7H2O | 590.4 | MnSO4·5H2O | 2.19 |
| NH4NO3 | 96.0 | Na2MoO4·2H2O | 0.10 |
| K2SO4 | 348.0 | ZnSO4·7H2O | 1.41 |
Table 2.
The fresh and dry weights of leaves and stems of ‘Mini Chal’ tomato (Solanum lycopersicum L.) affected by different light qualities measured 21 days after start of treatment.
Table 2.
The fresh and dry weights of leaves and stems of ‘Mini Chal’ tomato (Solanum lycopersicum L.) affected by different light qualities measured 21 days after start of treatment.
| Light Quality z | Fresh Weight (g) | Dry Weight (g) | ||||
|---|---|---|---|---|---|---|
| Leaf | Stem | Total | Leaf | Stem | Total | |
| FL | 1.39 d y | 1.69 de | 3.08 d | 0.12 d | 0.06 c | 0.18 d |
| Dini | 0.63 e | 0.76 f | 1.39 e | 0.05 e | 0.03 d | 0.08 e |
| R3B7 | 2.20 ab | 1.53 de | 3.74 c | 0.19 ab | 0.07 c | 0.27 bc |
| G20 | 1.76 c | 1.47 e | 3.23 cd | 0.15 bcd | 0.07 c | 0.22 cd |
| G40 | 1.66 cd | 1.79 d | 3.45 cd | 0.14 cd | 0.07 c | 0.21 cd |
| UV 0.4 | 1.99 bc | 1.43 e | 3.42 cd | 0.17 bcd | 0.06 c | 0.23 bc |
| UV 0.6 | 1.97 bc | 1.72 de | 3.69 c | 0.17 bc | 0.07 c | 0.23 c |
| UV 0.8 | 1.90 bc | 1.66 de | 3.55 cd | 0.16 bcd | 0.07 c | 0.22 c |
| Fr1 | 2.37 a | 3.92 a | 6.29 a | 0.23 a | 0.20 a | 0.43 a |
| Fr2 | 1.88 c | 3.04 b | 4.92 b | 0.16 bcd | 0.13 b | 0.29 b |
| Fr3 | 2.02 b | 2.59 c | 4.61 b | 0.18 bc | 0.11 c | 0.29 b |
z Refer to Figure 1 for details on the light quality. y Mean separation within columns by Duncan’s multiple range test at p = 0.05.
© 2019 by the authors. Licensee MDPI, Basel, Switzerland. This article is an open access article distributed under the terms and conditions of the Creative Commons Attribution (CC BY) license (http://creativecommons.org/licenses/by/4.0/).
Share and Cite
MDPI and ACS Style
Kim, H.M.; Hwang, S.J. The Growth and Development of ‘Mini Chal’ Tomato Plug Seedlings Grown under Various Wavelengths Using Light Emitting Diodes. Agronomy 2019, 9, 157. https://0-doi-org.brum.beds.ac.uk/10.3390/agronomy9030157
AMA Style
Kim HM, Hwang SJ. The Growth and Development of ‘Mini Chal’ Tomato Plug Seedlings Grown under Various Wavelengths Using Light Emitting Diodes. Agronomy. 2019; 9(3):157. https://0-doi-org.brum.beds.ac.uk/10.3390/agronomy9030157
Chicago/Turabian StyleKim, Hye Min, and Seung Jae Hwang. 2019. "The Growth and Development of ‘Mini Chal’ Tomato Plug Seedlings Grown under Various Wavelengths Using Light Emitting Diodes" Agronomy 9, no. 3: 157. https://0-doi-org.brum.beds.ac.uk/10.3390/agronomy9030157
Note that from the first issue of 2016, this journal uses article numbers instead of page numbers. See further details here.