Compost as a Substitute for Mineral N Fertilization? Effects on Crops, Soil and N Leaching


Department of Agronomy, Food, Natural Resources, Animals and Environment (DAFNAE), Viale dell’Università 16, 35020 Legnaro (PD), Italy
*
Author to whom correspondence should be addressed.
Agronomy 2019, 9(4), 193; https://0-doi-org.brum.beds.ac.uk/10.3390/agronomy9040193
Submission received: 6 March 2019
/
Revised: 29 March 2019
/
Accepted: 12 April 2019
/
Published: 15 April 2019
(This article belongs to the Special Issue Sustainable Cropping Systems)
Abstract
:A three-year study was conducted to test the fertilization properties of different types of compost as the total or partial mineral nitrogen fertilization substitute in an herbaceous crop succession (Zea mays L., Triticum aestivum L. and Helianthus annus L.). Four types of compost (i. green cuttings and depuration sludge, ii. green cuttings, organic fraction of municipal wastes and other organic materials, iii. green cuttings, iv. green cuttings and organic fraction of municipal wastes) and eight fertilization treatments (combining: unfertilized control, 100% mineral fertilization, 100% compost, and 50% compost +50% mineral fertilization) were evaluated in terms of: (i) crop yields and nitrogen uptake, (ii) soil organic carbon and nitrate nitrogen soil contents variation, and (iii) residual nitrate nitrogen leached at the end of the experiment. Maize grain yield ranged from 5.2 ± 1.0 Mg ha−1 to 7.4 ± 0.7 Mg ha−1 with the highest value in the mineral fertilization treatment and the lowest values in the 100% compost fertilization. Wheat and sunflower grain yields were not significantly different among control, mineral, compost, or mineral/compost fertilization treatments with average values of 5.1 ± 0.7 Mg ha−1 and 2.3 ± 0.3 Mg ha−1, respectively. Cumulative crop yield at the end of the three years was not affected by the compost type, but was affected by fertilization treatment (highest values with mineral and 50% compost +50% mineral fertilization). The compost application did not highlight a relevant effect on soil organic carbon. Under 100% of compost fertilization, the crops did not take up a large amount of the N supplied, but it did not generate an increase of NO3-N leaching in the percolation water. Obtained results show the good fertilization properties of compost whereas the amendment property was not relevant, probably due to the low rates applied and the short experimental period.
1. Introduction
In the last decade, abundant soil mineral fertilizations have led to several issues (costs, nitrate pollution, and loss of soil carbon) [1]. To maintain or increase optimum soil fertility, one possible practice is maintenance of the humic acid content by recycling plant and algal matter, or by adding outside sources of decomposed plant or algal matter such as composts, mulch, peat, or lignite coals [2]. In this scenario, fertilization with organic matter represents an alternative for the sustainability of agro-ecosystems [3,4,5] even though its environmental impact should also be carefully evaluated [6]. Organic matter composting is one of the best-known and well-established processes that allow the stabilization and sanitation of organic wastes through accelerated aerobic decomposition under controlled conditions. This results in a product called compost [7]. Due to its main characteristic, which is high content of stable organic nitrogen (N) [8] and stabilized organic matter, the use of compost in agriculture is a way to increase the organic matter content in the soil for long periods. Therefore, this allows soil fertility maintenance and/or recovery [9] and better crop yields [10].
Compost characteristics are influenced by the organic matter used. Therefore, different types of organic materials can produce compost with different composition, especially in terms of nutrients. Considering the effect on crops, Montemurro et al. [11], using municipal solid waste compost alone or in association with mineral fertilizer on sunflower, found similar oil and protein yield performance as that with mineral fertilization. Higher tomato yield was reported by Islam et al. [12] when vermi-compost was used in association with mineral fertilizers with respect to vermi-compost alone. Positive effects on wheat and sunflower production and quality characteristics were reported by Fecondo et al. [13] using bio-waste compost. Green compost, alone or in partial substitution for mineral fertilization, was tested on cabbage by Nicoletto et al. [14] who reported comparable yield but higher content of antioxidants, phenolic acids, and ascorbic acid with respect to mineral fertilization. Instead, neutral or antagonistic interactive effects have been reported on many plant growth traits combining compost with biochar for their fertilization [15]. Three different composts (food processing industry residues, municipal waste, green cuttings residues, the organic fraction of municipal waste solid residues, and municipal sludge and green cuttings residues) since N source were investigated on potatoes, lolium, and rye succession by Passoni and Borin [16]. These experts reported a specific response of potato yield to compost type, with the best results for the compost derived from food processing industry residues and municipal waste. Gobbi et al. [17], using different types of spent mushroom substrate, alone or combined with mineral fertilization, observed positive effects on lettuce and leek performance with comparable yields to mineral fertilization without differences among compost types. Furthermore, the short-cycle crops preferred mixed fertilization because organic substrates usually require a long time for organic matter mineralization whereas organic fertilization is more effective for long-cycle crops such as leeks [17]. In addition, the dose of compost should be taken into account as highlighted by Ponchia et al. [18] who, using different doses of green waste compost as medium to grow rooted cuttings of rose and Abelia × grandiflora, concluded that the use of compost has to be carefully evaluated since there is a clearly different species tolerance, particularly in younger plants. This overview, thus, indicates great potential for compost as a nutrient source, but contrasting results in relation to crop and compost origin and characteristics. The question of whether compost can be used as a total or partial substitute of mineral N is still open.
Although several studies have been conducted to evaluate the effect of compost application on herbaceous crops yield, only a few papers focused on the comparison of more than one type of compost with variable results. For this reason, the main aim of this study was to compare different compost types as total or partial mineral N fertilization substitute in an herbaceous crop succession (maize, wheat, and sunflower) in North-East Italy, considering crop response, soil organic carbon content, and concentration of N in the percolation water and soil.
2. Materials and Methods
2.1. Site Description and Experiment Setup
The experiment was conducted at the University of Padua “L. Toniolo” Experimental Farm, Veneto Region, North-East Italy (45°11′ N, 11°21′ E, 6 m a.s.l.) during a three-year research program from 2006 to 2008. The site consisted of 48 growth boxes, each with a 4 m2 surface area, arranged in two symmetric lines of 24 boxes installed at 1.3 m above ground level to avoid water table interaction, especially during the winter, and with the bottom open, to allow water percolation. A semi-automatic tension-controlled ceramic suction plate system was installed in 16 boxes (2 replicates per treatment) at 0.90 m depth to collect the percolation water. The system was controlled by an electric vacuum pump that was manually activated to regulate the ceramic plate suction at 0.02 Mbar. At the beginning of the experimental period, all growth boxes were filled with Fluvi-Calcaric Cambisol [19], whose physical-chemical features related to the arable layer (0–30 cm), carried out following the Italian official methods [20,21], are reported in Table 1. The soil has a clay-loam texture, with a sub-basic reaction (7.7), soil organic matter content of 2.1%, and C:N ratio of 8.7.
Three crops were cultivated during the experimental period: maize (Zea mays L.) (Pioneer “Costanza” FAO 600), wheat (Triticum aestivum L.) (cv. Blasco), and sunflower (Helianthus annus L.) (PR64H41 variety). The agronomic operations performed in each crop cycle are reported in Table 2. Maize was sown on 16 May 2006 at 7.5 plants m−2 sowing density and was harvested at complete grain maturation stage on 3 October 2006. After maize harvesting, soil in each growth box was tilled manually using spade. Crop residues (stalks) were incorporated directly into the soil in the 0 to 20 cm layer. After an adequate soil preparation, wheat was sown at a rate of 250 kg seeds ha−1 on 3 November 2006 and was harvested on 18 June 2007. In autumn 2007, the soil was tilled manually using spade and wheat residues (straw), were incorporated in the 0–20 cm layer. Sunflower was sown on 28 April 2008 at 9 plants m−2 and harvested on 2 October 2008. The crop residues buried in the soil at the end of maize and wheat growing seasons were 90% of produced residues. The 10% of maize stalks and wheat straw was instead used for analysis.
To partially or completely substitute the crop N mineral requirements, four different types of compost were used as organic fertilizer: (i) compost derived from green cuttings and depuration sludge (G+S), (ii) from green cuttings, organic fraction of municipal wastes, and other organic materials (G+F+O), (iii) from green cuttings (G), and (iv) from green cuttings and organic fraction of municipal wastes (G+F).
Eight different fertilization treatments, replicated six times, were compared in each crop cycle, adopting a completely randomized blocks experimental design. The fertilization scheme included: (i) 50% of N supplied through G compost and 50% through mineral fertilization (G50), (ii) 50% of N supplied through G + F + O compost and 50% through mineral fertilization (GFO50), (iii) 50% of N supplied through G + S compost and 50% through mineral fertilization (GS50), (iv) 50% of N supplied through G + F compost and 50% through mineral fertilization (GF50), (v) 100% of N supplied through G + F + O fertilization (GFO100), (vi) 100% of N supplied through G compost (G100), vii) 100% of N supplied through mineral fertilization (Min100), and (viii) unfertilized treatment for comparison (C).
The dry matter and N concentration of each type of compost were determined before starting the experiment (Table 3) to calculate the amount of compost to distribute in each fertilization treatment (Table 4).
Crop P and K requirements were satisfied by adding mineral fertilizers to the content of composts to avoid these elements that may be limiting and to evaluate the effect of compost only in terms of N fertilization. The amount of P and K supplied was chosen according to the standard recommendation for crops typical of the Po Valley area. In particular, maize received 250 kg N ha−1, 100 kg P ha−1, and 100 kg K ha−1 and wheat received 150 kg N ha−1, 100 kg P ha−1, and 100 kg K ha−1, which is the typical fertilization of the experimental area. Sunflower received 250 kg N ha−1, 100 kg P ha−1, and 100 kg K ha−1. The sunflower N fertilization quantity was established to maximize yield by taking into account the maximum N uptake available in literature [22,23]. Mineral N was supplied as ammonium nitrate, P as triple superphosphate, and K as potassium sulphate. Maize was the only irrigated crop, with 120 mm of water supplied through artificial irrigation, divided equally on three different dates in June and July to replenish crop evapotranspiration.
2.2. Meteorological Data
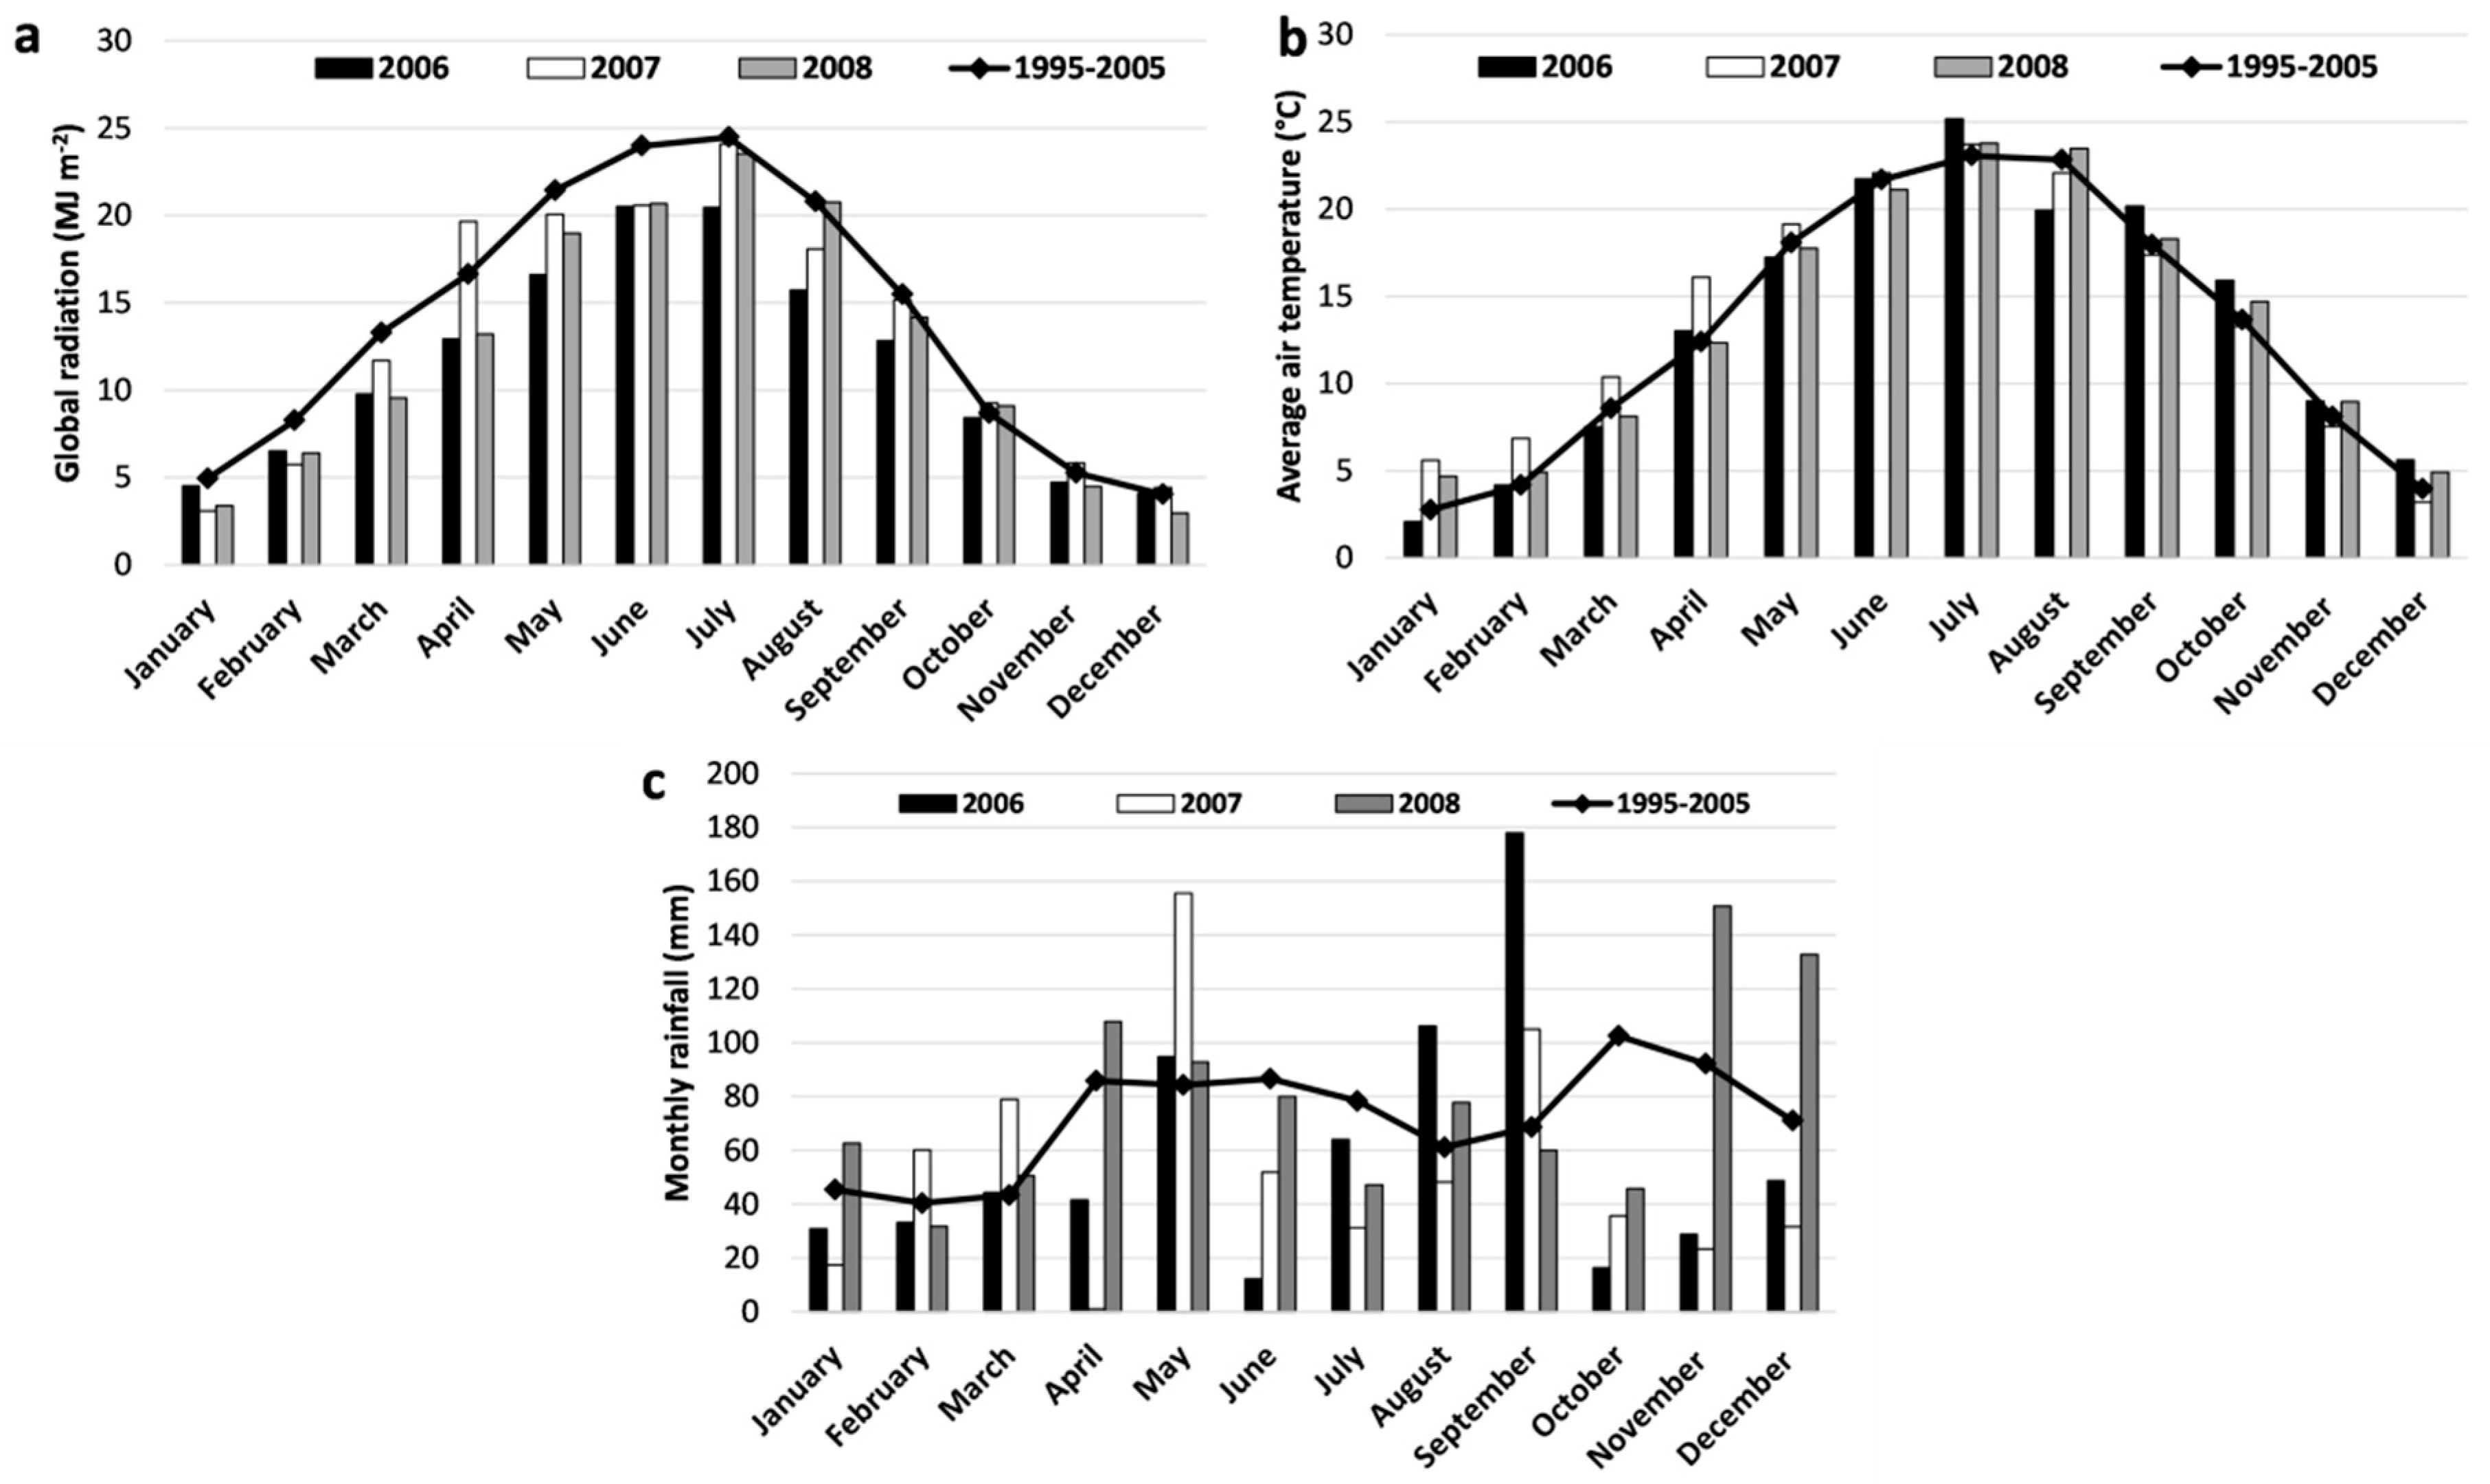
The experiment has been carried out under humid subtropical climate (Cfa) conditions, according to the Köppen climate classification [24]. The following data were collected from 1 January 2006 to 31 December 2008 at the ARPAV weather station located near the experimental site: rain (mm), average air temperature (°C), and global radiation (MJ m−2).
During the whole experimental period, global radiation showed the classic seasonal bell-shaped trend with a progressive increase from the beginning of the year until July when the highest values were recorded, and then a sloping decrease until December (Figure 1a). The average global radiation values measured in 2006 and 2008 of 11.4 MJ m−2 and 12.3 MJ m−2, respectively, were lower than the 1995 to 2005 decade average (13.9 MJ m−2), which was in line with the average value obtained in the second experimental year (13.1 MJ m−2).
Average air temperature followed the same monthly trend as global radiation, with a maximum value in July and minimum in January (Figure 1b). In general, for all experimental years, average monthly air temperature values were in line with the corresponding monthly values calculated for the long-term period (1995–2005).
During the entire experimental period, total rainfall was 2279.2 mm, with a different distribution and amount over the three experimental years (Figure 1c). During the first and second years, the annual rainfall of 699.2 mm and 640.0 mm was lower than the long-term average (860.2 mm), whereas values recorded in the third year (940.0 mm) exceeded the long-term average. Focusing attention on the different cropping seasons, maize (16 May–3 October 2006) received 410.8 mm of rainfall, wheat (3 November 2006–18 June 2007) received 441.6 mm of rainfall, and sunflowers (28 April 2008–2 October 2008) received 358.4 mm of rainfall.
At the end of each crop cycle, the above-ground biomass produced by each crop was determined by cutting all plants in the growth boxes at about 10 cm above the soil level. The collected above-ground biomass was weighed onsite to determine the total fresh biomass production. It was then manually separated into marketable fresh biomass (grain) and crop residues. The dry biomass production was assessed by drying a biomass sample from each growth box and each biomass fraction in a forced-air oven at 65 °C until constant weight was reached. Dry biomass was milled to 2 mm and an average sample for each studied treatment was analyzed to determine N concentration through the Kjeldhal method. The total N uptake in the above-ground biomass was determined as the product of dry biomass production and nutrient concentration. This allowed the following indexes to be calculated:
- Apparent N Balance (ANB) using the equation:ANB = N input − N uptake
- N Use Efficiency (NUE) was evaluated with the approach suggested by Fageria et al. [25] calculating: Agronomic efficiency (AE), Physiological efficiency (PE), Agrophysiological efficiency (APE), Apparent recovery efficiency (ARE), and Utilization efficiency (UE) using the following equations:AE (mg grain yield mg−1 N applied) = (Yf − Yc)/NaPE (mg total biomass mg−1 N uptake) = (BYf − BYc)/(Nf − Nc)APE (mg grain yield mg−1 N uptake) = (Yf − Yc)/(Nf − Nc)ARE (%) = [(Nf − Nc)/Na] × 100where Yf is the grain yield harvested in the fertilized treatments (mg), Yc is the grain yield of the unfertilized control treatment (mg), and Na is the quantity of N applied (mg), BYf is the biological yield (total biomass) of the fertilized treatments (mg), BYc is the biological yield of the unfertilized control treatment (mg), Nf is the N uptake (total biomass) of the fertilized treatments (mg), and Nc is the N uptake (total biomass) of the unfertilized control treatment (mg). The indexes were calculated for the different treatments and applied for single crops during the entire succession.UE (mg mg−1) = PE × ARE
2.3. Soil and Percolation Water Analysis
To monitor the evolution of organic carbon (OC) and nitrate N (NO3-N) over time, soil samples were taken before the beginning (March 2006) and after the end (November 2008) of the experiment. Soil sampling was performed in each growth box, at 0–20 cm and 20–50 cm depths. After collection, samples were air-dried for about a week and then manually sieved at 2 mm. The soil OC and NO3-N were determined through the Walkley-Black method and spectrophotometric analysis [26], respectively.
To assess the NO3-N concentration in percolation water among the studied treatments as a potential residual environmental effect of the different fertilization management, 96 samples were collected six times during the sunflower growing season (from April 2008 to October 2008). The NO3-N concentration was determined following the Cataldo method [26].
2.4. Statistical Analysis
The normality of data was checked with the Kolmogorov-Smirnov test. As the aboveground biomass production, soil OC and NO3-N data showed a normal distribution. They were analyzed statistically with one-way analysis of variance (ANOVA) and the differences between average values were found by the Tukey’s honestly significant difference (HSD) test, p < 0.05. Biomass production was evaluated for each species comparing fertilization treatments whereas soil OC and NO3-N data were evaluated in time for each fertilization treatment using experimental years as treatment. On the contrary, the percolation water NO3-N concentration data did not follow a normal distribution, so they were processed by the non-parametric Kruskal-Wallis statistical test, p < 0.05.
3. Results
3.1. Biomass Production
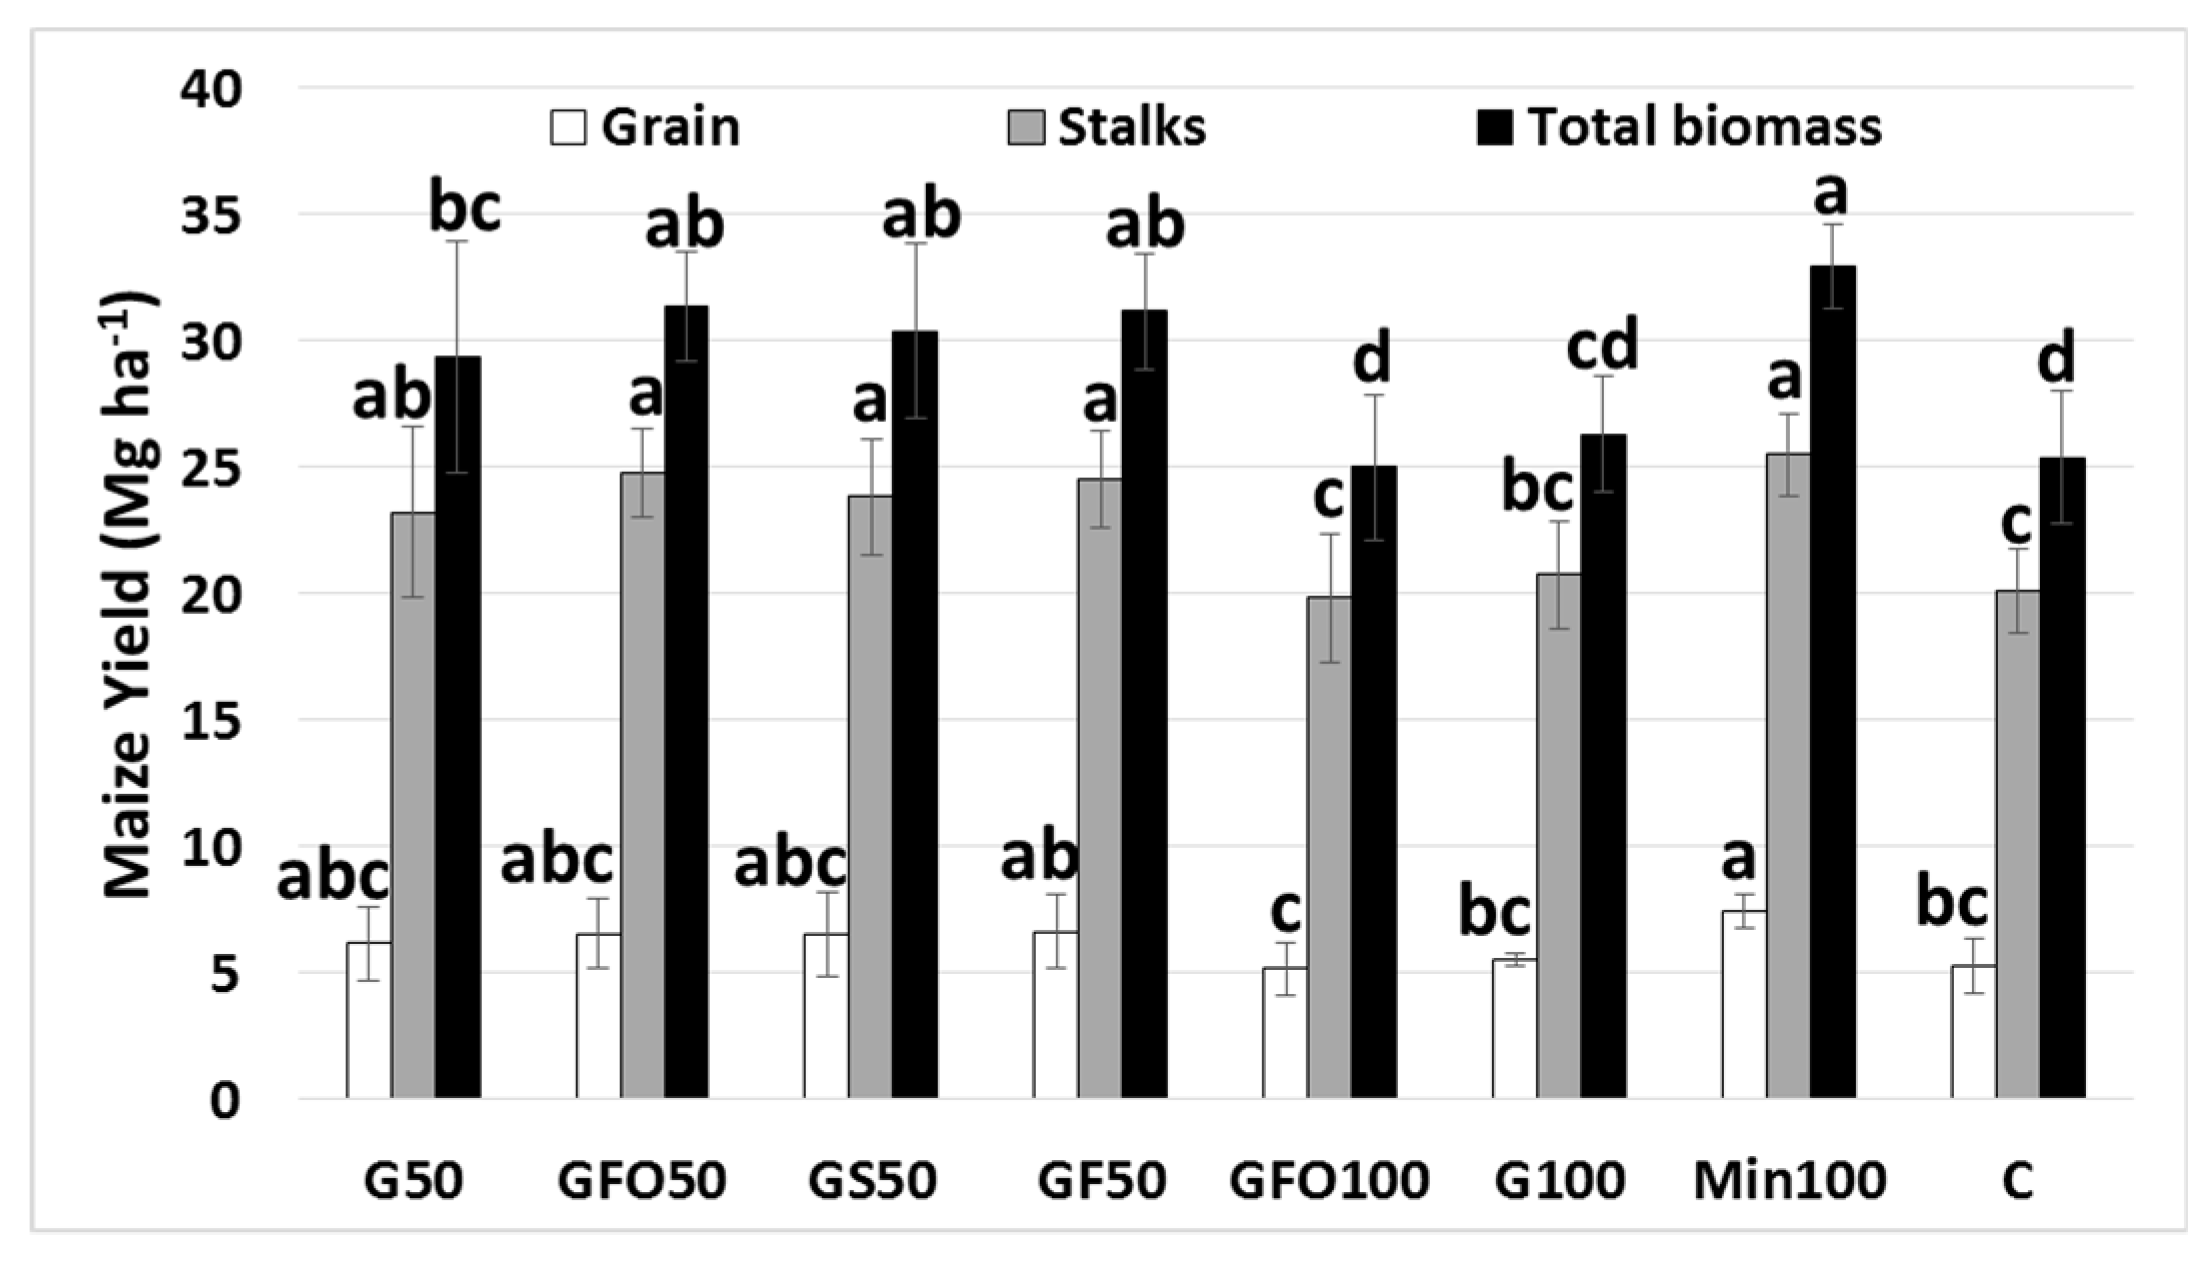
The maize stalk biomass and grain productions ranged from 20.1 ± 1.6 Mg ha−1 to 25.5 ± 1.6 Mg ha−1 and from 5.2 ± 1.0 Mg ha−1 to 7.4 ± 0.7 Mg ha−1, respectively. The significantly highest (ANOVA, p < 0.05) total biomass (stalk + grain) productions were in the mineral fertilization and 50% compost+50% mineral fertilization treatments. In addition, the significantly lowest (ANOVA, p < 0.05) biomass productions were harvested under compost fertilization (GFO100 and G100 treatments) and unfertilized treatment (Figure 2).
Both wheat total and straw biomasses showed the same statistical trend among fertilization treatments (Figure 3). The significantly highest values were recorded in the treatments where mineral fertilizers were used at either 50% or 100%, without any significant differences among them, whereas the significantly lowest ones (ANOVA, p < 0.05) were obtained in the unfertilized treatment (Figure 3) and grain yield did not give significant differences among treatments with an average value of 5.1 ± 0.7 Mg ha−1 (Figure 3).
Despite sunflower total biomass (on average 7.0 ± 0.8 Mg ha−1), stalk (on average 4.7 ± 0.6 Mg ha−1) and grain (on average 2.3 ± 0.3 Mg ha−1) yields showed big differences among treatments. The ANOVA statistical test did not indicate any significant differences among them, which is probably attributed to the high variability within each treatment.
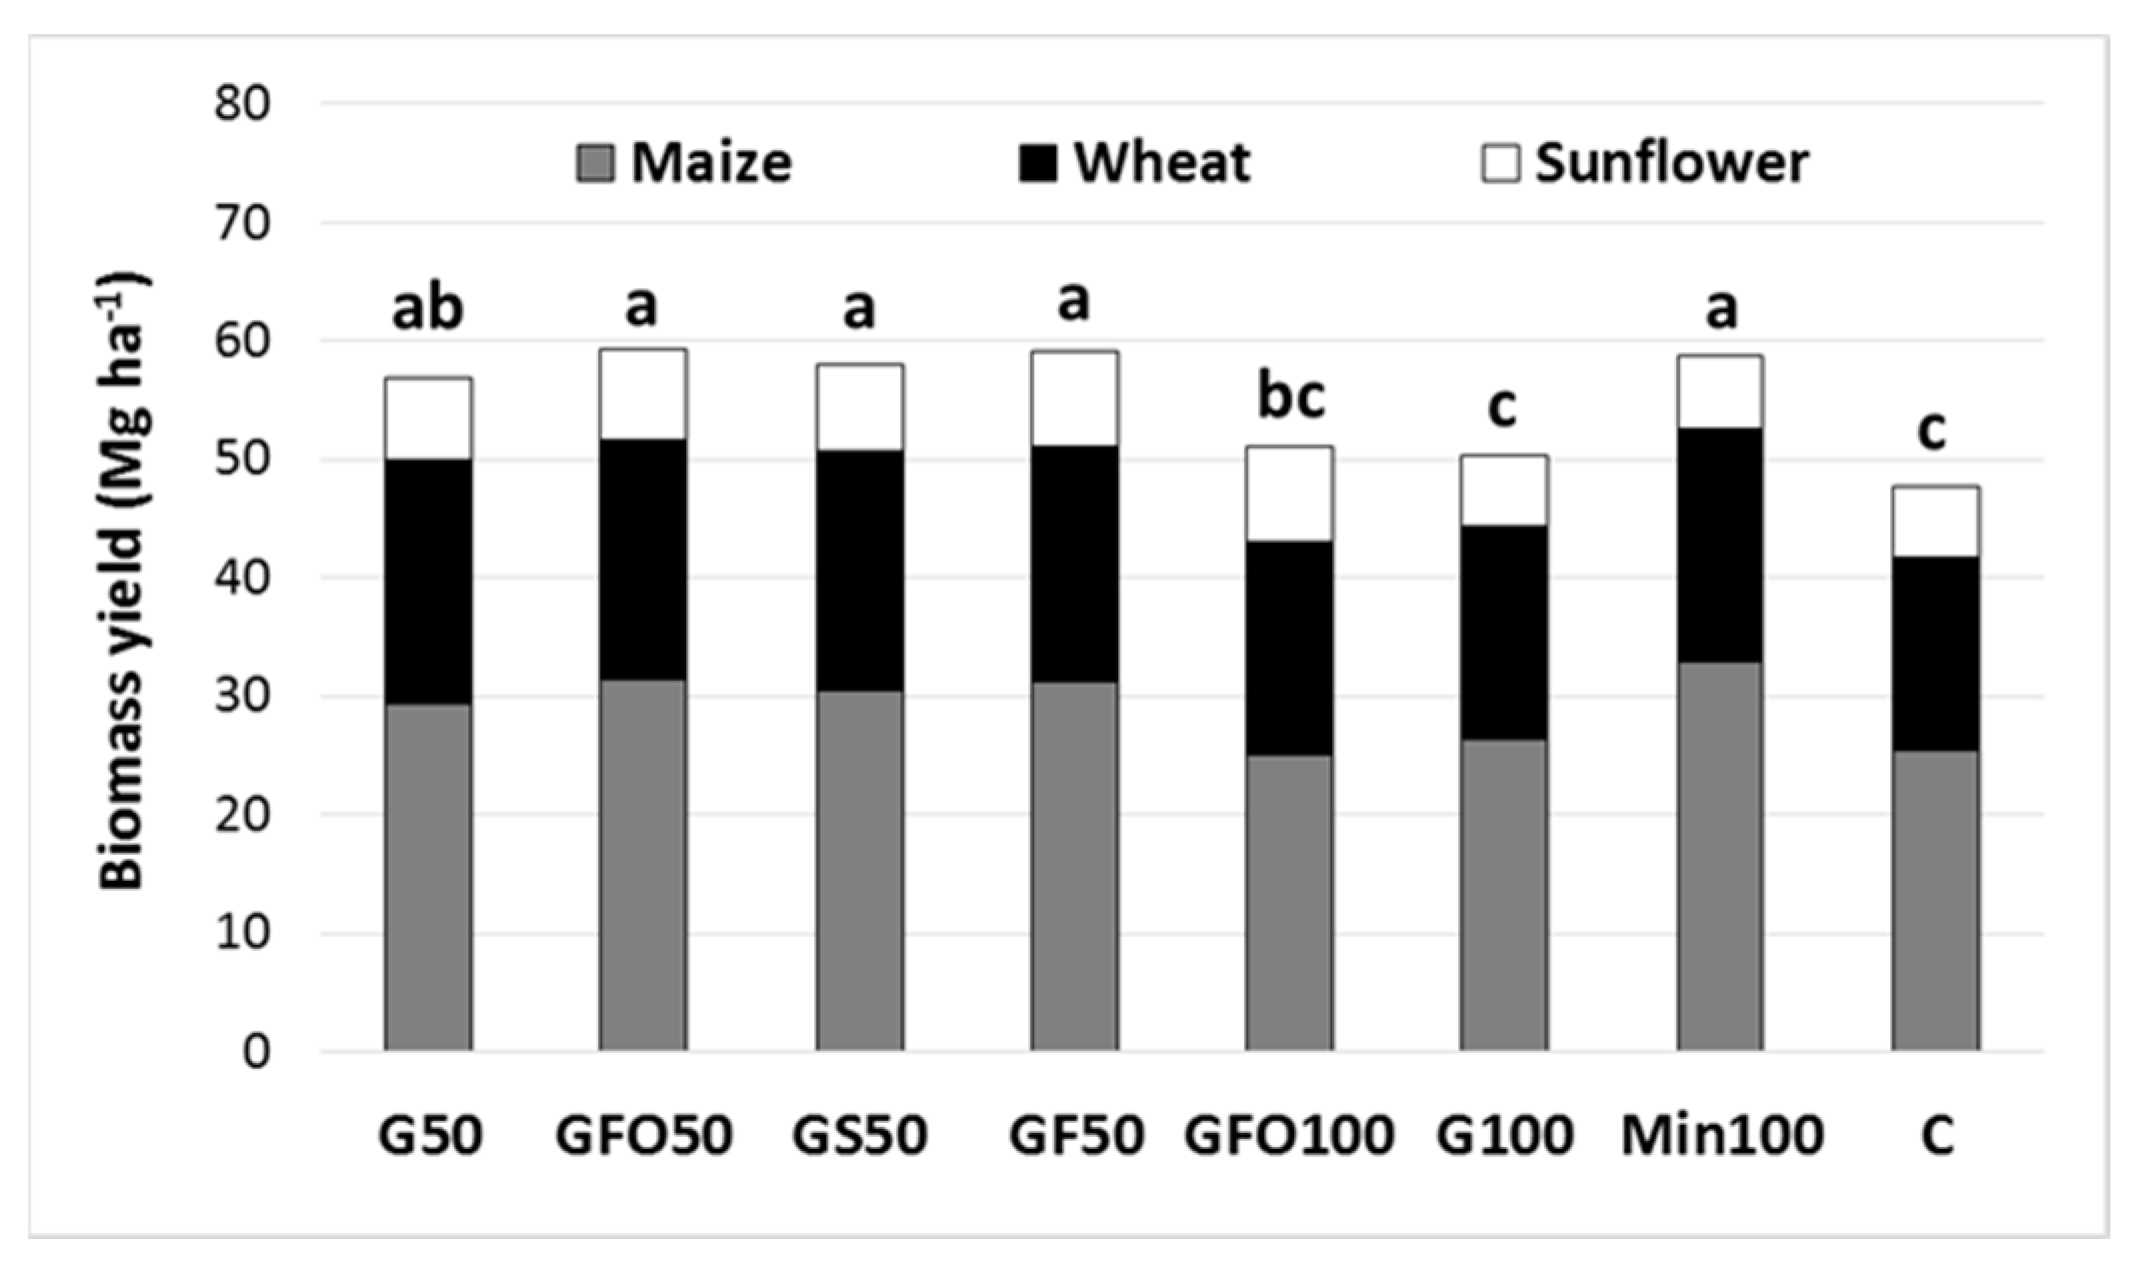
At the end of the three-year crop succession, the cumulated biomass production of all the treatments with 50% N from compost and 50% from mineral fertilizer (on average 58.3 Mg ha−1) did not differ with respect to that obtained with 100% mineral N (58.7 Mg ha−1). The application of N by compost alone gave lower results (on average 50.7 Mg ha−1), which is similar to those obtained in the unfertilized control (Figure 4).
3.2. N Percentage Concentration, Uptake, Apparent Nitrogen Balance, and Nitrogen Use Efficiency
The N concentration of both grain and residues of all crops showed the same trend among the studied treatments. The highest values were recorded in the 50% compost +50% mineral fertilization and 100% mineral fertilization treatments, whereas the lowest ones were recorded in the 100% compost fertilization and unfertilized treatments (Table 5). As for the N concentration, N uptake varied greatly between the compared treatments. All crops showed the highest N uptake under the 50% compost+50% mineral fertilization, which was comparable to that obtained with 100% mineral fertilization. Instead, the N uptake obtained under 100% compost N fertilization was lower than those recorded in the presence of mineral fertilizer and strictly comparable to the unfertilized treatment (Table 5).
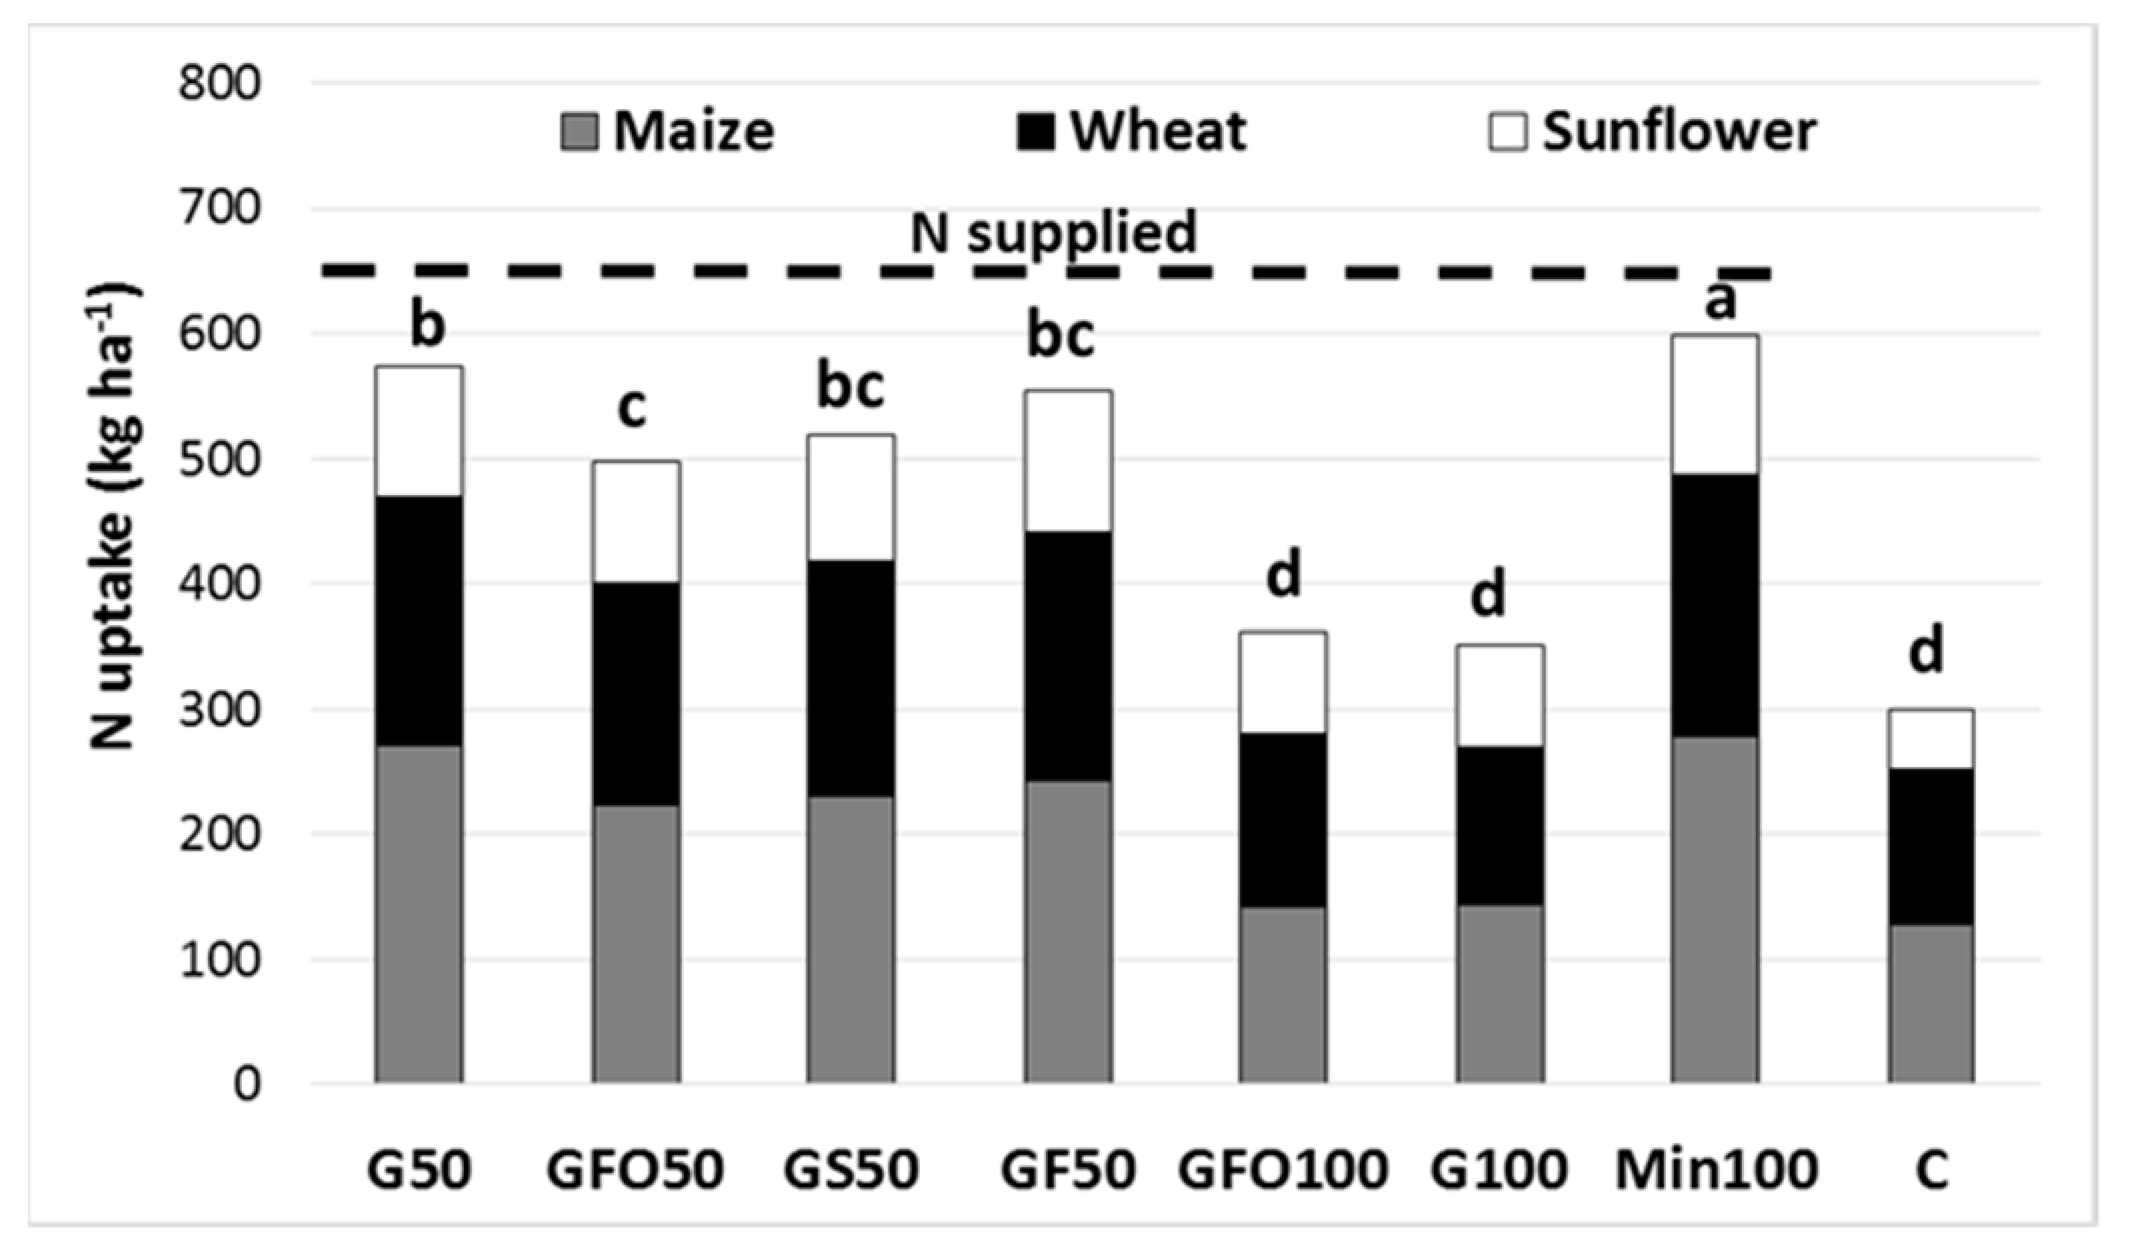
The significantly highest (ANOVA, p < 0.05) three years cumulative N uptake was obtained under 100% mineral fertilization treatment (598.3 kg ha−1) followed by 50% compost +50% mineral fertilization (on average 536.3 kg ha−1). Instead, the significantly lowest (ANOVA, p < 0.05) cumulative N uptakes were recorded for organic fertilization and unfertilized treatments without any significant difference among them (on average 337.4 kg ha−1) (Figure 5). The cumulative N supplied during the three-year study was higher than crop uptake for all treatments, leaving in the soil 52 kg N ha−1, 114 kg N ha−1 and 294 kg N ha−1 in 100% mineral, 50% compost +50% mineral, and 100% compost fertilization treatments, respectively.
Table 6 reports the calculation of the most common indexes to define the apparent N balance and N use efficiency. Particularly, in the maize cropping season, the ANB ranged from −128.0 kg ha−1 to 108.3 kg ha−1, with negative values obtained for unfertilized, 100% mineral fertilization, G compost+mineral fertilization, and G+F compost+mineral fertilization schemes. During the wheat cropping season, the N uptake exceeded N supplied through fertilization where the fertilization scheme included mineral fertilizer application (both 100% mineral fertilizer and 50% compost+50% mineral fertilizer), which provided negative ANB values. On the contrary, strictly positive ANB values were obtained under 100% compost fertilization. The ANB values of sunflower were always higher than 135.0 kg ha−1 except for the unfertilized treatment that gave a negative value. The AE varied following a specific treatment trend (Table 6) and, on the average of the studied treatments, maize showed the highest AE (on average 4.0 mg mg−1), which was followed by the wheat (on average 2.6 mg mg−1) and sunflower (on average 1.3 mg mg−1). The highest ARE and UE values of cereals were obtained under 100% mineral fertilization and 50% compost+50% mineral fertilization treatments while the lowest values were obtained with the application of 100% compost organic matter. ARE of sunflower followed the same trend as maize and wheat, while the UE showed the highest values in the 50% organic +50% mineral fertilization treatments, and values became negative under 100% organic or 100% mineral fertilizations.
3.3. Soil and Percolation Water Analysis
At the beginning of the trial, soil OC was, on average, 1.07 ± 0.07% and 0.88 ± 0.10% in the 0–20 cm and 20–50 cm soil profiles, respectively. All fertilization treatments showed a significant increase (ANOVA, p < 0.05) of soil OC at the end of the trial with an average increase of 60.7% and 53.4% in the 0 to 20 cm and 20 to 50 cm soil profiles, respectively.
Soil NO3-N content was not significantly different between the beginning and end of the experimental period in compost fertilized treatments at both 50% and 100%. Instead, a clear trend was observed in 100% mineral fertilization and unfertilized control treatments with an increase and decrease of soil NO3-N concentrations, respectively (Table 7).
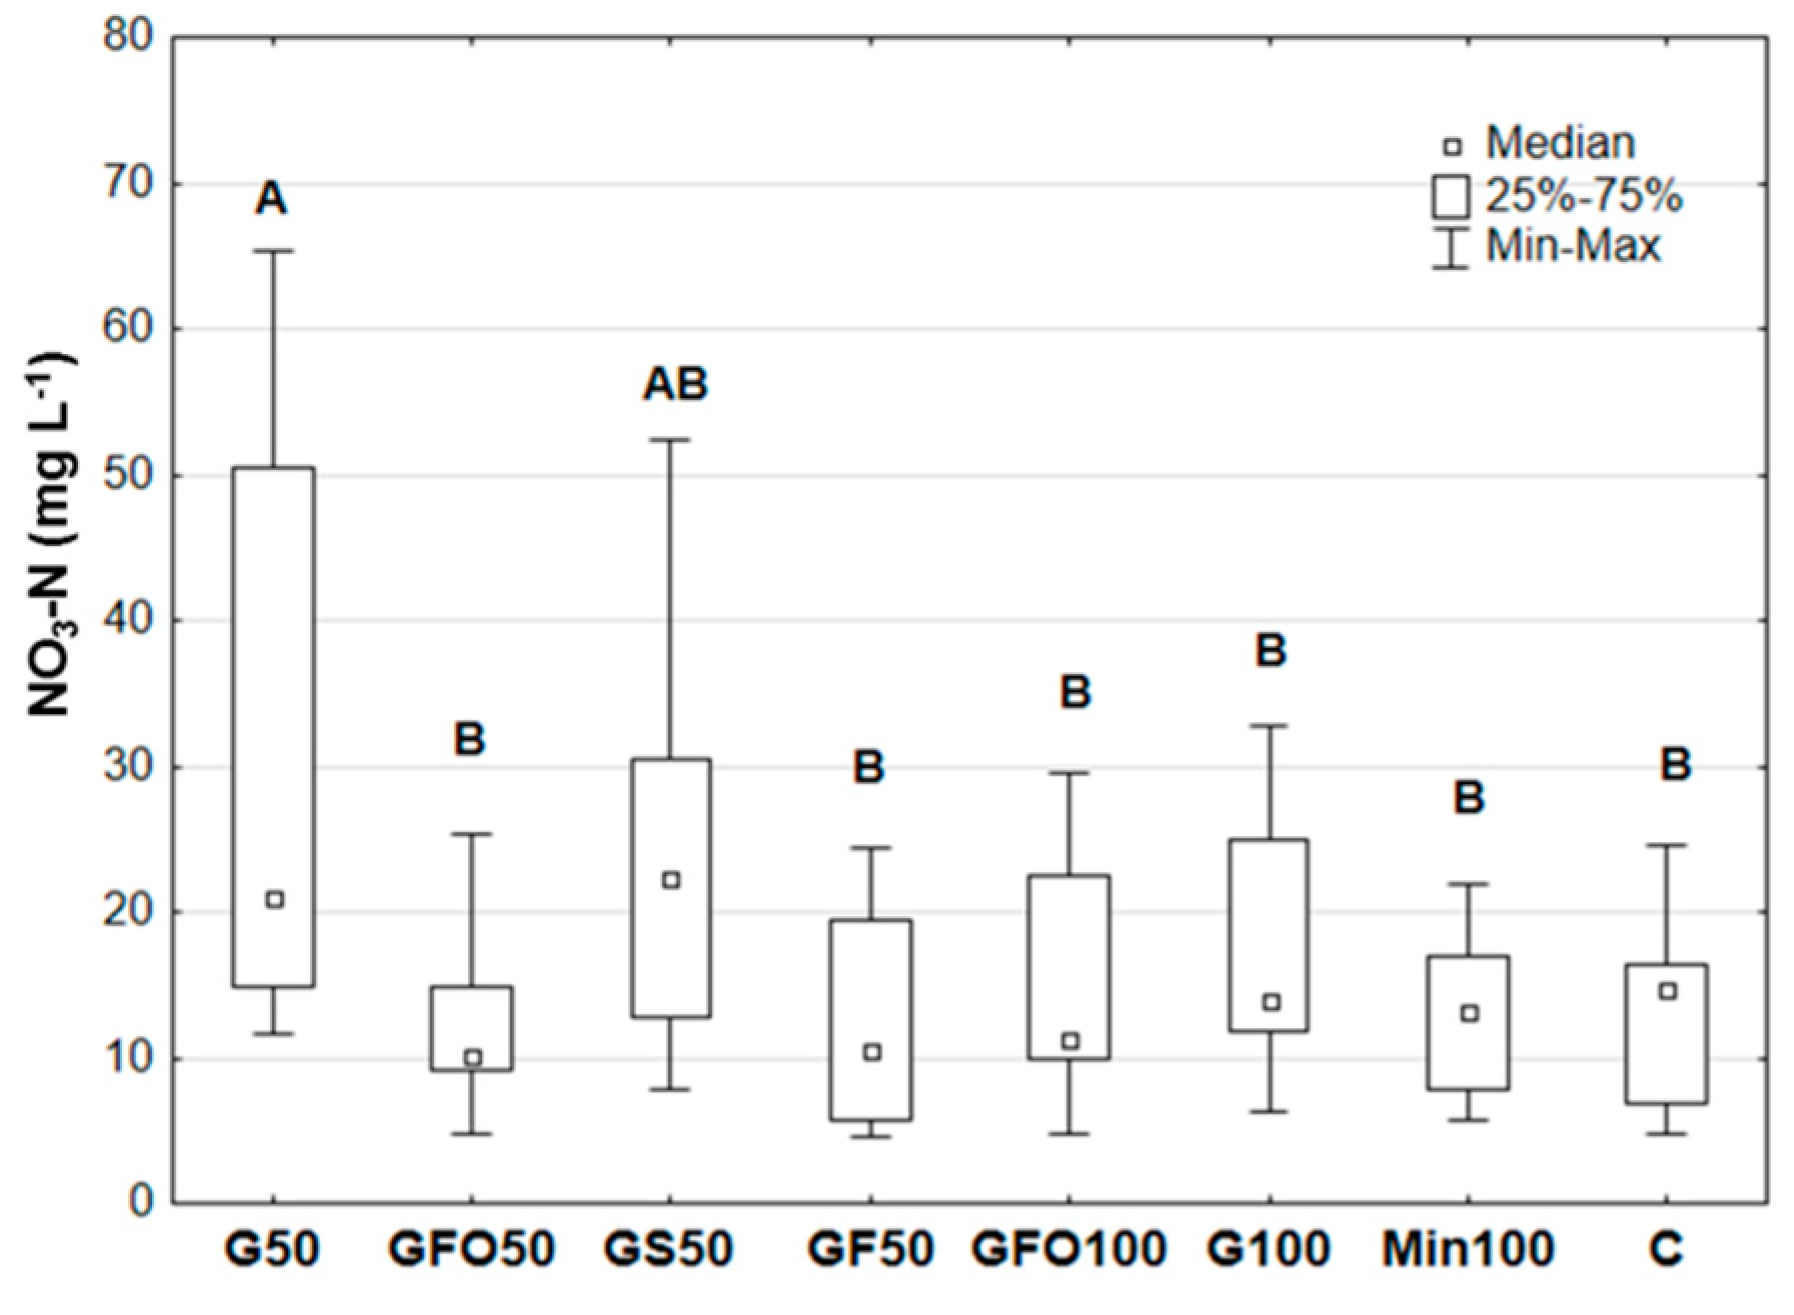
The median NO3-N concentrations in percolation water ranged between 10.1 mg L−1 and 22.2 mg L−1, with significant differences among the studied treatments. Although the significantly highest NO3-N concentration (Kruskal-Wallis, p < 0.05) was determined in the treatment of G50 (50% compost + 50% mineral fertilization), this trend was not confirmed in other similar treatments (GFO50, GS50, and GF50), where lower values were measured (Figure 6).
4. Discussion
Maize and wheat grain average yields obtained in the current study were similar to those obtained under open field conditions in the same area with conventional agricultural practices [27]. Despite all compost types used in the experiment containing more than 1% of N (dry weight basis), according to the typical range for agricultural compost used as fertilizer (1–3% of N) [28], the results suggested the necessity of associating mineral fertilization with the organic one to maximize cereal yields at least during the short-term period (first and second cropping seasons of this study). In addition, the C/N of compost used to fertilize crops should be taken into account. Mature compost (with low C/N ratio) gives a small increase in plant N availability, whereas immature compost (with high C/N ratio) results in net N immobilization [29,30]. However, initial immobilization is more likely with less mature compost and with a high C/N ratio since, in mature compost, N–immobilisation had already taken place during the composting process [31]. In this context, cereals, particularly maize and wheat, have high N requirements that are mainly satisfied by promptly available N sources such as mineral fertilizers rather than the mineralized organic N typical of organic fertilizers such as compost. The organic matter turnover requires a longer time. For this purpose, Eghball et al. [32,33] reported average N percentage mineralization rates of 11% and 18% for composted manure following the first year after distribution. Similarly, Preusch et al. [34] recorded average N mineralization rates of 7% to 9% when the composted poultry litter was distributed on silt loam soils, whereas average values were 1% to 5% when the same organic material was applied to sandy loam soils.
The unsatisfactory cereal yields obtained with 100% compost fertilization in this study are in agreement with Martínez-Blanco et al. [7], who reported a crop yield reduction of 138% after a single compost fertilization in the short-term period. On the contrary, in the third cropping season, the comparable sunflower grain yield obtained among the treatments could be justified considering not only the relatively low N requirements typical of the crop but also the achievement of the compost residual effect.
Wheat and maize, both of the Poaceae family, were differently affected by the fertilization treatments. Maize was influenced in both stalk and grain yield, while wheat was influenced only in straw production. The different behavior of the two crops could be attributed to the completely different environmental conditions that affected the crop cycles (autumn-winter-spring seasons for wheat, spring-summer seasons for maize) and, consequently, the different pathway through which N is made available for crops. In particular, wheat fully exploited N supplied by the mineral fertilization treatment is done at the end of January (100% mineral fertilization and 50% organic+50% mineral fertilization treatments) during the vegetative growth, which, in the study region, occurs during the cold months (from January until mid-April), for increasing the vegetative biomass (straw). On the contrary, in the 100% compost fertilization and unfertilized treatments, N was not immediately available for crop absorption due to the reduced organic matter mineralization rates, which penalizes the production of straw biomass. Wheat grain yield and protein content strictly depends on N availability at flowering. Since no mineral fertilizations were done during this phenological phase, in all studied treatments, N was made available for crops by the mineralization of previous crop residues or compost organic matter. Despite microbial activity being greater in this phase than during the vegetative growth period, it probably remained insufficient to fully satisfy crop N requirements, which justifies the absence of significant differences in wheat grain yield among the fertilization treatments.
Maize N requirements during the phenological phase of vegetative growth (from May until the end of June) were mainly satisfied by promptly available N supplied through mineral fertilization (50% organic+50% mineral fertilization and 100% mineral fertilization treatments), as proven by the greater stalks’ biomass produced by maize under 100% mineral fertilization than 100% organic fertilization and unfertilized treatments. Instead, during the reproductive phase, at ear formation, maize exploited both (i) residual available N supplied with mineral fertilization (part is leached through water percolation in the previous period) and (ii) N derived from mineralization of the organic matter (crop residues and compost). This explanation justifies the restricted differences on the crop yield between 50% organic+50% mineral fertilization and 100% organic fertilization treatments.
Considering the agronomic indexes calculated, ANB, ARE, and UE followed a specific crop and treatment trend. On the average of studied treatments, the relatively low ANB values of maize and wheat (8.1 and −38.4, respectively) and the high average value calculated for sunflower (126.7) indicated the excellent aptitude of cereals to uptake available N compounds from soil and their translocation into the biomass with respect to sunflowers.
In the maize and wheat cropping seasons, the negative ANB values obtained under mineral fertilization treatment indicated that N uptake through crop biomass exceeded the N applied through fertilization. Therefore, this subtracted soil N reserves. Instead, the strictly positive values calculated for 100% compost fertilization treatments indicated, as previously reported, that N released by compost organic matter mineralization was not immediate and, therefore, was not enough to satisfy cereals’ N requirements. Despite Passoni and Borin [16] reported a peak of NO3-N release in the soil through organic matter mineralization just after compost distribution, our results suggested that part of N supplied through compost fertilization remained in the soil in the organic form, probably due to the slow mineralization rate of soil organic matter [33]. Similarly, the high ARE and UE values calculated for maize and wheat fertilized with 100% mineral fertilization or 50% compost +50% mineral fertilization suggested a great N use efficiency likely due to the relatively immediate availability of N supplied with mineral fertilizers. Instead, the low ARE and UE values calculated under 100% organic fertilization treatments suggested that a single application of compost at the beginning of the cropping season was not enough to promptly satisfy the crop N requirements, which reduces the crop N use efficiency. Sunflower exhibited a completely different behavior with respect to maize and wheat with the comparable ANB and ARE obtained for 100% compost and 50% compost +50% mineral fertilization schemes. The comparable results between compost and miner fertilization suggested that, after three years of organic fertilizer application, the turnover of supplied organic matter with compost reached a virtual equilibrium between the stable organic matter and the mineralized one. Therefore, this allows a suitable availability of N for cultivated crops.
The significant soil organic carbon increase measured between the beginning and end of the experiment on the average of treatments suggested the interesting amendment effect of crop residues (straw biomass) when correctly incorporated in the soil whereas it indicated that compost has no evident effects on soil properties in the short term when applied at low doses. Our results may appear to disagree with the literature data that highlight the amendment potential of compost [35]. However, it has to be taken into account that the approach of this paper considers compost as the N fertilization source and, as a consequence, it was applied in a quantity many times lower than in studies where compost is studied as an amendment.
The relatively low cumulated N uptake in crop biomass obtained under 100% compost fertilization suggested relatively high N residues in the soil after harvesting. However, this peculiar situation could allow a probable contamination of groundwater through NO3-N leaching, especially during an abundant rainy period. The results obtained disclaimed this hypothesis. The comparable soil NO3-N concentration measured between 100% compost and unfertilized treatments at both the beginning and end of this study indicated that N supplied through composted material remained in the soil mainly in the organic form [16], which was less mobile than the nitric form. Therefore, this reduces groundwater contamination risk. The potential contamination of groundwater depends mainly on the organic N mineralization rate of the amendment used. The not significant different N leaching between soil amended with compost, at the end of three experimental years, was reported by Mamo et al. [36]. Instead, Santos et al. reported the possible compost use as organic fertilizers in the partial substitution of mineral fertilizers, without a significant nitrate leaching risk [37].
5. Conclusions
The results obtained indicated that the crop response to compost fertilization is not unique. Indeed, organic fertilization with compost represents a valid substitute for mineral fertilization in wheat and sunflower whereas it should be complemented by mineral fertilization to maximize maize yield. The lower performance of maize than the other species was probably due to its position as the first species in the crop succession when compost organic matter turnover had not reached an equilibrium between the stable fraction and the mineralized one yet. Under 100% of compost fertilization, the crops did not take up a large amount of N, but it did not generate an increase of NO3-N leaching in the percolation water. Long-term studies to better evaluate the compost as a substitute for mineral N fertilization of herbaceous crops are desirable.
Author Contributions
Conceptualization, M.B. Formal analysis, C.M. and A.B. Resources, M.B.; Writing—original draft preparation, C.M. and A.B. Writing—review and editing, C.M., A.B. and M.B. Visualization, C.M. and A.B. Supervision, M.B.
Funding
This research was supported by Veneto Agricoltura, Project “Valorization and environmental impact of the use of compost in the fertilization of field crops”.
Conflicts of Interest
The authors declare no conflict of interest.
References
- Khan, S.A.; Mulvaney, R.L.; Ellsworth, T.R.; Boast, C.W. The myth of nitrogen fertilization for soil carbon sequestration. J. Environ. Qual. 2007, 36, 1821–1832. [Google Scholar] [CrossRef] [PubMed]
- Susic, M. Replenishing humic acids in agricultural soils. Agronomy 2016, 6, 45. [Google Scholar] [CrossRef]
- Camacho Barboza, J.; Zanin, G.; Ponchia, G.; Sambo, P. Use of anaerobic digested residues in open field horticulture in the Veneto region, Italy. Acta Hortic. 2014, 1018, 133–138. [Google Scholar] [CrossRef]
- Bassan, A.; Sambo, P.; Zanin, G.; Evans, M.R. Rice hull-based substrates amended with anaerobic digested residues for tomato transplant production. Acta Hortic. 2014, 1018, 573–581. [Google Scholar] [CrossRef]
- Zanin, G.; Gobbi, V.; Coletto, L.; Passoni, M.; Nicoletto, C.; Ponchia, G.; Sambo, P. Use of organic fertilizers in nursery production of ornamental woody species. Acta Hortic. 2016, 1112, 379–386. [Google Scholar] [CrossRef]
- Takakai, F.; Nakagawa, S.; Sato, K.; Kon, K.; Sato, T.; Kaneta, Y. Net greenhouse gas budget and soil carbon storage in a field with paddy–upland rotation with different history of manure application. Agriculture 2017, 7, 49. [Google Scholar] [CrossRef]
- Martínez-Blanco, J.; Lazcano, C.; Christensen, T.H.; Muñoz, P.; Rieradevall, J.; Møller, J.; Antón, A.; Boldrin, A. Compost benefits for agriculture evaluated by life cycle assessment. A review. Agron. Sustain. Dev. 2013, 33, 721–732. [Google Scholar] [CrossRef]
- Horrocks, A.; Curtin, D.; Tregurtha, C.; Meenken, E. Municipal compost as a nutrient source for organic crop production in New Zealand. Agronomy 2016, 6, 35. [Google Scholar] [CrossRef]
- Fecondo, G.; Guastadisegni, G.; D’Ercole, M.; Del Bianco, M.; Buda, P.A. Utilizzo di compost di qualità su colture arboree per il miglioramento della fertilità del terreno. Ital. J. Agron. 2008, 1, 31–36. [Google Scholar] [CrossRef]
- Takakai, F.; Kikuchi, T.; Sato, T.; Takeda, M.; Sato, K.; Nakagawa, S.; Kon, K.; Sato, T.; Kaneta, Y. Changes in the nitrogen budget and soil nitrogen in a field with paddy–upland rotation with different histories of manure application. Agriculture 2017, 7, 39. [Google Scholar] [CrossRef]
- Montemurro, F.; Maiorana, M.; Convertini, G.; Fornaro, F. Improvement of soil properties and nitrogen utilisation of sunflower by amending municipal solid waste compost. Agron. Sustain. Dev. 2005, 25, 369–375. [Google Scholar] [CrossRef]
- Islam, M.A.; Islam, S.; Akter, A.; Rahman, M.H.; Nandwani, D. Effect of organic and inorganic fertilizers on soil properties and the growth, yield and quality of tomato in Mymensingh, Bangladesh. Agriculture 2017, 7, 18. [Google Scholar] [CrossRef]
- Fecondo, G.; Bucciarelli, S.; Di Paolo, E.; Ghianni, G. Biowaste compost effects on productive and qualitative characteristics of some field crops and on soil fertility. Ital. J. Agron. 2015, 10, 85–89. [Google Scholar] [CrossRef]
- Nicoletto, C.; Santagata, S.; Sambo, P. Effect of compost application on qualitative traits in cabbage. Acta Hortic. 2013, 1005, 389–395. [Google Scholar] [CrossRef]
- Seehausen, M.L.; Gale, N.V.; Dranga, S.; Hudson, V.; Liu, N.; Michener, J.; Thurston, E.; Williams, C.; Smith, S.M.; Thomas, S.C. Is there a positive synergistic effect of biochar and compost soil amendments on plant growth and physiological performance? Agronomy 2017, 7, 13. [Google Scholar] [CrossRef]
- Passoni, M.; Borin, M. Effects of different composts on soil nitrogen balance and dynamics in a biennial crop succession. Compost Sci. Util. 2009, 17, 108–116. [Google Scholar] [CrossRef]
- Gobbi, V.; Bonato, S.; Nicoletto, C.; Zanin, G. Spent mushroom substrate as organic fertilizer: Vegetable organic trials. Acta Hortic. 2016, 1146, 49–56. [Google Scholar] [CrossRef]
- Ponchia, G.; Passoni, M.; Bonato, S.; Nicoletto, C.; Sambo, P.; Zanin, G. Evaluation of compost and anaerobic digestion residues as a component of growing media for ornamental shrub production. Acta Hortic. 2017, 1168, 71–78. [Google Scholar] [CrossRef]
- IUSS Working Group WRB. World Reference Base for Soil Resources 2014, Update 2015 International Soil Classification System for Naming Soils and Creating Legends for Soil Maps; World Soil Resources Reports No. 106; FAO: Rome, Italy, 2015. [Google Scholar]
- Ministero delle Politiche Agricole. Metodi Ufficiali di Analisi Fisica del Suolo. 1997. Available online: https://www.gazzettaufficiale.it/eli/id/1997/09/02/097A6592/sg (accessed on 28 October 2005).
- Ministero delle Politiche Agricole. Metodi Ufficiali di Analisi Chimica del Suolo. 1999. Available online: https://www.gazzettaufficiale.it/eli/id/1999/10/21/099A8497/sg (accessed on 28 October 2005).
- Loubser, H.L.; Human, J.J. The effect of nitrogen and phosphorus fertilization on the nitrogen absorption by sunflowers. J. Agron. Crop Sci. 1993, 170, 39–48. [Google Scholar] [CrossRef]
- Ruffo, M.L.; García, F.O.; Bollero, G.A.; Fabrizzi, K.; Ruiz, R.A. Nitrogen balance approach to sunflower fertilization. Commun. Soil Sci. Plant Anal. 2003, 34, 2645–2657. [Google Scholar] [CrossRef]
- Köppen, W. Das geographische System der Klimate (Handbuch der Klimatologie, Bd. 1, Teil C). 1936. Available online: http://koeppen-geiger.vu-wien.ac.at/pdf/Koppen_1936.pdf (accessed on 27 March 2019).
- Fageria, N.K.; De Morais, O.P.; Dos Santos, A.B. Nitrogen use efficiency in upland rice genotypes. J. Plant Nutr. 2010, 33, 1696–1711. [Google Scholar] [CrossRef]
- Cataldo, D.A.; Maroon, M.; Schrader, L.E.; Youngs, V.L. Rapid colorimetric determination of nitrate in plant tissue by nitration of salicylic acid. Commun. Soil Sci. Plant Anal. 1975, 6, 71–80. [Google Scholar] [CrossRef]
- Dal Ferro, N.; Zanin, G.; Borin, M. Crop yield and energy use in organic and conventional farming: A case study in north-east Italy. Eur. J. Agron. 2017, 86, 37–47. [Google Scholar] [CrossRef]
- Lakhdara, A.; Rabhia, M.; Ghnayaa, T.; Montemurro, F.; Jedidi, N.; Abdellya, C. Effectiveness of compost use in salt-affected soils. J. Hazard. Mater. 2009, 171, 29–37. [Google Scholar] [CrossRef]
- Teutscherova, N.; Vazquez, E.; Santana, D.; Navas, M.; Masaguer, A.; Benito, M. Influence of pruning waste compost maturity and biochar on carbon dynamics in acid soil: Incubation study. Eur. J. Soil Biol. 2017, 78, 66–74. [Google Scholar] [CrossRef]
- Wilson, C.; Zebarth, B.J.; Burton, D.L.; Goyer, C.; Moreau, G.; Dixon, T. Effect of Diverse Compost Products on Potato Yield and Nutrient Availability. Am. J. Potato Res. 2019. [Google Scholar] [CrossRef]
- Amlinger, F.; Götz, B.; Dreher, P.; Geszti, J.; Weissteiner, C. Nitrogen in biowaste and yard waste compost: Dynamics of mobilisation and availability—A review. Eur. J. Soil Biol. 2003, 39, 107–116. [Google Scholar] [CrossRef]
- Eghball, B. Nitrogen mineralization from field applied beef cattle feedlot manure or compost. Commun. Soil Sci. Plant Anal. 2000, 17, 989–998. [Google Scholar] [CrossRef]
- Eghball, B.; Wienhold, B.J.; Gilley, J.E.; Eigenberg, R.A. Mineralization of manure nutrients. J. Soil Water Conserv. 2002, 57, 470–473. [Google Scholar]
- Preusch, P.L.; Adler, P.R.; Sikora, L.J.; Tworkosoky, T.J. Nitrogen and phosphorus availability in composted and uncomposted poultry litter. J. Environ. Qual. 2002, 31, 2051–2057. [Google Scholar] [CrossRef]
- Hergreaves, J.C.; Adl, M.S.; Warman, P.R. A review of the use of composted municipal solid waste in agriculture. Agric. Ecosyst. Environ. 2008, 123, 1–14. [Google Scholar] [CrossRef]
- Mamo, M.; Rosen, C.J.; Halbach, T.R. Nitrogen availability and leaching from soil amended with municipal solid waste compost. J. Environ. Qual. 1999, 28, 1074–1082. [Google Scholar] [CrossRef]
- Santos, A.; Fangueiro, D.; Moral, R.; Bernal, M.P. Composts Produced from Pig Slurry Solids: Nutrient Efficiency and N-Leaching Risks in Amended Soils. Front. Sustain. Food Syst. 2018, 2, 8. [Google Scholar] [CrossRef]
Figure 1.
Average global radiation (MJ m−2) (a), air temperature (°C), (b) and cumulated monthly rainfall (mm) (c) recorded during the experimental period of plants harvesting and measurements.
Figure 1.
Average global radiation (MJ m−2) (a), air temperature (°C), (b) and cumulated monthly rainfall (mm) (c) recorded during the experimental period of plants harvesting and measurements.

Figure 2.
Maize dry biomass production: total biomass, stalk biomass, and grain yield. Histograms indicate average values while bars indicate standard deviation. Different letters indicate significant differences according to Tukey’s HSD test at p < 0.05 between treatments of the same biomass component. G50: 50% of N from G compost and 50% of N from mineral fertilization (MF). GFO50: 50% of N from G + F + O compost and 50% of N from MF. GS50: 50% of N from G + S compost and 50% of N from MF. GF50: 50% of N from G + F compost and 50% of N from MF. GFO100: 100% of N from G + F + O fertilization. G100: 100% of N from G compost. Min100: 100% of N from MF. C: Un-fertilized treatment.

Figure 3.
Wheat dry biomass production: grain, straw, and total biomass. Histograms indicate average values while bars indicate standard deviation. Different letters indicate significant differences, according to Tukey’s HSD test at p < 0.05 between treatments of the same biomass component. G50: 50% of N from G compost and 50% of N from mineral fertilization (MF). GFO50: 50% of N from G + F + O compost and 50% of N from MF. GS50: 50% of N from G + S compost and 50% of N from MF. GF50: 50% of N from G + F compost and 50% of N from MF. GFO100: 100% of N from G + F + O fertilization. G100: 100% of N from G compost. Min100: 100% of N from MF. C: Un-fertilized treatment.

Figure 4.
Cumulated biomass production (Mg ha−1) over the entire crop succession. Different letters indicate significant differences, according to Tukey’s HSD test at p < 0.05. G50: 50% of N from G compost and 50% of N from mineral fertilization (MF). GFO50: 50% of N from G + F + O compost and 50% of N from MF. GS50: 50% of N from G + S compost and 50% of N from MF. GF50: 50% of N from G + F compost and 50% of N from MF. GFO100: 100% of N from G + F + O fertilization. G100: 100% of N from G compost. Min100: 100% of N from MF. C: Un-fertilized treatment.

Figure 5.
Cumulated nitrogen uptake (kg ha−1) over the entire crop succession. Different letters indicate significant differences according to Tukey’s HSD test at p < 0.05. G50: 50% of N from G compost and 50% of N from mineral fertilization (MF). GFO50: 50% of N from G + F + O compost and 50% of N from MF. GS50: 50% of N from G + S compost and 50% of N from MF. GF50: 50% of N from G + F compost and 50% of N from MF. GFO100: 100% of N from G + F + O fertilization. G100: 100% of N from G compost. Min100: 100% of N from MF. C: Un-fertilized treatment.

Figure 6.
Nitrate nitrogen concentration in percolation water during the sunflower growing season. Different letters among treatments indicate significant differences according to the Kruskal-Wallis test, p < 0.05. G50: 50% of N from G compost and 50% of N from mineral fertilization (MF). GFO50: 50% of N from G + F + O compost and 50% of N from MF. GS50: 50% of N from G + S compost and 50% of N from MF. GF50: 50% of N from G + F compost and 50% of N from MF. GFO100: 100% of N from G + F + O fertilization. G100: 100% of N from G compost. Min100: 100% of N from MF. C: Un-fertilized treatment.


Table 1.
Main features of soil used during the experiment.
| Parameters | Average Value |
|---|---|
| Sand (%) | 34.7 |
| Silt (%) | 55.3 |
| Clay (%) | 10.0 |
| pH | 7.7 |
| Organic carbon (%) | 1.2 |
| Organic matter (%) | 2.1 |
| Total CaCO3 (%) | 26.4 |
| Active CaCO3 (%) | 2.7 |
| Total nitrogen (g kg−1) | 1.4 |
| C/N ratio | 8.7 |
| Available phosphorus (mg P2O5 kg−1) | 81.1 |
| Available Potassium (mg K2O kg−1) | 2.6 |
| Bulk density (Mg m−3) | 1.2 |
| Volumetric field capacity % (10 kPa) | 32.0 |
| Volumetric wilting point % (1500 kPa) | 8.0 |
Table 2.
Main agronomic operations carried out during the three-year crop succession.
| Month | 2006 | 2007 | 2008 |
|---|---|---|---|
| January | - | Mineral fertilization (27th) | - |
| Febuary | - | - | - |
| March | - | - | Soil till (20th) Organic and mineral fertilization (31st) |
| April | Soil till (3rd) | - | Sunflower sowing, herbicide distribution (Global 0.4 L ha−1, Erbifos 1 L ha−1) (28th) |
| May | Organic and mineral fertilization (15th) Maize sowing (16th) | - | Fungicide distribution (King 250 mL hl−1) (29th) |
| June | Irrigation (40 mm) (16th) Mineral fertilization (29th) | Wheat harvesting (18th) | Mineral fertilization (5th) Fungicide distribution (King 250 mL hl−1) (9th) |
| July | Herbicide distribution (Silver, 1 kg ha−1) (4th) Irrigation (40 mm) (21st) Irrigation (40 mm) (28th) | - | - |
| August | - | - | - |
| September | - | - | Sunflower harvesting (2nd) |
| October | Maize harvesting (3rd) Soil till (10th) | - | - |
| November | Organic and mineral fertilization (2nd) Wheat sowing (3rd) | - | - |
| December | - | - | - |
Table 3.
Main chemical-physical characteristics of the compost types used in the trial.
| Compost | TN (g kg−1) | Dry Matter % | Salinity (dS m−1) * | Organic Carbon (g kg−1) * | C/N |
|---|---|---|---|---|---|
| GS | 17 ± 3 | 70.9 ± 2.9 | 1.76 | 265 | 15.5 |
| GFO | 27 ± 2 | 65.8 ± 1.6 | 2.47 | 250 | 11.0 |
| G | 19 ± 2 | 60.2 ± 2.9 | 1.08 | 275 | 18.0 |
| GF | 20 ± 1 | 75.6 ± 12.2 | 3.69 | 250 | 11.0 |
TN and Organic Carbon values are expressed on a dry matter basis. * Value determination in an average sample of compost used in the three experimental years. GS: Compost derived from green cutting and depuration sludge. GFO: Compost derived from green cutting, organic fraction of municipal wastes, and other organic materials. G: Compost derived from green cutting. GF: Compost derived from green cutting and organic fraction of municipal wastes.
Table 4.
Fertilization schemes adopted for all studied crops.
| Treatment | Crop | Fresh Compost (Mg ha−1) | Compost N (kg ha−1) | Mineral N (kg ha−1) |
|---|---|---|---|---|
| G50 | Z. mays | 11.5 | 125 | 125 |
| GFO50 | Z. mays | 7.2 | 125 | 125 |
| GS50 | Z. mays | 9.4 | 125 | 125 |
| GF50 | Z. mays | 7.0 | 125 | 125 |
| GFO100 | Z. mays | 14.4 | 250 | - |
| G100 | Z. mays | 18.7 | 250 | - |
| Min100 | Z. mays | - | - | 250 |
| C | Z. mays | - | - | - |
| G50 | T. aestivum | 5.0 | 75 | 75 |
| GFO50 | T. aestivum | 4.4 | 75 | 75 |
| GS50 | T. aestivum | 6.4 | 75 | 75 |
| GF50 | T. aestivum | 5.1 | 75 | 75 |
| GFO100 | T. aestivum | 8.8 | 150 | - |
| G100 | T. aestivum | 12.8 | 150 | - |
| Min100 | T. aestivum | - | - | 150 |
| C | T. aestivum | - | - | - |
| G50 | H. annus | 11.5 | 125 | 125 |
| GFO50 | H. annus | 6.5 | 125 | 125 |
| GS50 | H. annus | 12.9 | 125 | 125 |
| GF50 | H. annus | 9.6 | 125 | 125 |
| GFO100 | H. annus | 13.0 | 250 | - |
| G100 | H. annus | 25.8 | 250 | - |
| Min100 | H. annus | - | - | 250 |
| C | H. annus | - | - | - |
G50: 50% of N from G compost and 50% of N from mineral fertilization (MF). GFO50: 50% of N from G + F + O compost and 50% of N from MF. GS50: 50% of N from G + S compost and 50% of N from MF. GF50: 50% of N from G + F compost and 50% of N from MF. GFO100: 100% of N from G + F + O fertilization. G100: 100% of N from G compost. Min100: 100% of N from MF. C: Un-fertilized treatment.
Table 5.
Nitrogen (N) concentration (%) in the grain and residues of the studied crops.
| Crop | Treatment | N Concentration (%) | N Uptake (kg ha−1) | ||
|---|---|---|---|---|---|
| Grain | Residues | Grain | Residues | ||
| Z. mays | G50 | 1.5 | 0.8 | 90.9 ± 21.1 | 176.6 ± 25.5 |
| GFO50 | 1.5 | 0.5 | 96.9 ± 20.6 | 133.0 ± 9.4 | |
| GS50 | 1.5 | 0.5 | 98.8 ± 25.2 | 128.8 ± 12.3 | |
| GF50 | 1.4 | 0.6 | 96.0 ± 21.4 | 155.9 ± 12.2 | |
| GFO100 | 1.0 | 0.3 | 53.7 ± 10.7 | 64.9 ± 8.3 | |
| G100 | 1.1 | 0.4 | 61.3 ± 2.6 | 84.1 ± 8.6 | |
| Min100 | 1.7 | 0.8 | 126.6 ± 11.6 | 193.6 ± 12.5 | |
| C | 1.1 | 0.3 | 59.3 ± 12.1 | 65.0 ± 5.3 | |
| Average | 1.4 | 0.5 | 85.5 ± 28.6 | 125.2 ± 48.5 | |
| T. aestivum | G50 | 1.9 | 0.6 | 95.5 ± 17.0 | 88.4 ± 7.8 |
| GFO50 | 2.0 | 0.5 | 106.2 ± 14.7 | 74.2 ± 10.5 | |
| GS50 | 2.0 | 0.6 | 101.7 ± 16.4 | 88.2 ± 13.4 | |
| GF50 | 2.0 | 0.6 | 106.3 ± 14.7 | 88.3 ± 12.4 | |
| GFO100 | 1.7 | 0.4 | 85.1 ± 10.5 | 51.3 ± 4.5 | |
| G100 | 1.6 | 0.3 | 82.6 ± 9.4 | 40.2 ± 5.8 | |
| Min100 | 2.1 | 0.7 | 98.4 ± 23.9 | 105.5 ± 7.5 | |
| C | 1.7 | 0.4 | 85.6 ± 6.7 | 54.4 ± 5.1 | |
| Average | 1.9 | 0.5 | 95.2 ± 9.6 | 73.8 ± 22.8 | |
| H. annus | G50 | 2.1 | 1.2 | 48.3 ± 12.2 | 54.9 ± 11.9 |
| GFO50 | 1.7 | 1.1 | 41.6 ± 9.1 | 56.5 ± 9.9 | |
| GS50 | 2.0 | 1.1 | 46.5 ± 9.6 | 55.4 ± 11.1 | |
| GF50 | 2.0 | 1.1 | 50.1 ± 11.3 | 62.6 ± 10.8 | |
| GFO100 | 1.1 | 1.0 | 27.9 ± 6.8 | 53.5 ± 11.6 | |
| G100 | 1.5 | 1.3 | 29.7 ± 7.2 | 51.1 ± 9.4 | |
| Min100 | 2.5 | 1.5 | 47.9 ± 14.1 | 62.8 ± 9.6 | |
| C | 0.9 | 0.8 | 16.8 ± 5.0 | 30.9 ± 10.6 | |
| Average | 1.7 | 1.1 | 38.6 ± 12.3 | 53.5 ± 10.0 | |
G50: 50% of N from G compost and 50% of N from mineral fertilization (MF). GFO50: 50% of N from G + F + O compost and 50% of N from MF. GS50: 50% of N from G + S compost and 50% of N from MF. GF50: 50% of N from G + F compost and 50% of N from MF. GFO100: 100% of N from G + F + O fertilization. G100: 100% of N from G compost. Min100: 100% of N from MF. C: Un-fertilized treatment.
Table 6.
Apparent nitrogen balance (ANB), agronomic efficiency (AE), physiological efficiency (PE), agro-physiological efficiency (APE), apparent recovery efficiency (ARE), and utilization efficiency (UE) indexes were calculated for the different crops and for the entire crop succession.
Table 6.
Apparent nitrogen balance (ANB), agronomic efficiency (AE), physiological efficiency (PE), agro-physiological efficiency (APE), apparent recovery efficiency (ARE), and utilization efficiency (UE) indexes were calculated for the different crops and for the entire crop succession.
| Crop | Treatment | ANB (kg ha−1) | AE (mg mg−1) | PE (mg mg−1) | APE (mg mg−1) | ARE (%) | UE (mg mg−1) |
|---|---|---|---|---|---|---|---|
| Z. mays | G50 | −17.6 | 3.5 | 27.9 | 6.1 | 57.3 | 16.0 |
| GFO50 | 20.1 | 5.1 | 56.5 | 12.0 | 42.2 | 23.8 | |
| GS50 | 22.4 | 5.1 | 48.3 | 12.2 | 41.3 | 20.0 | |
| GF50 | −1.9 | 5.5 | 45.2 | 10.7 | 51.0 | 23.0 | |
| GFO100 | 131.4 | −0.5 | 69.7 | 20.5 | −2.3 | −1.6 | |
| G100 | 104.7 | 1.0 | 42.8 | 12.4 | 8.4 | 3.6 | |
| Min100 | −70.3 | 8.5 | 38.4 | 10.9 | 78.4 | 30.1 | |
| C | −124.3 | - | - | - | - | - | |
| T. aestivum | G50 | −48.3 | 6.5 | 57.1 | 13.2 | 49.2 | 28.1 |
| GFO50 | −25.6 | 0.3 | 79.5 | 1.0 | 34.0 | 27.1 | |
| GS50 | −37.2 | −0.3 | 65.2 | −0.6 | 41.7 | 27.2 | |
| GF50 | −48.6 | 3.6 | 49.9 | 7.3 | 49.4 | 24.7 | |
| GFO100 | 11.6 | 4.6 | 129.6 | 49.8 | 9.2 | 12.0 | |
| G100 | 24.2 | 0.4 | 1499.8 | 426.2 | 0.8 | 11.9 | |
| Min100 | −58.8 | 0.1 | 40.2 | 0.2 | 56.1 | 22.6 | |
| C | −124.6 | - | - | - | - | - | |
| H. annus | G50 | 146.7 | 1.2 | 17.4 | 5.6 | 22.2 | 3.9 |
| GFO50 | 151.9 | 1.8 | 29.2 | 8.9 | 20.1 | 5.9 | |
| GS50 | 148.1 | 1.6 | 21.2 | 7.2 | 21.7 | 4.6 | |
| GF50 | 137.3 | 2.4 | 29.1 | 9.1 | 26.0 | 7.6 | |
| GFO100 | 168.6 | 2.5 | 54.8 | 18.7 | 13.5 | 7.4 | |
| G100 | 169.2 | 0.04 | −2.2 | 0.3 | 13.2 | −0.3 | |
| Min100 | 139.2 | −0.3 | −0.3 | −1.1 | 25.2 | −0.1 | |
| C | −47.7 | - | - | - | - | - | |
| Crop succession | G50 | 77.1 | 4.2 | 28.2 | 9.9 | 41.9 | 11.8 |
| GFO50 | 151.8 | 3.5 | 41.8 | 11.6 | 30.4 | 12.7 | |
| GS50 | 130.2 | 3.5 | 38.0 | 10.4 | 33.8 | 12.8 | |
| GF50 | 95.7 | 4.4 | 31.8 | 11.4 | 39.1 | 12.4 | |
| GFO100 | 288.4 | 3.8 | 102.9 | 40.8 | 9.4 | 9.7 | |
| G100 | 299.6 | 1.3 | 16.8 | 16.9 | 7.7 | 1.3 | |
| Min100 | 51.7 | 0.3 | 21.5 | 0.6 | 45.9 | 9.9 | |
| C | −300.3 | - | - | - | - | - |
G50: 50% of N from G compost and 50% of N from mineral fertilization (MF). GFO50: 50% of N from G + F + O compost and 50% of N from MF. GS50: 50% of N from G + S compost and 50% of N from MF. GF50: 50% of N from G + F compost and 50% of N from MF. GFO100: 100% of N from G + F + O fertilization. G100: 100% of N from G compost. Min100: 100% of N from MF. C: Un-fertilized treatment.
Table 7.
Soil nitrate nitrogen (0–50 cm soil profile) at the beginning and end of the trial (mean ± SD).
Table 7.
Soil nitrate nitrogen (0–50 cm soil profile) at the beginning and end of the trial (mean ± SD).
| Treatment | NO3-N (mg kg−1) | ANOVA | |
|---|---|---|---|
| Start | End | ||
| G50 | 2.49 ± 0.37 | 2.43 ± 0.51 | ns |
| GFO50 | 3.73 ± 0.78 | 2.54 ± 0.37 | ns |
| GS50 | 3.27 ± 0.54 | 2.68 ± 0.29 | ns |
| GF50 | 2.52 ± 0.44 | 2.96 ± 0.67 | ns |
| GFO100 | 2.19 ± 0.52 | 1.75 ± 0.17 | ns |
| G100 | 2.56 ± 0.57 | 2.29 ± 0.36 | ns |
| Min100 | 2.54 ± 0.36 | 4.45 ± 0.91 | * |
| C | 3.24 ± 0.52 | 1.84 ± 0.39 | * |
| Average | 3.09 | 2.62 | - |
* Significant difference among treatment for each soil layer at p < 0.05 Tukey (HSD) test. ns = not significant. G50: 50% of N from G compost and 50% of N from mineral fertilization (MF). GFO50: 50% of N from G + F + O compost and 50% of N from MF. GS50: 50% of N from G + S compost and 50% of N from MF. GF50: 50% of N from G + F compost and 50% of N from MF. GFO100: 100% of N from G + F + O fertilization. G100: 100% of N from G compost. Min100: 100% of N from MF. C: Un-fertilized treatment.
© 2019 by the authors. Licensee MDPI, Basel, Switzerland. This article is an open access article distributed under the terms and conditions of the Creative Commons Attribution (CC BY) license (http://creativecommons.org/licenses/by/4.0/).
Share and Cite
MDPI and ACS Style
Maucieri, C.; Barco, A.; Borin, M. Compost as a Substitute for Mineral N Fertilization? Effects on Crops, Soil and N Leaching. Agronomy 2019, 9, 193. https://0-doi-org.brum.beds.ac.uk/10.3390/agronomy9040193
AMA Style
Maucieri C, Barco A, Borin M. Compost as a Substitute for Mineral N Fertilization? Effects on Crops, Soil and N Leaching. Agronomy. 2019; 9(4):193. https://0-doi-org.brum.beds.ac.uk/10.3390/agronomy9040193
Chicago/Turabian StyleMaucieri, Carmelo, Alberto Barco, and Maurizio Borin. 2019. "Compost as a Substitute for Mineral N Fertilization? Effects on Crops, Soil and N Leaching" Agronomy 9, no. 4: 193. https://0-doi-org.brum.beds.ac.uk/10.3390/agronomy9040193
Note that from the first issue of 2016, this journal uses article numbers instead of page numbers. See further details here.