Article

Biostimulant Application with a Tropical Plant Extract Enhances Corchorus olitorius Adaptation to Sub-Optimal Nutrient Regimens by Improving Physiological Parameters

1
Department of Environmental, Biological and Pharmaceutical Sciences and Technologies, University of Campania “Luigi Vanvitelli”, 81100 Caserta, Italy
2
Department of Agricultural and Forestry Sciences, University of Tuscia, 01100 Viterbo, Italy
3
Department of Agricultural Sciences, University of Naples Federico II, 80055 Portici, Italy
4
NGA Laboratory, 437162 Tarragona, Spain
5
Department of Vegetable Crops, Agricultural Research Institute, 1516 Nicosia, Cyprus
*
Author to whom correspondence should be addressed.
Submission received: 8 April 2019 / Revised: 12 May 2019 / Accepted: 17 May 2019 / Published: 19 May 2019
(This article belongs to the Collection Nutrition Management of Hydroponic Vegetable Crops)

Abstract

:
The emerging role of plant biostimulants in enhancing nutrient efficiency is important for maintaining soil fertility under sub-optimal nutrient regimens. We aimed to elucidate the morpho-physiological and biochemical effects as well as mineral composition changes of greenhouse jute (Corchorus olitorius L.) treated with a commercial vegetal-derived biostimulant from a tropical plant extract (PE; Auxym®, Italpollina, Rivoli Veronese, Italy). Plants were sprayed in weekly intervals with a solution containing 2 mL·L−1 PE. Jute plants were supplied with three nutrient solution concentrations: full-, half-, and quarter-strength. Decreasing macronutrient concentrations in the nutrient solution (NS), especially at quarter-strength, triggered a decrease in several morphological (plant height, leaf number, and dry biomass) and physiological (net CO2 assimilation rate (ACO2) and SPAD (Soil Plant Analysis Development) index) parameters. PE application triggered specific ameliorative effects in terms of fresh yield at both half- and quarter-strength nutrient solution (15.5% and 29.5%, respectively). This was associated with an enhancement in ACO2, SPAD index, and especially the nutritional status (high nitrate, K, and Mg contents, and low Na content). The foliar application of PE, strongly increased chlorophyll b content, enhancing jute plant adaptation to fluctuating light and therefore the efficiency of photosynthesis, positively affecting starch, soluble proteins, and total amino acids content but only when jute plants were irrigated with full-strength NS, compared to the respective control treatment. At lower nutrient strength, PE reprogrammed the nitrogen distribution, allowing its remobilization from glutamate, which was quantitatively the major amino acid under lower nutrient strength, but not from chlorophylls, thus maintaining efficient photosynthesis. We confirmed that PE Auxym® acts in a balanced manner on the main metabolic pathways of the plant, regulating the uptake and transport of mineral nutrients and protein synthesis, increasing the accumulation of essential amino acids under full nutritive solutions, and re-distributing nitrogen from amino acids to allow leaf growth and expansion even under sub-optimal nutrient conditions. Overall, the use of natural plant biostimulants may be a potential solution in low-input conditions, where environmental constraints and restricted use of fertilizers may affect potential crop productivity.

1. Introduction

Misuse of agricultural fertilizers to boost plant production systems has occurred, even if the increase in fertilizers has not always corresponded to an increase in productivity. Due to the limited mineral uptake capacity of the shallow root system, especially in vegetable cropping systems, most of the applied mineral fertilizers have been lost in the soil, causing its pollution and degradation [1,2]. In the greenhouse sector, where the fertilizer inputs per unit area are much higher than any other agricultural system, this situation appears particularly serious [2,3,4]. Hence, sustainable agricultural intensification can be achieved only by improving plant crops’ resource use efficiency (RUE) while reducing the use of chemical fertilizers and their environmental impact [5,6]. A promising and environmentally friendly approach could be the use of plant biostimulants (PB), which are defined at European level as:
products stimulating plant nutrition processes independently of the product’s nutrient content, with the aim of improving one or more of the following characteristics of the plant: (1) nutrient use efficiency, (2) tolerance to abiotic stress, (3) crop quality traits, or (4) availability of confined nutrients in the soil and rhizosphere.
[7]
Among PB, natural bioactive substances (seaweed and plant extracts, protein hydrolysates, and humic and fulvic acids) and beneficial microorganisms (mycorrhizal fungi and plant growth-promoting rhizobacteria belonging to the genera Azospirillum, Azotobacter, and Rhizobium spp.) have been shown to improve plant productivity and tolerance to abiotic stressors by modifying and regulating the activities of carbon and nitrogen metabolism enzymes, hormonal activities, and secondary metabolism [7,8,9,10,11]. In addition to the benefits of PB on yield and abiotic stress tolerance, biostimulants have the capacity to improve nutrient use efficiency (NUE), which is considered an important claim for both economic and environmental reasons [8]. PB have been proven to boost NUE by improving uptake, assimilation, and use of macro- and micronutrients [12,13,14,15,16]. This latter effect has been mainly related to root morphological changes, including increases in density, length, surface area, number of lateral roots, and root exudation of low-molecular-weight compounds, which facilitate the formation of micro-aggregates that enhance microbial activity and, in particular, nitrogen and phosphorus uptake [1,13,17]. PB can increase the activity of the plasma membrane H+-ATPase acidifying rhizosphere and increase the solubility of micronutrients [14]. The positive effects of PB on plant RUE also include the improvement of nutritional and nutraceutical quality of plants, increasing the synthesis and accumulation of bioactive molecules with antioxidant activity like carotenoids, ascorbic acid, or phenolic compounds [9,18]. However, the responses induced by PBs, like the commercial vegetal-derived biostimulant produced through water extraction and fermentation of tropical plant biomass (Auxym®, Italpollina, Rivoli Veronese, Italy), which highly improves the mineral status of spinach and tomato [1,16], have been investigated only in control conditions (i.e., absence of stress). To the best of our knowledge, no data are available concerning the effect of these vegetal-derived biostimulants (containing mainly phytohormones, amino acids, peptides, vitamins, and microelements) on yield and functional quality of leafy vegetable crops under different levels of nutrients in the media solution, even if improving plant crops’ RUE while reducing the use of chemical fertilizers is a priority.
Jute plants (Corchorus sp.), shrubs belonging to the Malvaceae family that grow spontaneously in the wild, are cultivated in all tropical areas because of their potential and multiple uses both for industrial processing and food [19]. In the Middle East and North Africa, the species Corchorus olitorius L. (n = 24), known by the common name of molokhia, is consumed as a leafy vegetable, fresh or dry, accompanying soups or as part of traditional dishes of Arab and African culture [19,20,21,22]. It has a high nutritional value as source of essential amino acids, such as methionine [23]; however, it has important nutraceutical properties, containing high concentrations of β-carotene, riboflavin, ascorbic acid, folic acid, iron, tocopherols, and phenolic compounds [24]. Given the presence of these antioxidant metabolites, its use has been associated with the prevention of chronic diseases such as cancer, diabetes, hypertension, and heart disease [24,25,26]. Even the use of a nutrient solution with halved nutrient concentrations does not negatively affect the growth and post-harvest performance of jute plants [23]. Therefore, it would be particularly interesting to verify whether the use of a bio-activator of vegetal origin could better modulate the yield performance, physiological parameters and phytochemical quality of jute in conditions of optimal or suboptimal supply of mineral nutrients.
Considering this background, the aim of this study was to assess the effects of three different nutrient solution concentrations (full-, half-, and quarter-strength), in the absence or presence of a tropical plant extract (PE), to analyze the interactive response of nutrient solution concentration × PE in Jute. We were able to evaluate the ability of this biostimulant to favor plant growth and RUE under optimal and sub-optimal nutrient regimens. Treated and untreated jute plants were compared in terms of morpho-physiological parameters, mineral profile, and the contents of carbohydrates, proteins, and amino acids, including essential amino acids, chlorophyll, anthocyanins, and polyphenols.

2. Materials and Methods

2.1. Plant Material, Glasshouse Conditions, and Experimental Design

The experiment was conducted in the 2017 summer-autumn growing season in a glasshouse situated at the experimental station of the Department of Agricultural Sciences, University of Naples Federico II, located in Bellizzi (Salerno), Southern Italy (43°31′ N, 14°58′ E; 60 m above sea level). The crop species tested for the present experiment was jute (Corchorus olitorius L.). Seeds of Jute (Nehme Establishment for Trade and Agriculture, Batroun, Lebanon) were germinated in vermiculite on August 14, 2017. Thirty days after sowing (September 12, at the two true-leaf stage) the jute seedling were transplanted into plastic pots containing 1.5 L of a peat:vermiculite mixture in a 2:1 volume ratio. Plastic pots were placed on three 1.8-m-wide and 7-m-long benches in single rows. Jute seedlings were spaced 20 cm between the plants with 30 cm between the rows, giving a plant density of 16.6 plants per square meter. Plants were grown under natural light conditions. Inside the glasshouse, the daily air temperature was maintained between 18 °C and 28 °C. Night air temperature was always higher than 16 °C and the relative humidity was 58% and 78% during the day and night, respectively.
Six treatments derived from a factorial combination of three nutrient concentrations (25%, 50%, or 100% of a full strength nutrient solution) and two biostimulant applications (control and or foliar application of a tropical plant extract Auxym®). The treatments were arranged in a randomized complete-block design with three replications per treatment, for a total of 18 experimental units. Each experimental unit consisted of 10 plants, yielding a total number of 180 jute plants.

2.2. Bistimulant Characteristics and Application and Nutrient Solution Management

The tropical plant extract (PE) biostimulant Auxym® was provided by Italpollina Company (Rivoli Veronese, Italy). The commercial PE biostimulant was produced through water extraction and fermentation of tropical plant biomass. The commercial biostimulant Auxym® contains mainly phytohormones (auxins and cytokinins), amino acids, peptides, vitamins (C and E, niacin, pyridoxine, riboflavin, and thiamin), and essential micronutrients (B, Cu, Fe, Mn, and Zn). The exact concentrations of the different compounds were reported in detail by Colla et al. [4]. The treated jute plants were uniformly sprayed (i.e., foliar application) nine days after transplanting (DAT) at weekly intervals (four times during the growing cycle) at an application rate of 2 mL·L−1 using a 4-L stainless steel sprayer.
The full-strength nutrient solution used in the current glasshouse experiment was a modified Hoagland Arnon formulation used previously by Rouphael et al. [27] with a composition of 14.4 mM N–NO3, 2.0 mM S, 1.2 mM P, 6.0 mM K, 4.5 mM Ca, 2.3 mM Mg, 20 µM Fe, 10 µM Mn, 2 µM Cu, 5 µM Zn, 20 µM B, and 0.5 µM Mo. The electrical conductivity (EC) and pH of the full-strength nutrient solution were 2.0 dS·m−1 and 6.0 ± 0.2, respectively. The quarter-strength and half-strength solutions had 25% and 50% of the macronutrients concentration, respectively, and the same micronutrient concentrations of the full-strength nutrient solution. The EC of the half- and quarter-strength nutrient solutions were 1.0 ± 0.1 and 0.5 ± 0.1 dS·m−1, respectively. The full-, half-, and quarter-strength nutrient solutions were pumped from 50-L plastic tanks through a drip irrigation system through auto-compensated drippers having a flow rate of 2 L·h−1. Irrigation scheduling in all treatments involved using low-tension tensiometers that monitor irrigation based on growing media matric potential as described in detail by Rouphael et al. [11]. The low-tension tensiometers were connected to an electronic programmer to manage the beginning and the end of the fertigation, which are associated with the high (−10 kPa) and low (−1 kPa) tension set points of the major substrates used in horticulture.

2.3. Biometric Measurements

On October 11, 2017 (31 DAT), six jute plants per replicate were harvested and the following biometric measurements were recorded: plant height, number of leaves per plant, and the total leaf area using an electronic area meter (Li-Cor3000, Li-Cor, Lincoln, NE, USA). The fresh leaf tissue was first weighed then dried at 70 °C for 72 h until they reached a constant weight. After complete drying, leaf samples were weighed again with an analytical balance for dry biomass determination and the dry samples were conserved for mineral analysis. The leaf dry matter percentage was also calculated.

2.4. Photosynthetic Activity and Soil Plant Analysis Development Index

One day before harvest (30 DAT), the net carbon dioxide assimilation rate (ACO2), was measured with a portable gas exchange analyzer (LCA-4; ADC BioScientific Ltd., Hoddesdon, UK) equipped with a broadleaf chamber (cuvette window area: 6.25 cm2). This measurement was recorded within 2 h across solar noon (i.e., between 11:00 a.m. and 1:00 p.m.) on eight healthy and fully expanded jute leaves per treatment. Photosynthetically active radiation, relative humidity, and carbon dioxide concentration (585 ± 10 μmol·m−2·s−1, 58 ± 1.5%, and 331 ± 0.5 ppm, respectively) were set at ambient value and the flow rate of air was 400 mL·s−1, as described by Carillo et al. [28].
On the same date, the Soil Plant Analysis Development (SPAD) index was measured on fully expanded jute leaves by means of a portable SPAD-502 chlorophyll meter (Konica Minolta, Hino-shi Tokyo, Japan) as described by Kumar et al. [29]. Fifteen leaves were randomly measured and averaged to a single SPAD value for each replicate (i.e., experimental unit).

2.5. Mineral Composition Analysis

The desiccated jute leaf tissue was ground in a Wiley Mill (Model 4, Thomas Scientific, San Mateo, CA, USA) to pass through an 841-µm screen and used for mineral content analysis as described in detail by Rouphael et al. [10]. Briefly, 0.25 g of desiccated tissue was suspended in 50 mL of ultrapure water (Milli-Q. Merck Millipore, Darmstadt, Germany) and subjected to three freeze-thaw cycles in liquid N, followed by incubation in a shaking 80 °C water bath (ShakeTemp SW22, Julabo, Seelbach, Germany) for 10 min. The suspension was centrifuged at 6,000 rpm for 10 min (R-10 M, Remi Elektrotechnik Limited, Mumbay, India), then filtered through 0.20-μm filter paper. Nitrate, P, K, S, Ca, Mg, S, and Na were separated and quantified by ion chromatography (ICS-3000, Dionex, Sunnyvale, CA, USA) coupled to a conductivity detector. An IonPac CG12A (4 × 250 mm, Dionex, Sunnyvale, CA, USA) guard column and IonPac CS12A (4 × 250 mm, Dionex, Sunnyvale, CA, USA) analytical column were used for the potassium, calcium, magnesium, and sodium analysis. For nitrate, phosphorus, and sulfur quantification, an IonPac AG11-HC guard (4 × 50 mm, Dionex, Sunnyvale, CA, USA) column and IonPac AS11-HC analytical column (4 × 250 mm, Dionex, Sunnyvale, CA, USA) were adopted.

2.6. Chlorophyll Analysis

Chlorophylls (µg·g−1 fresh weight; fw) were extracted by homogenization of frozen powdered jute leaf tissues (1.0 g) in methanol. The resulting extracts were centrifuged at 4800× g for 15 min and chlorophyll a and chlorophyll b contents were assessed by recording the absorbance of the supernatant at 665 and 652 nm in a polypropylene microplate by a microplate reader (Synergy HT, BioTEK Instruments, Bad Friedrichshall, Germany) based on the procedure used by Wellburn [30]. The total chlorophyll content was calculated as the sum of chlorophyll a and b.

2.7. Starch and Soluble Carbohydrates Analysis

Soluble sugars (µmol·g−1 fw) were quantified in ethanolic extracts of frozen powdered leaf tissues, and the starch in the pellet of the same ethanolic extract after glucose hydrolysis was quantified by an enzymatic assay coupled with reduction of pyridine nucleotides as described by Carillo et al. [31]. The increase in absorbance at 340 nm was recorded by a FLX-Xenius spectrophotometer (SAFAS, Monaco City, Monaco).

2.8. Polyphenols and Anthocyanins Analysis

The total polyphenols (mg·g−1 fw) content was determined by the Folin–Ciocalteu method described by Singleton et al. [31]. Frozen powdered jute leaf tissues (20 mg) were extracted in 800 μL of 60% methanol (v/v); 100 μL of extract was mixed with 50 μL of the Folin–Ciocalteu reagent diluted with distilled water (1:1 v/v) and 650 μL of 3% (w/v) sodium carbonate. After 90 min at room temperature, the absorbance at 760 nm was determined in a microplate reader FLX-Xenius spectrophotometer (SAFAS, Monaco City, Monaco). The polyphenols concentration is expressed as gallic acid equivalents (GAE) as described in Carillo et al. [28].
Anthocyanins (mg·g−1 fw) were determined in frozen powdered leaf tissues (40 mg) extracted twice in 200 µL of 40% (v/v) ethanol on ice for 20 min, according to Carillo et al. [28]. Two aliquots of 150 µL of clear mixed supernatants or 40% (v/v) ethanol (as blank) were added to 75 µL of 25 mM KCl (pH 1.0) or 75 µL of 400 mM sodium acetate (pH 4.5) and the absorbance was determined at 520 and 700 nm using a FLX-Xenius spectrophotometer (SAFAS, Monaco City, Monaco). The anthocyanins are expressed as mg cyanidin-3-glucoside (C3G) equivalents according to Giusti and Wrolstad [32].

2.9. Soluble Proteins and Free and Total Amino Acids Analysis

Primary amino acids and proline (µmol·g−1 fw) were extracted from 50 mg of frozen powdered leaf tissues in 1 mL of 60% (v/v) ethanol overnight at 4 °C, following Carillo et al. [33]. Amino acids were estimated by high performance liquid chromatography (HPLC) after pre-column derivatization with o-phthaldialdehyde (OPA), according to Woodrow et al. [34]. Proline was determined by mixing 50 μL of ethanol extract with 100 μL of a reaction mix prepared with ninhydrin 1% (w/v) in acetic acid 60% (v/v) and ethanol 20% (v/v) at 95 °C for 20 min and reading the absorbance at 520 nm using a Synergy HT microplate reader (Bio-Tek, Bad Friedrichshall, Germany), according to Woodrow et al. [34].

2.10. Statistics, Principal Component Analysis, and Heat Map

All data were subjected to two-way analysis of variance (ANOVA) using the software package SPSS 13 for Windows 2001 (www.ibm.com/software/analytics/spss). The means were separated by Tukey’s honest significant difference (HSD) test (significance level 0.05). Biostimulant application main effects were compared using the 
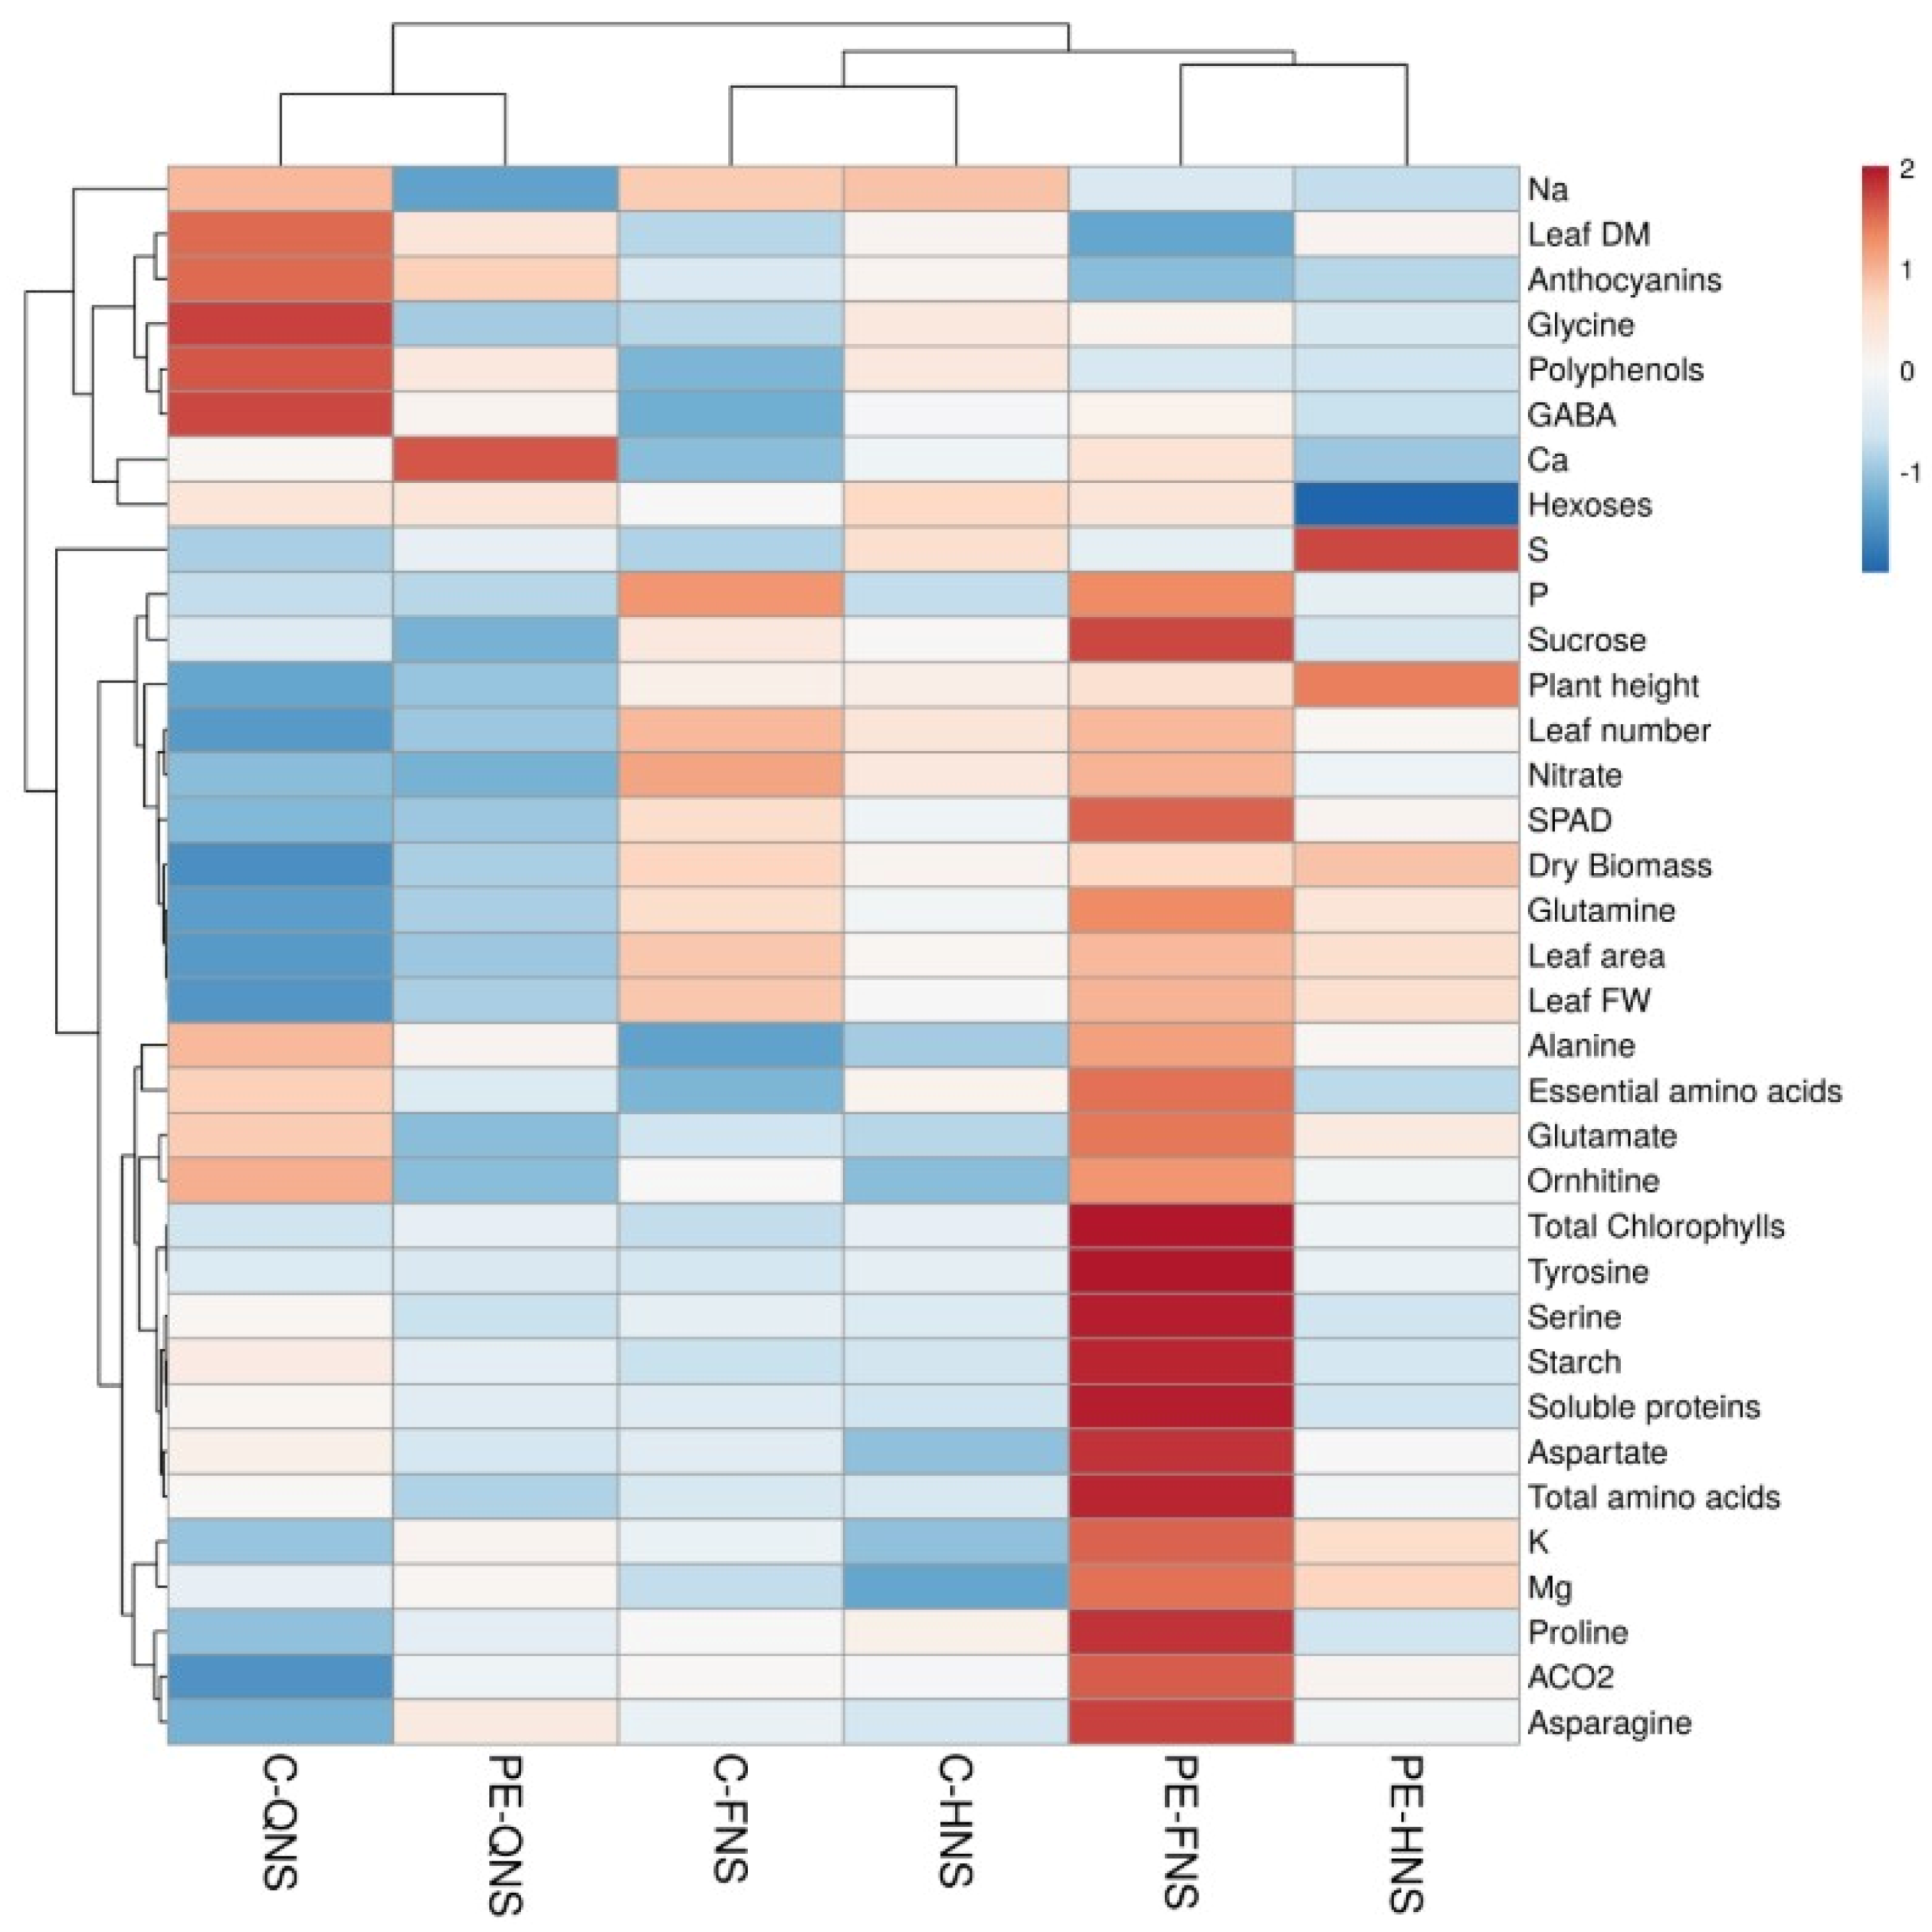
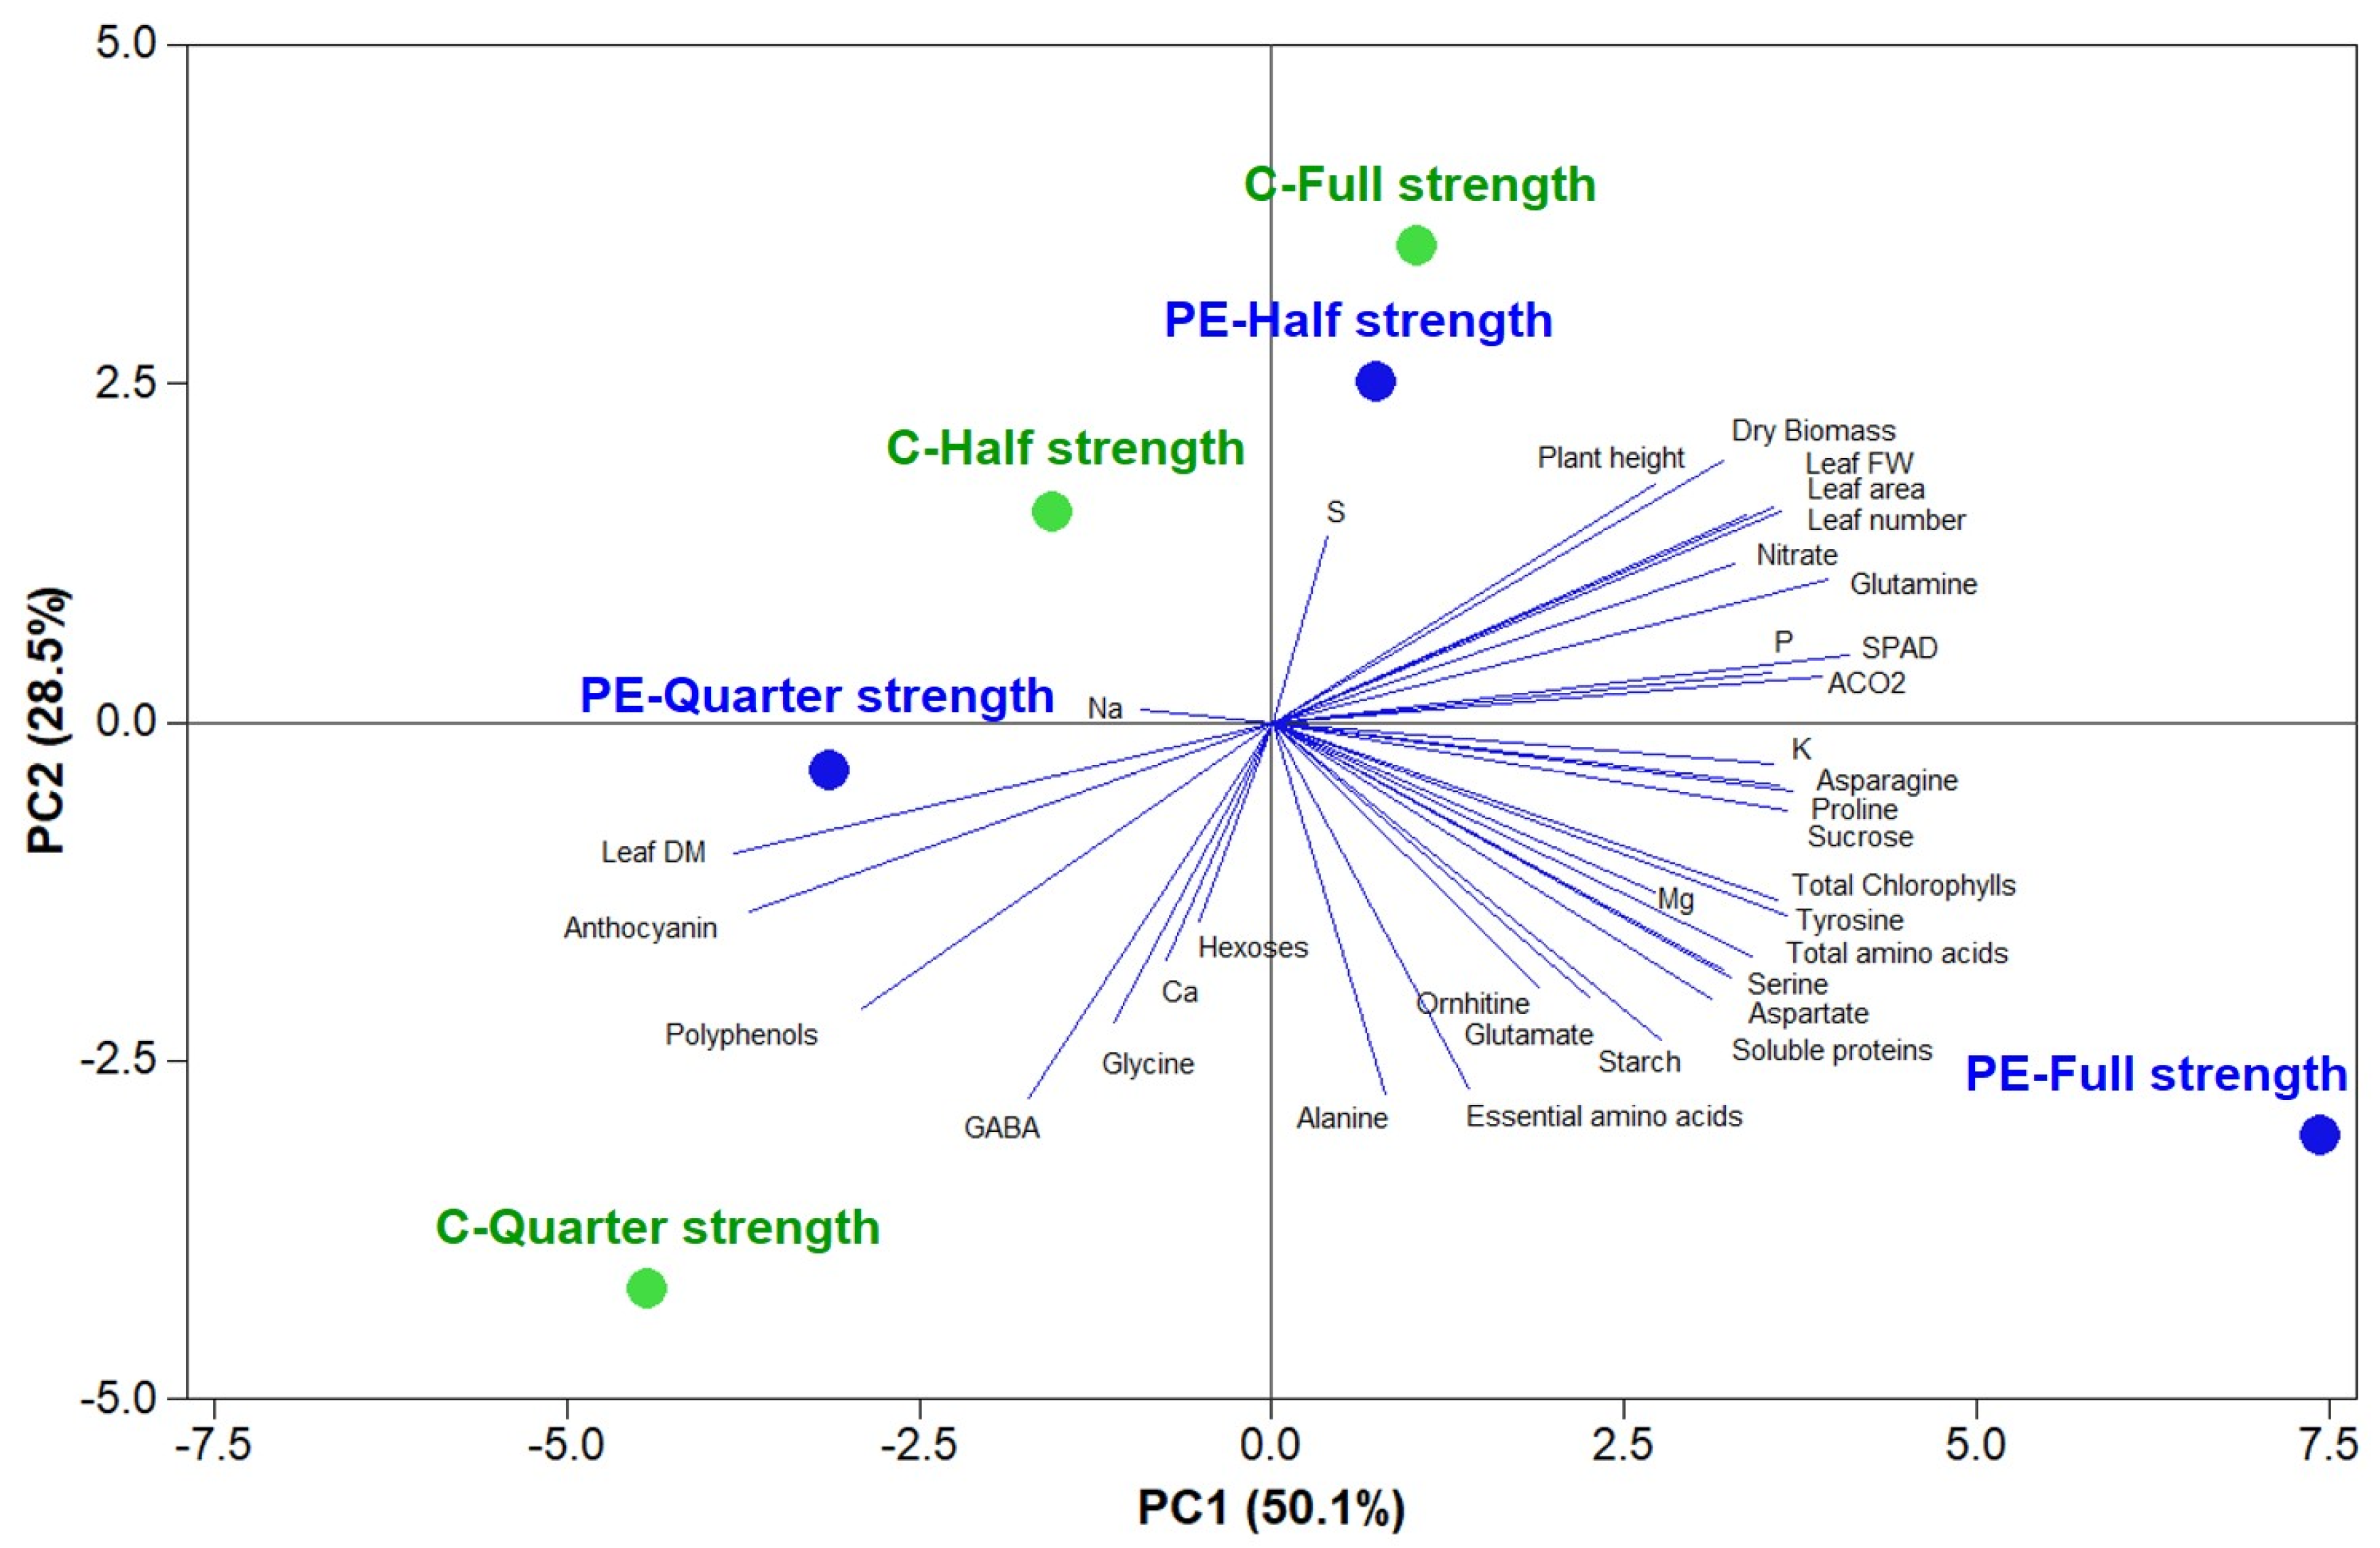
t-test. Principal component analysis (PCA) was performed on morpho-physiological and phytochemical parameters as well as on the mineral composition to individuate the dominant parameters that most effectively discriminated between nutrient solution concentrations and biostimulant application by using Minitab® 18 statistical software (Minitab LLC, State College, PA, USA). The score plot and loading matrix were also determined based on the first and second principal components (PCs). A heat map generated in Excel (Microsoft Inc., Redmond, Washington) was used to summarize the plant responses to different nutrient strengths and PE. Results were calculated as log2 (half-strength and quarter-strength solutions/full-strength solution, or PE/control for plants grown at different strength solutions) and are visualized using a false color scale, with red indicating an increase and blue a decrease of values. No differences are denoted by white squares. A different heatmap summarizing all the plant responses to PE and different nutrient strength treatments was generated using the https://biit.cs.ut.ee/clustvis/ online program package with Euclidean distance as the similarity measure and hierarchical clustering with complete linkage. Data were visualized using a false color scale, with red indicating an increase and blue a decrease of values [16].

3. Results

3.1. Morphological Parameters and Fresh Yield

The results regarding morphological parameters and marketable fresh yield of jute in relation to nutrient solution concentration and biostimulant application are presented in Table 1. For most of the measured parameters, no significant interaction between macronutrient solution concentration (C) and plant biostimulant application (B) was recorded, except for the marketable fresh yield (Table 1). Our morphological data indicate that the effect of nutrient solution concentration was much more pronounced than that of tropical plant extract (PE) application.
The quarter-strength NS resulted in significantly reduced plant height, leaf number, as well as the shoot dry biomass compared to both full- and half-strength NS, whereas an opposite trend was observed for the leaf dry matter percentage (Table 1). In addition, jute plants irrigated with full-strength NS elicited a significant increase in total leaf area compared to quarter-strength NS, whereas half-strength treatment exhibited intermediate values (Table 1). A significant interaction C × B was observed for marketable fresh yield; PE application triggered specific ameliorative effects in terms of fresh yield at both half- and quarter-strength nutrient solution (15.5% and 29.5%, respectively; Table 1, Figure 1).

3.2. Mineral Composition of Leaves

Neither macronutrient solution concentration nor biostimulant application had a significant influence on Ca and S concentrations in leaves (average 5.9 and 0.7 g·kg−1 dw). The P concentration in leaf tissue was negatively affected by reducing the nutrient solution composition with no significant effect for the quarter- and half-strength solutions (Table 2). For nitrate concentration, a significant interaction between the two tested factors was observed, where the application of PE-based biostimulant on jute plants irrigated with quarter- and half-strength NS decreased the nitrate accumulation in leaf tissue by 25.3% and 27.9%, respectively, compared to untreated jute plants (Table 2). When averaged over nutrient solution concentration, a significant effect of the commercial tropical PE Auxym® was recorded for K, Mg, and Na accumulation in leaf tissue, whose concentrations were higher by 12.2% and 20.7%, and lower by 46.1%, respectively, compared to the untreated control. Particularly, the increases were found at full- and half-strength NS (Table 2; Figure 1).

3.3. Physiological Parameters

A significant interaction between the tested factors was observed in the case of chlorophyll a, chlorophyll b, and total chlorophyll contents, whereas net CO2 assimilation rate (ACO2) was highly influenced by nutrient solution concentration and biostimulant application with no significant C × B interaction (Table 3). The SPAD index was only affected by the nutrient solution concentration (Table 3). The highest chlorophyll a and total chlorophyll contents (two-fold) were recorded in PE-treated plants irrigated with full-strength nutrient solution (Table 3). Irrespective of biostimulant treatment, decreasing the basic macronutrient composition from 100% to 25% was accompanied by a linear decrease in important physiological parameters such as the SPAD index (Table 3). Foliar application of PE induced higher values of ACO2 (+10.5%) in comparison with untreated jute plants (Table 3).
Neither nutrient solution concentration nor biostimulant application had a significant effect on soluble carbohydrates: glucose (average 8.8 µmol·g−1 fw) fructose (average 13.7 µmol·g−1 fw) and sucrose (avg. 8.6 µmol·g−1 fw) as well as on polyphenols concentrations (avg. 188.2 mg GAE 100 g−1 fw) (Table 4). The foliar application of PE positively affected starch content only when jute plants were irrigated with full-strength NS, increasing its amount by 222% compared to the respective control treatment (Table 4). When averaged over biostimulant treatment, decreasing the NS concentration from 100% to 25% sharply increased the anthocyanins content, with no significant differences between the full- and half-strength NS (Table 4).
Similarly, for the effects of starch, the soluble proteins in PE-treated plants irrigated with the full-strength NS was significantly higher than those recorded in the rest of the treatments (Table 5). The amino acids profile, and total amino acids as a function of nutrient solution concentration and PE-based biostimulant application treatments are reported in Table 5. Irrespective of the treatments, glutamine, γ-aminobutyric acid (GABA), glutamate, and aspartate were quantitatively the major amino acids, representing about 28.7%, 20.8%, 14.6%, and 8.0% of total free amino acids in plants irrigated with full-strength NS, respectively. Essential amino acids accounted for 8.4% of total amino acids in the same treatment. Decreasing the macronutrient concentration in the nutrient solution affected the content of glutamine and proline in quarter-strength NS plants, which decreased significantly by 66%, and 33% compared to those recorded with the full-strength NS, respectively. Other amino acids like glycine, alanine, and glutamate increased, though this latter not significantly. The foliar application of the commercial PE Auxym® strongly increased total amino acid content (+63%) but only with full-strength NS (Table 5). In this latter condition, the foliar application of PE biostimulant significantly increased alanine (+78%), asparagine and aspartate (+80%), glutamate (+64%), proline (+59%), serine (+70%), and essential amino acids (+63%), whereas under half-strength conditions, PE produced an increase only in aspartate (+51%) and glutamate (+37%), but not significantly. Finally, using quarter-strength NS, there was a significant decrease in glycine (−54%), glutamate (−40%), and essential amino acids (−20%), but a strong increase in asparagine (+104%) and glutamine (+49%) (Table 5).

3.4. Heat Map Analysis

The aggregated data heat-map analysis (Figure 1) identified two main clusters corresponding to the quarter-strength NS (QNS) on the left and the other two nutrient solution concentrations (full- and half-strength) on the right. This indicates that the strength/concentration of the nutrient solution was the main clustering factor responsible for different effects in dependence on its own concentration (i.e., QNS vs. HNS and FNS%). Two separated sub-clusters could be defined under the second cluster, which illustrated the NS × PE interaction. The PE Auxym® biostimulant at full- and half-strength NS (PE-FNS and PE-HNS, respectively) treatment sub-clusters separated from the control treatment at full- and half- strength NS (C-FNS and C-HNS, respectively) treatments because of their higher plant height, leaf area, and fresh weight, and glutamine and glutamate content. In particular, PE-FNS showed the highest free amino acids, soluble proteins, and total chlorophylls concentration, as well as starch and sucrose. The control treatment at quarter-strength NS (C-QNS) was distanced from all other treatments mainly because of its higher GABA, polyphenols, glycine, anthocyanins, and leaf dry matter. The PE Auxym® treatment at quarter-strength NS (PE-QNS) was characterized by lower total amino acids, carbohydrate, and nitrate contents, but higher asparagine and glutamine concentration compared to C-QNS, with better crop performance (higher fresh and dry biomass) and nutritional status (higher K and Mg and lower Na content), and was able to maintain higher photosynthetic activity (Figure 1).
A different heat map analysis evaluating the changes in the analyzed parameters in terms of dependence on the nutrient solution (Figure 2A) and PE Auxym® application (Figure 2B) was performed. The decrease in macronutrient solution concentration, in particular at quarter-strength, affected leaf number, leaf area, fresh yield, dry biomass, ACO2, nitrate, phosphorus, amides, and proline, while it increased starch and anthocyanins. However, PE application improved leaf area and leaf fresh weight compared to the respective controls at HNS and QNS. Only at QNS, PE increased shoot leaf dry biomass and leaf number. PE foliar application strongly increased total chlorophyll content and soluble proteins at full-strength, but only slightly for ACO2. It also slightly increased mineral content except for nitrate and sodium, which decreased particularly at quarter-strength. PE application strongly increased starch content at FNS, but had no effects on soluble sugars, polyphenols, and anthocyanins. PE Auxym® increased total amino acid content at full-strength, whereas at half-strength, PE Auxym® produced a significant increase only in aspartate and glutamate; finally, at QNS, PE decreased glycine, glutamate, ornithine. and essential amino acids, but increased asparagine and glutamine.

3.5. Principal Component Analysis

To obtain a broad overview of the morphological, physiological, and biochemical parameters characterizing jute plants under different NS × PE treatments, principal component analysis (PCA) was conducted. The first three principal components (PCs) were related with eigen values higher than 1 and explained 89.0% of the total variance, with PC1, PC2, and PC3 accounting for 50.1%, 28.5%, and 10.4%, respectively (Table 6). The increase in NS in PE-treated plants contributed to the clear separation of PC1, whereas the increase in NS in control conditions contributed to the separation of PC2. PC1 was positively correlated to morphological traits (leaf fresh weight, number, and area; and dry biomass), SPAD index, and total chlorophyll content and total amino acids, in particular asparagine, tyrosine, proline, and asparagine, ACO2, sucrose, nitrate, K, Mg and P content (Table 6). PC1 was also negatively correlated with leaf dry matter percentage, anthocyanins, and polyphenols. PC2 was positively correlated with GABA, alanine, glycine, glutamate, ornithine, essential amino acids, and starch content; and negatively correlated with dry biomass. PC3 was strongly and positively correlated with hexoses and Na and negatively associated with Ca content (Table 6). The effectiveness of PCA on multiple morpho-physiological, biochemical, and nutritional parameters in response to biostimulant application has been reported previously in a series of scientific papers [1,10,16]. This was the case in the current glasshouse experiment, since the score plot highlighted crucial information on the biostimulant-treated and untreated jute plants exposed to different macronutrient concentrations in the nutrient solution. PE with full- and half-strength NS, as well as untreated plants with full-strength NS, were positioned on the positive side of PC1, whereas the rest of the treatments were positioned on the negative side of PC1 (Figure 3). Particularly, the jute plants treated with PE under full-strength NS were positioned on the lower right quadrant of the PCA score plot, producing leaves og premium quality with high concentrations of total amino acids, total chlorophylls, soluble proteins, starch, sucrose, and Mg. On the positive side of PC1, in particular the upper right quadrant, untreated plants with full-strength NS and PE-treated plants with half-strength NS were clustered together and characterized overall by higher shoot dry biomass, plant height, and S content. The treated and untreated jute plants irrigated with quarter-strength NS were positioned on the negative side of PC1 clustered with high leaf dry matter percentage, anthocyanins, and polyphenols. Finally, the left upper quadrant depicted treatment (untreated plants with half-strength NS) characterized by the lowest performance and nutritional quality (Figure 3). The PCA conducted in the current greenhouse experiment may provide a more in-depth approach to elucidate the PE × macronutrient concentration in the nutrient solution on morpho-physiological and functional quality traits of jute and help to optimize their crop growth and quality.

4. Discussion

The horticulture industry uses the highest amount of fertilizer per unit area of any other agricultural system [4,27]. However, to sustainably increase agricultural productivity, it is necessary to improve the plant RUE and reduce the use and environmental impact of chemical fertilizers [6]. For improving sustainable cultivation and safe use in the future, it is necessary to find a compromise between the minimum quantity of fertilizer and the stability of yield quantity and quality. The use of natural plant biostimulants can facilitate this process since they are able to improve uptake, assimilation, and use of macro- and micronutrients, and increase plant yield to improve plant productivity even under reduced nutrient fertilization [9,13,17].
Significant changes in morphological and physiological traits were observed; in particular, the half- and quarter-strength NS sharply reduced leaf area per plant thus decreasing the jute fresh yield and total dry biomass [26]. The lower macronutrient concentration in the NS negatively affected nitrate and phosphorus content. Due to reduced nitrogen availability, at quarter-strength NS, the CO2 assimilation rate decreased. Lower leaf nitrogen availability can affect photosynthesis through nitrogen remobilization from photosynthetic enzymes and pigments, decreasing photosynthetic rate and ATP synthesis [35].
Alanine and GABA strongly increased under the lowest macronutrient concentration in the NS, even if the increase in GABA was not statistically significantly. In addition to their use for protein synthesis, amino acids are precursors of several biosynthetic pathways and play crucial roles in plant stress responses [36]. From this viewpoint, the strong increase in alanine and GABA under quarter-strength NS could be an important mechanism of biochemical pH-stat for the viability of jute plant under nitrogen limitation. A decrease in ATP can impair the control of plant cell cytoplasmic pH because of the reduced activity of the plasma membrane H+-ATPase that exerts the ATP-dependent electrogenic extrusion of H+ ions [37]. Alanine and GABA syntheses, arising from the decarboxylation of malate to pyruvate as a result of malic enzyme activity for alanine and decarboxylation of glutamate to GABA, are proton-consuming reactions buffering cytosolic acidosis [38,39]. Alanine can be easily transaminated to pyruvate and transported into the mitochondrial matrix to be converted to acetyl-Coenzyme A (acetyl-CoA), whereas the GABA shunt can supply NADH and/or succinate to the tricarboxylic acid (TCA) cycle to increase the production of ATP [40]. High concentrations of GABA and calcium may interact to function as signal of the N status of plants [41].
Essential amino acids significantly increased under both lower macronutrient concentration in the NS, potentially functioning as antioxidants to protect plants by photo-oxidation due to the lower efficiency of photosynthetic system and the pH impairment. The increase in essential amino acids could also be dependent on an increase of carbohydrates, e.g., starch, in particular at quarter-strength NS. Both the low nitrate content and the decrease in ATP concentration due to the slowing down of the photosynthetic process could be responsible for the accumulation of starch that cannot be used as source of carbon skeletons for the production of primary amino acids glutamine and glutamate [34,42]. At half- and quarter-NS, conditions increasing leaf cell susceptibility to light-induced oxidative damage, we found an increase in chlorophyll b, anthocyanins, and polyphenols. Chlorophyll b, as a constituent of the light-harvesting complexes II (LHCII), is pivotal in the dissipation of excess excitation energy [43], whereas anthocyanins and polyphenols can function as both sunscreens and scavengers of reactive oxygen species (ROS) for protecting young expanding leaves and senescing tissues more susceptible to light damage [44].
In the current study, weekly foliar application of the commercial tropical plant extract improved fresh yield in jute plants under sub-optimal nutrient regimens (half- and quarter-strength) compared to control treatment. Higher photosynthetic activity, SPAD index, and enhanced leaf nutritional status, reflected by higher K and Mg and lower Na concentrations, were observed in PE-treated jute plants, indicating a more efficient accumulation and translocation of assimilates to photosynthetic sinks irrespective of macronutrient concentration in the nutrient solution, thus allowing improved crop performance. Our results are in line with the previous findings on the effect of commercial vegetal-derived biostimulant produced through water extraction and fermentation of tropical plant biomass (Auxym®) on tomato [1], spinach [16], and lettuce [45]. A presumed direct mechanism behind the stimulation of jute fresh yield production in response to foliar application of PE under both half- and quarter-strength NS could involve the increased presence of signaling molecules, such as amino acids (glutamic and aspartic acids involved in the stimulation of C and N metabolism), peptides (root-promoting hair peptides), and phytohormones (auxins and cytokinins), which are typical compounds in the commercial PE Auxym®. The former signaling molecules, which are easily perceived by leaf tissue, may elicit endogenous phytohormone biosynthesis, promoting plant growth and thus crop productivity [9]. In addition to the direct mechanism of the commercial PE biostimulant, indirect modes of action on crop productivity have been demonstrated when PE was applied to plants [1]. Foliar application of PE has been shown to improve the uptake, translocation, and accumulation of macronutrients in tomato [1] and spinach [16]. The improved nutrient uptake performance of PE-treated plants has been attributed to several mechanisms including (1) modification of root system architecture (higher root biomass, root surface, and length and number of lateral roots) and (2) to the presence of bioactive molecules (amino acids, peptides, and vitamins), which may have boosted sink strength and affected the movement of nutrient substrates (i.e., including minerals) within the plant [1,8,9,16].
At full-strength NS, PE increased not only the number of active photosystems, as proven by the increase in chlorophyll a, but also that of light harvesting complex (LHC), as shown by the strong increase in chlorophyll b. Photosystems, in particular photosystem II (PSII), operates during day under light notwithstanding the continuous environmental changes, in particular the spectral quality and intensity of light. In higher plants, PSII is highly efficient at low irradiance, whereas under high light, by means of a LHCII, non-photochemical quenching (NPQ) dissipates the excess of light as heat [46]. The increase in chlorophyll b can increase the quantum yield of O2 evolution and photosynthetic capacity, decreasing the sensitivity to photo-inhibition [47]. Therefore, PE was able to mediate, at full-strength NS, an increase in jute plant adaptation to fluctuating light conditions by strongly increasing chlorophyll b content, and allowing the plants to fine-tune photosynthesis in a fluctuating environment, increasing its efficiency, as also demonstrated by the strong increase in starch. This determined a higher efficiency in using nitrate that appeared decreased compared to the control because it was more efficiently reduced and assimilated. Accordingly, the soluble protein and total amino acid contents increased. In particular, there was a strong increase in the primary amino acids glutamate, aspartate, asparagine, and alanine, which are the primary products of nitrogen assimilation involved in transport and storage of organic nitrogen [36].
At quarter-strength NS and PE treatment, nitrogen was remobilized from free amino acids, in particular glutamate, but not from chlorophylls. While chlorophyll a content did not differ from that at full-strength without PE, chlorophyll b was significantly higher than at full-strength without PE. This allowed the efficient functioning of the photosynthetic process that could satisfy the demand of ATP for nitrogen assimilation in amino acids and use of starch, which decreased. The only amino acids that accumulated were the amides glutamine and asparagine under quarter-strength NS. Amides are not only used as nitrogen storage and transport compounds [48], but are also involved in osmotic adjustment and macromolecules protection [34].

5. Conclusions

Breeding methods and new biotechnological advances have been placed alongside studies on the potential role of plant biostimulants, which have been proven to increase uptake, assimilation, and use of macro- and micronutrients, and therefore RUE. Our results demonstrate that both in tropical PE-treated and untreated jute plants, growth parameters and marketable fresh yield decreased in response to a reduction in macronutrient concentration in the nutrient solution. Reduced productivity was accompanied by a reduction in macronutrient concentrations (nitrate and phosphorus) in leaf tissue as well as by a significant reduction in net CO2 assimilation, SPAD index, chlorophyll a, and starch, especially under severe nutrient stress conditions (i.e., quarter-strength). The foliar application of PE boosted the marketable yield under half- and quarter-strength NS compared to the control. Our data showed that the use of a tropical plant extract biostimulant enhanced photosynthetic activity and the SPAD index, and improved leaf nutritional status, reflected in higher potassium and magnesium and lower sodium concentrations, irrespective of the macronutrient concentration in the nutrient solution. Finally, the use of vegetal-derived biostimulant Auxym® reprogrammed the use of nitrate, not only improving the nitrogen use efficiency of jute plants, but also completely changing the distribution patterns of organic nitrogen and carbon in leaf tissues both at high- and low-strength nutrition, improving metabolism and supporting leaf growth and expansion even under sub-optimal nutrient conditions.

Author Contributions

Conceptualization, Y.R., G.C., and P.B.; methodology, Y.R. and P.C.; software. P.C.; validation, A.P., M.G., E.D. and L.D.; formal analysis. A.P., M.G., E.D. and L.D.; investigation. C.E.-N, M.I.S.; resources, G.C. and P.B.; data curation. P.C., M.G., A.P., and Y.R.; writing—original draft preparation. P.C. and Y.R.; writing—review and editing, P.C., G.C., S.D.P., M.C.K., and Y.R.; visualization. Y.R. and S.D.P.; supervision. Y.R.; project administration. Y.R., P.C., and G.C.

Funding

This research was funded by Regione Campania Lotta alle Patologie Oncologiche progetto iCURE (CUP B21C17000030007 – SURF 17061BP000000008).

Acknowledgments

The authors are grateful to Chiara Palazzo for her technical support in the laboratory.

Conflicts of Interest

The authors declare no conflict of interest.

References

  1. Colla, G.; Cardarelli, M.; Bonini, P.; Rouphael, Y. Foliar Applications of Protein Hydrolysate, Plant and Seaweed Extracts Increase Yield but Differentially Modulate Fruit Quality of Greenhouse Tomato. HortScience 2017, 52, 1214–1220. [Google Scholar] [CrossRef]
  2. De Wit, C.T. Resource use efficiency in agriculture. Agric. Syst. 1992, 40, 125–151. [Google Scholar] [CrossRef]
  3. Rouphael, Y.; Spíchal, L.; Panzarová, K.; Casa, R.; Colla, G. High-Throughput Plant Phenotyping for Developing Novel Biostimulants: From Lab to Field or From Field to Lab? Front. Plant Sci. 2018, 9. [Google Scholar] [CrossRef]
  4. Rouphael, Y.; Colla, G. The Influence of Drip Irrigation or Subirrigation on Zucchini Squash Grown in Closed-loop Substrate Culture with High and Low Nutrient Solution Concentrations. HortScience 2009, 44, 306–311. [Google Scholar] [CrossRef]
  5. Annunziata, M.G.; Carillo, P.; Fuggi, A.; Troccoli, A.; Woodrow, P. Metabolic profiling of cauliflower under traditional and reduced tillage systems. Aust. J. Crop Sci. 2013, 7, 1317–1323. [Google Scholar]
  6. Di Stasio, E.; Rouphael, Y.; Colla, G.; Raimondi, G.; Giordano, M.; Pannico, A.; El Nachel, C.; De Pascale, S. The influence of Ecklonia maxima seaweed extract on growth, photosynthetic activity and mineral composition of Brassica rapa L. subsp. sylvestris under nutrient stress conditions. Eur. J. Hortic. Sci. 2017, 82, 286–293. [Google Scholar] [CrossRef]
  7. Rouphael, Y.; Colla, G. Synergistic Biostimulatory Action: Designing the Next Generation of Plant Biostimulants for Sustainable Agriculture. Front. Plant Sci. 2018, 9. [Google Scholar] [CrossRef] [PubMed]
  8. Calvo, P.; Nelson, L.; Kloepper, J.W. Agricultural uses of plant biostimulants. Plant Soil 2014, 383, 3–41. [Google Scholar] [CrossRef] [Green Version]
  9. Colla, G.; Hoagland, L.; Ruzzi, M.; Cardarelli, M.; Bonini, P.; Canaguier, R.; Rouphael, Y. Biostimulant Action of Protein Hydrolysates: Unraveling Their Effects on Plant Physiology and Microbiome. Front. Plant Sci. 2017, 8. [Google Scholar] [CrossRef] [PubMed] [Green Version]
  10. Rouphael, Y.; Colla, G.; Giordano, M.; El-Nakhel, C.; Kyriacou, M.C.; De Pascale, S. Foliar applications of a legume-derived protein hydrolysate elicit dose-dependent increases of growth, leaf mineral composition, yield and fruit quality in two greenhouse tomato cultivars. Sci. Hortic. 2017, 226, 353–360. [Google Scholar] [CrossRef]
  11. Rouphael, Y.; De Micco, V.; Arena, C.; Raimondi, G.; Colla, G.; De Pascale, S. Effect of Ecklonia maxima seaweed extract on yield, mineral composition, gas exchange and leaf anatomy of zucchini squash grown under saline conditions. J. Appl. Phycol. 2017, 29, 459–470. [Google Scholar] [CrossRef]
  12. Battacharyya, D.; Babgohari, M.Z.; Rathor, P.; Prithiviraj, B. Seaweed extracts as biostimulants in horticulture. Sci. Hortic. 2015, 196, 39–48. [Google Scholar] [CrossRef]
  13. Colla, G.; Nardi, S.; Cardarelli, M.; Ertani, A.; Lucini, L.; Canaguier, R.; Rouphael, Y. Protein hydrolysates as biostimulants in horticulture. Sci. Hortic. 2015, 196, 28–38. [Google Scholar] [CrossRef]
  14. Halpern, M.; Bar-Tal, A.; Ofek, M.; Minz, D.; Muller, T.; Yermiyahu, U. Chapter Two–The Use of Biostimulants for Enhancing Nutrient Uptake. In Advances in Agronomy; Sparks, D., Ed.; Academy Press: Fletcher, NC, USA, 2015; pp. 141–174. [Google Scholar]
  15. De Pascale, S.; Rouphael, Y.; Colla, G. Plant biostimulants: innovative tool for enhancing plant nutrition in organic farming. Eur. J. Hortic. Sci. 2017, 82, 277–285. [Google Scholar] [CrossRef]
  16. Rouphael, Y.; Giordano, M.; Cardarelli, M.; Cozzolino, E.; Mori, M.; Kyriacou, M.C.; Bonini, P.; Colla, G. Plant- and Seaweed-Based Extracts Increase Yield but Differentially Modulate Nutritional Quality of Greenhouse Spinach through Biostimulant Action. Agronomy 2018, 8, 126. [Google Scholar] [CrossRef]
  17. Du Jardin, P. Plant biostimulants: Definition, concept, main categories and regulation. Sci. Hortic. 2015, 196, 3–14. [Google Scholar] [CrossRef] [Green Version]
  18. Ertani, A.; Pizzeghello, D.; Francioso, O.; Sambo, P.; Sanchez-Cortes, S.; Nardi, S. Capsicum chinensis L. growth and nutraceutical properties are enhanced by biostimulants in a long-term period: chemical and metabolomic approaches. Front. Plant Sci. 2014, 5, 375. [Google Scholar] [CrossRef]
  19. Giro, A.; Ferrante, A. Yield and quality of Corchorus olitorius baby leaf grown in a floating system. J. Hortic. Sci. Biotechnol. 2016, 91, 603–610. [Google Scholar] [CrossRef]
  20. Dhar, P.; Ojha, D.; Kar, C.S.; Mitra, J. Differential response of tossa jute (Corchorus olitorius) submitted to water deficit stress. Ind. Crops Prod. 2018, 112, 141–150. [Google Scholar] [CrossRef]
  21. The Daily Records Top 10 Largest Jute Producing Countries in the World. 2019. Available online: http://www.thedailyrecords.com/2018-2019-2020-2021/world-famous-top-10-list/world/largest-jute-producing-countries-world-states/6861/ (accessed on 9 May 2019).
  22. Zeghichi, S.; Kallithraka, S.; Simopoulos, A. Nutritional Composition of Molokhia (Corchorus olitorius) and Stamnagathi (Cichorium spinosum). World Rev. Nutr. Diet. 2003, 91, 1–21. [Google Scholar] [CrossRef] [PubMed]
  23. Giro, A.; Ferrante, A. Postharvest physiology of Corchorus olitorius baby leaf growing with different nutrient solutions. J. Hortic. Sci. Biotechnol. 2018, 93, 400–408. [Google Scholar] [CrossRef]
  24. Islam, M. Biochemistry, medicinal and food values of Jute (Corchorus capsularis L. and C. olitorius L.) leaf: a review. Int. J. Enhanced Res. Sci. Technol. Eng. 2013, 2, 35–44. [Google Scholar]
  25. Nishiumi, S.; Yabushita, Y.; Fukuda, I.; Mukai, R.; Yoshida, K.I.; Ashida, H. Molokhia (Corchorus olitorius L.) extract suppresses transformation of the aryl hydrocarbon receptor induced by dioxins. Food Chem. Toxicol. 2006, 44, 250–260. [Google Scholar] [CrossRef] [PubMed]
  26. Giro, A.; Ferrante, A. Eco-physiological responses and biochemical characterization of different accessions of Corchorus olitorius (L.). Folia Hortic. 2018, 30, 333. [Google Scholar] [CrossRef]
  27. Rouphael, Y.; Cardarelli, M.; Rea, E.; Colla, G. The influence of irrigation system and nutrient solution concentration on potted geranium production under various conditions of radiation and temperature. Sci. Hortic. 2008, 118, 328–337. [Google Scholar] [CrossRef]
  28. Carillo, P.; Cirillo, C.; De Micco, V.; Arena, C.; De Pascale, S.; Rouphael, Y. Morpho-anatomical, physiological and biochemical adaptive responses to saline water of Bougainvillea spectabilis Willd. trained to different canopy shapes. Agric. Water Manag. 2019, 212, 12–22. [Google Scholar] [CrossRef]
  29. Kumar, P.; Lucini, L.; Rouphael, Y.; Cardarelli, C.; Kalunke, R.M.; Colla, G. Insight into the role of grafting and arbuscular mycorrhiza on cadmium stress tolerance in tomato. Front. Plant Sci. 2015, 6, 477. [Google Scholar] [CrossRef]
  30. Wellburn, A.R. The Spectral Determination of chlorophylls a and b, as well as total carotenoids, using various solvents with spectrophotometers of different resolution. J. Plant Physiol. 1994, 144, 307–313. [Google Scholar] [CrossRef]
  31. Singleton, V.L.; Orthofer, R.; Lamuela-Raventos, R.M. Analysis of total phenols and other oxidation substrates and antioxidants by means of Folin-Ciocalteu reagent. Oxid. Antioxid. Part A 1999, 299, 152–178. [Google Scholar] [CrossRef]
  32. Giusti, M.M.; Wrolstad, R.E. Characterization and Measurement of Anthocyanins by UV-Visible Spectroscopy; Current Protocols in Food Analytical Chemistry; Giusti, M.M., Wrolstad, R.E., Eds.; John Wiley and Sons, Inc.: Hoboken, NJ, USA, 2001. [Google Scholar]
  33. Carillo, P.; Cacace, D.; De Pascale, S.; Rapacciuolo, M.; Fuggi, A. Organic vs. traditional potato powder. Food Chem. 2012, 133, 1264–1273. [Google Scholar] [CrossRef]
  34. Woodrow, P.; Ciarmiello, L.F.; Annunziata, M.G.; Pacifico, S.; Iannuzzi, F.; Mirto, A.; D’Amelia, L.; Dell’Aversana, E.; Piccolella, S.; Fuggi, A.; et al. Durum wheat seedling responses to simultaneous high light and salinity involve a fine reconfiguration of amino acids and carbohydrate metabolism. Physiol. Plant. 2017, 159, 290–312. [Google Scholar] [CrossRef]
  35. Bassi, D.; Menossi, M.; Mattiello, L. Nitrogen supply influences photosynthesis establishment along the sugarcane leaf. Sci. Rep. 2018, 8, 2327. [Google Scholar] [CrossRef] [Green Version]
  36. Hildebrandt, T.M.; Nesi, A.N.; Araújo, W.L.; Braun, H.P. Amino Acid Catabolism in Plants. Mol. Plant 2015, 8, 1563–1579. [Google Scholar] [CrossRef] [PubMed]
  37. Gout, E.; Bligny, R.; Douce, R. Regulation of intracellular pH values in higher plant cells. Carbon-13 and phosphorus-31 nuclear magnetic resonance studies. J. Biol. Chem. 1992, 267, 13903–13909. [Google Scholar] [PubMed]
  38. Limami, A.M.; Glévarec, G.; Ricoult, C.; Cliquet, J.B.; Planchet, E. Concerted modulation of alanine and glutamate metabolism in young Medicago truncatula seedlings under hypoxic stress. J. Exp. Bot. 2008, 59, 2325–2335. [Google Scholar] [CrossRef] [PubMed] [Green Version]
  39. Carillo, P. GABA Shunt in Durum Wheat. Front. Plant Sci. 2018, 9. [Google Scholar] [CrossRef] [Green Version]
  40. Bouché, N.; Fromm, H. GABA in plants: just a metabolite? Trends Plant Sci. 2004, 9, 110–115. [Google Scholar] [CrossRef]
  41. Roberts, M.R. Does GABA Act as a Signal in Plants?: Hints from Molecular Studies. Plant Signal. Behav. 2007, 2, 408–409. [Google Scholar] [CrossRef]
  42. Noctor, G.; Novitskaya, L.; Lea, P.; Foyer, C. Co-ordination of leaf minor amino acid contents in crop species: Significance and interpretation. J. Exp. Bot. 2002, 53, 939–945. [Google Scholar] [CrossRef]
  43. Horton, P. Optimization of light harvesting and photoprotection: molecular mechanisms and physiological consequences. Philosophical transactions of the Royal Society of London. Ser. B Biol. Sci. 2012, 367, 3455–3465. [Google Scholar] [CrossRef] [PubMed]
  44. Diaz, C.; Saliba-Colombani, V.; Loudet, O.; Belluomo, P.; Moreau, L.; Daniel-Vedele, F.; Morot-Gaudry, J.F.; Masclaux-Daubresse, C. Leaf Yellowing and Anthocyanin Accumulation are Two Genetically Independent Strategies in Response to Nitrogen Limitation in Arabidopsis thaliana. Plant Cell Physiol. 2006, 47, 74–83. [Google Scholar] [CrossRef]
  45. Luziatelli, F.; Ficca, A.G.; Colla, G.; Baldassarre Švecová, E.; Ruzzi, M. Foliar Application of Vegetal-Derived Bioactive Compounds Stimulates the Growth of Beneficial Bacteria and Enhances Microbiome Biodiversity in Lettuce. Front. Plant Sci. 2019, 10, 60. [Google Scholar] [CrossRef] [PubMed]
  46. Müller, P.; Li, X.P.; Niyogi, K.K. Non-Photochemical Quenching. A Response to Excess Light Energy. Plant Physiol. 2001, 125, 1558–1566. [Google Scholar] [CrossRef] [PubMed] [Green Version]
  47. Kim, E.H.; Li, X.P.; Razeghifard, R.; Anderson, J.M.; Niyogi, K.K.; Pogson, B.J.; Chow, W.S. The multiple roles of light-harvesting chlorophyll a/b-protein complexes define structure and optimize function of Arabidopsis chloroplasts: A study using two chlorophyll b-less mutants. Biochim. Biophys. Acta 2009, 1787, 973–984. [Google Scholar] [CrossRef] [PubMed]
  48. Miflin, B.J.; Habash, D.Z. The role of glutamine synthetase and glutamate dehydrogenase in nitrogen assimilation and possibilities for improvement in the nitrogen utilization of crops. J. Exp. Bot. 2002, 53, 979–987. [Google Scholar] [CrossRef] [PubMed] [Green Version]
Figure 1. Cluster heat map analysis summarizing plant responses to tropical plant extract (PE) biostimulant or untreated control (C) and different nutrient solution concentrations: full-strength (FNS), half-strength (HNS), and quarter-strength (QNS). Figure was generated using the https://biit.cs.ut.ee/clustvis/ online program package with Euclidean distance as the similarity measure and hierarchical clustering with complete linkage.
Agronomy 09 00249 g001
Figure 2. Heat map analysis summarizing the plant response to different nutrient solution (NS) concentrations (full-strength (FNS), half-strength (HNS), and quarter-strength (QNS), and tropical plant extract (PE) biostimulant). Results were calculated as Logarithm base 2 (Log2) of HNS and QNS/FNS in (A) control plants or (B) PE/control in plants grown at different NS, and are visualized using a false color scale with red indicating an increase and blue a decrease. White squares denotes no differences.
Agronomy 09 00249 g002
Figure 3. Principal component loading plot and scores of principal component analysis (PCA) of growth parameters, fresh yield, and shoot dry biomass mineral concentrations (nitrate, P, K, Ca, Mg, S, and Na), net CO2 assimilation rate (ACO2), SPAD index, chlorophyll, starch, soluble carbohydrates, soluble proteins, amino acids profile, and total amino acids in untreated (C) and treated Corchorus olitorius plants with tropical plant extract (PE) biostimulant grown under different nutrient solution concentration (full-, half-, and quarter-strength: 100%, 50%, and 25%, respectively).
Agronomy 09 00249 g003
Table 1. Growth parameters, fresh yield, shoot dry biomass, and leaf dry matter percentage of hydroponically grown jute in relation to nutrient solution concentration and tropical plant extract biostimulant application. All data are expressed as mean ± error (n = 3).
Source of VariancePlant HeightLeaf NumberLeaf AreaFresh YieldDry BiomassLeaf Dry Matter
(cm)(no. plant−1)(cm2·plant−1)(g·plant−1)(g·plant−1)(%)
Biostimulant (B)
Control58.31 ± 1.0747.56 ± 3.74487.72 ± 60.179.43 ± 0.993.21 ± 0.2518.25 ± 0.58
Tropical plant extract60.06 ± 1.0648.00 ± 3.25549.76 ± 56.1910.65 ± 0.823.54 ± 0.2517.43 ± 0.64
t-test0.2640.9300.0460.3530.3640.352
Nutrient concentration (C)
Full-strength61.47 ± 1.32 a57.33 ± 1.69 a675.31 ± 19.74 a12.65 ± 0.12 a3.94 ± 0.10 a16.14 ± 0.63 b
Half-strength60.28 ± 0.43 a50.39 ± 1.33 a575.09 ± 31.00 b10.86 ± 0.38 b3.65 ± 0.19 a18.01 ± 0.17 ab
Quarter-strength55.81 ± 0.62 b35.61 ± 2.27 b305.81 ± 29.77 c6.61 ± 0.41 c2.52 ± 0.20 b19.38 ± 0.62 a
****************
C × B
Full-strength Control59.72 ± 2.3357.33 ± 1.33664.38 ± 15.6812.44 ± 0.11 ab3.88 ± 0.0516.55 ± 0.45
Half-strength Control59.89 ± 0.4352.11 ± 0.97533.73 ± 36.4010.08 ± 0.26 c3.46 ± 0.1918.01 ± 0.27
Quarter-strength Control55.33 ± 1.2133.22 ± 2.06265.05 ± 20.485.76 ± 0.32 e2.29 ± 0.1520.20 ± 0.58
Full-strength PE63.22 ± 0.5357.33 ± 3.53686.24 ± 39.7912.87 ± 0.10 a3.99 ± 0.2215.73 ± 1.28
Half-strength PE60.67 ± 0.7748.67 ± 2.22616.46 ± 42.0511.64 ± 0.25 b3.85 ± 0.3318.01 ± 0.27
Quarter-strength PE56.28 ± 0.4838.00 ± 3.98346.57 ± 48.497.46 ± 0.08 d2.76 ± 0.3518.55 ± 0.96
nsnsns*nsns
ns, denotes nonsignificant; *, **, *** denote significant at p ≤ 0.05, 0.01, and 0.001, respectively. Biostimulant application main effects were compared by t-test. Different letters within each column indicate significant differences at p ≤ 0.05 (Tukey’s test).
Table 2. Nitrate, phosphorus (P), potassium (K), calcium (Ca), magnesium (Mg), sulfur (S), and sodium (Na) concentrations of hydroponically grown jute in relation to nutrient solution concentration and tropical plant extract biostimulant application. All data are expressed as mean ± error, n = 3.
Source of VarianceNitratePKCaMgSNa
(mg·kg−1 fw)(g·kg−1 fw)(g·kg−1 fw)(g·kg−1 dw)(g·kg−1 dw)(g·kg−1 dw)(g·kg−1 dw)
Biostimulant (B)
Control1802 ± 2333.82 ± 0.4840.87 ± 0.765.66 ± 0.22.61 ± 0.140.68 ± 0.030.13 ± 0.01
Tropical plant extract1529 ± 2324.05 ± 0.5145.88 ± 1.566.10 ± 0.273.15 ± 0.150.74 ± 0.040.07 ± 0.01
t-test0.0450.7500.0110.2080.0170.1900.000
Nutrient concentration (C)
Full-strength2757 ± 43 a5.79 ± 0.28 a45.67 ± 1.95.70 ± 0.353.02 ± 0.220.66 ± 0.030.11 ± 0.01
Half-strength1764 ± 129 b3.21 ± 0.15 b42.59 ± 1.315.56 ± 0.232.78 ± 0.220.80 ± 0.040.10 ± 0.02
Quarter-strength476 ± 33 c2.82 ± 0.23 b41.86 ± 2.016.38 ± 0.22.85 ± 0.210.67 ± 0.030.09 ± 0.02
******nsns*nsns
C × B
Full-strength Control2810 ± 56 a5.72 ± 0.142.73 ± 0.755.25 ± 0.452.63 ± 0.210.64 ± 0.030.13 ± 0.02
Half-strength Control2051 ± 22 b2.90 ± 0.1339.86 ± 1.035.81 ± 0.362.41 ± 0.20.75 ± 0.030.13 ± 0.03
Quarter-strength Control545 ± 17 d2.85 ± 0.2740.02 ± 1.645.93 ± 0.072.80 ± 0.320.64 ± 0.040.13 ± 0.02
Full-strength PE2703 ± 56 a5.86 ± 0.6148.62 ± 2.956.15 ± 0.463.41 ± 0.190.69 ± 0.040.08 ± 0.01
Half-strength PE1478 ± 30 c3.52 ± 0.0745.32 ± 0.345.32 ± 0.263.15 ± 0.250.85 ± 0.070.07 ± 0.02
Quarter-strength PE407 ± 17 e2.78 ± 0.4343.69 ± 3.756.83 ± 0.032.91 ± 0.350.69 ± 0.060.05 ± 0.01
*nsnsnsnsnsns
ns denotes nonsignificant; * and *** significant at p ≤ 0.05 and 0.001, respectively. Biostimulant application main effects were compared using t-tests. Different letters within each column indicate significant differences at p ≤ 0.05 (Tukey’s test).
Table 3. Net CO2 assimilation rate (ACO2), Soil Plant Analysis Development (SPAD) index, and chlorophyll content of hydroponically grown jute in relation to nutrient solution concentration and tropical plant extract biostimulant application. All data are expressed as mean ± error, n = 3.
Source of VarianceACO2SPAD IndexChlorophyll aChlorophyll bTotal Chlorophyll
(μmol CO2·m−2·s−1)(mg·g−1 fw)(mg·g−1 fw)(mg·g−1 fw)
Biostimulant (B)
Control9.36 ± 0.2746.47 ± 0.473.08 ± 0.181.48 ± 0.244.56 ± 0.32
Tropical plant extract10.34 ± 0.2947.31 ± 0.714.11 ± 0.512.95 ± 0.477.06 ± 0.96
t-test0.0260.3430.0500.0130.026
Nutrient concentration (C)
Full-strength10.61 ± 0.35 a48.81 ± 0.44 a4.57 ± 0.62 a2.72 ± 0.867.29 ± 1.47 a
Half-strength9.87 ± 0.24 a46.86 ± 0.36 b3.39 ± 0.29 b1.97 ± 0.185.37 ± 0.40 ab
Quarter-strength9.06 ± 0.31 b45.00 ± 0.29 c2.83 ± 0.28 b1.94 ± 0.364.77 ± 0.63 b
********ns*
C × B
Full-strength Control9.87 ± 0.0647.94 ± 0.263.30 ± 0.20 b0.82 ± 0.07 c4.13 ± 0.27 b
Half-strength Control9.80 ± 0.3946.63 ± 0.213.31 ± 0.27 b1.91 ± 0.30 b5.23 ± 0.37 b
Quarter-strength Control8.43 ± 0.2144.83 ± 0.382.63 ± 0.32 b1.69 ± 0.50 b4.32 ± 0.83 b
Full-strength PE11.36 ± 0.2549.67 ± 0.385.84 ± 0.52 a4.61 ± 0.37 a10.45 ± 0.85 a
Half-strength PE9.95 ± 0.3847.08 ± 0.753.48 ± 0.57 b2.04 ± 0.25 b5.51 ± 0.81 b
Quarter-strength PE9.70 ± 0.1845.17 ± 0.503.03 ± 0.49 b2.19 ± 0.57 b5.22 ± 1.06 b
nsns******
ns denotes nonsignificant; *, **, and *** denote significant at p ≤ 0.05, 0.01, and 0.001, respectively. Biostimulant application main effects were compared using t-tests. Different letters within each column indicate significant differences at p ≤ 0.05 (Tukey’s test).
Table 4. Starch, soluble carbohydrates, polyphenols, and anthocyanins contents in leaves of hydroponically grown jute in relation to nutrient solution concentration and tropical plant extract biostimulant application. All data are expressed as mean ± error, n = 3.
Source of VarianceStarchGlucoseFructoseSucrosePolyphenolsAnthocyanins
(µmol·g−1 fw)(µmol·g−1 fw)(µmol·g−1 fw)(µmol·g−1 fw)(mg GAE·100 g−1 fw)(mg C3G·100 g−1 fw)
Biostimulant (B)
Control14.70 ± 1.909.07 ± 0.8713.94 ± 0.338.65 ± 0.35194.4 ± 13.754.74 ± 4.7
Tropical plant extract21.16 ± 3.948.60 ± 0.5913.39 ± 0.638.64 ± 0.66182.0 ± 14.144.45 ± 4.9
t-test0.0150.6600.4480.9920.5370.149
Nutrient concentration (C)
Full-strength23.78 ± 5.81 a7.40 ± 0.8312.83 ± 0.429.64 ± 0.80169.1 ± 8.738.70 ± 2.9 b
Half-strength12.35 ± 1.09 c9.03 ± 0.8013.41 ± 0.748.40 ± 0.54185.0 ± 8.244.83 ± 5.4 b
Quarter-strength17.66 ± 2.02 b10.07 ± 0.8014.75 ± 0.407.88 ± 0.31210.6 ± 25.165.26 ± 3.4 a
***nsnsnsns**
C × B
Full-strength Control11.27 ± 1.64 b6.32 ± 0.2813.31 ± 0.679.00 ± 0.96161.8 ± 16.242.69 ± 2.7
Half-strength Control12.13 ± 2.19 b9.87 ± 1.4614.14 ± 0.588.67 ± 0.56196.4 ± 8.551.13 ± 5.8
Quarter-strength Control20.69 ± 2.98 b11.02 ± 0.9714.38 ± 0.468.27 ± 0.39225.0 ± 30.270.40 ± 4.7
Full-strength PE36.29 ± 3.13 a8.49 ± 1.4812.35 ± 0.4410.29 ± 1.37176.3 ± 7.934.72 ± 4.3
Half-strength PE12.57 ± 1.03 b8.19 ± 0.6312.68 ± 1.388.13 ± 1.04173.6 ± 11.638.53 ± 8.6
Quarter-strength PE14.63 ± 1.49 b9.12 ± 1.1715.13 ± 0.667.50 ± 0.44196.2 ± 45.060.12 ± 2.9
***nsnsnsnsns
ns denotes nonsignificant; *, **, and *** denote significant at p ≤ 0.05, 0.01, and 0.001, respectively. Biostimulant application main effects were compared using t-tests. Different letters within each column indicate significant differences at p ≤ 0.05 (Tukey’s test).
Table 5. Soluble proteins, free amino acids profile and total amino acids content in leaves of hydroponically grown jute in relation to nutrient solution concentration and tropical plant extract biostimulant application. All data are expressed as mean ± error, n = 3.
Source of VarianceSoluble ProteinsAlanineArginineAsparagineAspartateGABAGlycineGlutamateGlutamineIsoleucineHistidineLeucineLysineMethionineOrnhitinePhenylalanineProlineSerineTyrosineThreonineTryptophanValineTotal Amino Acids
(mg·g−1 fw)(µmol·g−1 fw)(µmol·g−1 fw)(µmol·g−1 fw)(µmol·g−1 fw)(µmol·g−1 fw)(µmol·g−1 fw)(µmol·g−1 fw)(µmol·g−1 fw)(µmol·g−1 fw)(µmol·g−1 fw)(µmol·g−1 fw)(µmol·g−1 fw)(µmol·g−1 fw)(µmol·g−1 fw)(µmol·g−1 fw)(µmol·g−1 fw)(µmol·g−1 fw)(µmol g−1 fw)(µmol g−1 fw)(µmol·g−1 fw)(µmol·g−1 fw)(µmol·g−1 fw)
Biostimulant (B)
Control6.8 ± 0.41.00 ± 0.090.36 ± 0.040.47 ± 0.041.21 ± 0.104.19 ± 0.440.19 ± 0.022.53 ± 0.203.11 ± 0.440.16 ± 0.010.08 ± 0.000.23 ± 0.020.15 ± 0.010.01 ± 0.000.16 ± 0.010.10 ± 0.010.31 ± 0.030.45 ± 0.020.04 ± 0.000.20 ± 0.030.05 ± 0.000.26 ± 0.0215.85 ± 0.50
PE8.6 ± 1.21.21 ± 0.090.30 ± 0.020.79 ± 0.081.58 ± 0.184.00 ± 0.310.14 ± 0.012.83 ± 0.283.92 ± 0.550.19 ± 0.010.09 ± 0.020.21 ± 0.020.13 ± 0.010.02 ± 0.000.16 ± 0.010.10 ± 0.010.37 ± 0.040.51 ± 0.060.05 ± 0.010.26 ± 0.040.05 ± 0.000.31 ± 0.0217.81 ± 1.51
t-test0.0490.1220.1590.0030.0440.7230.0500.3950.2660.1530.4400.4010.1270.0060.9690.8890.0450.3880.1870.1880.1550.0490.236
Nutrient conc. (C)
FNS10.0 ± 1.5 a1.08 ± 0.170.32 ± 0.04ab0.81 ± 0.12 a1.72 ± 0.23 a3.69 ± 0.380.15 ± 0.022.95 ± 0.364.89 ± 0.52 a0.15 ± 0.02 b0.12 ± 0.020.23 ± 0.020.15 ± 0.010.02 ± 0.000.17 ± 0.010.10 ± 0.010.44 ± 0.05 a0.60 ± 0.08 a0.06 ± 0.010.28 ± 0.05 a0.05 ± 0.010.28 ± 0.0418.90 ± 2.08
HNS5.9 ± 0.4 b1.00 ± 0.060.29 ± 0.03 b0.55 ± 0.04 b1.15 ± 0.14 b3.84 ± 0.330.16 ± 0.022.51 ± 0.193.77 ± 0.25 a0.17 ± 0.01 ab0.08 ± 0.000.19 ± 0.020.13 ± 0.010.02 ± 0.000.15 ± 0.010.10 ± 0.010.31 ± 0.03 b0.41 ± 0.02 b0.05 ± 0.000.26 ± 0.03 a0.05 ± 0.000.26 ± 0.0115.95 ± 0.48
QNS7.3 ± 0.6b1.23 ± 0.090.39 ± 0.04 a0.53 ± 0.09 b1.30 ± 0.12 b4.75 ± 0.560.19 ± 0.042.59 ± 0.341.88 ± 0.20 b0.21 ± 0.01 a0.07 ± 0.010.24 ± 0.020.14 ± 0.020.02 ± 0.000.16 ± 0.010.11 ± 0.010.26 ± 0.02 b0.44 ± 0.03 b0.04 ± 0.000.15 ± 0.01 b0.05 ± 0.000.31 ± 0.0115.65 ± 0.91
***ns*****nsnsns*****nsnsnsnsns*****ns**nsnsns
C × B
FNS C6.6 ± 0.4 b0.78 ± 0.05 b0.26 ± 0.04 b0.58 ± 0.07 bc1.23 ± 0.08 b3.19 ± 0.380.13 ± 0.01 b2.23 ± 0.22 bc4.40 ± 0.35 b0.12 ± 0.010.08 ± 0.010.19 ± 0.02 bc0.13 ± 0.02 abc0.02 ± 0.000.16 ± 0.01 ab0.08 ± 0.010.34 ± 0.02 b0.44 ± 0.05 b0.04 ± 0.000.16 ± 0.03 b0.04 ± 0.000.21 ± 0.02 c15.32 ± 1.28b
HNS C5.9 ± 0.6 b0.88 ± 0.01 b0.35 ± 0.02 ab0.50 ± 0.03 bc0.92 ± 0.08 b4.07 ± 0.390.19 ± 0.02 ab2.12 ± 0.17 c3.41 ± 0.10 c0.17 ± 0.020.08 ± 0.000.23 ± 0.02 abc0.15 ± 0.01 abc0.02 ± 0.000.14 ± 0.01 ab0.11 ± 0.010.36 ± 0.06 b0.42 ± 0.03 b0.05 ± 0.010.28 ± 0.04 ab0.04 ± 0.000.27 ± 0.02 abc15.27 ± 0.39 b
QNS C8.0 ± 0.8 b1.34 ± 0.07 a0.48 ± 0.02 a0.35 ± 0.04 c1.47 ± 0.15 b5.32 ± 0.940.26 ± 0.03 a3.24 ± 0.21 ab1.51 ± 0.19 e0.20 ± 0.010.08 ± 0.010.29 ± 0.02 a0.17 ± 0.01 a0.02 ± 0.000.17 ± 0.01 ab0.12 ± 0.010.22 ± 0.01 b0.49 ± 0.02 b0.04 ± 0.010.15 ± 0.01 b0.06 ± 0.010.31 ± 0.02 ab16.96 ± 0.58ab
FNS PE13.3 ± 0.3 a1.38 ± 0.24 a0.37 ± 0.04 ab1.05 ± 0.13 a2.21 ± 0.16 a4.19 ± 0.570.17 ± 0.03 ab3.67 ± 0.29 a5.39 ± 0.99 a0.19 ± 0.020.15 ± 0.030.28 ± 0.02 ab0.16 ± 0.01 ab0.02 ± 0.000.18 ± 0.01 a0.12 ± 0.010.54 ± 0.03 a0.75 ± 0.07 a0.07 ± 0.010.39 ± 0.03 a0.06 ± 0.000.35 ± 0.02 a22.48 ± 2.69a
HNS PE5.96 ± 0.65 b1.12 ± 0.08 ab0.23 ± 0.03 b0.61 ± 0.08 bc1.38 ± 0.18 b3.61 ± 0.590.14 ± 0.02 b2.90 ± 0.06 abc4.13 ± 0.42 b0.17 ± 0.020.08 ± 0.010.15 ± 0.02 c0.11 ± 0.01 bc0.02 ± 0.000.16 ± 0.00 ab0.09 ± 0.010.27 ± 0.01 b0.40 ± 0.01 b0.05 ± 0.010.25 ± 0.04 ab0.05 ± 0.010.26 ± 0.01 bc16.63 ± 0.73 ab
QNS PE6.69 ± 1.08 b1.13 ± 0.15 ab0.30 ± 0.01 b0.71 ± 0.05 ab1.13 ± 0.16 b4.18 ± 0.590.12 ± 0.02 b1.93 ± 0.31 c2.25 ± 0.18 d0.21 ± 0.030.06 ± 0.010.20 ± 0.02 abc0.11 ± 0.01 c0.02 ± 0.000.14 ± 0.00 b0.10 ± 0.010.30 ± 0.03 b0.39 ± 0.04 b0.04 ± 0.000.15 ± 0.02 b0.05 ± 0.010.31 ± 0.01 ab14.34 ± 1.43 b
************ns******nsns*****ns********ns******
ns denotes nonsignificant; *, **, and *** denote significant at p ≤ 0.05, 0.01, and 0.001, respectively. Biostimulant application main effects were compared using t-tests. Different letters within each column indicate significant differences at p ≤ 0.05 (Tukey’s test).
Table 6. Eigenvalues, relative and cumulative percentage of total variance, and correlation coefficients for each morpho-physiological, biochemical, and nutritional jute traits with respect to the three principal components (PC1, PC2, and PC3). Boldface factor loadings are considered highly weighed.
Principal ComponentsPC1PC2PC3
Eigen value17.79.61.6
Relative variance (%)50.128.510.4
Cumulative variance (%)50.178.689.0
Eigen vectors
SPAD0.972−0.1620.167
Glutamine0.936−0.3420.062
ACO20.925−0.112−0.199
Leaf DM−0.9040.311−0.093
Anthocyanins−0.8790.4480.095
Proline0.8760.1630.105
Sucrose0.8670.2060.448
Tyrosine0.8670.459−0.076
Leaf FW0.856−0.5060.088
Asparagine0.8520.147−0.366
Total Chlorophylls0.8500.422−0.195
Leaf area0.843−0.5130.125
K0.8430.096−0.496
P0.842−0.1200.314
Total amino acids0.8090.5550.037
Leaf number0.799−0.4970.301
Nitrate0.778−0.3800.494
Serine0.7720.6080.179
Aspartate0.7590.587−0.070
Dry Biomass0.758−0.626−0.004
Soluble proteins0.7400.6590.049
Polyphenols−0.6890.6800.074
Plant height0.645−0.569−0.146
Mg0.6440.401−0.572
GABA−0.4100.89100.062
Alanine0.1920.884−0.354
Essential amino acids0.3300.8710.145
Starch0.6560.754−0.004
Glycine−0.2670.7110.469
Glutamate0.5330.6500.046
Ornhitine0.4500.6270.269
Na−0.219−0.0330.947
Hexoses−0.1210.4720.716
Ca−0.1770.566−0.661
S0.093−0.444−0.533

