Article

Iron Biofortification of Red and Green Pigmented Lettuce in Closed Soilless Cultivation Impacts Crop Performance and Modulates Mineral and Bioactive Composition

by
Maria Giordano
1,†,
Christophe El-Nakhel
1,†,
Antonio Pannico
1,
Marios C. Kyriacou
2,
Silvia Rita Stazi
3,
Stefania De Pascale
1 and
Youssef Rouphael
1,*
1
Department of Agricultural Sciences, University of Naples Federico II, 80055 Portici, Italy
2
Department of Vegetable Crops, Agricultural Research Institute, 1516 Nicosia, Cyprus
3
Department for Innovation in Biological, Agro-food and Forest Systems, University of Tuscia, 01100 Viterbo, Italy
*
Author to whom correspondence should be addressed.
Authors of equal contribution.
Submission received: 18 March 2019 / Revised: 31 May 2019 / Accepted: 3 June 2019 / Published: 5 June 2019
(This article belongs to the Collection Nutrition Management of Hydroponic Vegetable Crops)

Abstract

:
Consumer demand for vegetables of fortified mineral and bioactive content is on the rise, driven by the growing interest of society in fresh products of premium nutritional and functional quality. Biofortification of leafy vegetables with essential micronutrients such as iron (Fe) is an efficient means to address the human micronutrient deficiency known as hidden hunger. Morphometric analysis, lipophilic and hydrophilic antioxidant capacities of green and red butterhead lettuce cultivars in response to Fe concentration in the nutrient solution (0.015 control, 0.5, 1.0 or 2.0 mM Fe) were assessed. The experiment was carried out in a controlled-environment growth chamber using a closed soilless system (nutrient film technique). The percentage of yield reduction in comparison to the control treatment was 5.7%, 13.5% and 25.3% at 0.5, 1.0 and 2.0 mM Fe, respectively. Irrespective of the cultivar, the addition of 1.0 mM or 2.0 mM Fe in the nutrient solution induced an increase in the Fe concentration of lettuce leaves by 20.5% and 53.7%, respectively. No significant effects of Fe application on phenolic acids and carotenoid profiles were observed in green Salanova. Increasing Fe concentration in the nutrient solution to 0.5 mM triggered a spike in chlorogenic acid and total phenolics in red Salanova lettuce by 110.1% and 29.1% compared with the control treatment, respectively; moreover, higher accumulation of caffeoyl meso tartaric phenolic acid by 31.4% at 1.0 mM Fe and of carotenoids violaxanthin, neoxanthin and β-carotene by 37.0% at 2.0 mM Fe were also observed in red Salanova compared with the control (0.015 mM Fe) treatment. Red Salanova exhibited higher yield, P and K contents, ascorbic acid, phenolic acids and carotenoid compounds than green Salanova. The wok shows how nutrient solution management in soilless culture could serve as effective cultural practices for producing Fe-enriched lettuce of premium quality, notwithstanding cultivar selection being a critical underlying factor for obtaining high quality products.

1. Introduction

Food obligations and unbalanced diets lead to malnutrition that causes up to 3 million children deaths each year [1]. This phenomenon, known as hidden hunger, is affecting both industrial and developing countries. In fact, the cultivation in poor soils or where nutrients are not phytoavailable, negatively affect human health, causing deficiencies in vitamins and in essential and/or beneficial micronutrients [1,2,3]. Iron (Fe) is one of the indispensable microelements for life and, although the earth crust is rich in it, Fe forms insoluble compounds [2], and its phytoavailable concentration (10−17 M) does not reach the optimal range for plant growth (10−9–10−4 M) [4].
Fe is involved in very important processes, in both plants and humans, such as respiration, photosynthesis, and oxygen transport [4,5]. In the human body, it exists in two different forms of heme complexes, such as hemoglobin and myoglobin, or in non-heme forms, such as iron–sulfur clusters and other prosthetic groups. Two billion people are anemic worldwide and according to the World Health Organization (WHO) the main cause is Fe deficient human diet [6]. Fe deficiency is also among the most responsible factors for illnesses worldwide [7]. Fe absorption in the human intestine can be inhibited by various factors such as phytic acid (2–10 mg per meal) and polyphenols (i.e. tannic acid from 12 to 55 mg) while it is promoted by molecules such as ascorbic acid (50 mg per meal) and β-carotene that can reduce or chelate Fe, leading to more bioavailable complexes [8,9].
Biofortification is a way to address hidden hunger by increasing the nutritional content of plants edible parts. Recently, Finklestein et al. [10] have shown that biofortification with Fe in staple food crops (beans, cassava, maize, pearl millet, rice, sweet potatoes and wheat) can increase Fe status (serum ferritin concentrations and total body Fe), zinc and provitamin A carotenoids in populations at risk, as in the Philippines, India, and Rwanda. According to their work, the beneficial effect has been demonstrated not only in Fe deficient youngsters or baseline adults, but also among individuals who are not at risk [11].
Biofortification can be achieved through mineral fertilization, breeding or biotechnological approaches [1,5]. However, each of these solutions have limitations. For instance, the excessive use of fertilizers contributes to soil pollution or turns minerals into insoluble forms. Fertilization also requires a frequent supply of the element and consequently raises production cost. Moreover, high mineral concentrations can turn into stress conditions for plants. Excessive amounts of Fe can lead to phytotoxicity and growth inhibition, as demonstrated in many cultures such as rice [12,13,14], potato [15], wheat [16,17] and tea [18]. On the other hand, the spread of biofortified transgenic crops in many countries must undergo procrastinated procedures before its legal distribution to the public [1]. Hydroponic cultivation systems eliminate or reduce problems of nutrient phyto-availability. They have long been seen as an answer to the urgent need to produce food for an increasing global population [19,20], since they allow the management of plant nutritional status during growth through effective control of water and nutrient supply. In fact, manipulating the nutrient solution in terms of concentration or composition demonstrably improved the yield or quality of zucchini squash [21], cucumber [22], lettuce [23,24], artichoke [25], cardoon [26], and tomato [27].
Lettuce (Lactuca sativa L.) is one of the most cultivated and consumed leafy vegetables in the world, appreciated for its organoleptic properties and it is a good source of minerals, vitamins, terpenoids, as well as carotenoids, phenolic acids and flavonoids [28,29,30]. Among the different pre-harvest factors (i.e., agricultural practices, developmental stages, climatic control) the genetic factor is considered the major determinant of variation in nutraceutical properties [31,32,33,34,35,36]. The response of lettuce to Fe biofortification was investigated only in terms of yield and Fe status, under soil cultivation [37,38]. Essentially nothing is known about Fe biofortification under closed soilless cultivation (i.e., nutrient film technique, NFT) where the constant exposure of the root system to Fe fortified nutrient solution could maximize Fe uptake, translocation and accumulation in edible parts. In addition, the efficiency of biofortification may depend upon several interacting parameters such as cultivar and application rate [19,20,39,40]. To our knowledge, no information is available on how biofortification with an essential micronutrient such as Fe could differentially modulate the nutritional and functional quality of lettuce, accounting for potential interaction with tested cultivars.
In view of this background, our aim was to assess the effect of different Fe application rates within the nutrient solution on growth parameters, fresh yield, mineral composition, antioxidant activities, nitrate and ascorbic acid contents as well as on phenolics and carotenoids profiles of green and red pigmented butterhead lettuce grown in NFT system under controlled environment. The obtained information will assist the scientific community as well as growers of leafy vegetables in identifying optimum cultivar-application rate combinations for achieving high nutritional and functional value, and in understanding the boundary between biofortification and Fe toxicity in lettuce.

2. Materials and Methods

2.1. Growth Chamber Conditions, Lettuce Cultivars and Experimental Design

The experiment was carried out in a 28 m2 controlled-environment growth chamber (7.0 × 2.1 m × 4.0 m; W × H × D), located at the experimental station of the Department of Agricultural Sciences, University of Naples Federico II, Italy. Artificial light was provided by high pressure sodium lamps, with an intensity of 420 ± 5 µmol m−2 s−1 (165 cm from the top of the canopy) according to a light/dark regime of 12/12h. Temperature was set at 24/18 °C (light/dark) and relative humidity was 60–80%, the latter being maintained by a fog system. The experiment was carried out at ambient carbon dioxide concentration (370–410 ppm), and air exchange was performed by means of an air extractor.
Two cultivars of lettuce (Lactuca sativa L. var. capitata) green Salanova® and red Salanova® (Rijk Zwaan, Der Lier, The Netherlands) were grown in a closed soilless system based on the nutrient film technique (NFT). The nutrient solution being collected in polypropylene reservoir tanks of 25 L and recirculated with a constant flow of 1.5 L min−1 by submerged pumps. The troughs were 200 cm long, 14.5 cm wide and 8 cm deep, with a 1% slope. Seeds of lettuce were germinated in vermiculite. The lettuce seedlings were transplanted 15 days after sowing, at the two-true leaf stage in rockwool cubes (7 × 7 × 7 cm) (Delta, Grodan, Roermond, The Netherlands). Lettuce seedlings were spaced 15 cm apart between rockwool cubes and 30 cm apart between troughs, giving a plant density of 22 plants per square meter. Each trough was covered with propylene taps to avoid evaporation of the nutrient solution.
The growth chamber experiment was designed as a factorial combination of two butterhead lettuce cultivars (red and green pigmented) and four concentrations of Fe in the nutrient solution (0.015 mM control treatment and three concentrations of 0.5, 1.0 and 2.0 mM Fe). The basic nutrient solution nutrient was a modified Hoagland and Arnon formulation. The composition of the basic nutrient solution was: 8.0 mM N-NO3, 1.5 mM S, 1.0 mM P, 3.0 mM K, 3.0 mM Ca, 1.0 mM Mg, 1.0 mM NH4+, 15 µM Fe, 9 µM Mn, 0.3 µM Cu, 1.6 µM Zn, 20 µM B, and 0.3 µM Mo, with an electrical conductivity (EC) of 1.4 dS m−1 and a pH of 5.8 ± 0.2. The biofortified Fe nutrient solution had the same basic nutrient composition plus an additional 0.5, 1.0 and 2.0 mM Fe. Fe biofortification was initiated three days after transplanting (DAT). Fe was added as Fe chelate EDDHA 6% ortho-ortho (Revive Total, Italpollina S.p.a., Rivoli Veronese, Italy).
Eight treatments derived from the factorial combinations of two butterhead lettuce cultivars (red and green Salanova) and four Fe concentrations in the nutrient solution (0.015-control, 0.5, 1.0 or 2.0 mM). Treatments were arranged in a randomized complete-block design amounting to a total of 24 experimental units with twelve plants each (288 green and red Salanova plants in total).

2.2. Growth Analysis, Biomass Determination and Radiation Use Efficiency

19 DAT, all green and red Salanova lettuce plants were harvested. The number of leaves per plant was determined and the total area was measured by a LI-COR 3100C area meter (Biosciences, Lincoln, NE, USA). Leaf tissues were dried at 80 °C for 72 h until they reached a constant weight and weighed again to determine the corresponding shoot dry biomass. The leaf dry matter percentage was also calculated. Finally, radiation use efficiency (RUE) was expressed as the shoot dry biomass divided by cumulative daily intercepted photosynthetically active radiation (PAR).

2.3. Collection of Samples for Mineral and Nutritional Quality Analyses

Part of the dried leaf tissue of green and red Salanova plants was used for macro-mineral and Fe analyses. For the identification and quantification of total ascorbic acid, lipophilic antioxidant activity (LAA), phenolic acids and carotenoid compounds by spectophotometry and HPLC-DAD, fresh samples of three plants per experimental unit were instantly frozen in liquid nitrogen and stored at −80 °C before lyophilizing them in a Christ, Alpha 1-4 (Osterode, Germany) freeze drier.

2.4. Mineral Analysis by Ion Chromatography and ICP-OES

For mineral analysis, 250 mg of dried green and red butterhead lettuce leaves were ground at 0.5 mm in a Wiley Mill, and then suspended in 50 mL of ultrapure water (Milli-Q, Merck Millipore, Darmstadt, Germany) and shaken in water bath (ShakeTemp SW22, Julabo, Seelbach, Germany) at 80 °C for 10 min. The solution was centrifuged at 6000 rpm for 10 min (R-10 M, Remi Elektrotechnik Limited, India), then filtered through a 0.45 μm nylon syringe filter (Phenomenex, Torrance, CA, USA) and analyzed by ion chromatography (ICS-3000, Dionex, Sunnyvale, CA, USA) coupled to a conductivity detector. An IonPac CG12A (4 × 250 mm, Dionex, Corporation) guard column and IonPac CS12A (4 × 250 mm, Dionex, Corporation) analytical column were used for the K, Ca and Mg analysis, while for nitrate and P determination, an IonPac AG11-HC guard (4 × 50 mm) column and IonPac AS11-HC analytical column (4 × 250 mm) were adopted, as detailed in Rouphael et al. [41]. Nitrate was expressed as mg kg−1 fresh weight (fw) on the basis of each sample’s original dry weight (dw), while P, K, Ca and Mg were expressed as g kg−1 dw.
In addition to macro-minerals analysis, the Fe content was also measured in green and red Salanova leaf tissue. Each sample was subjected to a first phase of acid digestion performed using a commercial high-pressure laboratory microwave oven (Mars plus CEM, Italy) operating at an energy output of 1800 W. Approximately 300 mg of each dry sample was inserted directly into a microwave-closed vessel. Two mL of 30% (m/m) H2O2, 0.5 mL of 37% HCl and 7.5 mL of HNO3 69% solution were added to each vessel. The heating program was performed in one step: Temperature was ramped linearly from 25 to 180 °C in 37 min, then held at 180 °C for 15 min. After the digestion procedure and subsequent cooling, samples were transferred into a Teflon beaker and total volume was made up to 25 mL with Milli-Q water. The digest solution was then filtered (DISMIC 25HP PTFE syringe filter, pore size 0.45 µm, Toyo Roshi Kaisha, Ltd., Japan) and stored in a screw cap plastic tube (Nalgene, New York, NY, USA). Blanks were prepared in each lot of samples. The reagents of super-pure grade, used for the microwave-assisted digestions, were: Hydrochloric acid (36% HCl), nitric acid (69% HNO3) and hydrogen peroxide (30% H2O2) (Merck, Darmstadt, Germany). High-purity water (18 MΩ cm−1) from a Milli-Q water purification system (Millipore, Bedford, MA, USA) was used for the dilution of the standards, for preparing samples throughout the chemical process, and for final rinsing of the acid-cleaned vessels, glasses, and plastic utensils. For this work, tomato leaves (SRM 1573a) were used as external certified reference material. The calculated concentration for Fe was very close (within ca. 2%) to the expected one: 368 µg g−1 certified value versus 371.75 µg g−1 determined value.
Fe quantification was performed using an inductively coupled plasma optical emission spectrometer (ICP-OES) with an axially viewed configuration (8000 DV, PerkinElmer, Shelton, CT, USA) equipped with an ultrasonic nebulizer. To assess Fe concentration, calibration standards were prepared, treated equally to samples before dilution. For detection we have chosen the frequency with the lowest interferences, high analytical signal and background ratio, line at 259.9 nm.

2.5. Total Ascorbic Acid Analysis

The total ascorbic acid defined as dehydroascorbic (DHA) and ascorbic acid (AA) was determined by UV–Vis spectrophotometry (Hach DR 2000; Hach Co., Loveland, CO, USA) as described by Kampfenkel et al. [42]. Briefly, 400 mg of sample fresh plant tissues were extracted with trichloroacetic acid (TCA) 6%. 200 µL of the extract was solubilized with 2,2-dipyridyl (14454, Sigma-Aldrich, St. Louis, MO, USA). The assay is based on the reduction of Fe3+ to Fe2+ by total ascorbic acid and the spectrophotometric detection of Fe2+ complexes with 2,2-dipyridyl. DHA is reduced to ASA by pre-incubation of the sample with dithiothreitol (DTT). The absorbance of the solution was measured at 525 nm, and data were expressed as mg AA per 100 g fw.

2.6. Lipophilic Antioxidant Activity Analysis

The lipophilic antioxidant activity (LAA) was extracted from freeze-dried butterhead lettuce leaves (200 mg) with methanol and the antioxidant activity of this extract was measured with the 2,2′-azinobis 3-ethylbenzothiazoline-6-sulfonic acid ABTS method [43]. Similarly, to the total ascorbic acid, LAA was determined by UV–Vis spectrophotometry. The absorbance of the solutions was measured at 734 nm. LAA fraction was expressed as mmol Trolox (6-hydroxy-2,5,7,8-tetramethylchro man-2-carboxylic acid) per 100 g dw.

2.7. Phenolic Acids and Anthocyanins Identification and Quantification

400 mg of lyophilized samples was solubilized in a solution of methanol/water/formic acid (50:45:5, v/v/v, 12 mL) as described by Llorach et al. [28] to determine phenolic acids as hydroxycinnamic derivatives. The suspensions were sonicated for 30 min and then centrifuged (2500 g for 30 min at 4 °C). After a second centrifugation of supernatants at 21,100 g for 15 min at 4 °C, samples were filtered through 0.22 µm cellulose filters (Phenomenex). A reversed phase C18 column (Prodigy, 250 × 4.6 mm, 5 µm, Phenomenex, Torrance, CA) equipped with a C18 security guard (4.0 × 3.0 mm, Phenomenex) was used for the separation of hydroxycinnamic derivatives and anthocyanins. 20 µL of each extract was injected and the following mobile phases was used: (A) water formic acid (95:5, v/v) and (B) methanol through the following gradient of solvent B, (t in [min]/[%B]): (0/5), (25/40), (32/40). The flow rate was 1 mL min−1. LC column was installed onto a binary system (LC-10AD, Shimadzu, Kyoto, Japan), equipped with a DAD (SPD-M10A, Shimadzu, Kyoto, Japan) and a Series 200 autosampler (Perkin Elmer, Waltham, MA). Chlorogenic and chicoric acids at 330 nm were used for the calibration curves of hydroxycinnamic derivatives. Identification of caffeoyl-meso-tartaric acid and caffeoyl-tartaric acid was performed by LC-MS/MS experiments.
The chromatographic profiles of reference curves and samples were recorded in multiple reaction monitoring mode (MRM) by using an API 3000 triple quadrupole (ABSciex, Carlsbad, CA). Negative electrospray ionization was used for detection and source parameters were selected as follows: spray voltage −4.2 kV; capillary temperature: 400 °C, dwell time 100 ms, nebulizer gas and cad gas were set to 10 and 12 respectively (arbitrary units). Target compounds [M-H] were analyzed using mass transitions given in parentheses: Chicoric acid (m/z 473→311, 293), chlorogenic acid (m/z 353→191), caffeoyl tartaric acid (m/z 311→179, 149, retention time 15.8 min), caffeoyl-meso-tartaric acid (m/z 311→179, 149, retention time 17.8 min). The concentration of phenolic acids was reported as mg 100 g−1 of dw.
Anthocyanins were also measured within the same LC-DAD chromatographic runs, at 520 nm and the concentration calculated by using cyanidin as reference standard to calculate the concentration. The results were reported as µg of cyanidin equivalent per g of samples.

2.8. Carotenoids Identification and Quantification

One gram of lyophilized samples was used to determine carotenoids content following the method of Vallverdú-Queralt et al. [44] with slight modifications. Samples were solubilized in ethanol/hexane (4:3, v/v, 2.5 mL) with 1% BHT, vortexed at 22 °C for 30 s and sonicated for 5 min in the dark. Then, the solution was centrifuged (2500 g, 4 °C, 10 min) and filtered through 0.45 µm nylon syringe filters (Phenomenex, Torrance, CA, USA). The extracts were dried in N and the dried extracts were dissolved in 1% BHT in chloroform. 20 µL of each sample was injected onto a C18 column (Prodigy, 250 × 4.6 mm, 5 µm, Phenomenex, Torrance, C A, USA) with a C18 security guard (4.0 × 3.0 mm, Phenomenex). Two mobile phases were used: (A) acetonitrile, hexane, methanol, and dichloromethane (4:2:2:2, v/v/v/v) and (B) acetonitrile. Carotenoids were eluted at 0.8 mL min−1 through the following gradient of solvent B (t in [min]/[%B]): (0/70), (20/60), (30/30), (40/2). Carotenoids were quantified by a binary LC-10AD system connected to a DAD (SPD-M10A, Shimadzu, Kyoto, Japan) equipped with a Series 200 auto-sampler (Perkin Elmer, Waltham, MA, USA). Violaxanthin, neoxanthin, β-cryptoxanthin, lutein and β-carotene were used as reference standards. Identification of the peaks was achieved by comparison of UV-vis spectra and retention times of eluted compounds with pure standards at 450 nm. Three separate sets of calibration curves were built, each set was injected three times in the same day (intraday assay) and three times in three different days (interday assay). The accuracy was reported as the discrepancies between the calibration curves performed intraday and interday and the results were expressed as relative standard deviation RSD (%). A recovery test was performed spiking two samples with two known amounts of carotenoids (50 and 100 µg mL−1 final concentration) and taking into account the overestimation due to the target analytes already present in the samples. The concentration of the target carotenoids was expressed as µg g−1 dw.

2.9. Statistics

The Shapiro–Wilk and Kolmororov–Smirnov procedures were performed to verify that the data had a normal distribution, and the Levene, O’Brien and Bartlet tests were conducted to verify the homogeneity of variances. Then, all morphometric, nutritional and functional quality data were subjected to analysis of variance (two-way ANOVA) using IBM SPSS 20 software package (www.ibm.com/software/analytics/spss). The means were separated by Tukey’s honestly significant difference (HSD) test (significance level 0.05). Butterhead lettuce cultivar main effects were compared by t-Test.

3. Results and Discussion

3.1. Growth Response, Fresh Yield, Dry Matter and Radiation Use Efficiency

Inter and intra-specific genetic variability is among the most important preharvest factors which influence lettuce’s phenotypic and biochemical traits. Lettuce presents, within the same species, a variety of colors, sizes, textures and shapes [45,46,47]. In our study, two cultivars of green and red Salanova were evaluated from a productive and nutritional point of view in response to different Fe concentrations in the nutrient solution.
For leaf number per plant, marketable fresh yield and leaf dry matter percentage no significant interaction between cultivar (C) and Fe nutrient solution concentration (I) was observed, whereas leaf area, dry biomass and radiation use efficiency (RUE) were significantly affected by the interaction of these two factors (Table 1). Irrespective of the Fe concentration in the nutrient solution, the red Salanova had higher marketable yield and percentage dry matter than those recorded in green Salanova plants by 9.3% and 7.0%, respectively (Table 1). Analogous genotypic variation in marketable fresh yield and leaf dry matter content has been previously demonstrated over seven iceberg cultivars (‘Equinos’, ‘Ice Castle’, ‘Metalia’, ‘Num 189’, ‘Silvinas’, ‘Ombrinas’ and ‘Vanguardia’; [36]).
When averaged over both Salanova cultivars, the percentage of yield reduction in comparison to the control treatment (0.015 mM Fe) was 5.7%, 13.5% and 25.3% at 0.5, 1.0 and 2.0 mM Fe concentration in the nutrient solution, respectively, whereas an opposite trend was observed for the leaf dry matter percentage (Table 1). Furthermore, the highest total leaf area was recorded in red Salanova treated with both 0.015 and 0.5 mM Fe. Although the highest shoot dry biomass was recorded in red Salanova treated with 0.015 mM Fe, increasing the Fe concentration in the nutrient solution from 0.015 to 2.0 decreased the dry biomass with more detrimental effect recorded in red-pigmented butterhead lettuce. Specifically, the percentage of dry biomass reduction in comparison to control plants (0.015 mM Fe) ranged from 4.3% to 9.7% in green Salanova and from 10.4% to 18.1% in red Salanova at 1.0 and 2.0 mM Fe concentration in the nutrient solution, respectively (Table 1). The high Fe-tolerance of green-pigmented butterhead lettuce at both Fe concentrations (1.0 and 2.0 mM) may be due to the lower accumulation of Fe in leaf tissue compared to red-pigmented Salanova (Figure 1). Similarly, to the effects on shoot dry biomass, the RUE in red Salanova under control Fe treatment (0.015 mM) exhibited the highest values (Table 1).
In the current study, diamino-di- (ortho-hydroxy phenyl acetic) acid (o, o-EDDHA) was used as Fe chelate, because the final amount of dissolved Fe released in solution, is greater than other forms of Fe chelates and it can be considered as a good supplement in nutrient solutions for soilless cultivation [48,49,50]. Roosta et al. [49] have reported increases in the number of leaves and total leaf area of Capsicum annuum L, after the application of 10 µM of EDDHA to the nutrient solution. Similar results have been also observed by the same authors for four lettuce varieties grown with 20 µM Fe in an NFT hydroponic system [50].
The results on growth parameters, yield and shoot dry biomass of this study are in agreement with those reported by Filho et al. [51], who cultivated Cichorium intybus in an NFT using increased Fe concentrations in the nutrient solution (0.9, 2.7, 8.3, and 25 mg L−1), where plant height, leaf number per plant, as well as plant fresh and dry weight were reduced as Fe concentration increased. The same authors were able to identify the optimal Fe range (2.7 to 8.3 mg L−1), while the 25 mg L−1 application rate had the most harmful effects on plant growth and productivity. While in fact Fe is essential for plant growth, it is also involved in the Fenton reaction that leads to the formation of reactive oxygen species (ROS), which in turn, can lead to cell destruction, because they react with polyunsaturated fatty acids, proteins and nucleic acids [3,52,53]. In the De Dorlodot et al. [52] study, three concentrations of Fe2+ (0, 125 and 250 mg L−1) were used for greenhouse cultivation of rice plants in hydroponic system. The intermediate dose of 125 mg L−1 produced the maximum fresh and dry weights, whereas at the higher dose of 250 mg L−1 a significant reduction in both fresh and dry plant weights was incurred, as well as in water content. A putative mechanism involved in reduced fresh and dry biomass accumulation might be the excessive exposure to Fe (especially at 2.0 mM), which increases peroxide hydrogen generation, causing the overproduction of ROS, which irreversibly leads to membrane lipid oxidation, impairs cellular structure and damages DNA and proteins [54,55].

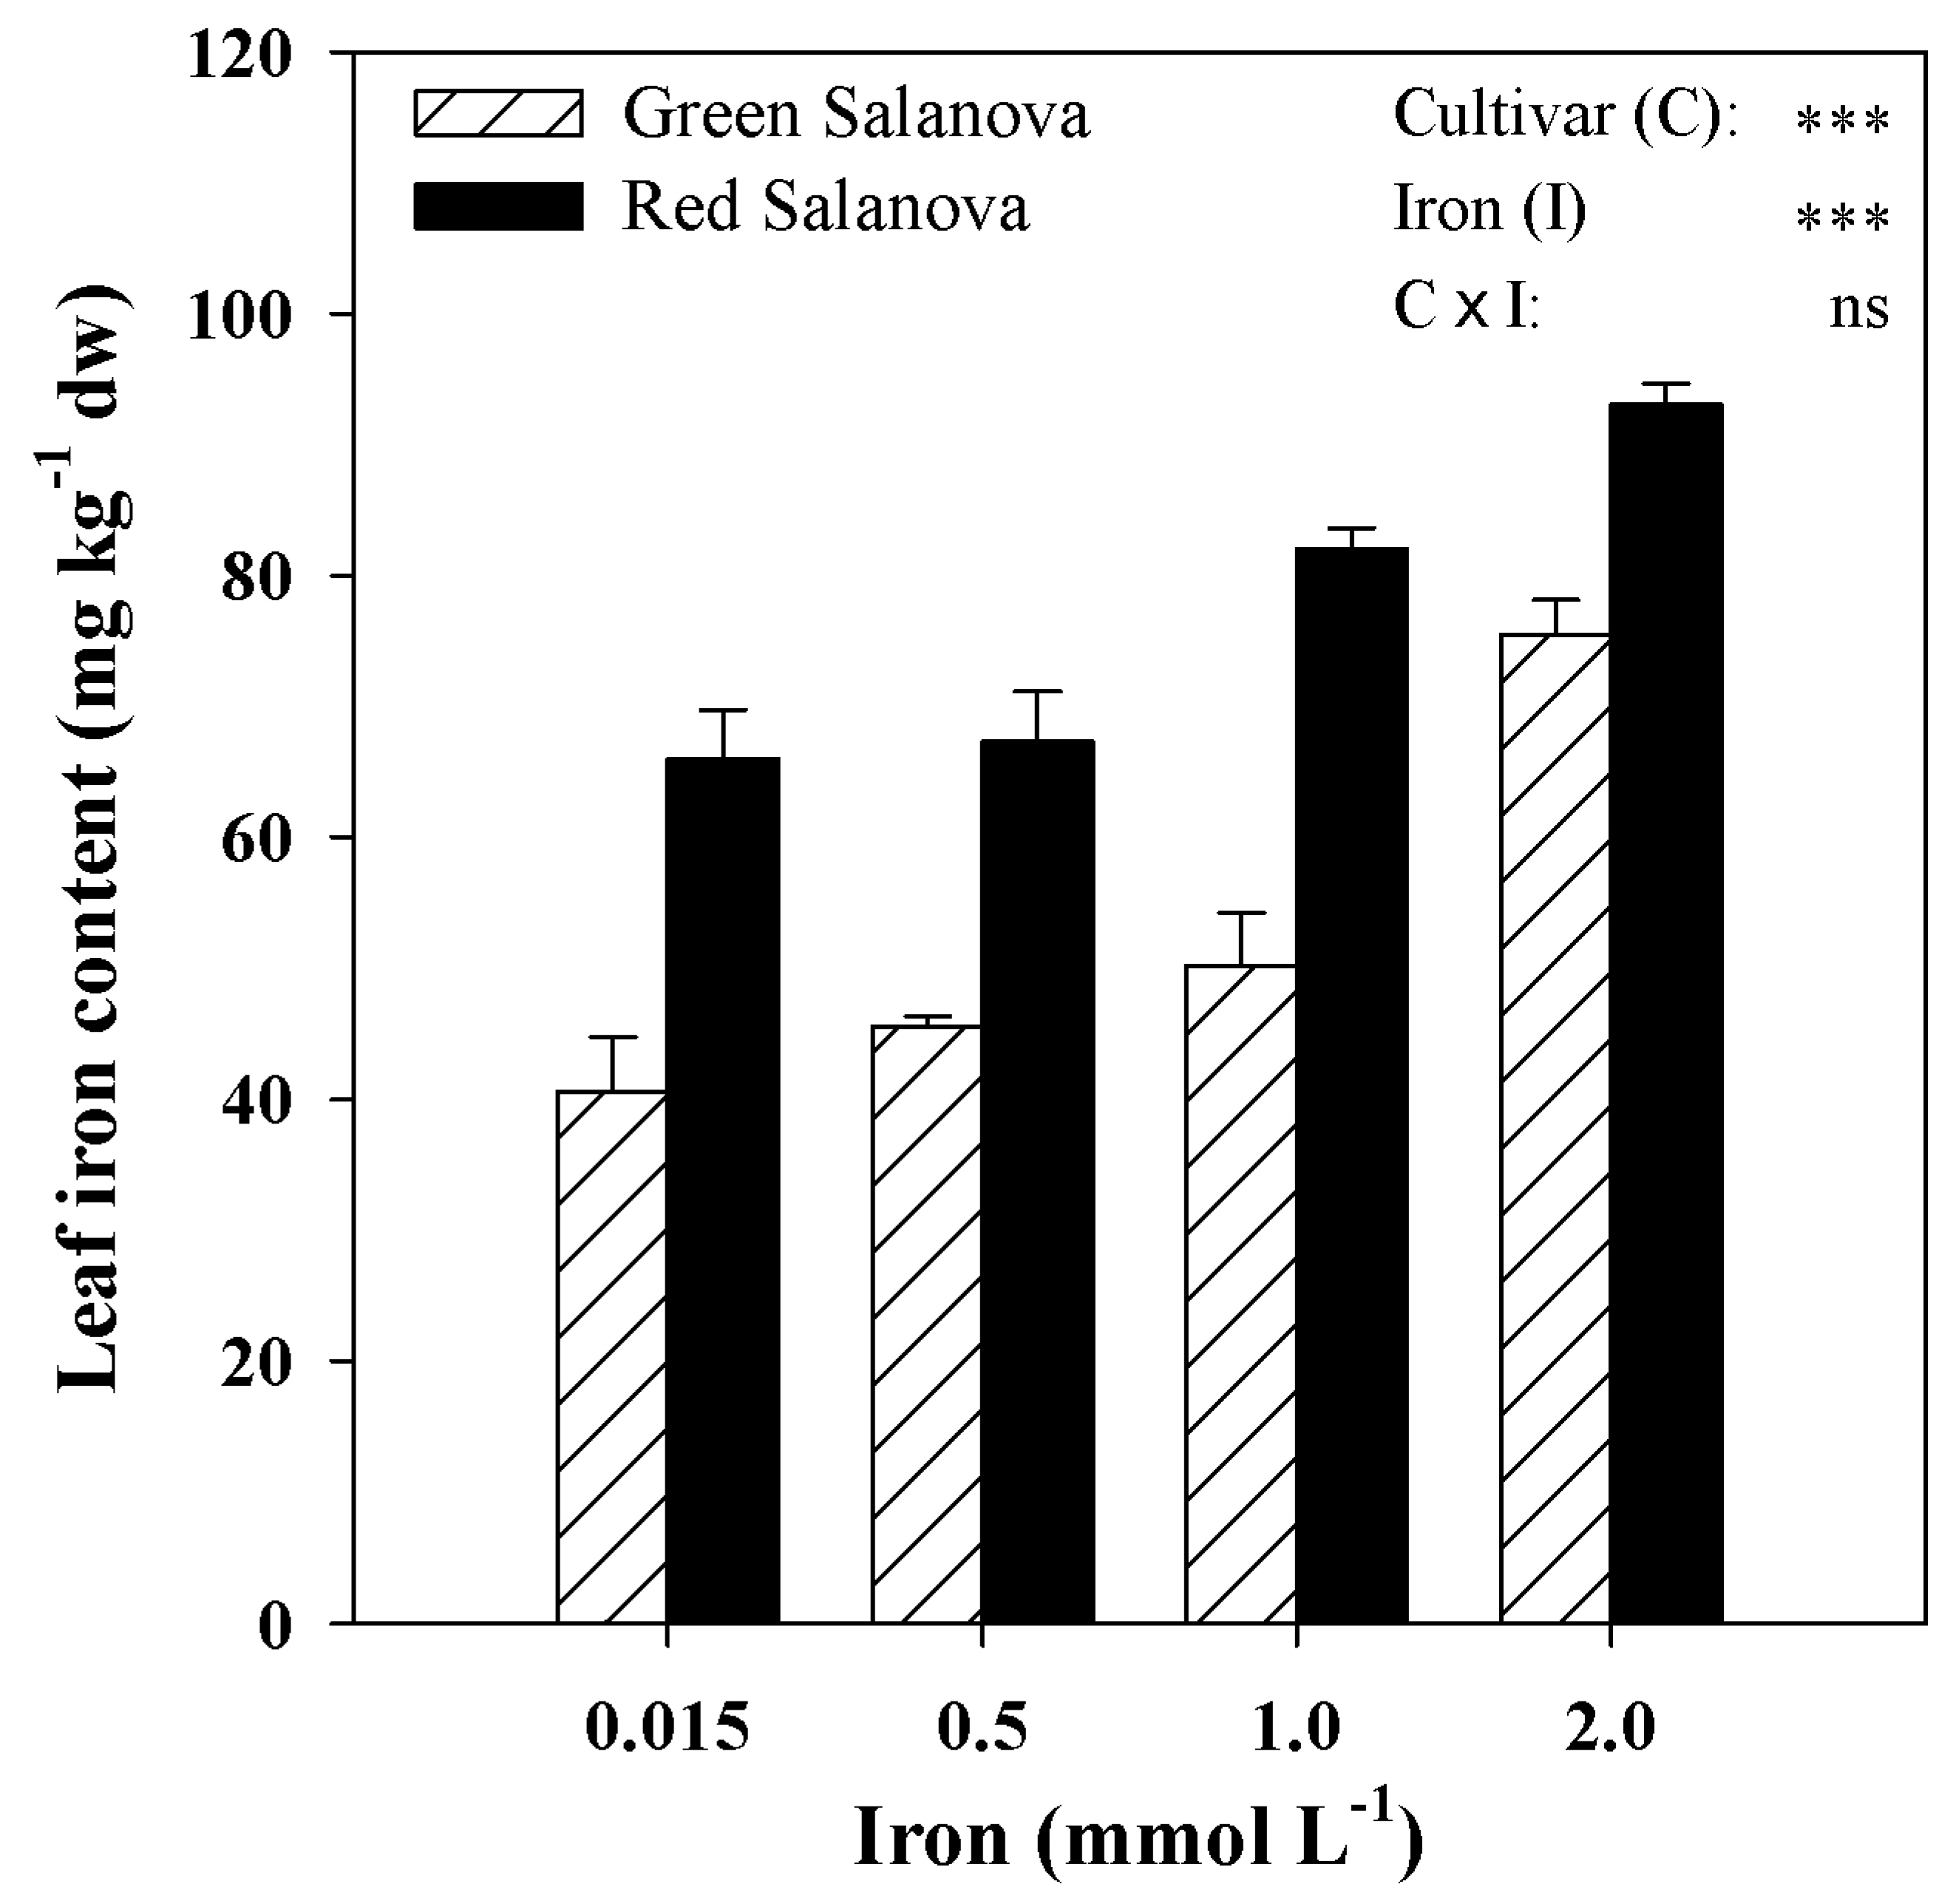
3.2. Nitrate Content, Mineral Composition and Iron Biofortification

The nitrate content recorded among the eight treatments was within the maximum nitrate content allowable for the commercialization of fresh lettuce (4000-5000 mg NO3 kg−1 fw; depending on harvest period and/or growing conditions) according to Commission regulation (EU) No 1258/2011 [56]. The nitrate content varied considerably across the eight treatments (C × I interaction) with the highest nitrate concentration found in green Salanova treated with 2 mM Fe (Table 2). In the current experiment, increasing the Fe concentration in the nutrient solution from 0.015 to 2.0 mM increased the nitrate content in red Salanova (by 8.8%) but especially in green Salanova (by 27.3%) plants (Table 2). Similar results have been reported by Liu et al. [57] who also suggested a positive correlation between Fe supplementation and nitrate content in hydroponically grown lettuce leaves. The high nitrate uptake and accumulation under high Fe availability has been attributed to a molecular mechanism involved in the up-regulation of LATS gene (coding for a low-affinity NO3 transporter) observed in corn salad grown in a floating raft system [58].
It has been demonstrated that a number of dietary macro-minerals such as P, K, Ca and Mg are crucial components of the human diet due to their multifaceted nutraceutical properties such as, lowering blood pressure and hypertension (K), promoting bone health and reducing osteoporosis (P, Ca and Mg) [29]. Our results on the mineral profile of green and red-pigmented butterhead lettuce were proximate to those reported by the National Nutrient Database for Standard References [59] and by several authors [29,60,61] on green and red leaf lettuce including the butterhead type: K (48–72 mg g−1 dw), P (4–6 mg g−1 dw), Mg (1.4–2.8 mg g−1 dw) and Ca (4–10 mg g−1 dw).
In our study, a significant interaction between the tested factors was observed in the case of Ca and Mg, whereas P and K were affected only by cultivar and Fe concentration in the nutrient solution with no C × I interaction (Table 2). The P and K concentrations in red Salanova were higher (P < 0.001) by 7.7% and 10.1%, respectively than those observed in green Salanova, whereas an opposite trend was recorded for Ca. Moreover, Ca and Mg concentrations were the highest in red Salanova treated with 0.015 mM Fe, whereas the lowest values of Ca were also observed in the red-pigmented cultivar treated with 2.0 mM Fe (Table 2). In fact, Fe can cause alteration of mineral composition status due to the competition between Mg and Fe ions for occupying the chlorophyll ring. Moreover, as shown by De Dorlodot et al. [52], the contents of rice plants grown under soilless conditions in P, Ca, and Mg were reduced by Fe application rates of 125 and especially 250 mg L−1, as compared to the control. Furthermore, K, Ca and Mg reductions had been observed in radish, broccoli, alfalfa, and mung bean after the nutrient solution was enriched with Fe [3]. The decreased leaf mineral status especially at 1.0 and 2.0 mM Fe may be attributed to several mechanisms, such as: i) root injury (i.e., formation of root coat) caused by excessive Fe stress impairing nutrient absorption [62], ii) the increasing competition between Fe and other cations, in particular Mg, for absorption sites owing to ion transporters’ lack of specificity [63], and iii) lipid peroxidation and oxidation of enzyme sulfhydryl groups causing the irreversible inhibition of plasma membrane H+-ATPases [64].
The importance of Fe for human health is linked to the synthesis of hemoglobin and oxygen transport. Plants contain Fe only in trace amounts, hence particular attention is given to this mineral from a human diet perspective, especially for vegans who place vegetables at the core of their diet. Moreover, plants partly contain Fe in non-heme (non-chelated) forms which are less bioavailable than the heme Fe found in animal-based foods [29]. However, Fe biofortification can be achieved in leafy vegetables including lettuce [20], though its effectiveness can vary between species/cultivars [3,65]. Based on the review of Kim and co-workers [29], 100 g of fresh lettuce, in particular butterhead that was used in the current experiment, can provide 2 to 15% (without biofortification) of the recommended daily Fe intake of 8–18 mg day−1 according to age, gender and body weight, indicating that Fe biofortification of lettuce leaves can potentially improve the nutritional status of humans. In our study, the Fe accumulation in green and red butterhead lettuce ranged from 40.6 to 75.5 mg kg−1 dw and from 66.0 to 93.0 mg kg−1 dw, respectively (Figure 1). Moreover, the red leaf lettuce cultivar (avg. 77.1 mg kg−1 dw) accumulated 45.5% more Fe than the green one (avg. 52.9 mg kg−1 dw) (Figure 1), which is in agreement with previous results on red and green-pigmented lettuce [29,32,61]. Inversely to macro-minerals, the Fe content recorded in the current experiment differed from the values reported in butterhead lettuce by Kawashima and Soares [61] (100 µg g−1 dw) and Baslam and co-workers [61] (75.8-112 mg kg−1 dw). Such differences in Fe content reported in the scientific literature could be associated to different farming practices, environmental conditions as well as to the cultivars tested [34]. Regardless of cultivar, the addition of 1.0 mM and especially 2.0 mM Fe in the nutrient solution lettuce leaves incurred a significant increase of Fe content by 20.5% and 53.7% (avg. 66.1 and 84.3 mg kg−1 dw, respectively) (Figure 1), demonstrating that the production of Fe-enriched lettuce with absence of defects and decay using closed soilless cultivation is feasible. However, elucidating the physiological and especially the molecular mechanisms facilitating Fe uptake in interaction with genotype pose the future challenge confronting the horticultural industry before achieving the production of leafy vegetables of superior functional quality.

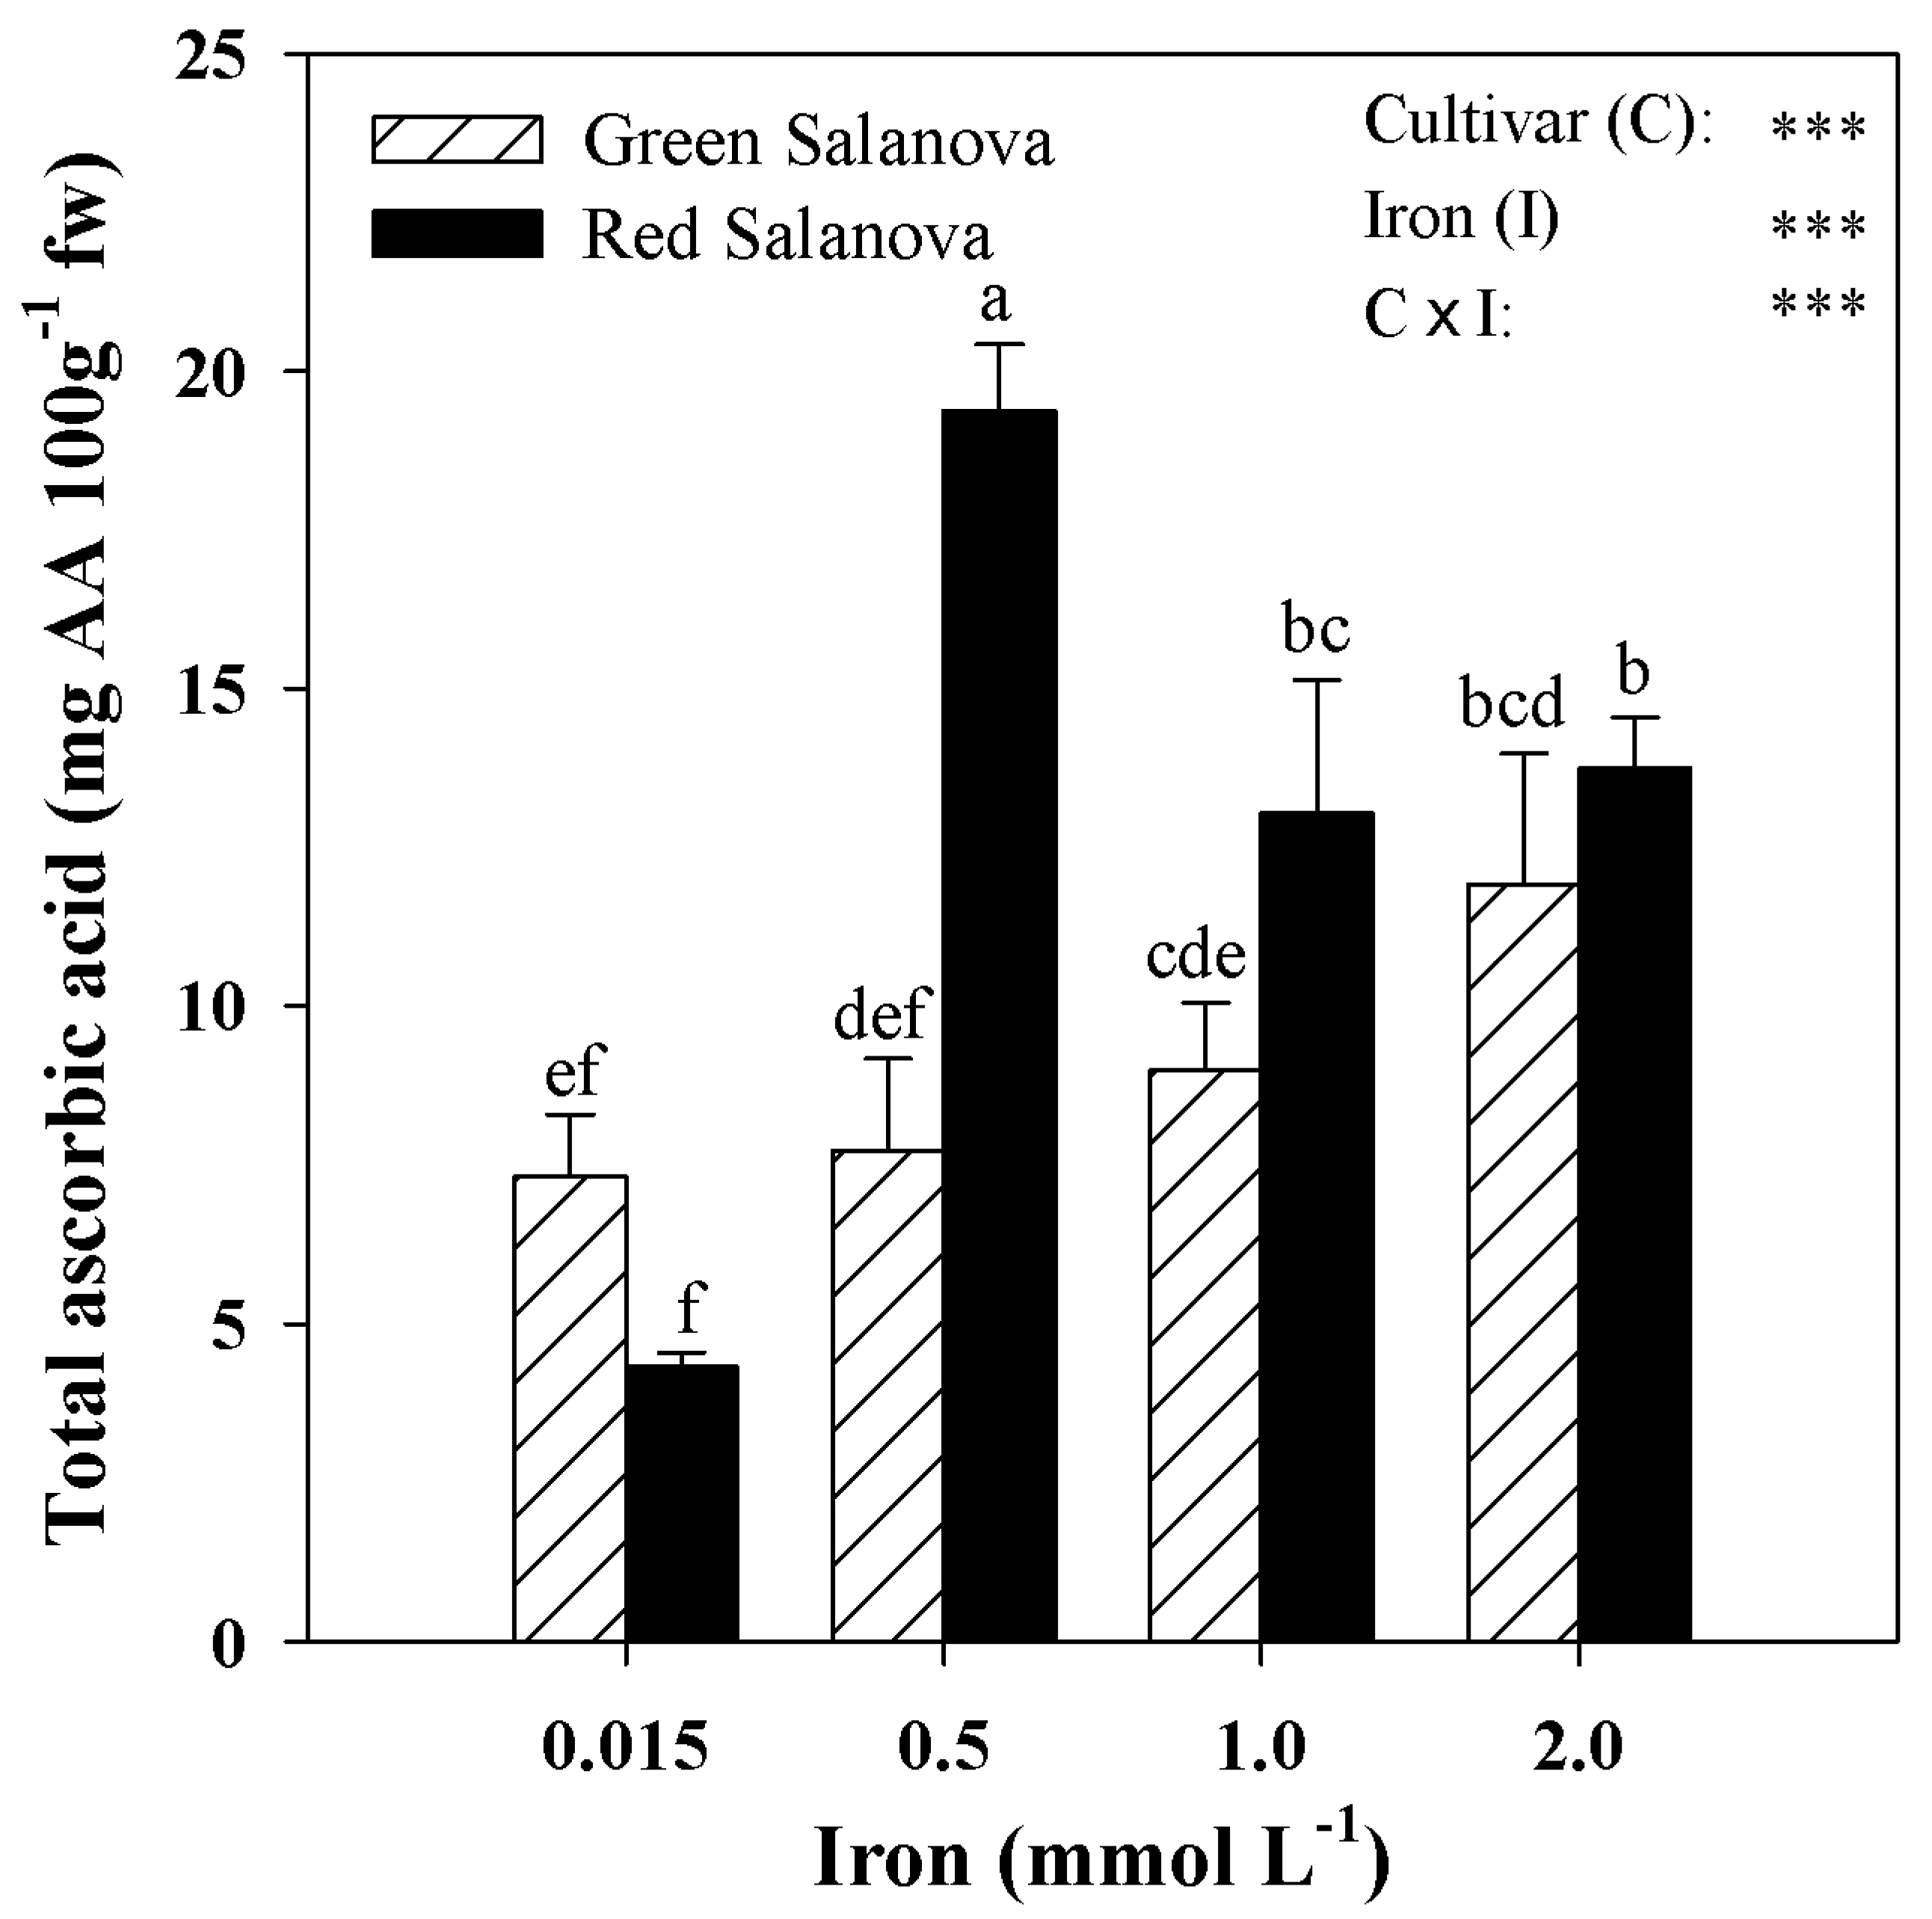
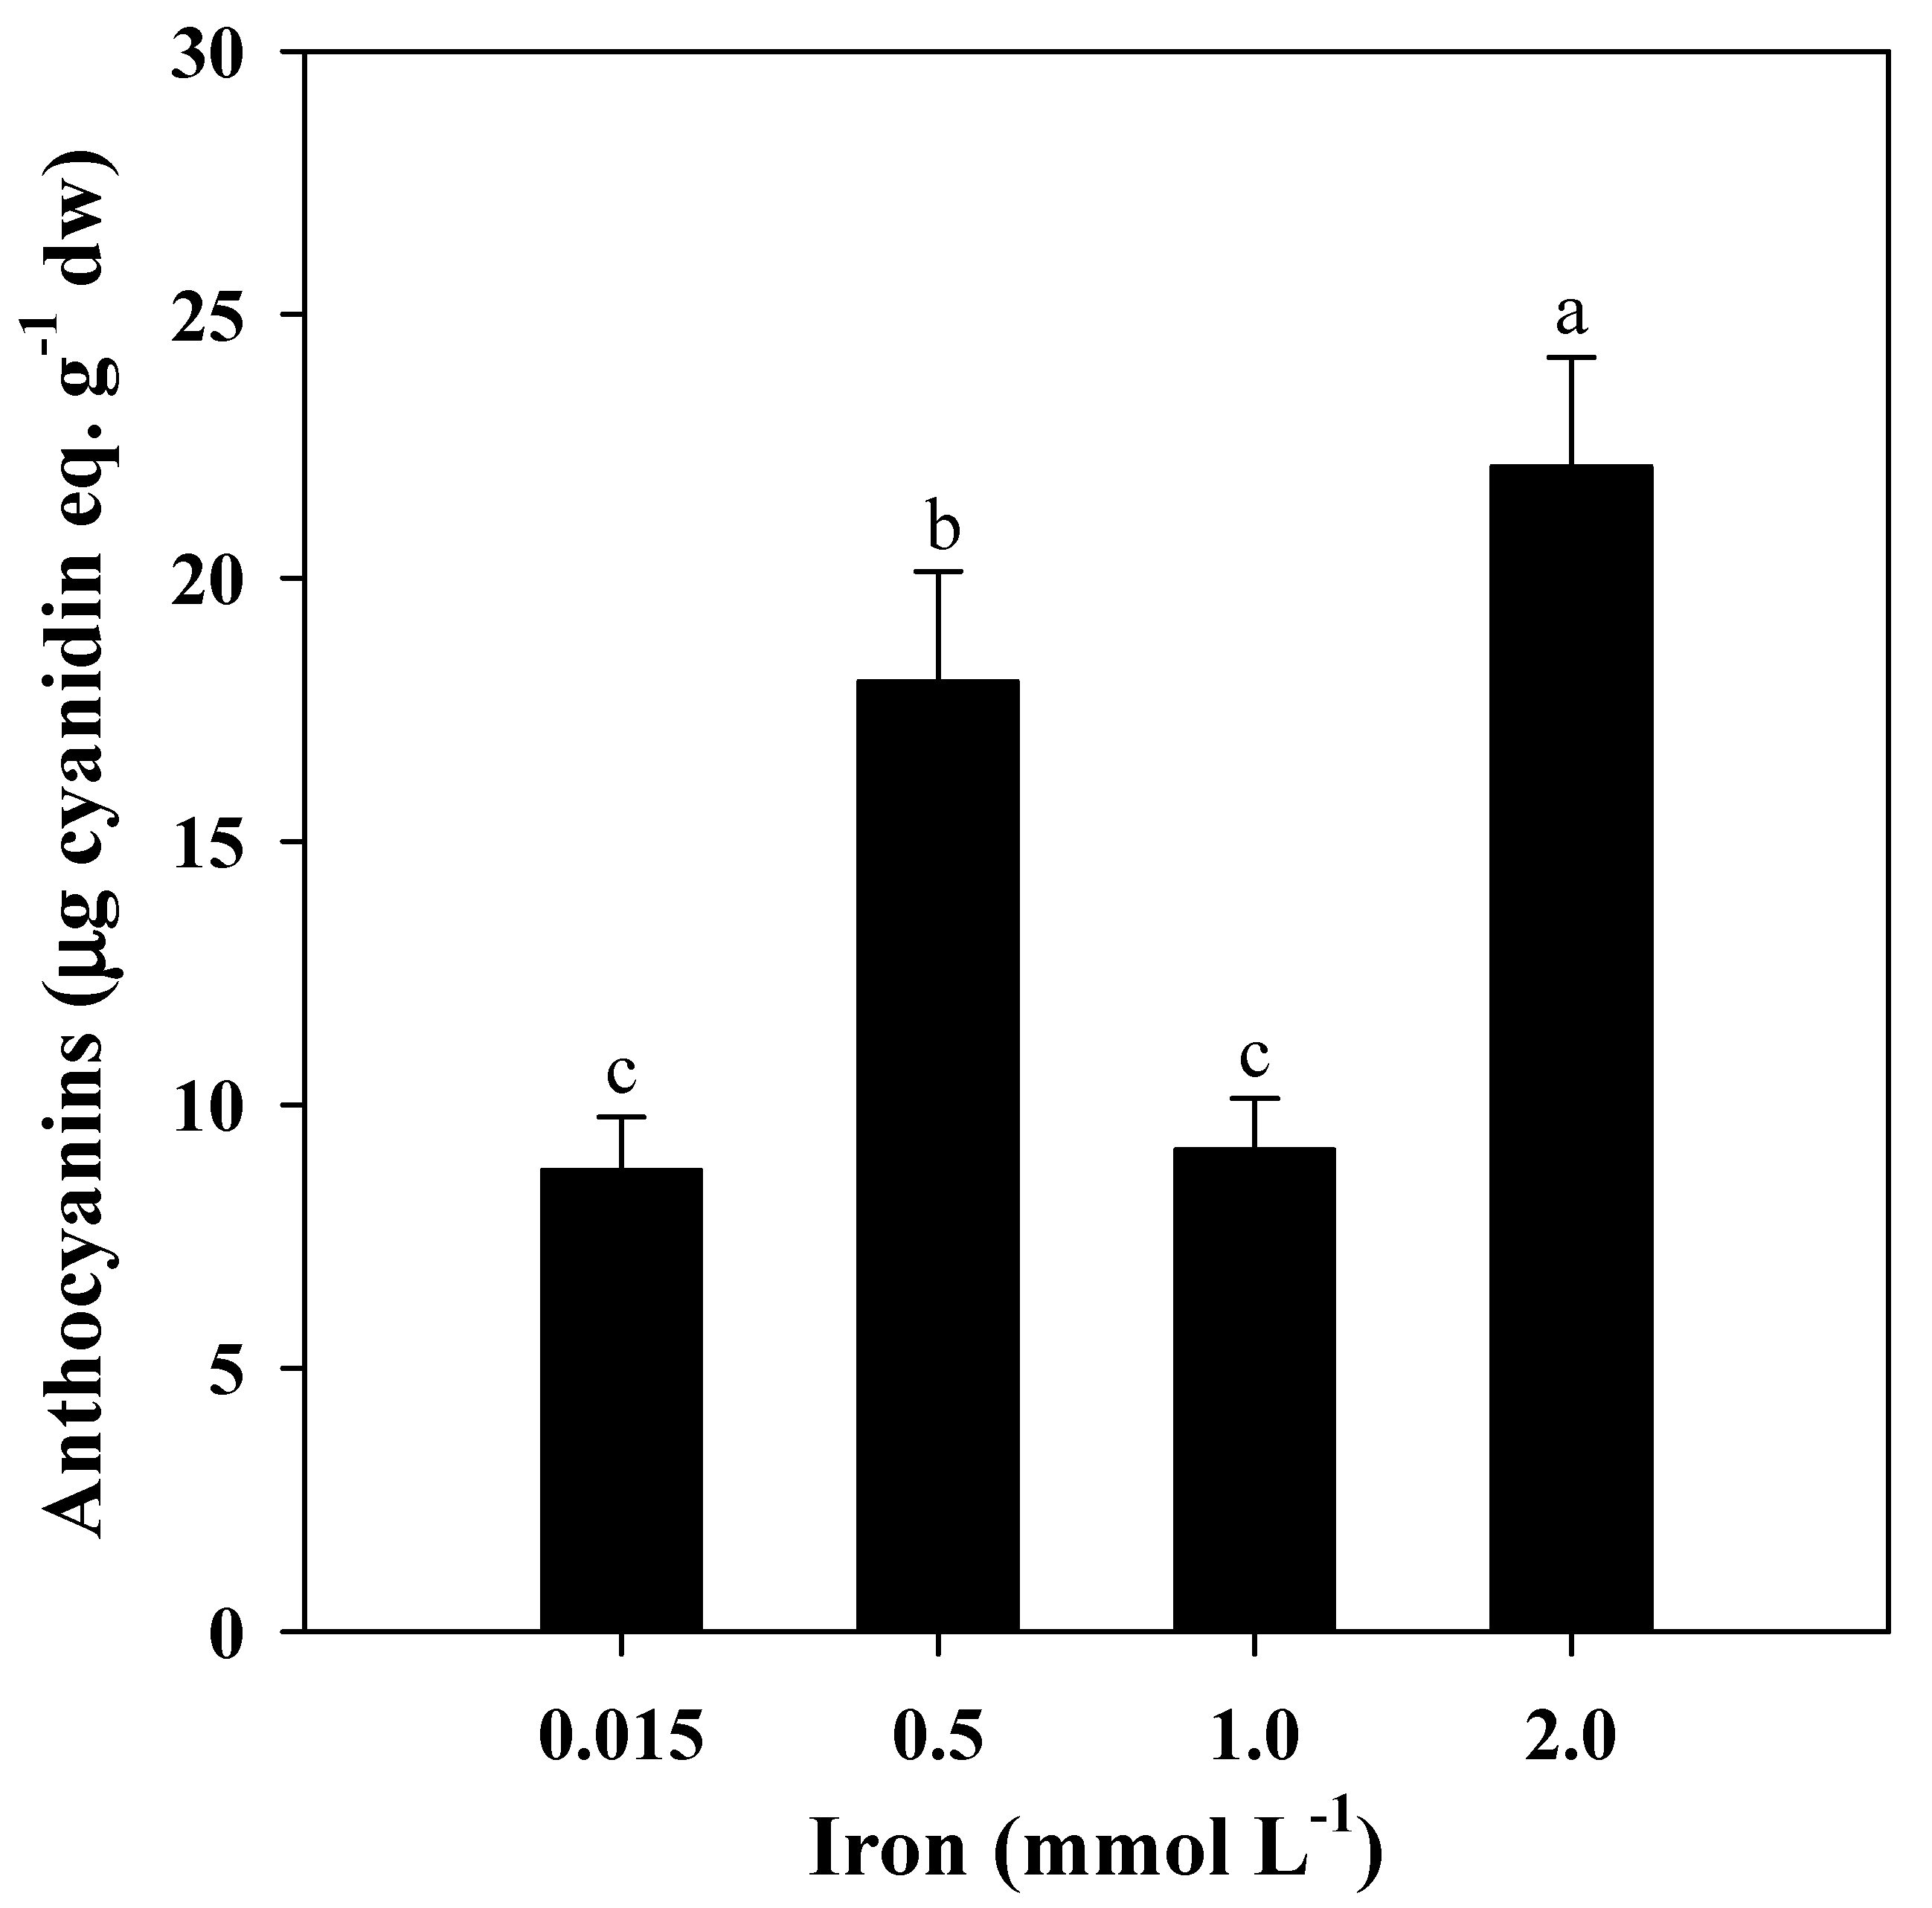
3.3. Hydrophilic Antioxidants: Ascorbic Acid and Phenolics Profile

Many leafy vegetables including lettuce are regarded as a good sources of vitamin C. The most important role played by ascorbic acid is its radical scavenging power derived from its oxidation to the dehydroascorbate form [66]. Ascorbate plays an important role in Fe uptake, due to its ability to reduce Fe3+. It has been shown that the presence of ascorbate in the apoplast reduces extracellular Fe3+, facilitating Fe-uptake [66]. In the current study, the total ascorbic acid including ascorbic and dehydroascorbic acid varied considerably across treatments, with the highest values (19.4 mg 100 g−1 fw) found in red Salanova treated with 0.5 mM Fe and to a lesser extent under 1.0 and 2.0 mM Fe (avg. 13.4 mg 100 g−1 fw (Figure 2). On the other hand, the application of Fe at 0.5 and 1.0 mM in the nutrient solution did not improve significantly the ascorbic acid in green-pigmented lettuce but at 2.0 mM Fe the concentration of this important antioxidant molecule increased by 62.7% (Figure 2). Our findings are in agreement with other previous works, where the concentration and activity of enzymatic and non-enzymatic antioxidant systems increases with the Fe content of plants [3]. For instance, ascorbic acid rose by 150% and 80% in alfalfa and broccoli, respectively when the Fe concentration in the nutrient solution increased [3].
Phenolic compounds including mainly phenolic acids and flavonoids refer to an important group of secondary metabolites having great antioxidant activity and beneficial effects against chronic diseases, such as inflammation, diabetes and some types of cancer [29]. The HPLC-DAD analysis of the lettuce extracts provides a quantitative–qualitative evaluation of the phenolic compounds profile (Table 3). Across treatments, the most abundant compound was chicoric acid, followed by chlorogenic acid, while caffeoyl-meso-tartaric and caffeoyl-tartaric acid were detected in lower concentrations. Moreover, significant differences in the cultivars’ response to Fe solution enrichment were found for the target and total phenolic acids, as reflected by the C × I interaction (Table 3). Except for caffeoyl tartaric acid, the greatest accumulation of chlorogenic, chicoric, caffeoyl meso tartaric acids as well as total phenolic acids were observed in red Salanova leaves in comparison to green-pigmented lettuce, which is in agreement with the previous findings of Llorach et al. [28], Colonna et al. [34] and Kim et al. [29].
Concerning the Fe nutrient solution management, no significant effects on target and total phenolic acids were observed in green Salanova with the increasing Fe application rate. Contrarily to the green-pigmented butterhead lettuce, increasing the Fe concentration in the nutrient solution to 0.5 mM induced a significant increase in the chlorogenic acid and total phenolics contents of red-pigmented lettuce by 110.1% and 29.1%, respectively compared to the control treatment (0.015 mM); and a higher accumulation (+31.4%) of caffeoyl meso tartaric acid was also observed in red Salanova at 1.0 mM in comparison to the control treatment (Table 3). Contrarily to caffeoyl meso tartaric acid, the two main phenolic acids (chlorogenic and chicoric) decreased in response to increasing Fe concentration in the nutrient solution to 1.0 mM (Table 3). Since phenolic compounds are considered inhibitors of Fe bioavailability, their increase could be linked to Fe-excess stress [3]. The same type of correlation between the increased Fe (i.e., Fe-EDDHA) and phenolic concentrations has been demonstrated on several horticultural species such as broccoli, mung beans, grape berries and radish [3,67].
Anthocyanins, which constitute a subgroup of flavonoids responsible for red–purple pigmentation in different Lactuca sativa L. types [29], were expectedly detected only in red-pigmented Salanova (Figure 3), as previously demonstrated by Llorach et al. [28]. The application of 2.0 mM Fe in the nutrient solution elicited significant increase in the anthocyanin contents of plants compared to those treated with 0.015 and 1.0 mM Fe, whereas treatment with 0.5 mM exhibited intermediate values (Figure 3). Our results are in agreement with those of Mohammadi et al. [68] where anthocyanin concentration in peppermint increased by 11.5% with 0.5g L−1 Fe2O3 treatment in comparison to the control treatment (0 g L−1 Fe2O3). The non-linear dose response recorded in our experiment was in line with the findings of Shi et al. [69], who found that total anthocyanin concentration of Cabernet Sauvignon grapes under Fe deficient and excess treatments (0, 23, 92 and 184 µM Fe) were lower than that of the 42 µM Fe treated grapes. The improvement of anthocyanin synthesis at 42 µM Fe has been associated to several mechanisms including the accumulation of sugar and the expression of several structural genes in the flavonoid pathway. Considering the significant influence of the genetic material (red vs. green pigmented cultivar) and Fe application rate on phenolic acids and flavonoids (i.e., anthocyanins), mild to high (0.5–2.0 mM) Fe application in nutrient solution can be used as a cost effective tool to increase the phytochemicals content of hydroponically grown lettuce, especially for red-pigmented cultivars, although such practice is likely to precipitate anti-nutritive effects that may counteract Fe bioavailability in human subjects.

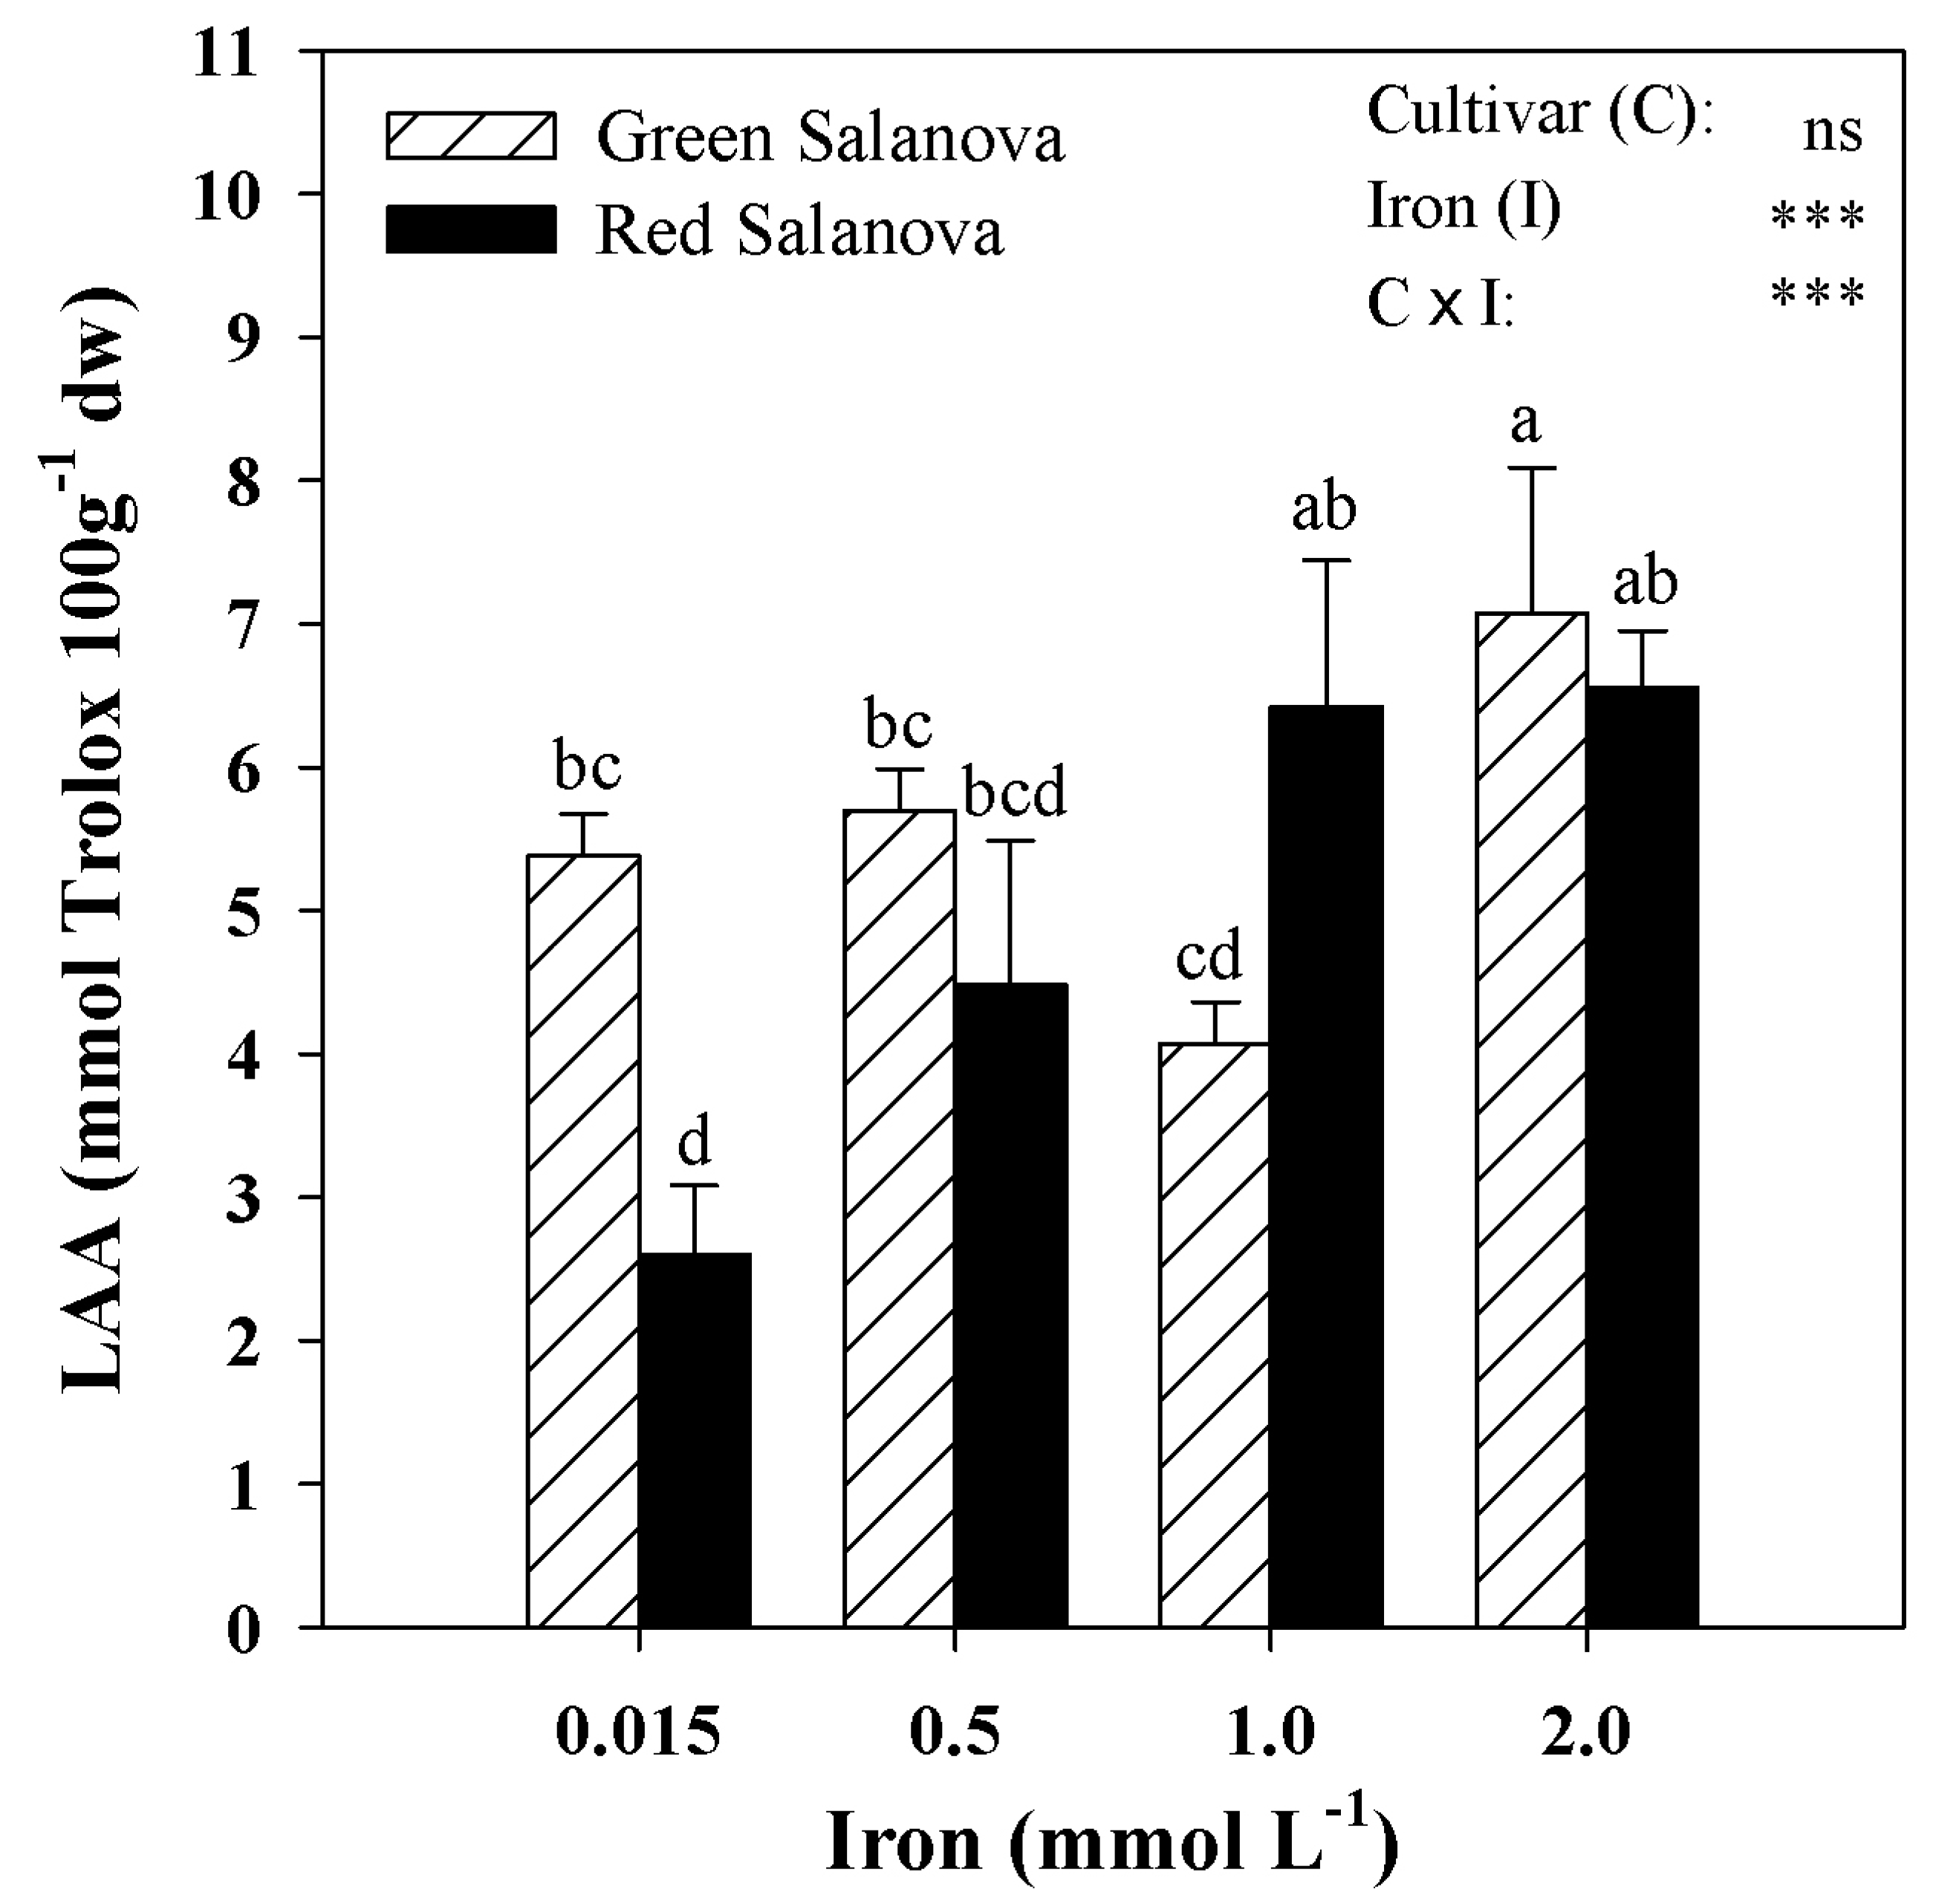
3.4. Lipophilic Antioxidant Activity and Target Carotenoids Profile

The LAA was significantly affected by C × I interaction. In the current experiment, the LAA ranged from 2.6 to 7.1 mmol Trolox 100 g−1 dw, with the highest values recorded in green lettuce at 2.0 mM and red lettuce treated with 1.0 and 2.0 mM Fe (Figure 4). The LAA derives mainly from lipophilic pigments which constitute an important quality trait in fresh vegetables, since these antioxidant molecules prevent the formation of free radicals in both plants and humans [70]. A putative mechanism involved in the accumulation of LAA under moderate to high Fe concentrations (1.0 and 2.0 mM) could be associated to the absorption of excess Fe by ferritin, preventing the formation of ROS and increasing plants antioxidant capacity [65].
Carotenoids, being lipid-soluble pigments, contribute to the yellow-orange color of fruits and vegetables and constitute important antioxidant components of lettuce [29]. In the current study, the carotenoid composition as a function of cultivars and Fe concentration in the nutrient solution are displayed in Table 4, where in red Salanova plants contained higher amounts of all the detected compounds compared to green Salanova, verifying that the content in lipophilic pigments of butterhead lettuce is readily reflected in leaf pigmentation.
The most abundant carotenoid compounds were violaxanthin + neoxanthin, and β-cryptoxanthin, followed by lutein, while β-carotene was detected in lower levels (Table 4). For lutein and β-cryptoxanthin no significant interaction between cultivar and Fe nutrient solution concentration was observed, whereas violaxanthin + neoxanthin and β-carotene were significantly affected by the interaction of these two factors (Table 4). Irrespective of the Fe concentration in the nutrient solution, the red Salanova had higher lutein and β-cryptoxanthin than those recorded in green Salanova plants by 135.9% and 151.3%, respectively (Table 4). Moreover, when averaged over both lettuce cultivars the highest lutein and β-cryptoxanthin concentrations were recorded at 2.0 mM and at both 1.0 and 2.0 mM Fe, respectively (Table 4). Similarly, to the Fe effects observed on target phenolic acids, limited and nonsignificant variation on violaxanthin + neoxanthin and β-carotene concentrations in response to increasing Fe concentration in the nutrient solution was observed in green Salanova. On the other hand, our results also demonstrated that the addition of 2.0 mM Fe to the nutrient solution elicited significant increase (39.2% and 30.8%) of violaxanthin + neoxanthin and β-carotene compared to the control treatment in red Salanova, whereas treatments with 0.5 and 1.0 mM exhibited intermediate values (Table 4). An explanation to the premium quality of red Salanova in terms of carotenoids could be associated with the activation of molecular and physiological mechanisms necessary for adaptation to suboptimal conditions (excess of Fe), such as the biosynthesis and accumulation of secondary metabolites, for instance, carotenoids [20]. These antioxidant compounds are known to contribute to ROS scavenging and cellular water homeostasis [71] and, more interestingly, these secondary metabolites are also important owing to their health-promoting effects.

4. Conclusions

Nowadays, consumers, scientists, nutritionists and vegetable growers are looking for functional foods with beneficial effects on human health and longevity. Our findings highlighted that biofortification of butterhead lettuce with an essential micronutrient such as Fe could be facilitated by closed soilless cultivation due to the constant exposure of root apparatus to the fortified nutrient solution. Our results indicate that fresh yield, shoot dry biomass, mineral composition (P and K) as well as hydrophilic (ascorbic acid, chlorogenic, chicoric, caffeoyl meso tartaric acids, total phenolics and anthocyanins) and lipophilic (violaxanthin + neoxanthin, lutein, β-cryptoxanthin and β-carotene) antioxidant molecules were strongly affected by genotype, with higher nutritional and functional quality traits recorded in the red-pigmented cultivar. Since product quality enhancement is sometimes associated with reduction of crop productivity, a compromise is needed to find the sectio divina. Our findings demonstrated the possibility of producing lettuce Fe-enriched by 21% while incurring an acceptable reduction in fresh marketable yield (13%) by supplying 1.0 mM Fe. The addition of Fe in the nutrient solution differentially modulated the functional quality in green and red pigmented lettuce. The application of 0.5 and 1.0 mM Fe in the nutrient solution improved target phenolic acids (chlorogenic and chicoric acids at 0.5 mM and caffeoyl tartaric acid at 1.0 mM Fe) as well as total phenolics (at 0.5 mM Fe), and the application of 2.0 mM Fe enhanced the carotenoids profile (violaxanthin + neoxanthin and β-carotene) of red Salanova, whereas no significant improvements in functional quality traits were observed in green Salanova. Overall, Fe biofortification facilitated by closed soilless cultivation could be used as an effective and sustainable tool for producing functional food, especially in urban farms triggered by the rising food demand and the malnutrition owing to unbalanced diets.

Author Contributions

Y.R. had the original idea, set up the experimental protocol, coordinated the research and was significantly involved in writing. C.E.-N. carried out the whole experiment and was actively involved in analysis and writing. M.G. and A.P. were involved in analysis and writing. S.R.S. was involved in ICP analysis and data interpretation. M.C.K. and S.D.P. contributed in improving the final version of the manuscript.

Funding

This research received no external funding.

Acknowledgments

We would like to acknowledge Società Agricola Punzi Eboli (Salerno) for providing the plant material (green and red Salanova). The authors are grateful for to Annamaria Palladino, Mirella Sorrentino, Antonio De Francesco for their technical assistance in the Fitotron Plant Growth Chamber experiment, as well as to Sabrina De Pascale, Paola Vitaglione and Antonio Dario Troise for providing the access to HPLC facilities and analysis.

Conflicts of Interest

The authors declare no conflict of interest

References

  1. Murgia, I.; Arosio, P.; Tarantino, D.; Soave, C. Biofortification for combating ‘hidden hunger’ for iron. Trends Plant Sci. 2012, 17. [Google Scholar] [CrossRef] [PubMed]
  2. White, P.J.; Broadley, M.R. Biofortification of crops with seven mineral elements often lacking in human diets–iron, zinc, copper, calcium, magnesium, selenium and iodine. New Phytol. 2009, 182, 49–84. [Google Scholar] [CrossRef] [PubMed]
  3. Przybysz, A.; Wrochna, M.; Małecka-Przybysz, M.; Gawrońska, H.; Gawroński, S.W. Vegetable sprouts enriched with iron: Effects on yield, ROS generation and antioxidative system. Sci. Hortic. 2016, 203, 110–117. [Google Scholar] [CrossRef]
  4. Sperotto, R.A.; Ricachenevsky, F.K.; de Abreu Waldow, V.; Palma Fett, J. Iron biofortification in rice: It’s a long way to the top. Plant Sci. 2012, 190, 24–39. [Google Scholar] [CrossRef] [PubMed]
  5. Abbaspour, N.; Hurrell, R.; Kelishadi, R. Review on iron and its importance for human health. J. Res. Med. Sci. 2014, 19, 164–174. [Google Scholar] [PubMed]
  6. FAO/WHO. Human Vitamin and Mineral Requirements; Report of a joint FAO/WHO expert consultation Bangkok, Thailand; FAO: Rome, Italy, 2001. [Google Scholar]
  7. Gowthami, V.S.S.; Ananda, N. Dry matter production, yield and yield components of groundnut (Arachis hypogaea L.) genotypes as influenced by zinc and iron through ferti-ortification. Indian J. Agric. Res. 2017, 51, 339–344. [Google Scholar] [CrossRef]
  8. Gillooly, M.; Bothwell, T.H.; Torrance, J.D.; MacPhail, A.P.; Derman, D.P.; Bezwoda, W.R.; Mills, W.; Charlton, R.W. The effects of organic acids, phytates and polyphenols on the absorption of iron from vegetables. Br. J. Nutr. 1983, 49, 331–342. [Google Scholar] [CrossRef] [PubMed]
  9. Siegenberg, D.; Baynes, R.D.; Bothwell, T.H.; Macfarlane, B.J.; Lamparelli, R.D.; Car, N.G.; MacPhail, P.; Schmidt, U.; Tal, A.; Mayet, F. Ascorbic acid prevents the dose-dependent inhibitory effects of polyphenols and phytates on nonheme-iron absorption. Am. J. Clin. Nutr. 1991, 53, 537–541. [Google Scholar] [CrossRef]
  10. Finkelstein, J.L.; Haas, J.D.; Mehta, S. Iron-biofortified staple food crops for improving iron status: A review of the current evidence. Curr. Opin. Biotechnol. 2017, 44, 138–145. [Google Scholar] [CrossRef]
  11. La Frano, M.R.; de Moura, F.F.; Boy, E.; Lönnerdal, B.; Burri, B.J. Bioavailability of iron, zinc, and provitamin A carotenoids in biofortified staple crops. Nutr. Rev. 2014, 72, 289–307. [Google Scholar] [CrossRef] [Green Version]
  12. Pereira, E.G.; Oliva, M.A.; Rosado-Souza, L.; Mendes, G.C.; Colares, D.S.; Stopato, C.H.; Almeida, A.M. Iron excess affects rice photosynthesis through stomatal and non-stomatal limitations. Plant Sci. 2013, 201–202, 81–92. [Google Scholar] [CrossRef] [PubMed]
  13. De Souza Pinto, S.; de Souza, A.E.; io Oliva, M.A.; Gusmão Pereira, E.G. Oxidative damage and photosynthetic impairment in tropical rice cultivars upon exposure to excess iron. Sci. Agric. 2016, 73, 217–226. [Google Scholar] [CrossRef] [Green Version]
  14. Frei, M.; Narh Tetteh, R.; Razafindrazaka, A.L.; Fuh, M.A.; Wu, L.B.; Becker, M. Responses of rice to chronic and acute iron toxicity: Genotypic differences and biofortification aspects. Plant Soil 2016, 408, 149–161. [Google Scholar] [CrossRef]
  15. Adamski, M.J.; Peters, J.A.; Danieloski, R.; Bacarin, M.A. Excess iron-induced changes in the photosynthetic characteristics of sweet potato. J. Plant Physiol. 2011, 168, 2056–2062. [Google Scholar] [CrossRef] [PubMed]
  16. Agarwal, S.; Sairam, R.K.; Meena, R.C.; Tyagi, A.; Srivastava, G.C. Effect of Excess and Deficient Levels of Iron and Copper on Oxidative Stress and Antioxidant Enzymes Activity in Wheat. J. Plant Sci. 2006, 1, 86–97. [Google Scholar] [CrossRef]
  17. Li, X.; Ma, H.; Jia, P.; Wang, J.; Jia, L.; Zhang, T.; Yang, Y.; Chen, H.; Wei, X. Responses of seedling growth and antioxidant activity to excess iron and copper in Triticum aestivum L. Ecotoxicol. Environ. Saf. 2012, 86, 47–53. [Google Scholar] [CrossRef] [PubMed]
  18. Hemalatha, K.; Venkatesan, S. Impact of iron toxicity on certain enzymes and biochemical parameters of tea. Asian J. Biochem. 2011, 6, 384–394. [Google Scholar] [CrossRef]
  19. Rouphael, Y.; Kyriacou, M.C.; Petropoulos, S.A.; De Pascale, S.; Colla, G. Improving vegetable quality in controlled environments. Sci. Hortic. 2018, 234, 275–289. [Google Scholar] [CrossRef]
  20. Rouphael, Y.; Kyriacou, M.C. Enhancing quality of fresh vegetables through salinity eustress and biofortification applications facilitated by soilless cultivation. Front. Plant Sci. 2018, 9, 1254. [Google Scholar] [CrossRef]
  21. Rouphael, Y.; Colla, G. Growth, yield, fruit quality and nutrient uptake of hydroponically cultivated zucchini squash as affected by irrigation systems and growing seasons. Sci. Hortic. 2005, 105, 177–195. [Google Scholar] [CrossRef]
  22. Rouphael, Y.; Rea, E.; Cardarelli, M.; Bitterlich, M.; Schwarz, D.; Colla, G. Can Adverse Effects of Acidity and Aluminum Toxicity Be Alleviated by Appropriate Rootstock Selection in Cucumber? Front. Plant Sci. 2016, 7. [Google Scholar] [CrossRef] [PubMed]
  23. Fallovo, C.; Rouphael, Y.; Rea, E.; Battistelli, A.; Colla, G. Nutrient solution concentration and growing season affect yield and quality of Lactuca sativa L. var. acephala in floating raft culture. J. Sci. Food Agric. 2009, 89, 1682–1689. [Google Scholar] [CrossRef]
  24. Rouphael, Y.; Colla, G.; Bernardo, L.; Kane, D.; Trevisan, M.; Lucini, L. Zinc Excess Triggered Polyamines Accumulation in Lettuce Root Metabolome, As Compared to Osmotic Stress under High Salinity. Front. Plant Sci. 2016. [Google Scholar] [CrossRef] [PubMed]
  25. Colla, G.; Rouphael, Y.; Cardarelli, M.; Svecova, E.; Rea, E.; Lucini, L. Effects of saline stress on mineral composition, phenolic acids and flavonoids in leaves of artichoke and cardoon genotypes grown in floating system. J. Sci. Food Agric. 2013, 93, 1119–1127. [Google Scholar] [CrossRef] [PubMed]
  26. Borgognone, D.; Rouphael, Y.; Cardarelli, M.; Lucini, L.; Colla, G. Changes in Biomass, Mineral Composition, and Quality of Cardoon in Response to NO3-:Cl- Ratio and Nitrate Deprivation from the Nutrient Solution. Front. Plant Sci. 2016, 7. [Google Scholar] [CrossRef]
  27. Fanasca, S.; Colla, G.; Maiani, G.; Venneria, E.; Rouphael, Y.; Azzini, E.; Saccardo, F. Changes in Antioxidant Content of Tomato Fruits in Response to Cultivar and Nutrient Solution Composition. J. Agric. Food Chem. 2006, 54, 4319–4325. [Google Scholar] [CrossRef] [PubMed]
  28. Llorach, R.; Martínez-Sánchez, A.; Tomás-Barbern, F.A.; Gil, M.I.; Ferreres, F. Characterisation of polyphenols and antioxidant properties of five lettuce varieties and escarole. Food Chem. 2008, 108, 1028–1038. [Google Scholar] [CrossRef]
  29. Kim, M.J.; Moon, Y.; Tou, J.C.; Mou, B.; Waterland, N.L. Nutritional value, bioactive compounds and health beneficts of lettuce (Lactuca sativa L.). J. Food Comp. Anal. 2016, 49, 19–34. [Google Scholar] [CrossRef]
  30. Kyracou, M.C.; El-Nakhel, C.; Graziani, G.; Pannico, A.; Soteriou, G.; Giordano, M.; Ritieni, A.; De Pascale, S.; Rouphael, Y. Functional quality in novel food sources: Genotypic variation in the nutritive and phytochemical composition of thirteen microgreens species. Food Chem. 2019, 277, 107–118. [Google Scholar] [CrossRef]
  31. Nicolle, C.; Carnat, A.; Fraisse, D.; Lamaison, J.L.; Rock, E.; Michel, H.; Amouroux, P.; Remesy, C. Characterisation and variation of antioxidant micronutrients in lettuce (Lactuca sativa folium). J. Sci. Food Agric. 2004, 84, 2061–2069. [Google Scholar] [CrossRef]
  32. Mou, B. Genetic variation of Beta-carotene and Lutein Contents in Lettuce. J. Am. Soc. Hort. Sci. 2005, 130, 870–876. [Google Scholar] [CrossRef]
  33. Lebeda, A.; Ryder, E.J.; Grube, R.; Dolezalov, A.I.; Kristkova, E. Lettuce (Asteraceae; Lactuca spp.). In Genetic Ressources, Chromosone Engineering, and Crop Improvement; Singh, R.K., Ed.; Vegetable Crops. CRC Press. Tailor and Francis Group: Boca Raton, FL, USA, 2007; Volume 3, pp. 377–472. [Google Scholar]
  34. Colonna, E.; Rouphael, Y.; Barbieri, G.; De Pascale, S. Nutritional quality of ten leafy vegetables harvested at two light intensities. Food Chem. 2016, 199, 702–710. [Google Scholar] [CrossRef] [PubMed]
  35. Rouphael, Y.; Cardarelli, M.; Bassal, A.; Leonardi, C.; Giuffrida, F.; Colla, G. Vegetable quality as affected by genetic, agronomic and environmental factors. J. Food Agric. Environ. 2012, 10, 680–688. [Google Scholar]
  36. Rouphael, Y.; Kyriacou, M.C.; Vitaglione, P.; Giordano, M.; Pannico, A.; Colantuono, A.; De Pascale, S. Genotypic variation in nutritional and antioxidant profile among iceberg lettuce cultivars. Acta Sci. Pol. Hortorum Cultus 2017, 16, 37–45. [Google Scholar] [CrossRef]
  37. Tyksinski, W.; Komosa, A. After effect of iron chelates on the yielding and iron content in greenhouse lettuce. Acta Sci. Pol. Hortorum Cultus 2008, 7, 3–10. [Google Scholar]
  38. Kozik, E.; Tyksiñski, W.; Bosiacki, M.A. Comparison of the efficiency of organic and mineral iron compounds in the greenhouse cultivation of lettuce. J. Elementol. 2011, 16, 59–68. [Google Scholar] [CrossRef]
  39. Inoue, K.; Kondo, S.; Adachi, A.; Yokota, H. Production of iron enriched vegetables: Effect of feeding time on the rate of increase in foliar iron content and foliar injury. J. Hortic. Sci. Biotechnol. 2000, 75, 209–213. [Google Scholar] [CrossRef]
  40. Tomasi, N.; Pinton, R.; Dalla Costa, L.; Cortella, G.; Terzano, R.; Mimmo, T.; Scampicchio, M.; Cesco, S. New ‘solutions’ for floating cultivation system of ready-to-eat salad: A review. Trends Food Sci. Technol. 2015, 46, 267–276. [Google Scholar] [CrossRef]
  41. Rouphael, Y.; Colla, G.; Giordano, M.; El-Nakhel, C.; Kyriacou, M.C.; De Pascale, S. Foliar applications of a legume-derived protein hydrolysate elicit dose-dependent increases of growth, leaf mineral composition, yield and fruit quality in two greenhouse tomato cultivars. Sci. Hortic. 2017, 226, 353–360. [Google Scholar] [CrossRef]
  42. Kampfenkel, K.; Van Montagu, M.; Inzé, D. Extraction and determination of ascorbate and 504 dehydroascorbate from plant tissue. Anal. Biochem. 1995, 225, 165–167. [Google Scholar] [CrossRef]
  43. Pellegrini, N.; Re, R.; Yang, M.; Rice-Evans, C. Screening of dietary carotenoids and carotenoid-rich fruit extracts for antioxidant activities applying 2,2′-azinobis(3-ethylenebenzothiazoline-6- sulfonic acid radical cation decolorization assay. Meth. Enzymol. 1999, 299, 379–384. [Google Scholar] [CrossRef]
  44. Vallverdú-Queralt, A.; Oms-Oliu, G.; Odriozola-Serrano, I.; Lamuela-Raventós, R.M.; Martín-Belloso, O.; Elez-Martínez, P. Metabolite profiling of phenolic and carotenoid contents in tomatoes after moderate-intensity pulsed electric field treatments. Food Chem. 2013, 136, 199–205. [Google Scholar] [CrossRef] [PubMed]
  45. Lebeda, A.; Doležalová, I.; Astley, D. Representation of wild Lactuca spp. (Asteraceae, Lactuceae) in world genebank collections. Genetic Res. Crop Evol. 2004, 51, 167–174. [Google Scholar] [CrossRef]
  46. Lebeda, A.; Doležalová, I.; Feráková, V.; Astley, D. Geographical distribution of wild Lactuca spp. (Asteraceae, Lactuceae). Botanic. Rev. 2004, 70, 328–356. [Google Scholar] [CrossRef]
  47. Lebeda, A.; Křístková, E.; Kitner, M.; Mieslerová, B.; Jemelková, M.; Pink, D.A.C. Wild Lactuca species, their genetic diversity, resistance to diseases and pests, and exploitation in lettuce breeding. Eur. J. Plant Pathol. 2014, 138, 597–640. [Google Scholar] [CrossRef]
  48. Urrestarazu, M.; Alvaro, J.E.; Moreno, S. Remediation of Iron Chlorosis by the Addition of Fe-o,o-EDDHA in the Nutrient Solution Applied to Soilless Culture. HortScience 2008, 43, 1434–1436. [Google Scholar] [CrossRef] [Green Version]
  49. Roosta, H.R.; Pourebrahimi, M.; Hamidpour, M. Effects of bicarbonate and different Fe sources on vegetative growth and physiological characteristics of bell pepper (Capsicum annuum L.) plants in hydroponic system. J. Plant Nutr. 2015, 38, 397–416. [Google Scholar] [CrossRef]
  50. Roosta, H.R.; Jalali, M.; Shahrbabaki, S.M.A.V. Effect of Nano Fe-Chelate, Fe-Eddha and FeSO4 on Vegetative Growth, Physiological Parameters and Some Nutrient Elements Concentrations of Four Varieties of Lettuce (Lactuca sativa L.) In NFT System. J. Plant Nutr. 2015, 38, 2176–2184. [Google Scholar] [CrossRef]
  51. Filho, A.B.C.; Cortez, J.W.M.; de Sordi, D.; Urrestarazu, M. Common Chicory Performance as Influenced by Iron Concentration in the Nutrient Solution. J. Plant Nutr. 2015, 38, 1489–1494. [Google Scholar] [CrossRef]
  52. De Dorlodot, S.; Lutts, S.; Pierre Bertin, P. Effects of Ferrous Iron Toxicity on the Growth and Mineral Composition of an Interspecific Rice. J. Plant Nutr. 2005, 28, 1–20. [Google Scholar] [CrossRef]
  53. Briat, J.F.; Dubos, C.; Gaymard, F. Iron nutrition, biomass production, and plant product quality. Trends Plant Sci. 2015, 20. [Google Scholar] [CrossRef] [PubMed]
  54. Nagajyoti, P.C.; Lee, K.D.; Sreekanth, T.V.M. Heavy metals: Occurrence and toxicity for plants: A review. Environ. Chem. Lett. 2010, 8, 199–216. [Google Scholar] [CrossRef]
  55. Kobayashi, T.; Nishizawa, N.K. Iron uptake translocation, and regulation in higher plants. Annu. Rev. Plant Biol. 2012, 63, 131–152. [Google Scholar] [CrossRef] [PubMed]
  56. Commission Regulation (EU) 1258/2011. Commission Regulation (EU) No 1258/2011 of 2 of December 2011 amending Regulation (EC) No 1881/2006 as Regardsmaximum Level for Nitrates in Foodstuffs; Official Journal of the European Union: Brussels, Belgum, 2011. [Google Scholar]
  57. Liu, W.; Yang, Q.; Du, L.; Cheng, R.; Zhou, W. Nutrient supplementation increased growth and nitrate concentration of lettuce cultivated hydroponically with biogas slurry. Acta Agric. Scand. Section B Soil Plant Sci. 2011, 61, 391–394. [Google Scholar] [CrossRef]
  58. Iacuzzo, F.; Gottardi, S.; Tomasi, N.; Savoia, E.; Tommasi, R.; Cortella, G.; Terzano, R.; Pinton, R.; Dalla Costa, L.; Cesco, S. Corn salad (Valerianella locusta (L.) Laterr.) growth in a water-saving floating system as affected by iron and sulfate availability. J. Sci. Food. Agric. 2011, 91, 344–354. [Google Scholar] [CrossRef]
  59. USDA. National Nutrient database for Standard Reference Release 28; USDA: Washington, DC, USA, 2015.
  60. Kawashima, L.M.; Soares, L.M.V. Mineral profile of raw and cooked leafy vegetables consumed in Southern Brazil. J. Food Compos. Anal. 2003, 16, 605–611. [Google Scholar] [CrossRef]
  61. Baslam, M.; Idoia, G.; Nieves, G. The arbuscular mycorrhizal symbiosis can overcome reductions inyield and nutritional quality in greenhouse-lettuces cultivated atinappropriate growing seasons. Sci. Hortic. 2013, 164, 145–154. [Google Scholar] [CrossRef]
  62. Snowden, R.E.D.; Wheeler, D. Chemical changes in selected wetland plant species with increasing Fe supply, with specific reference to root precipitates and Fe tolerance. New Phytol. 1995, 131, 503–520. [Google Scholar] [CrossRef]
  63. Lombi, E.K.L.; Tearall, J.R.; Horwath, J.R.; Zhao, F.J.; Hawkesford, M.J.; McGrath, S.P. Influence of iron status on cadmium and zinc uptake by different ecotypes of the hyperaccumulator Thlaspi caerulescens. Plant Physiol. 2002, 128, 1359–1367. [Google Scholar] [CrossRef]
  64. Souza-Santos, P.; Ramos, R.S.; Ferreira, S.T.; Carvalho-Alves, P.C. Iron-induced oxidative damage of corn root plasma membrane H+-ATPase. Biochem Biophys. Acta 2001, 1512, 357–366. [Google Scholar] [CrossRef]
  65. Li, K.; Hu, G.; Yu, S.; Tang, Q.; Liu, J. Effect of the iron biofortification on enzymes activities and antioxidant properties in germinated brown rice. J. Food Meas. Characteriz. 2018, 12, 789–799. [Google Scholar] [CrossRef]
  66. Smirnoff, N. Ascorbic acid metabolism and functions: A comparison of plants and mammals. Free Radic. Biol. Med. 2018, 122, 116–129. [Google Scholar] [CrossRef] [PubMed]
  67. Shi, P.; Song, C.; Chen, H.; Duan, B.; Zhang, Z.; Meng, J. Foliar applications of iron promote flavonoids accumulation in grape berry of Vitis vinifera cv. Merlot grown in the iron deficiency soil. Food Chem. 2018, 253, 164–170. [Google Scholar] [CrossRef] [PubMed]
  68. Mohammadi, M.; Hoseini, N.M.; Chaichi, M.R.; Alipour, H.; Dashtaki, M.; Safikhani, S. Influence of nano-iron oxide and zinc sulfate on physiological characteristics of peppermint. Comm. Soil Sci. Plant Anal. 2018, 49, 2315–2326. [Google Scholar] [CrossRef]
  69. Shi, P.; Li, B.; Chen, H.; Song, C.; Meng, J.; Zi, Z.; Zhang, Z. Iron supply affects anthocyanin content and related gene expression in berries of Vitis vinifera cv. Cabernet Sauvignon. Molecules 2017, 22, 283. [Google Scholar] [CrossRef] [PubMed]
  70. Khanam, U.K.S.; Oba, S.; Yanase, E.; Murakami, Y. Phenolic acids, flavonoids and total antioxidant capacity of selected leafy vegetables. J. Funct. Foods 2012, 4, 979–987. [Google Scholar] [CrossRef]
  71. Orsini, F.; Maggio, A.; Rouphael, Y.; De Pascale, S. “Physiological quality" of organically grown vegetables. Sci. Hortic. 2016, 208, 131–139. [Google Scholar] [CrossRef]
Figure 1. Effects of cultivar and iron concentration in the nutrient solution on Fe accumulation in lettuce leaves. Different letters indicate significant differences according to Tukey’s HSD test (P = 0.05). The values are means of three replicates. Vertical bars indicate ± standard deviation of means.
Agronomy 09 00290 g001
Figure 2. Effects of cultivar and Fe concentration in the nutrient solution on total ascorbic acid in lettuce leaves. Different letters indicate significant differences according to Tukey’s HSD test (P = 0.05). The values are means of three replicates. Vertical bars indicate ± standard deviation of means.
Agronomy 09 00290 g002
Figure 3. Effects of cultivar and iron concentration in the nutrient solution on anthocyanins content in red Salanova lettuce leaves. Anthocyanins in green Salanova were not detected. Different letters indicate significant differences according to Tukey’s HSD test (P = 0.05). The values are means of three replicates. Vertical bars indicate ± standard deviation of means.
Agronomy 09 00290 g003
Figure 4. Effects of cultivar and iron concentration in the nutrient solution lipophilic antioxidant activity (LAA) in lettuce leaves. Different letters indicate significant differences according to Tukey’s HSD test (P = 0.05). The values are means of three replicates. Vertical bars indicate ± standard deviation of means.
Agronomy 09 00290 g004
Table 1. Analysis of variance and mean comparisons for leaf area, leaf number, fresh yield, shoot dry biomass, leaf dry matter percentage and radiation use efficiency (RUE) for green and red Salanova butterhead lettuce grown under increasing Fe concentration in the nutrient solution.
Source of VarianceLeaf AreaLeaf NumberFresh BiomassDry BiomassDry MatterRUE
(cm2 Plant−1)(no. Plant−1)(g Plant−1)(g Plant−1)(%)(g mol−1)
Cultivar (C)
Green Salanova1070 ± 6445.94 ± 3.1160.73 ± 7.223.21 ± 0.195.32 ± 0.380.14 ± 0.01
Red Salanova1211 ± 7454.46 ± 2.3366.37 ± 7.853.76 ± 0.305.69 ± 0.310.17 ± 0.01
t-value0.0000.0000.0810.0000.0160.000
Iron (mM Fe) (I)
0.0151196 ± 125 a50.10 ± 5.1371.50 ± 4.70 a3.72 ± 0.49 a5.19 ± 0.39 c0.17 ± 0.02 a
0.51185 ± 63 a49.68 ± 4.2667.40 ± 2.67 a3.59 ± 0.21 ab5.32 ± 0.19 bc0.16 ± 0.01 ab
11091 ± 64 b48.66 ± 6.4861.85 ± 5.52 b3.43 ± 0.33 b5.55 ± 0.16 b0.15 ± 0.01 b
21090 ± 96 b52.36 ± 4.9853.44 ± 2.91 c3.19 ± 0.25 c5.96 ± 0.27 a0.14 ± 0.01 c
***ns************
C × I
Green Salanova × 0.015 mM Fe1089 ± 48 cde45.57 ± 0.8667.67 ± 1.353.29 ± 0.07 de4.86 ± 0.180.15 ± 0.00 cd
Green Salanova × 0.5 mM Fe1135 ± 33 bcd46.80 ± 3.4566.13 ± 0.903.41 ± 0.10 bcd5.16 ± 0.080.15 ± 0.00 bc
Green Salanova × 1 mM Fe1052 ± 72 de42.96 ± 2.3457.51 ± 4.273.15 ± 0.14 de5.49 ± 0.220.14 ± 0.01 cd
Green Salanova × 2 mM Fe1004 ± 18 e48.45 ± 3.3251.61 ± 3.022.97 ± 0.09 e5.77 ± 0.160.13 ± 0.00 d
Red Salanova × 0.015 mM Fe1302 ± 50 a54.62 ± 1.9075.34 ± 3.054.15 ± 0.22 a5.51 ± 0.190.19 ± 0.01 a
Red Salanova × 0.5 mM Fe1236 ± 31 ab52.57 ± 2.9268.66 ± 3.493.76 ± 0.12 b5.48 ± 0.100.17 ± 0.01 b
Red Salanova × 1 mM Fe1130 ± 25 bcd54.35 ± 1.4866.20 ± 1.163.72 ± 0.07 bc5.62 ± 0.070.17 ± 0.00 b
Red Salanova × 2 mM Fe1177± 23 bc56.28 ± 2.2655.26 ± 1.433.40 ± 0.11 cd6.16 ± 0.200.15 ± 0.01 bc
*nsns*ns*
ns,*, *** Nonsignificant or significant at P ≤ 0.05, and 0.001, respectively. Different letters within each column indicate significant differences according to Tukey’s HSD test (P = 0.05). Cultivars main effects were compared by Student’s t-test. All data are expressed as mean ± standard deviation, n = 3.
Table 2. Analysis of variance and mean comparisons leaf mineral composition in green and red Salanova butterhead lettuce grown under increasing Fe concentration in the nutrient solution.
Source of VarianceNitratePKCaMg
(mg kg−1 FW)(g kg−1 DW)(g kg−1 DW)(g kg−1 DW)(g kg−1 DW)
Cultivar (C)
Green Salanova2277 ± 2244.81 ± 0.2862.67 ± 2.396.47 ± 0.722.01 ± 0.16
Red Salanova2105 ± 935.17 ± 0.1669.01 ± 3.185.73 ± 1.052.06 ± 0.32
t-value0.0230.0010.0000.0560.615
Iron (mM Fe) (I)
0.0151991 ± 41 c4.84 ± 0.30 b67.32 ± 4.16 ab7.08 ± 0.41 a2.30 ± 0.18 a
0.52228 ± 115 b5.10 ± 0.29 ab68.57 ± 4.05 a6.50 ± 0.63 b2.14 ± 0.05 ab
12192 ± 136 b4.85 ± 0.28 b65.42 ± 3.65 b5.69 ± 0.59 c1.97 ± 0.16 b
22351 ± 226 a5.15 ± 0.19 a62.05 ± 2.65 c5.12 ± 0.76 c1.74 ± 0.13 c
**************
C × I
Green Salanova × 0.015 mM Fe1999 ± 27 c4.58 ± 0.0563.71 ± 1.887.01 ± 0.62 abc2.17 ± 0.18 ab
Green Salanova × 0.5 mM Fe2267 ± 163 b4.88 ± 0.1765.12 ± 1.727.05 ± 0.30 ab2.09± 0.01 bc
Green Salanova × 1 mM Fe2295 ± 109 b4.67 ± 0.3262.18 ± 0.546.03 ± 0.62 bcd1.93 ± 0.06 bcd
Green Salanova × 2 mM Fe2545 ± 110 a5.09 ± 0.2659.67 ± 0.335.79 ± 0.26 d1.84 ± 0.05 cd
Red Salanova × 0.015 mM Fe1983 ± 57 c5.10 ± 0.1670.93 ± 0.827.16 ± 0.17 a2.43 ± 0.05 a
Red Salanova × 0.5 mM Fe2190 ± 42 bc5.33 ± 0.1672.02 ± 1.505.95 ± 0.07 cd2.19 ± 0.02 ab
Red Salanova × 1 mM Fe2089 ± 50 bc5.03 ± 0.0668.66 ± 1.215.35 ± 0.38 d2.00 ± 0.23 bc
Red Salanova × 2 mM Fe2157 ± 53 bc5.21 ± 0.1264.43 ± 0.644.45 ± 0.20 e1.63 ± 0.07 d
**nsns**
ns,*,**, *** Nonsignificant or significant at P ≤ 0.05, 0.01 and 0.001, respectively. Different letters within each column indicate significant differences according to Tukey’s HSD test (P = 0.05). Cultivars main effects were compared by Student’s t-test. All data are expressed as mean ± standard deviation, n = 3.
Table 3. Analysis of variance and mean comparisons for target phenolic acids, total phenolic acids and anthocyanins in green and red Salanova butterhead lettuce grown under increasing Fe concentration in the nutrient solution.
Source of VarianceCaffeoyl Tartaric AcidChlorogenic AcidChicoric AcidCaffeoyl Meso Tartaric Acid∑ Phenolic Acids
(mg 100 g−1 DW)(mg 100 g−1 DW)(mg 100 g−1 DW)(mg 100 g−1 DW)(mg 100g−1 DW)
Cultivar (C)
Green Salanova15.92 ± 6.67.30 ± 2.472.62 ± 22.42.26 ± 1.498.1 ± 30
Red Salanova6.62 ± 3.258.74 ± 29.4114.89 ± 52.728.92 ± 7.8209.2 ± 75
t-value0.0000.0000.0180.0000.000
Iron (mM Fe) (I)
0.01510.81 ± 8.8 ab26.77 ± 18.8 b117.18 ± 31.3 a16.29 ± 13.1 a171.1 ± 55 a
0.58.81 ± 1.7 b48.90 ± 47.5 a106.7 ± 53.9 a 117.09 ± 16.5 a181.5 ± 114 a
18.79 ± 4.5 b13.04 ± 9.1 c45.47 ± 11.8 b19.16 ± 20.1 a86.5 ± 21 b
216.68 ± 8.5 a43.37105.66 ± 38.7 a9.81 ± 9.4 b175.5 ± 74 a
**************
C × I
Green Salanova × 0.015 mM Fe18.28 ± 4.99.66 ± 1.0 e89.92 ± 12.2 bcd4.39 ± 0.5 d122.3 ± 15 c
Green Salanova × 0.5 mM Fe10.00 ± 0.35.59 ± 0.5 e61.41 ± 25.2 cd2.11 ± 0.6 d79.1 ± 26 c
Green Salanova × 1 mM Fe12.65 ± 2.44.70 ± 0.8 e52.85 ± 9.5 d1.27 ± 0.1 d71.5 ± 13 c
Green Salanova × 2 mM Fe22.74 ± 8.19.25 ± 0.3 e86.32 ± 19.4 bcd1.25± 0.2 d119.6 ± 28 c
Red Salanova × 0.015 mM Fe3.33 ± 0.243.88 ± 2.0 c144.44 ± 8.5 ab28.19 ± 1.0 b219.8 ± 10 b
Red Salanova × 0.5 mM Fe7.61 ± 1.892.21 ± 3.5 a152.01 ± 21.5 a32.07 ± 1.9 ab283.9 ± 18 a
Red Salanova × 1 mM Fe4.93 ± 0.921.37 ± 0.3 d38.10 ± 9.8 d37.05 ± 6.9 a101.5 ± 18 c
Red Salanova × 2 mM Fe10.62 ± 2.677.48 ± 9.8 b125.00 ± 47.3 abc18.37 ± 1.9 c231.5 ± 59 b
ns***********
ns,*, **, *** Nonsignificant or significant at P ≤ 0.05, 0.01 and 0.001, respectively. Different letters within each column indicate significant differences according to Tukey’s HSD test (P = 0.05). Cultivars main effects were compared by Student’s t-test. All data are expressed as mean ± standard deviation, n = 3.
Table 4. Analysis of variance and mean comparisons for target carotenoids in green and red Salanova butterhead lettuce grown under increasing Fe concentration in the nutrient solution.
Source of VarianceViolaxanthin + NeoxanthinLuteinβ-Cryptoxanthinβ-Carotene
(μg Violaxanthin eq. g−1 DW)(μg g−1 DW)(μg g−1 DW)(μg g−1 DW)
Cultivar (C)
Green Salanova612.4 ± 52256.3 ± 39426.8 ± 61230.8 ± 27
Red Salanova1273.7 ± 170604.7 ± 651072.8 ± 87416.2 ± 48
t-value0.0000.0000.0000.000
Iron (mM Fe) (I)
0.015827.7 ± 267 c394.2 ± 188 b720.6 ± 332 bc290.7 ± 90 c
0.5901.6 ± 383 bc421.9 ± 217 b701.5 ± 360 c298.7 ± 106 c
1963.0 ± 361 b426.2 ± 161 b775.4 ± 352 a334.9 ± 84 b
21080.0 ± 453 a479.8 ± 213 a801.7 ± 393 a369.5 ± 129 a
*********
C × I
Green Salanova × 0.015 mM Fe587.7 ± 18 d228.5 ± 29425.2 ± 42208.8 ± 3 e
Green Salanova × 0.5 mM Fe552.4 ± 9 d226.0 ± 26380.4 ± 92203.0 ± 1 e
Green Salanova × 1 mM Fe635.3 ± 42 d283.5 ± 37458.2 ± 68259.4 ± 14 d
Green Salanova × 2 mM Fe674.0 ± 13 d287.3 ± 23443.5 ± 26251.8 ± 6 d
Red Salanova × 0.015 mM Fe1067.7 ± 73 c559.8 ± 751015.9 ± 110372.6 ± 10 c
Red Salanova × 0.5 mM Fe1250.8 ± 36 b617.8 ± 421022.7 ± 74394.4 ± 20 b
Red Salanova × 1 mM Fe1290.6 ± 42 b568.8 ± 461092.6 ± 57410.5 ± 22 b
Red Salanova × 2 mM Fe1485.9 ± 132 a672.3 ± 431159.8 ± 16487.2 ± 17 a
**nsns***
ns,*, **, *** Nonsignificant or significant at P ≤ 0.05, and 0.001, respectively. Different letters within each column indicate significant differences according to Tukey’s HSD test (P = 0.05). Cultivars main effects were compared by Student’s t-test. All data are expressed as mean ± standard deviation, n = 3.

