Pollution, Source, and Relationship of Trace Metal(loid)s in Soil-Wheat System in Hebei Plain, Northern China

1
Institute of Geological Survey, Hebei GEO University, Shijiazhuang 050031, Hebei, China
2
Department of Geological Science & Engineering, Kunsan National University, Jeonbuk 573-701, Korea
3
Department of Environmental Engineering, Kunsan National University, Jeonbuk 573-701, Korea
4
College of Resources, Hebei GEO University, Shijiazhuang 050031, Hebei, China
*
Author to whom correspondence should be addressed.
Agronomy 2019, 9(7), 391; https://0-doi-org.brum.beds.ac.uk/10.3390/agronomy9070391
Submission received: 10 June 2019
/
Revised: 12 July 2019
/
Accepted: 12 July 2019
/
Published: 17 July 2019
Abstract
:To study the complex migration and transformation of trace metal(loid)s in a soil–wheat system, 225 pairs of surface soil and wheat samples were collected from the Taihang Mountains front plain, Hebei Province, northern China. The concentrations and pools (F1, water-soluble; F2, exchangeable; F3, carbonate-bound; F4, humic acid-bound; F5, Fe–Mn oxide-bound; F6, organic matter-bound; and F7, residual) of Cu, Pb, Zn, Cr, Ni, Cd, and Hg, and the soil properties of the samples were analyzed. The sum of the F1, F2, F3, and F4 proportions of Cd was higher than that of the other trace metal(loid)s, implying that Cd has greater mobility. We found a significant correlation (p < 0.01) between pools of trace metal(loid)s and the corresponding elements in wheat and a significant correlation (p < 0.01) between pools of trace metal(loid)s and pH, cation exchange capacity, clay, and total organic carbon. The results of principle component analysis (PCA)indicated that Cr, Ni and As mainly come from natural sources and Cu, Pb, Zn, and Cd from mixed groups related to farming and industry, Hg come from the coal burning. In addition, the total target hazard quotients showed the presence of harmful levels of trace metal(loid)s in wheat.
1. Introduction
Industrial waste discharge, sewage irrigation, long-term application of chemical fertilizers and pesticides [1,2,3,4], and other human activities have all resulted in the build-up of trace metal(loid)s in exogenous soils, which has affected the environmental quality of agricultural soils [5,6,7,8]. Trace metal(loid)s in contaminated soils are absorbed by crops in various forms under certain physical and chemical environmental conditions, which can affect human health. Studies have found that trace metal(loid)s in soils exist in several forms: water-soluble, exchangeable, carbonate-bound, or humic acid-bound, which may more easily migrate and transform in their environments and, consequently, can be more readily absorbed by crop roots [9,10,11,12,13]. The migration rates and bioavailability of trace metal(loid)s are determined by their differing chemical pools of trace metal(loid)s in soils [14,15,16,17]. Soil physical and chemical conditions, farming practices, and soil fertility all affect the ability of crops to absorb trace metal elements from the soil. High salinity can promote trace metal migration through the complexation of salt ions and ion exchange between cations and metal ions, and the slightly alkaline environment may limit the migration of these trace metal(loid)s to some extent [18]. Organic matter and pH can promote the mobility of pools of trace metal(loid)s [19]. Studies have proven that clay content also impacts As pools [20]. The pH, heat (drying), and cation exchange capacities (CECs) are major factors affecting the pools of trace metal(loid)s [21,22,23]. Research on trace metals(loid)s and soil relationships has focused on experiments involving small pots in ideal conditions or small field trials [7,24,25,26]. The complex relationship between soil and crop trace metal(loid)s has not been explained well from a larger regional scale.
The Taihang Mountains front plain plays an important role in China’s grain production, particularly wheat, and subsequently, in the quality and safety of agricultural products; however, the area has persistently high levels of trace metal(loid)s [11,27,28,29]. The agricultural system in this area is complex, involving straw returning to the field each year’s after harvest as part of its fertilization practices [30,31,32]. To analyze the source of trace metal(loid)s in the soil–crop system, the multivariate statistical analysis method of PCA has been used to effectively establish the source in various fields [33,34,35]. PCA is as a multivariate statistical analysis method in which multiple variables are transformed linearly to select fewer important variables. Thus, the application of PCA can explain multiple variables with fewer variables and further eliminate the collinearity between variables [36,37,38,39,40].
We measured the trace metal(loid)s (As, Hg, Cr, Cd, Cu, Ni, Pb, and Zn) in wheat, surface soils, the physico-chemical indicators of soil, and major elements in the research area. The objectives of the study were to: (1) gain insight into the relationship of the pools of trace metal(loid)s and soil properties, and express the relationship with corresponding wheat; (2) analyze different sources of trace metal(Loid)s using PCA; (3) assess the pollution level of the soils’ trace metal(loid)s; and (4) evaluate the health risk of trace metal(loid)s in wheat using total target hazard quotients (TTHQs). Our findings provide a basis for the sustainable development of agriculture in this region and for the formulation of reasonable technical measures for controlling trace metal pollution in farmland soil.
2. Material and Methods
2.1. Sampling Sites and Research Fields
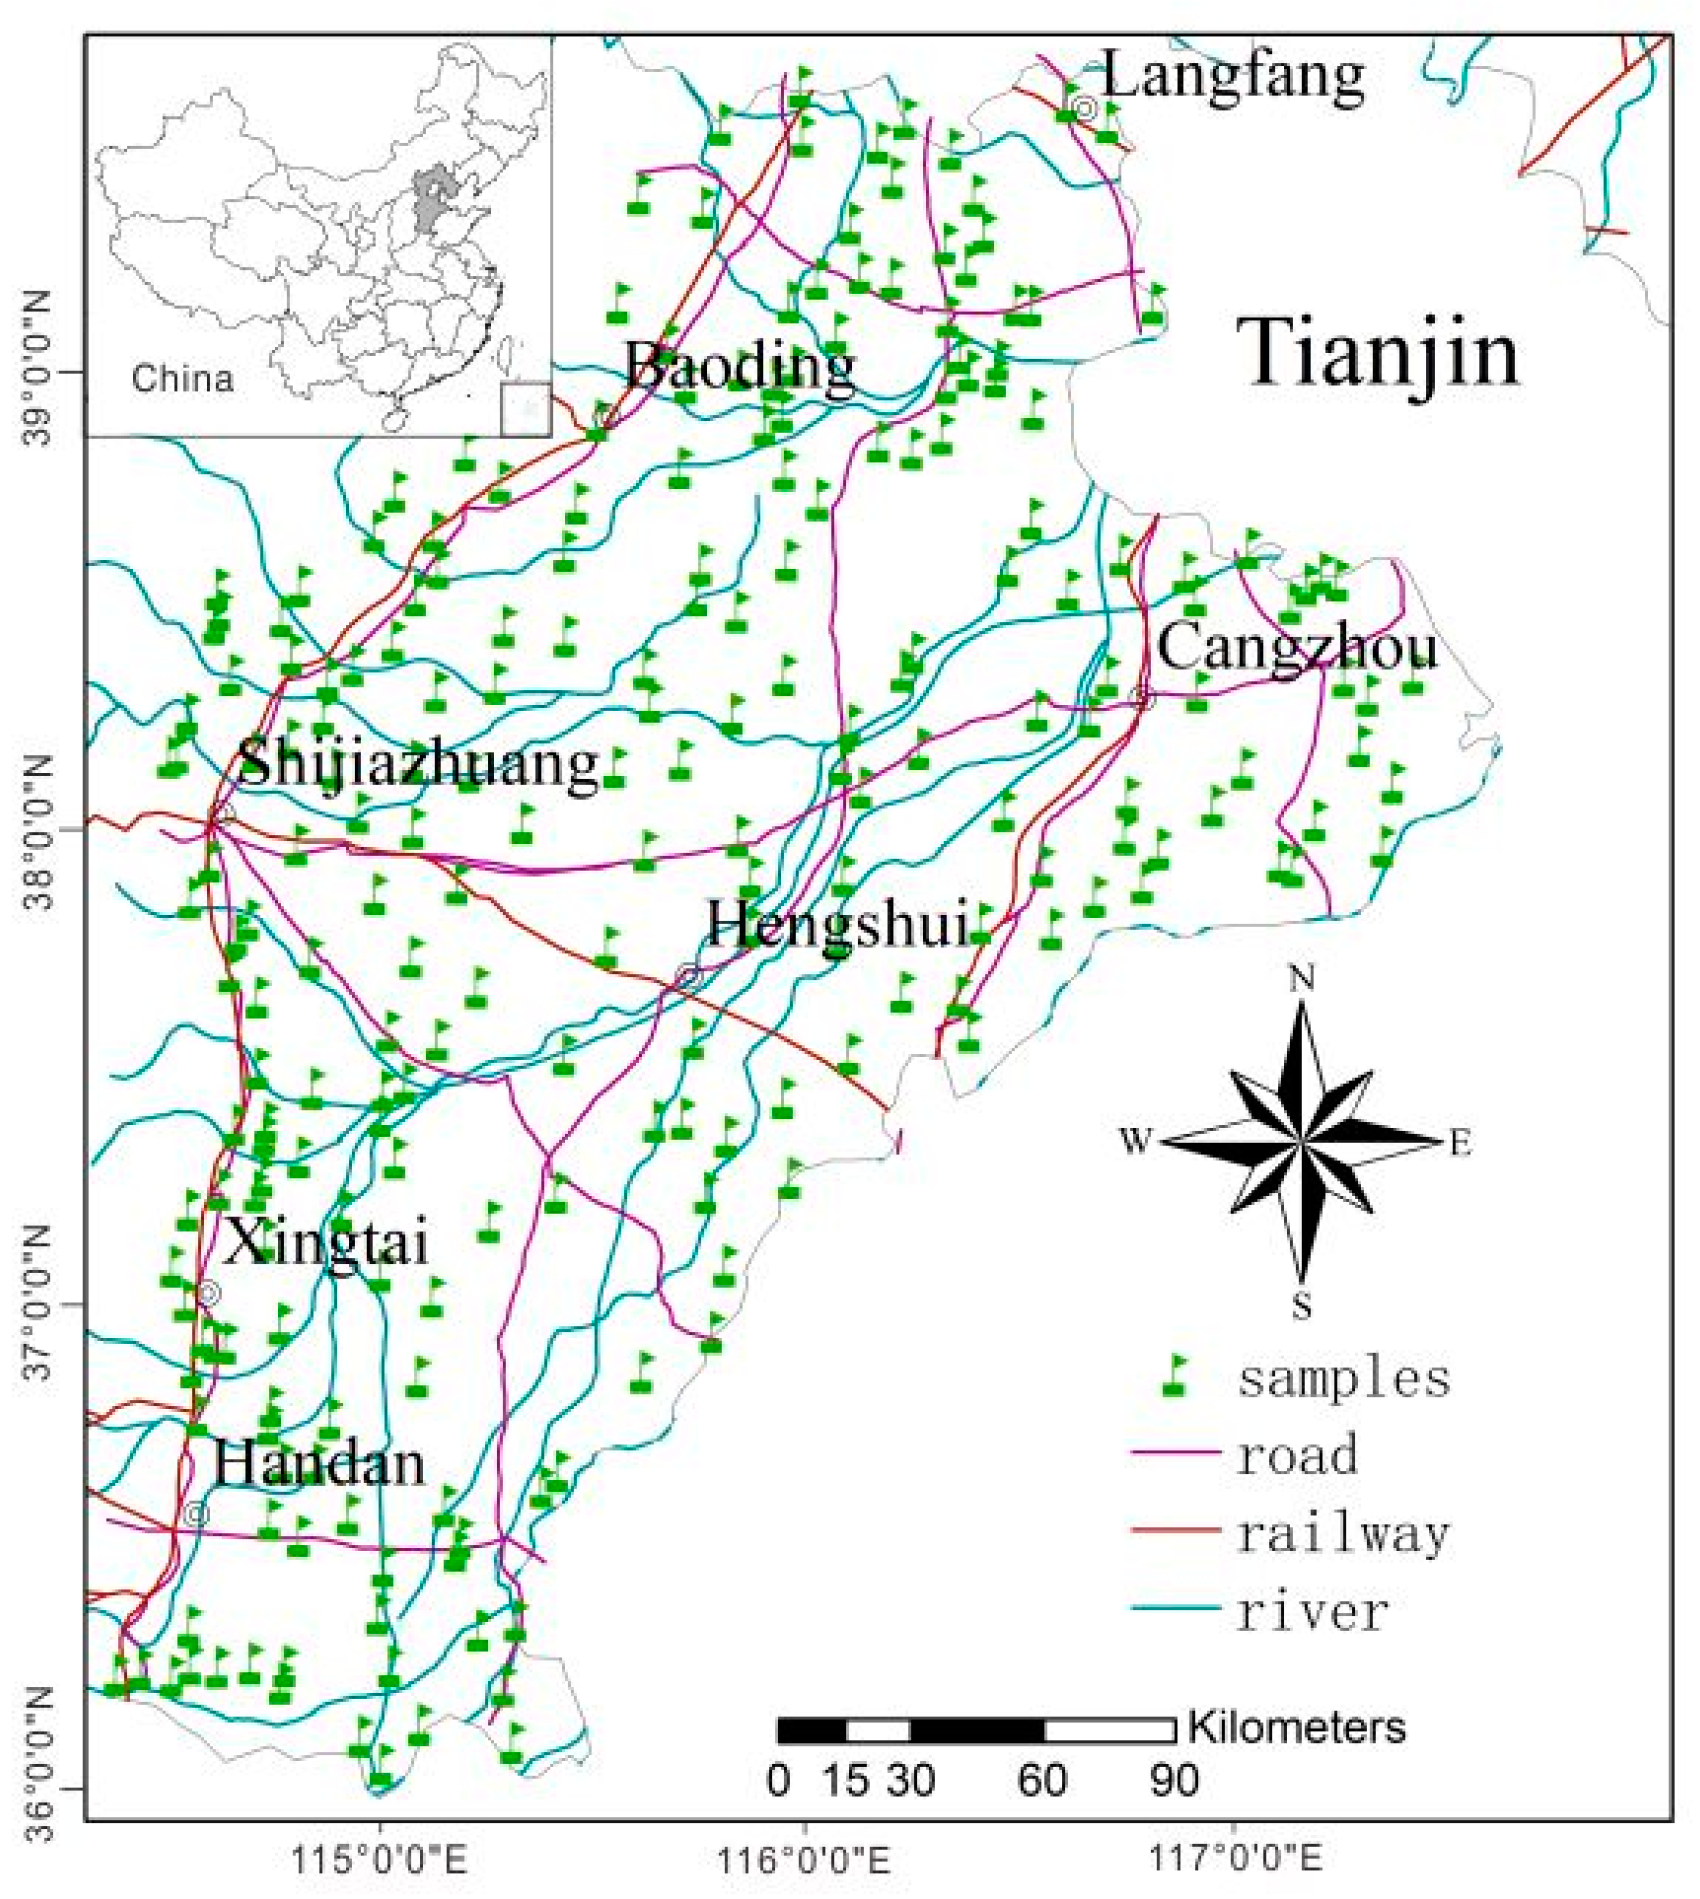
The Hebei plain is an important part of the North China Plain (Figure 1). It borders Henan and Shandong in the south, Beijing and Tianjin in the north, the Taihang Mountains in the west, and the Bohai Sea in the east. It includes South Langfang, the Baoding Plain, Hengshui, Zhangzhou, the Shijiazhuang Plain, and Xingtai. The total area of the plain is 62,047.29 km2. It was mainly formed by alluvial deposits from the Yellow River and the Haihe River. The terrain is low-lying and the elevation ranges from approximately 100 to 3 m along the coast of the Bohai Sea. There is a wide sediment plain area. The total population is 74.70 million in Hebei.
The area has a warm, temperate monsoon climate with obvious seasonal changes and cold, dry winters. The median temperature in this area is 12.6 °C, the median rainfall is 345.9–767.5 mm per year, and the average annual sunshine is 2400 to 3077 hours. The whole study area is a good region for agriculture with sufficient sunshine. The soil type is dominated by fluvio-aquic soil, cinnamon soil, and coastal saline soil. The main crops are corn and wheat. The wheat yield was 14.33 million tons and the corn yield was 17.54 million tons in 2017.
A total of 225 surface soil samples (within 20 cm of surface) and corresponding wheat samples were randomly collected from the same sampling points during the harvest season. The wheat samples were selected using the diagonal method with four points (greater than 1 m from the farmland). One point was used as the fixed point during sampling, 3–5 sub-samples were collected within 20 m around the fixed point, and these were combined into one sample to ensure the representativeness of the samples; the total sample weight of each sample was greater than 1.0–2.0 kg. Under normal experimental conditions, the gathered samples were reserved in polyethylene bags. The samples were ground with an agate mortar and passed through 200 mesh sieves prior to testing.
2.2. Chemical Analysis
Soil pH was measured in a soil suspension consisting of deionized water (1:2.5), which was based on the acidometer technique. Total organic carbon (TOC) was determined through the potassium dichromate volumetric method. The clay content was determined using a laser analyzer (Malvern Instruments Ltd, Melvin city, UK); the CEC was measured using the ammonium acetate method.
The soil samples were digested by a combination of HF, HNO3, and HClO4 to measure the trace elements. Cr, Cu, Ni, Pb, and Zn in the supernatant fluid were analyzed based on inductively coupled plasma atomic emission spectrometry (Agilent Technologies Inc., Santa Clara, CA, USA). Cd was analyzed with a graphite furnace atomic absorption spectrometer (Agilent Technologies Inc., Santa Clara, CA, USA) and As and Hg in the supernatant were calculated with hydride generation atomic fluorescence spectrometry (Beijing HaiGuang instrument co., LTD, Beijing, China).
The grain samples were ground through 20–40 mesh (0.84–0.42 mm) and the powered samples were then digested by a combination of HNO3 and HClO4, the proportion of which was 3:1 v/v, then the concentrations of trace metal(loid)s were determined using ICP-AES or AFS. More detailed analytical methods are available in the literature [41].
The chemical composition of the trace elements in the 225 representative surface soil samples were analyzed with the guidelines formulated by the Technical Standard of Geological Survey of the China Geological Survey (DD2005-03) in proper order [41]. The seven procedures were conducted step by step as follows: (1) water was used as an extractant to extract the F1 elements; (2) F2 elements were extracted with magnesium chloride (MgCl2) as an extractant; (3) F3 elements were extracted with sodium acetate as the extractant; (4) F4 elements were extracted with sodium pyrophosphate; (5) F5 elements were extracted with hydroxylamine hydrochloride; (6) organic-bound elements were extracted with hydrogen peroxide; and (7) F7 elements were extracted with hydrofluoric acid.
To verify whether the test statistic set was accurate, the total amount of every soil element was considered as a criterion and compared with the sum of each pool of trace metal(loid) to calculate the relative error (RE):
where C1 and C2 represent the total metal(loid)s and the sum of the pools of trace metal(loid)s, respectively.
RE = (C1 − C2)/C1 × 100
The relative error between the total amount of each element and pools was no more than 40% based on the Technical Standard of Geological Survey of the China Geological Survey [41]. According to the statistics, the relative error of each element was 100% of Cu (3.66%), Zn (6.73%), Ni (5.66%), Cd (7.12%), Cr (8.48%), Pb (9.01%), As (10.50%), and Hg (12.80%). The detection limit (µg/g) for F1, F2, F3, F4, F5, F6, and F7 is Pb: 0.1, 0.5, 0.5, 0.5, 0.5, 0.5, 2; Cd: 0.005, 0.02, 0.02, 0.02, 0.02, 0.02, 0.03; Cr: 0.1, 0.5, 0.5, 1.0, 0.5, 0.5, 5; Cu: 0.05, 0.3, 0.3, 0.3, 0.3, 0.3, 1; Ni: 0.05, 0.3, 0.3, 0.5, 0.3, 0.5, 2; Zn: 0.1, 0.5, 0.5, 0.5, 0.5, 0.5, 2; Hg: 0.001, 0.002, 0.002, 0.002, 0.002, 0.002, 0.005; As: 0.05, 0.1, 0.1, 0.1, 0.1, 0.1, 1, respectively.
The reference soil was GBW 07402 (GSS-2) (China National Center for Standard Materials). The wheat material with authentication used as an accuracy control was GBW08503b (wheat flour). In each batch of the analytical samples, 10% of the samples were repeated to ensure that all analyses were accurate. Internal standard materials and reagent blanks were also used to ensure analytical accuracy. The test data met the requirements of the China Geological Survey’s eco-geochemical survey standards and specifications [41].
2.3. Bio-Accumulative Rate (BR)
The bio-accumulative rate (BR) was applied to evaluate the ability of wheat to absorb and enrich trace elements in a soil–wheat system [5,20,27,29,31]. The BR formula is
where Cw represents the trace element concentrations in wheat and Cs represents the surface soil concentration corresponding to the wheat sites.
BR = Cw/Cs
2.4. Comprehensive Pollution Assessment
The environmental quality of the soil trace metal(loid)s was evaluated according to the published Chinese Soil Environmental Quality data [42]. The single pollution index method was used to analyze and evaluate the single index by item through the evaluation standard. This method is simple and easy to calculate, can determine the ratio relationship between the evaluation sample and the evaluation standard, and can judge the main pollution factors and pollution status in the evaluation area. The comprehensive pollution index considers the heaviest value of the single factors and avoids the impact of the subjective weight coefficient in the calculation process. This method has been successfully applied to assess heavy metal pollution [27,43,44,45]. According to the standards (GB15618-2018) on the soil contamination of agricultural land based on different pH, the soil risk standard value of trace elements are different at pH < 5.5, 5.5 < pH< 6.5, 6.5 < pH < 7.5, and pH > 7.5, respectively, so we selected the risk standard value according to the study area’s pH [42,43,45].
where Psingle is the single pollution index, Csample is the measured concentration of soil pollutants, and Cstandard is the standard value. If Psingle ≤ 1, it denotes no pollution; if 1 < Psingle ≤ 2, it denotes slight pollution; if 2 < Psingle ≤ 3, it denotes slight–moderate pollution; 3 < Psingle ≤ 5 denotes moderate pollution; and Psingle > 5 denotes heavy pollution.
where and represent the single pollution index and comprehensive pollution index for trace metal, respectively; represent the measured concentration and standard value, respectively; and is the maximum value of each single pollution index. The comprehensive pollution index was divided into five pollution classes as follows: Pcomprehensive ≤ 0.7, clean; 0.7 < Pcomprehensive ≤ 1, slightly clean (lowest safe level); 1 < Pcomprehensive ≤ 2, slight pollution; 2 < Pcomprehensive ≤ 3, moderate pollution; and Pcomprehensive > 3, heavy pollution.
2.5. Potential Health Risks
In terms of potential health total hazards by uptake wheat, the total target hazard quotient (TTHQ) is used to assess the health risk degree [46]. In this study, the health risk of wheat was assessed using the TTHQ method, which can simultaneously evaluate the health risk of a single trace metal(loid) and the health risk of the combined exposure to multiple trace metal(loid)s [47]. The TTHQ method, as an evaluation method of human health risk, was established by USEPA (United State Environmental Protection Administration, 2000), according to different populations and corresponding parameters. If the TTHQ value is less than 1, there is no potential health risk; if it is greater 1, then there is a health risk.
The target hazard quotient (THQ) and TTHQ of various trace metal(loid)s are as follows:
where EF refers to the exposure rate (365 days/year); ED refers to the exposed time (70 years for adults and six years for children); IR refers to the uptake rate of wheat (kg/person/day); C refers to the concentration of trace metal(loid)s in wheat (mg/kg); RfD refers to the referenced dose (Cd, Cu, Ni, Pb, Cr, Zn, As, and Hg were 0.001, 0.04, 0.02, 0.004, 1.5, 0.03, 0.003, and 0.0003 mg/kg/day, respectively) [46,47]; BW refers to the mean body weight (61.6 kg for adults and 18.7 kg for children) [30]; and AT refers to the mean exposed duration for non-carcinogenic influences (ED × 365 days/year). A THQ ≥ 1 indicates a latent health hazard.
2.6. Data Analysis
All distribution maps were drawn using Kriging methods by ArcGIS 10.5 (Esri, Redlands, CA, USA). The value of skewness and kurtosis were equal to or close to 0, indicating that the data approximately belonged to the normal distribution. [48,49,50]. According to the results of the statistical analysis of the data, some non-normality of the data of trace metal(loid)s were addressed to make them meet the normal distribution by logarithmic transformation. Then, normal distribution was tested by the P–P plot (Figure S1). The correlations between trace metal(loid)s and the soil physical and chemical properties were determined using SPSS 24 (IBM, Armonk, NY, USA). The descriptive statistic, box-plot, and PCA were calculated using SPSS 24. In addition, the distribution map was made using Surfer version 13.0 (Golden Software, LLC. Golden, CO, USA) based on the semivariogram optimal model (Table 1).
3. Results and Discussion
3.1. Pools of Trace Metal(loid)s and Total Amounts of Trace Elements
3.1.1. Trace Elements in the Soil
The soils’ pH values ranged from 7.43 to 9.05, with an average value of 8.3, whereas 76.62% were alkaline soils (ranging from 7.5 to 8.5) and 22.94% were strong alkaline soils (ranging from 8.5 to 9.5). The total organic carbon in the soils ranged from 0.31% to 2.67%, with an average value of 1.04%. The CECs in the soils ranged from 3.76 to 24.2 mg/kg and the clay in the soils ranged from 16.0 to 265.2 g/kg. (Table 2).
Table 1 shows that the mean values for Cu, Pb, Zn, Ni, Cr, As, Cd, and Hg were 25.72 ± 15.52, 24.75 ± 9.98, 74.97 ± 25.5, 28.78 ± 4.97, 67.57 ± 7.27, 9.87 ± 3.09, 0.19 ± 0.30, and 0.06 ± 0.04 mg/kg, respectively. The variable coefficient of trace elements in the soil samples in decreasing order were as follows: Cd (1.60) > Zn (0.74) > Hg (0.64) > Cu (0.50) > Pb (0.40) > As (0.31) > Ni (0.17%) > Cr (0.11).
The soil trace metal(loid)s in the research area were compared with the local background values [48] and the Chinese Soil Environment Environmental Quality Standard risk values [42]. The concentration of Cd was much greater than the local background; Cu, Pb, Zn, and Hg also exceeded the background values, suggesting that these trace elements were affected by an external factor. However, the mean concentration of As, Ni, and Cr were below the local background values. The coefficient of variation suggests that the contents of Cd, Zn, Hg, Cu, and Pb in the soils were largely variable, especially that of Cd. This shows that the five trace elements have been input in soils from outside origins. However, the As, Ni, and Cr in the soils were less variable, suggesting that these trace metal(loid)s mainly came from natural sources.
The results of the trace metal(loid)s in this study compared with other study areas is summarized in Table 3. The concentration of trace metal(loid)s in this study were greater than in Jilin Province, northeast China by comparison; however, the results were smaller than the southern agricultural soil, such as in Zhejiang Province and the Changjiang basin.
3.1.2. Pools of Trace Metal(loid)s Distribution
The pools of trace metal(loid)s present in soil and the proportions of various pools are the key factors that determine their effects on the environment and surrounding ecosystems. Some research results have shown that the heavy metals in F1, F2, F3, and F4 easily transfer in soil and are absorbed by plants, which cause the greatest harm to human beings and the environment [57,58,59,60]. The F5, F6, and F7 of trace metal(loid)s were relatively stable; F7 heavy metals from soil minerals, being stable, can be stable in sediments for a long time, are not easy for plants to absorb, and the potential damage to the whole soil ecosystem is minimal [35,60,61,62,63,64,65,66]. This is summarized in more detail below.
The F1 and F2 of trace metal(loid)s are the metal(loid)s adsorbed in clay, humus, and other components, which are sensitive to environmental changes, are easily transferred, and can be absorbed by plants [35,57].
The F3 of trace metal(loid)s refers to the coprecipitation binding by trace metal(loid)s in soil on carbonate minerals, which is most sensitive to soil environmental conditions, especially the pH value. When the pH value drops, it is easy for F3 to be re-released and enter the environment. In contrast, an increase in pH is conducive to the formation of carbonate [35,58,59].
F4 is important natural organic matter in the soil environment and has a special structure, meaning F4 can occur with metal ion adsorption, ion exchange, and surface ligand complex effects, such as the migration of trace metal(loid)s. Transformation and biological effectiveness play important roles in the soil environment [57,58,59,60].
The F5 Fe–Mn oxide bond to trace metal(loid)s is generally the outside substance on minerals and occurs as fine powder particles with an active Fe–Mn oxide ratio on the surface. F5 is formed by the adsorption or coprecipitation of anions. The changes in the pH value and redox conditions in soil also have an important influence on the binding of Fe–Mn oxides. Higher pH values and redox potentials are beneficial to the formation of Fe–Mn oxides. The Fe–Mn oxide binding reflects the pollution of human activities on the environment [35,60,61].
The F6 of trace metal(loid)s are the chelates of various organic substances such as plant and animal residues, humus, and mineral particles in the soil. Organic-bound heavy metals reflect the results of aquatic biological activities and human emissions of organics-rich sewage [35,61,62,63].
The F7 of trace metal(loid)s generally exists in silicate, primary and secondary minerals, and other soil lattice, and is the result of natural geological weathering processes (under normal natural conditions, it is not easily released, can be stable in the sediment for a long time, and is not easily absorbed by plants). The heavy metals associated with residues are mainly affected by mineral composition, rock weathering, and soil erosion [60,61,62,63].
The descriptive statistics of pools of trace metal(loid)s are summarized in Table S1, where the results of the variable coefficient (CV% > 1) of the F2 and F3 of Cd, F1, and F4 of Cu, and F4 of Pb and Zn showed a greater level of variation (deviation), and a greater pollution risk [47,48]. The percentage for each element, composed of WECH(the concentration’s sum of water-soluble, exchangeable, carbonate-bound and humic acid-bound) in the soil, in descending order, was as follows: Cd (52.15%) > Cu (24.95%) > Pb (21.02%) > As (16.14%) > Hg (15.85%) > Zn (11.65%) > Ni (5.68%) > Cr (3.68%). Cr (3.68%) and Ni (5.68%) had the lowest percentage of WECH, whereas the F7 of Cr (90.88%) and Ni (78.76%) had the highest percentage of WECH.
The F7 part usually implies a non-anthropogenic source because they are merged in a crystalline host lattice of the minerals [63]. Cr and Ni ions are, thus, mainly fixed by mineral lattices with strong stability and low levels of mobility.
Cd (52.15%) had the highest WECH; WECH values were 1.17%, 18.35, 17.79%, and 14.84%, respectively. These values were significantly higher than those of the other trace metal(loid)s, implying that Cd is potentially the most harmful to soil and plants, which further suggests that Cd may pose environmental risks. The effects of Cd pollution on animals, plants, and human health in alkaline soil should not be underestimated in the study area.
Cu and Pb had similar proportions of WECH, 24.95% and 21.02%, and residuals of 55.02% and 56.40%, respectively. The F4 of Pb and F4 of Cu were higher than the other trace metal(loid)s.
As, Hg, and Zn also had similar WECHs of 16.14%, 15.85%, and 11.65%, respectively; the F1 of As and Hg only accounted for 1.02% and 1.13%, respectively, less than the F1 of Cd. However, the amount of organic-matter-bound Hg was higher than that of other trace metal(loid)s due to the strong binding capacity of Hg ions to organics in soil [64].
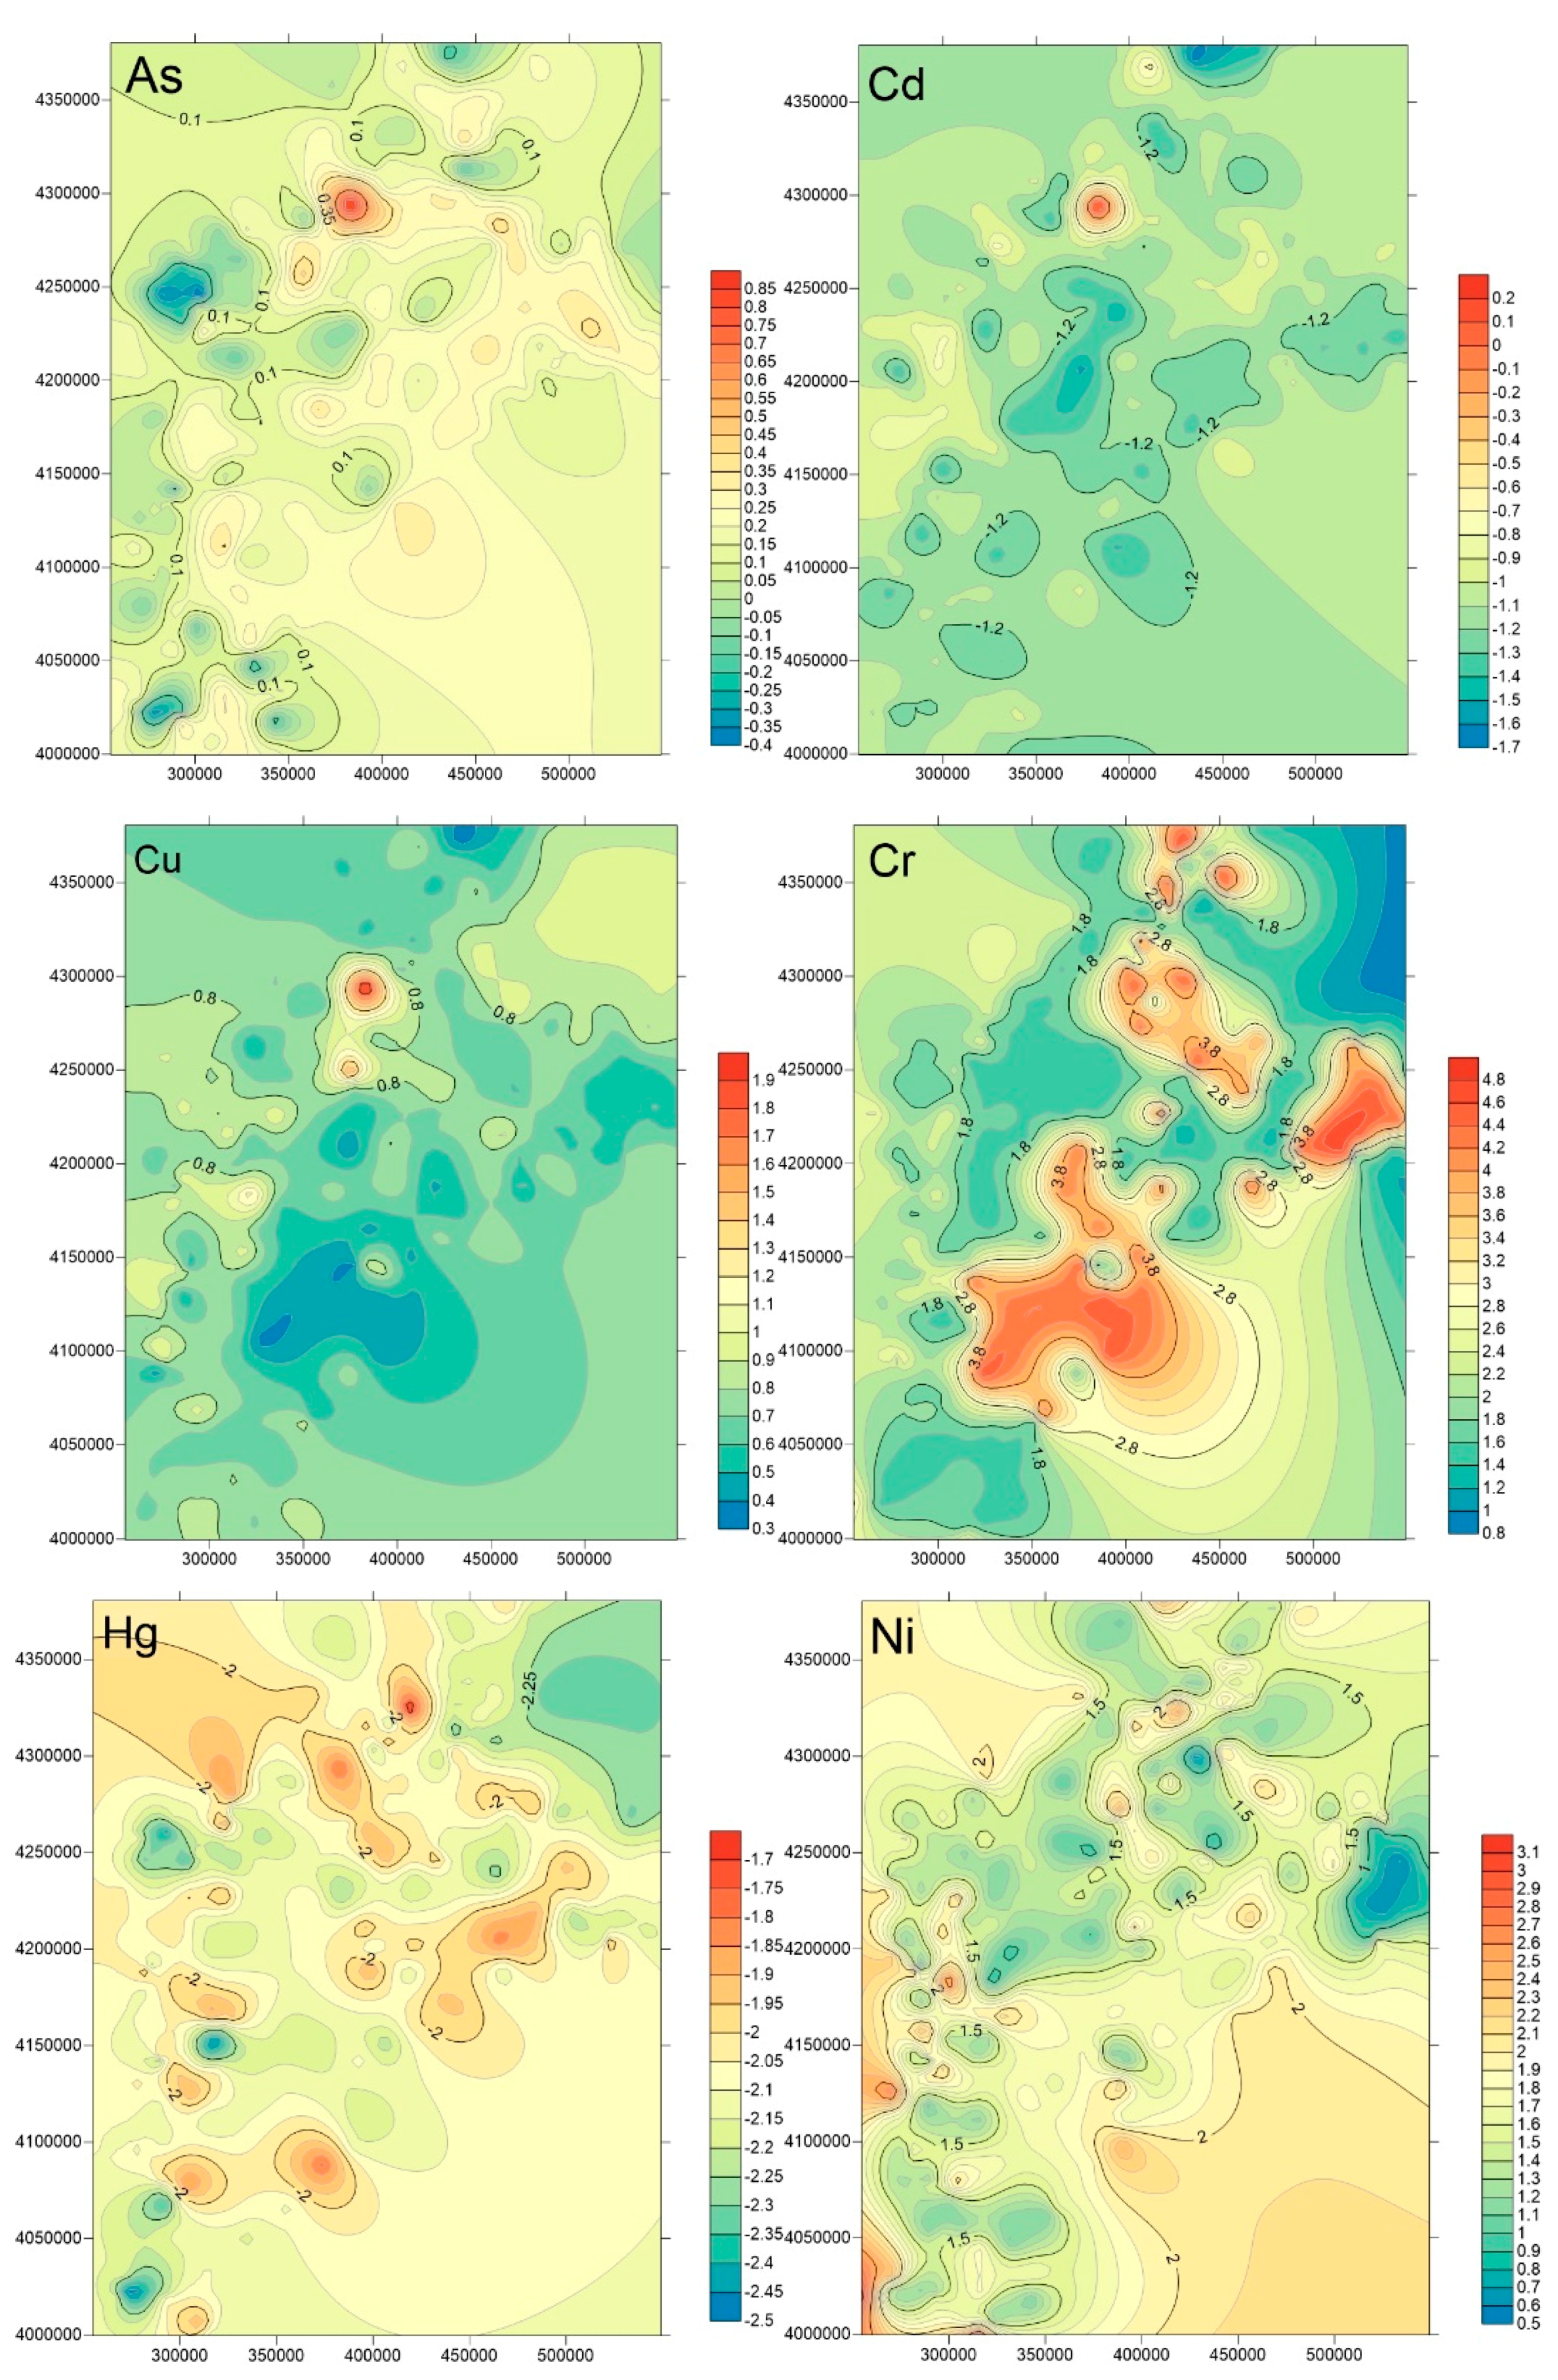
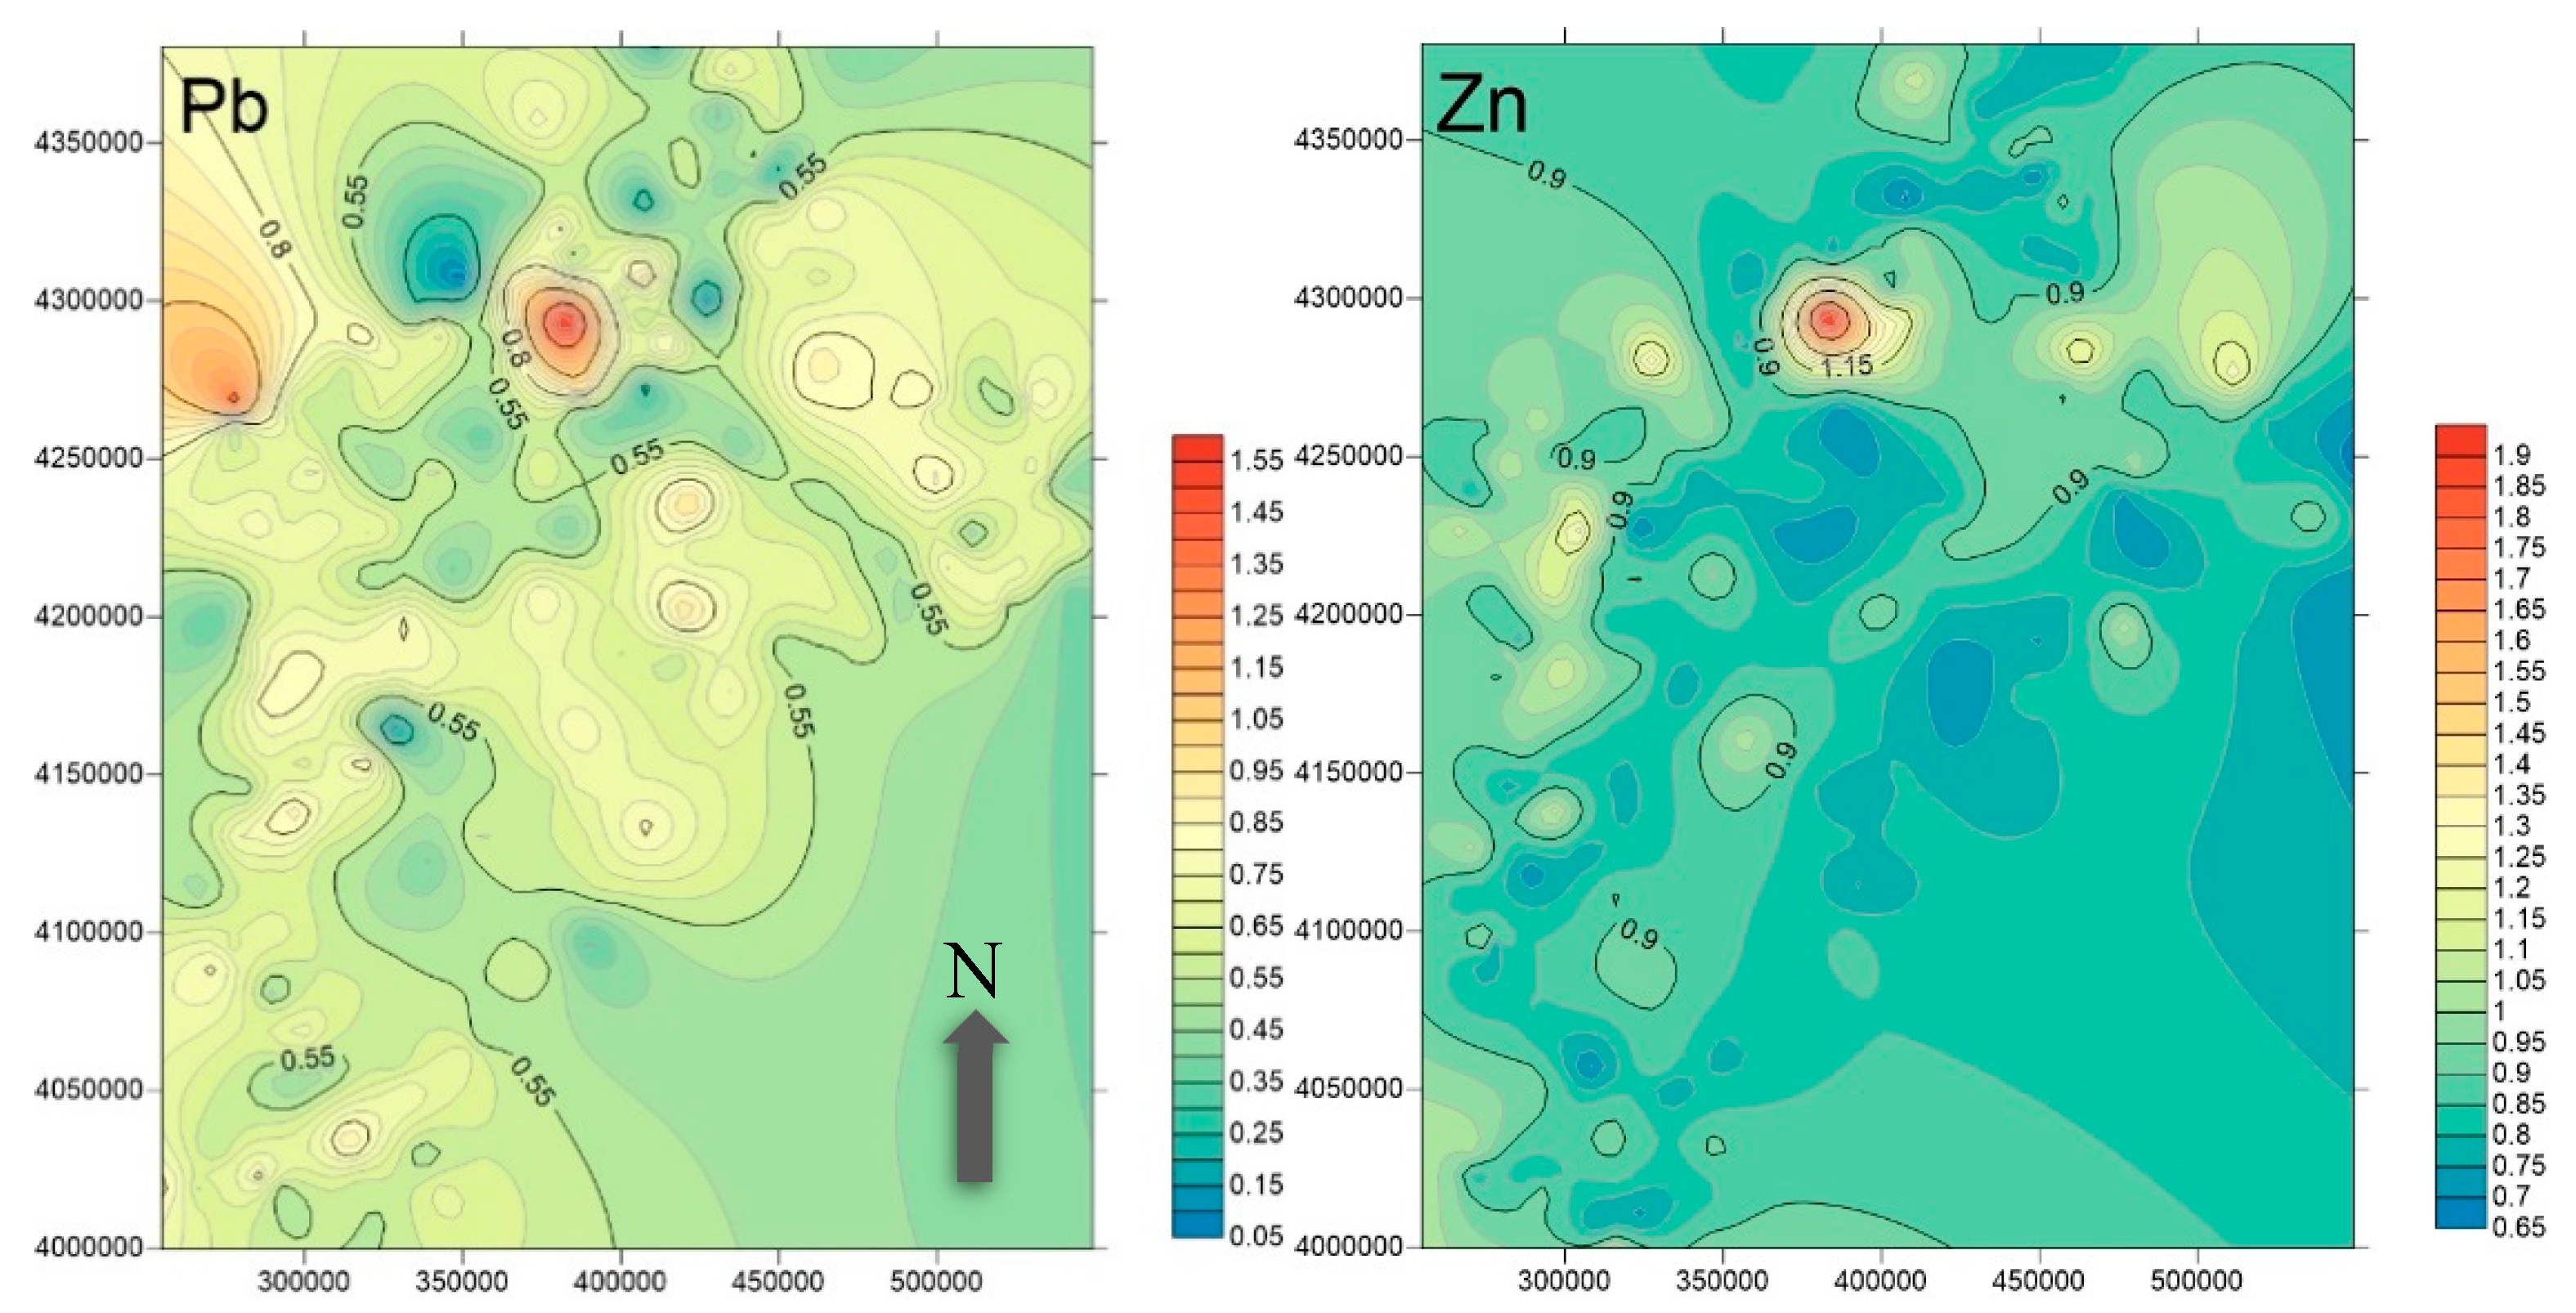
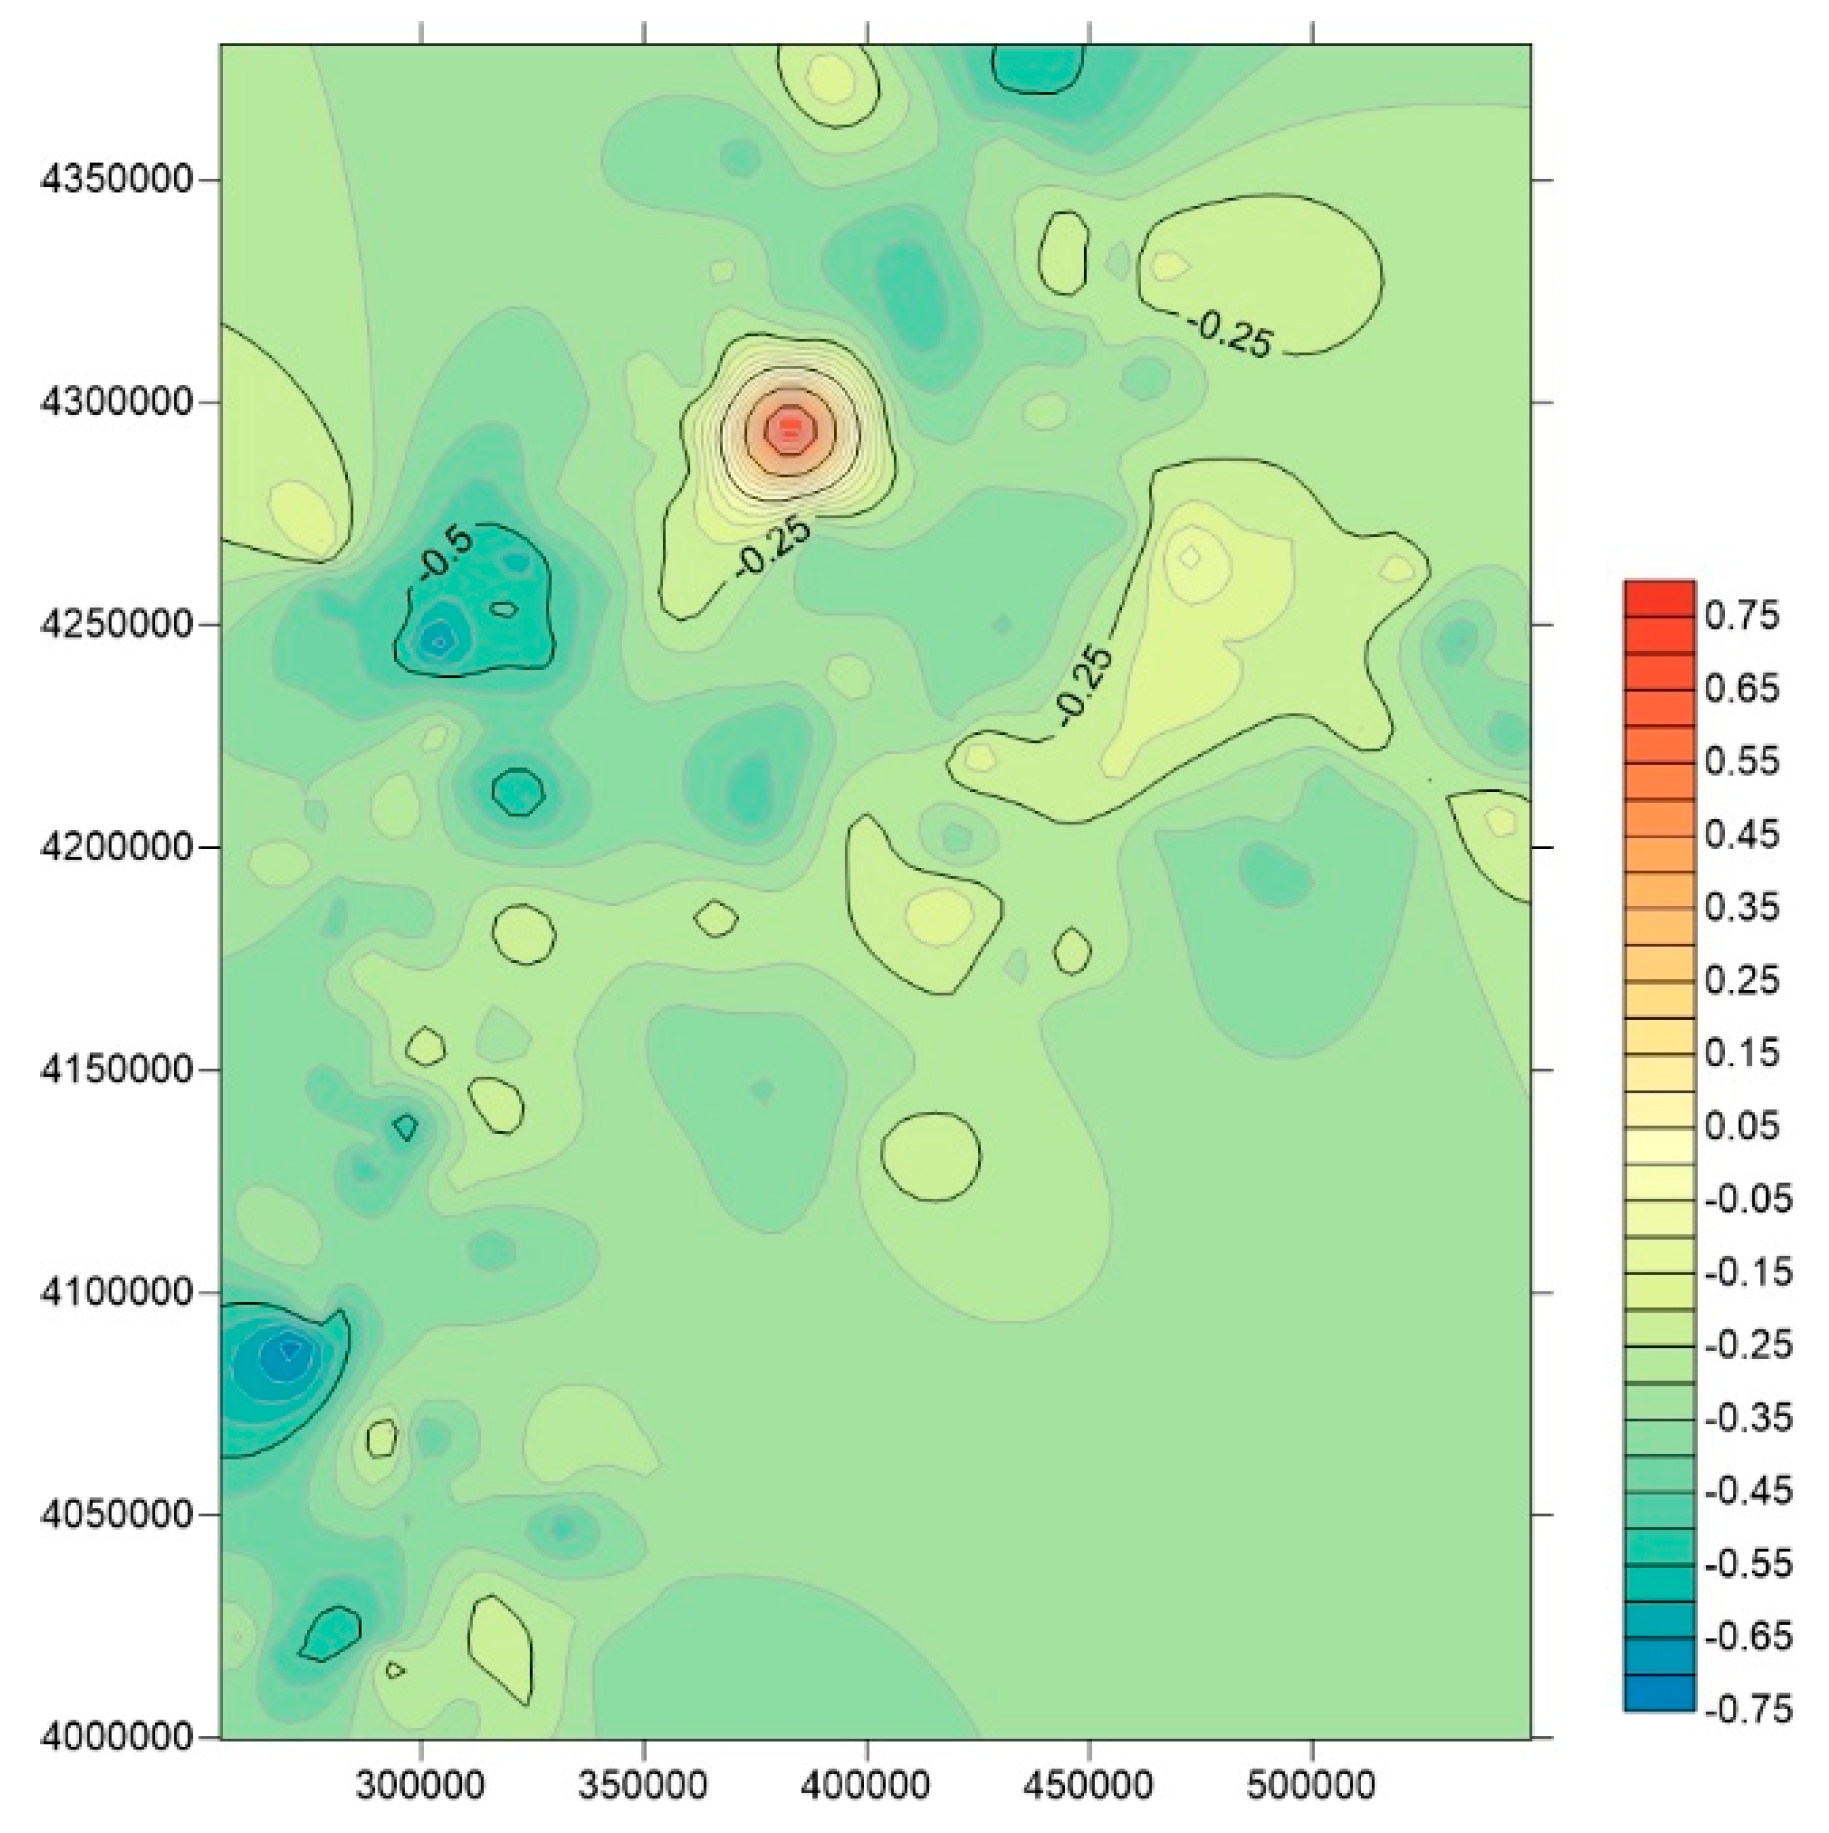
The WECH distribution of high-value areas of Cd, Zn, Cu, and Pb trace metal(loid)s through the mapping were mainly concentrated in the southeast of Baoding and the southern area of Shijiazhuang (Figure 2). Domestic scholars have confirmed that these are areas of trace metal pollution (including Cu, Pb, Zn, and Cd), caused mainly by toxic substances (dust and sewage) from lead–zinc ore smelters, paper mills, and chemical plants. Via atmospheric deposition and sewage, the metal(loid)s entered the soil and polluted the farmland to varying degrees [65,66]. The main input source of Cd trace elements in the North China Plain is organic fertilizers composed of livestock manure, and the main input source of Hg and As is phosphate fertilizers [31,67].
3.1.3. Trace Metal(loid)s in Wheat
Table 4 shows that the average values of Cu, Pb, Zn, Cr, Ni, Cd, As, and Hg were 4.64 ± 0.99, 0.06 ± 0.04, 31.98 ± 7.49, 0.03 ± 0.01, 0.10 ± 0.04, 0.03 ± 0.02, 0.03 ± 0.02, and 0.002 ± 0.002 mg/kg, respectively. The Hg, As, Pb, and Cd trace metal(loid)s were highly variable in wheat (0.85, 0.78, 0.60, and 0.51, respectively). Compared with the Chinese standard value for food safety [42]: three, three, and one samples of Pb, Cd, and Hg in wheat exceeded the limit value, respectively, whereas Pb, Cd, and Hg in the corresponding soil samples also exceeded the local background values, where these high values may be due to the presence of human activity.
With the comparison of the wheat soils of Huaibei area and Changshu, China, the mean values of trace metal(loid)s in the local areas was smaller than the concentration of As (0.035 mg/kg), Cu (6.16mg/kg) and Zn (34.2mg/kg) in the agricultural soil of Huaibei, China [28], and smaller than the concentration of Cd (0.074), Cu (5.65), Ni (0.39mg/kg), Pb (0.095mg/kg), and Zn (39.4mg/kg) in the agricultural soil of Changshu, Yangtze Delta, China [31].
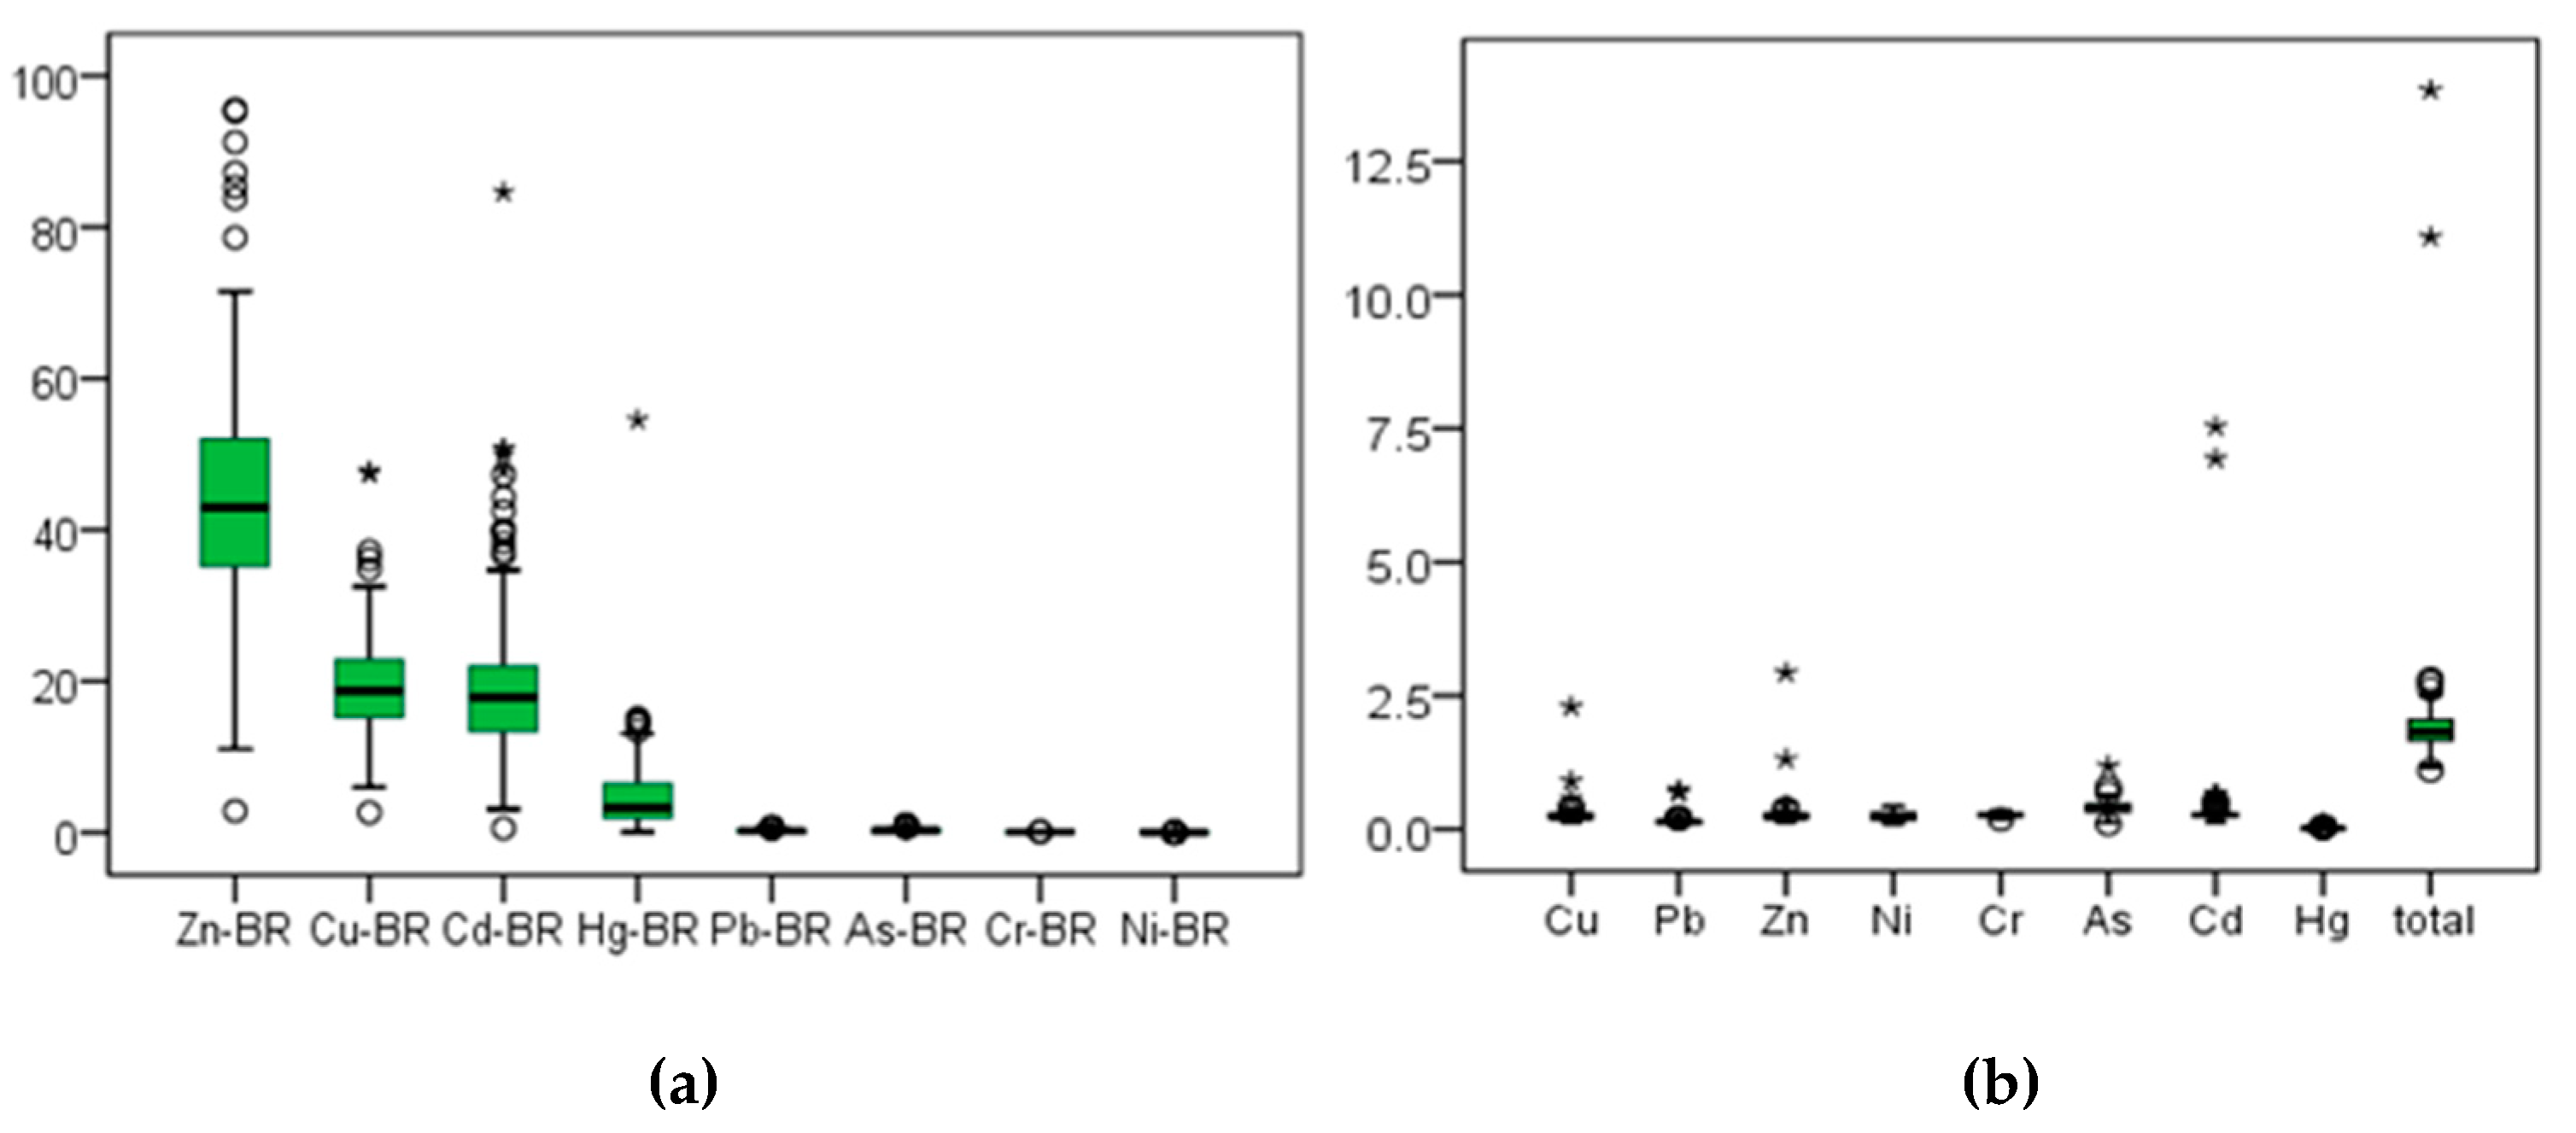
Figure 3a shows the BR of the trace metal(loid)s in the research area. The average BR values of the trace elements in wheat were: Zn (44.60%) > Cd (19.51%) > Cu (19.51%) > Hg (4.54%) > As (0.31%) > Pb (0.25%) > Cr (0.049%) > Ni (0.004%).
3.1.4. Relationship Among Pools of Trace Metal(loid)s in the Soil–Wheat System
The pools of trace metal(loid)s found in the soils of the research area and the trace metal(loid)s found in the wheat grains were significantly and positively correlated with each other, particularly for Cd, Cr, Pb, and As, as shown in Table 3. The correlation coefficients of the F2 and F4 of Cd levels were 0.320 and 0.300 at p < 0.01, respectively, which have a positive effect on the Cd content in wheat. F1, F3, and F4 of Cr had a significant relationship with Cr in wheat, where the correlation coefficients were −0.185, 0.248, and 0.301, at p < 0.01, respectively. The correlation coefficients of F1 and F4 of Pb in wheat were 0.188 and 0.350, at p < 0.01, respectively. In particular, the correlation coefficients of F1, F2, and F3 of As with Aswheat were 0.214, 0.180, and 0.214, at p < 0.01, respectively. These pools influenced the trace metal(loid)s in wheat. Other pools of trace metal(loid)s were not obviously related with the trace metal(loid)s in wheat and were not easily absorbed by crops, which agrees well with findings in other studies [24,35,68].
Table 5 shows that Cu, Pb, and Zn in the soil were significantly correlated with Cd and Pb in wheat, especially the correlation coefficients between Cu, Pb, and Zn in the soil and Pb in wheat, with a p < 0.01, were 0.216, 0.220, and 0.209. The correlation coefficients Cdwheat were 0.277, 0.173, and 0.197 at p < 0.01 with Cu, Pb, and Zn. Aswheat were 0.311, 0.366, and 0.305 at p < 0.01, with Cu, Pb, and Zn. These results indicated that Cu, Pb, and Zn in the soil could synergistically promote the absorption of Cd and Pb trace metal(loid)s in wheat. Some research has found that Cd2+ is easily absorbed by crops through the transport of divalent ions such as Fe2+, Ca2+, and Zn2+. On the other hand, the synergistic effect of Zn and Cd in the soil–crop system promotes the migration of Cd to the eatable sections of a plant. Zn and Cu, strong essentials for plant growth, show strong migration in soil–crop systems [69,70,71].
3.1.5. Factors Influencing Pools of Trace Elements
The total amount of trace elements in the soil and the physical and chemical properties directly affect the pools of trace metal(loid)s, which affect the accumulation of trace elements in wheat in the future [22,72]. Soil CEC (cation exchange capacity), clay, TOC (total organic carbon) and pools of trace metal(loid)s are significantly and positively correlated with each other, as shown in Table S2. The BR was significantly negatively correlated with CEC, clay, and TOC (Table S3), further indicating that increasing CEC, clay, and TOC is beneficial for the stability of pools of trace metal(loid)s, which do not easily migrate to wheat [20,38,66,73,74].
The relationship between pH and the pools of trace metal(loid)s is more complicated (Table S3), as pH has a stronger effect on the availability of As than on any other trace metal. pH had a significant positive correlation with the F1, F2, F3, and F4 of As and a negative correlation with F2, whereas the F4 of Ni was significantly and negatively correlated with the F2 of Pb and Zn, and was significantly and positively correlated with the F1 and F2 of Hg. However, pH had no obvious relationship with Cu.
The pH and BR of wheat trace metal(loid)s Cu, Cr, and Hg were positively correlated at 0.23, 0.20, and 0.18, respectively (p < 0.01), the result was also positive in the accumulation of trace elements of wheat in the research field. High pH had a positive effect on the soil–wheat system, which was different from the results of other studies [31,36]. This may be because different trace metal(loid)s have their own suitable pH [22,36,75]. The soil physical and chemical properties may play a significant role in controlling the migration of various fractions from the soil to crops.
3.2. Source of Trace Metal(loid)s
The correlation analysis among trace metal(loid)s is summarized in Table 6, indicating the different relationships among trace metal(loid)s. For example, some groups had higher correlation coefficients than 0.6 at p < 0.01: As–Ni, Zn–Cd, Cu–Pb-Zn, and Ni–Cr. Those trace metal(loid)s had very significant correlations with each other. This may be explained by the fact that they come from the same source. However, Hg was not significantly correlated with other elements.
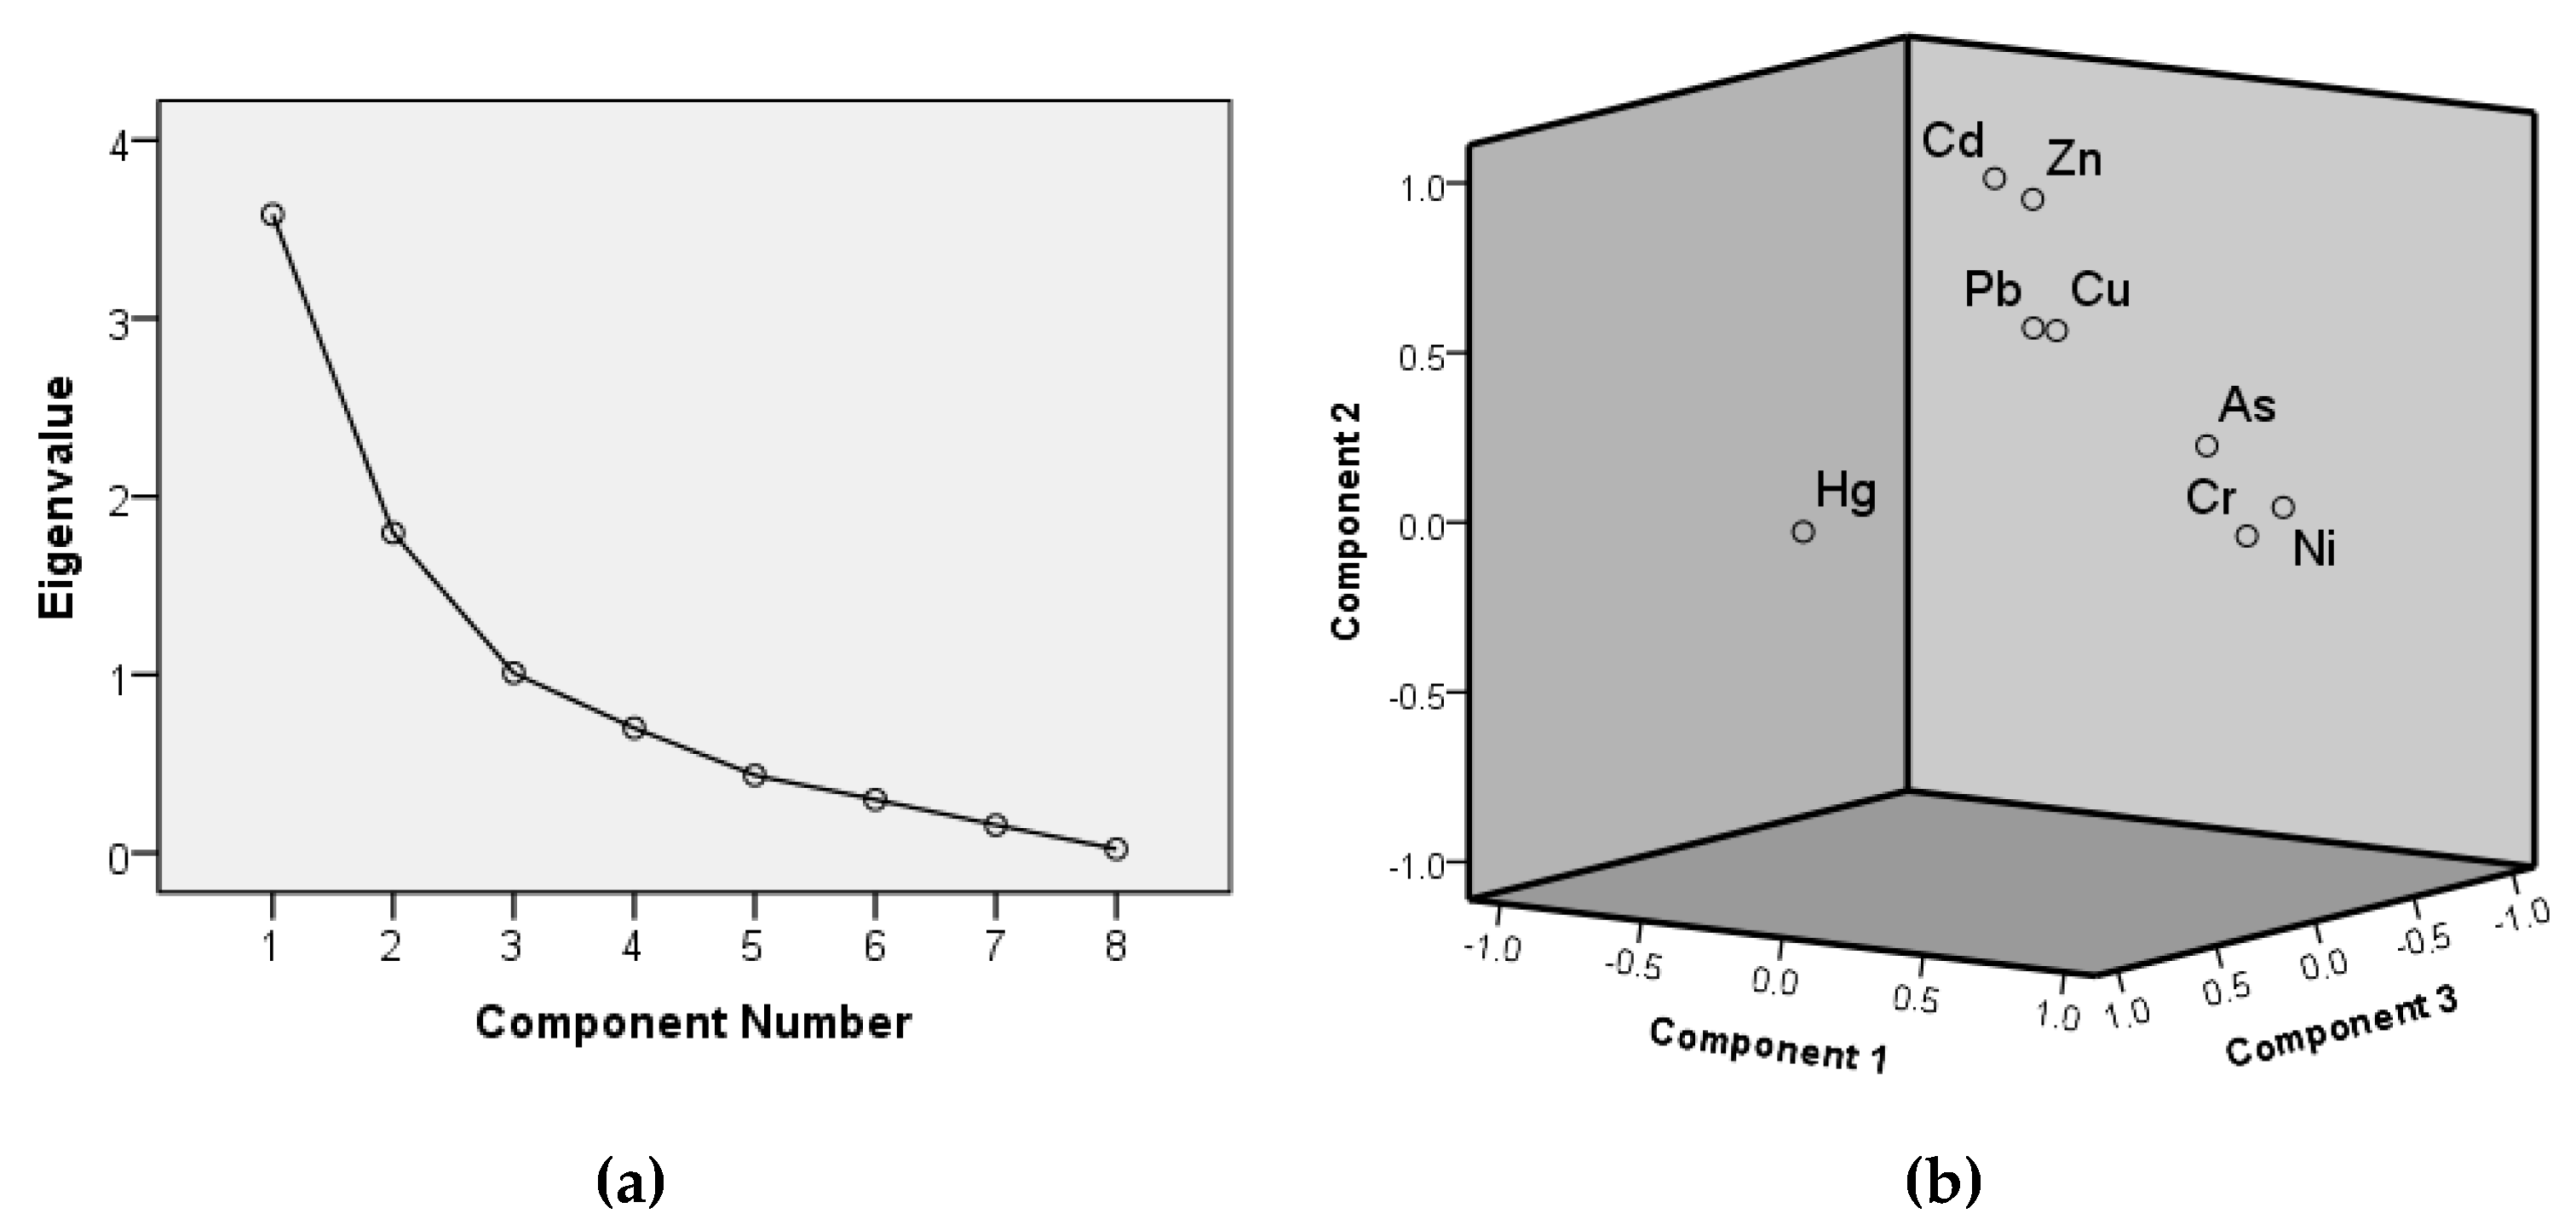
Then, the source of the trace metal(loid)s were determined using PCA. The fundamental rule of principle component analysis (PCA) is that the new variables generated by dimensional reduction can make the information represented by the original variables more concentrated and typical. The PCA successfully explained the source of trace metal(loid)s in some studies [2,33,34,35,40]; for more details on the PCA method refer to References [2,4,33]. The KMO (Kaiser–Meyer–Olkin) test value was 0.55 and the Bartlett’s sphericity test resulted in p < 0.001. Moreover, the extraction of the communalities of each element higher than 0.6 showed that PCA was suitable for the dataset in this study. The total cumulative was 79.853% for the three components extracted based on an eigenvalue > 1, and the constituent loadings were rotated with varimax, which is shown in Table 4. Ni, Cr, and As showed the most significant loadings (extracted loading > 0.6) in PCA1, and the cumulative was 32.813%; Cu, Pb, Zn, and Cd were significant in PCA2, a cumulative of 32.446% as well as Hg belonged to PCA3, with a cumulative 14.594% (Table 7). The scree plot and three component plots in the matrix are summarized in Figure 4. PCA1 was defined as a natural source group, according to the As, Cr, and Ni elements below or similar to the local background value [51]; it was indicated they were not affected by the farming process and other human factors. PCA2 was defined as the human mixed group with traffic, farming, and industry, explaining the relative use of nitrogen and phosphate fertilizers and straw in the studied area and traffic flow. According to Pb, Cu and Zn were reported to mainly come from traffic flow and industry [2,4,76,77,78]. Cd may be explained as being controlled by external factors, such as the use of industrial sewage as fertilizers and water sources leading to Cd input for farmland. To improve crop yield, farmers often use a large amount of fertilizers and organic fertilizers, which leads to excessive cadmium content in soil caused by the long-term accumulation of fertilizers not used by vegetation [79,80,81]. Meanwhile, PCA3 was defined as the coal burning group, due to the Hg element being reported coming from coal burning and cement production [82,83].
3.3. Pollution Levels and Potential Health Risks
Figure 3b shows that the average value for the single factor of each trace metal element in the soil of the study area from high to low was: As > Cd > Cr > Cu > Zn > Ni > Pb > Hg; each trace element was in the range of 0.02 to 0.40, all of which were below one, so there was no pollution of each trace metal in the soil environment. However, the maximum value of Cd (7.53), Cu (2.29), Zn (2.93), and As (1.18) exceeded one, especially that of Cd. Overall, the mean value of the comprehensive pollution index of the soil reached 0.52, which showed that the soil in the research region was safe. However, the high level of trace metal(loid) pollution in the soil directly led to an increase in the trace metal content of the crops, which will impact human health [29,30]. However, the Cd concentration in 3% of the samples local in Baoding (>0.7) exceeded the safety limits. The corresponding samples in wheat exceeded the standard limit, which will require further investigation (Figure 5).
According to the 2018 Statistical Yearbook of Hebei Province, the annual urban and rural population consumption of wheat per person in Hebei Province in 2017 was 72.76 kg and 90.71 kg respectively, which is 199.34 g or 248.55 g per day. The daily consumption of wheat by urban children and rural children was assumed to be approximately one-third that of urban and rural adults [56], which were 66.45 g and 82.85 g, respectively. Table 8 indicates the calculated health risk index for adults and children from the rural and urban regions, respectively.
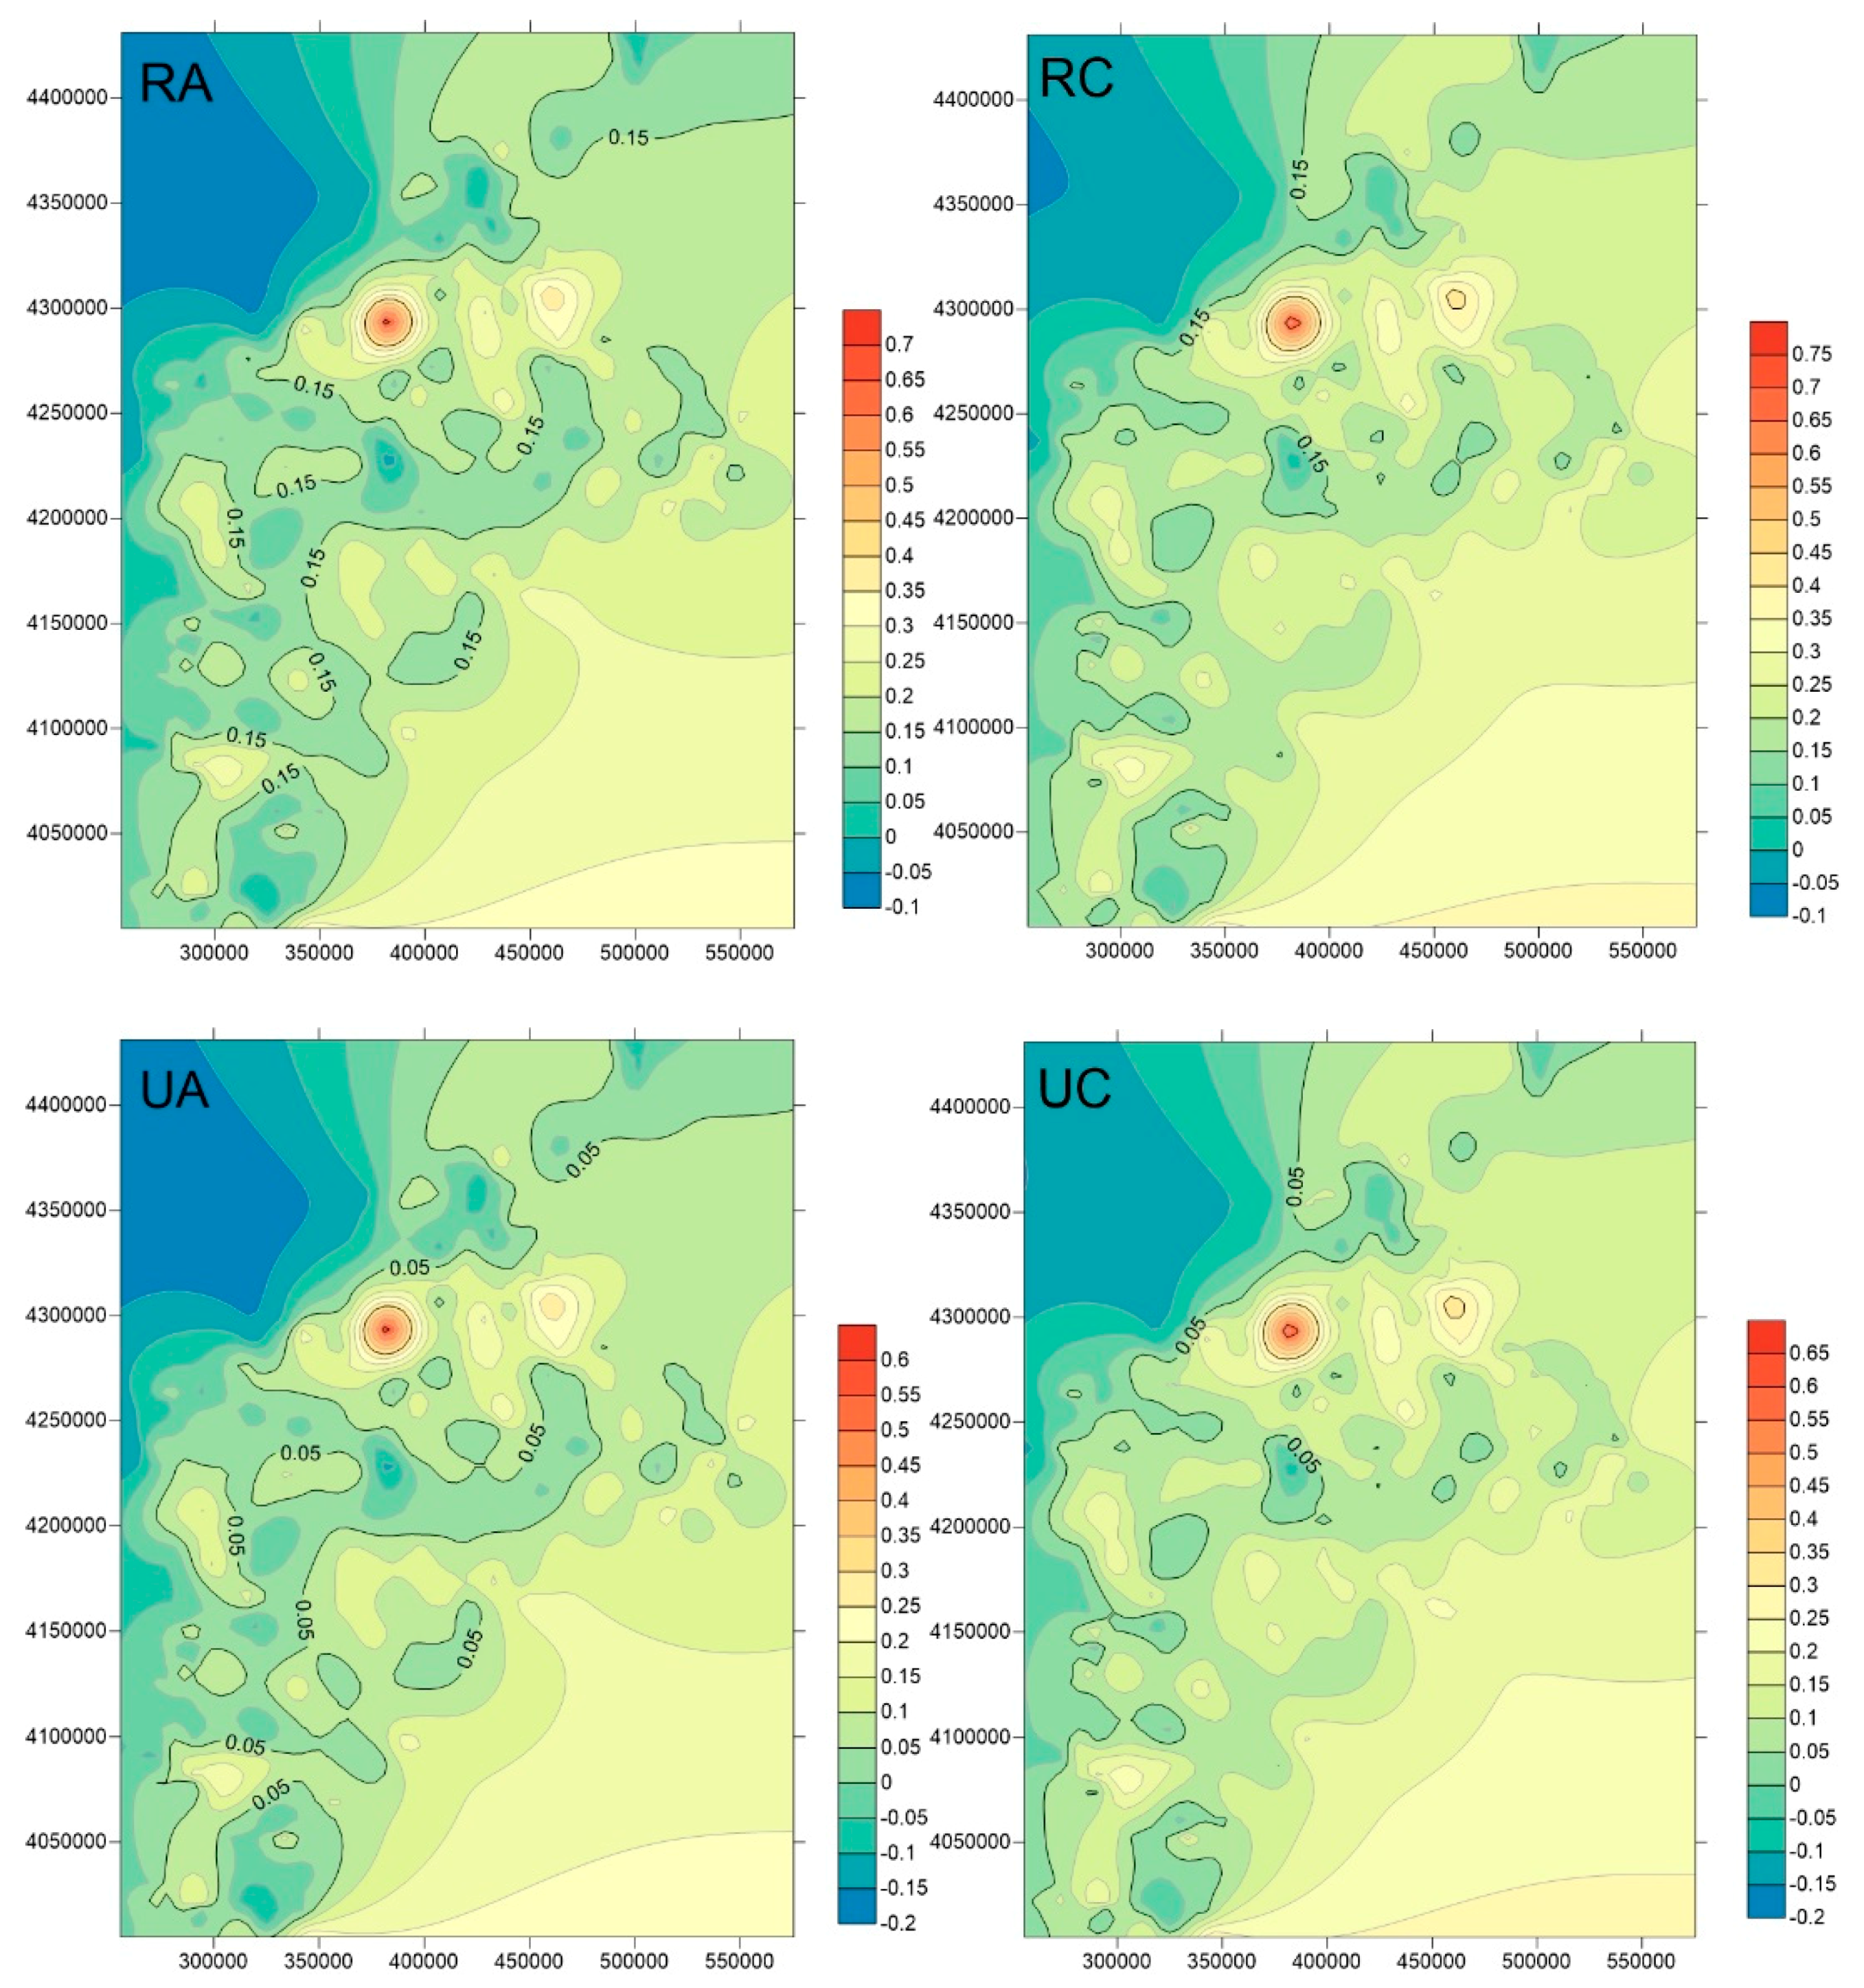
RA, RC, UA, and UC represent rural adults, rural children, urban adults, and urban children, respectively. The average TTHQ value of every metal(loid) by uptake by wheat in decreasing order was as follows: Cu > Zn > As > Pb > Cd > Hg > Ni > Cr. Average values of the THQ of Cu, Zn, As, Pb, Cd, Ni, and Cr were all less than one; however, 2% of As TTHQs exceeded the safe level of 1. The results from the TTHQs were: RC > RA > UC > UA.
The health risks from the consumption of a single trace metal(loid) in wheat will not cause considerable harm, and the results indicate that large differences exist in the levels of risk associated with the different trace metal(loid)s in wheat. THQ values greater than 0.3 were recorded for Cu, Zn, and As. The national food safety standards do not list Cu and Zn as contaminants. Attention should be paid to As, as it is highly toxic and 2% of the samples were associated with potential health risks. Wheat is a staple food in the study area and its consumption is much greater than in the southern regions of the country (rural adult and urban adult consumption are 102 and 62.5 g per day, respectively) [11,56]. These results show that the accumulation of As in the soils should be controlled or the consumption of wheat in North China should be reduced.
Trace metal(loid)s do not exist alone in wheat. As we examined multiple trace metal(loid)s in this study, multiple trace metal(loid)s may be absorbed from the soil into plants, which will lead to combined health risks for humans via the ingestion of several trace metal(loid)s. Table 8 shows that the TTHQ was greater than 1, indicating that trace metal(loid)s pose significant health risks and TTHQ children > TTHQ adults (Figure 6). Therefore, the combined health risks of trace elements in the research area should receive attention.
4. Conclusions
In this study, we evaluated the Cu, Pb, Zn, Cd, Ni, Cr, As, and Hg concentration in wheat–soil system of Hebei plain, northern China and analyzed the relationship between trace metal(loid)s and soil properties in wheat–soil systems. The sources of trace metal(loid)s were determined by PCA including coal burning, traffic, farming practices, and natural sources. The soil properties significantly affected the accumulation of trace metal(loid)s in wheat–soil systems. The trace metal(loid)s in the soil of the study area were all below the safe limit determined by a comprehensive pollution assessment. In addition, Cr, Cd, Ni, As, and Pb ingestion via wheat poses human health risks for adults and children at the local and region levels, meaning local government should pay more attention to the concentration of trace metal(loid)s Cr, Cd, Ni, As, and Pb in soil–wheat systems. This study provided basic information for improving the accumulation of trace elements in wheat and sustainable soil management for wheat growing regions.
Supplementary Materials
The following are available online at https://0-www-mdpi-com.brum.beds.ac.uk/2073-4395/9/7/391/s1, Figure S1: The normality test of trace elements by normal P-P plot, Table S1: The descriptive statistics of pools of heavy metals, Table S2: The relationship between BR and pH, TOC, CEC, Clay, Table S3: Relationship between the pools of trace metal(loid)s and CEC, clay, TOC, and pH.
Author Contributions
Conceptualization, K.C. and K.K.; Formal analysis, K.C. and Y.Y.; Writing—original draft preparation, K.C.; Writing—review and editing, M.Z.
Funding
This research received no external funding.
Acknowledgments
This paper was supported by Hebei GEO University.
Conflicts of Interest
The authors declare no conflict of interest.
References
- Ma, L.; Wang, L.; Tang, J.; Yang, Z. Arsenic speciation and heavy metal distribution in polished rice grown in Guangdong Province, Southern China. Food Chem. 2017, 233, 110–116. [Google Scholar] [CrossRef] [PubMed]
- Xia, F.; Qu, L.; Wang, T.; Luo, L.; Chen, H.; Dahlgren, R.A.; Zhang, M.; Mei, K.; Huang, H. Distribution and source analysis of heavy metal pollutants in sediments of a rapid developing urban river system. Chemosphere 2018, 207, 218–228. [Google Scholar] [CrossRef] [PubMed] [Green Version]
- Sama, S.G.; Barrère-Mangote, C.; Bouyssière, B.; Giusti, P.; Lobinski, R. Recent trends in element speciation analysis of crude oils and heavy petroleum fractions. Trends Anal. Chem. 2018, 104, 69–76. [Google Scholar] [CrossRef]
- Sun, J.; Yu, R.; Hu, G.; Su, G.; Zhang, Y. Tracing of heavy metal sources and mobility in a soil depth profile via isotopic variation of Pb and Sr. Catena 2018, 171, 440–449. [Google Scholar] [CrossRef]
- Wang, C.; Ji, J.; Yang, Z.; Chen, L.; Browne, P.; Yu, R. Effects of soil properties on the transfer of cadmium from soil to wheat in the Yangtze River Delta region, China—A typical industry–agriculture transition area. Biol. Trace Elem. Res. 2012, 148, 264–274. [Google Scholar] [CrossRef] [PubMed]
- Hansen, M.; Kepfer-Rojas, S.; Bjerager, P.E.R.; Holm, P.E.; Skov, S.; Ingerslev, M. Effects of ash application on nutrient and heavy metal fluxes in the soil and soil solution in a Norway spruce plantation in Denmark. For. Ecol. Manag. 2018, 424, 494–504. [Google Scholar] [CrossRef]
- Yang, X.; Li, Q.; Tang, Z.; Zhang, W.; Yu, G.; Shen, Q.; Zhao, F.J. Heavy metal concentrations and arsenic speciation in animal manure composts in China. Waste Manag. 2017, 64, 333–339. [Google Scholar] [CrossRef] [PubMed]
- Al-Othman, Z.A.; Ali, R.; Al-Othman, A.M.; Ali, J.; Habila, M.A. Assessment of toxic metals in wheat crops grown on selected soils, irrigated by different water sources. Arab. J. Chem. 2016, 9, S1555–S1562. [Google Scholar] [CrossRef] [Green Version]
- Singh, J.; Kalamdhad, A.S. Concentration and speciation of heavy metals during water hyacinth composting. Bioresour. Technol. 2012, 124, 169–179. [Google Scholar] [CrossRef]
- Wu, S.; Xu, Y.; Sun, J.; Cao, Z.; Zhou, J.; Pan, Y.; Qian, G. Inhibiting evaporation of heavy metal by controlling its chemical speciation in MSWI fly ash. Fuel 2015, 158, 764–769. [Google Scholar] [CrossRef]
- Li, H.; Ji, H. Chemical speciation, vertical profile and human health risk assessment of heavy metals in soils from coal-mine brownfield, Beijing, China. J. Geochem. Explor. 2017, 183, 22–32. [Google Scholar] [CrossRef]
- Yang, Z.; Shi, W.; Yang, W.; Liang, L.; Yao, W.; Chai, L.; Gao, S.; Liao, Q. Combination of bioleaching by gross bacterial biosurfactants and flocculation: A potential remediation for the heavy metal contaminated soils. Chemosphere 2018, 206, 83–91. [Google Scholar] [CrossRef] [PubMed]
- Wu, Q.; Zhou, H.; Tam, N.F.; Tian, Y.; Tan, Y.; Zhou, S.; Li, Q.; Chen, Y.; Leung, J.Y. Contamination, toxicity and speciation of heavy metals in an industrialized urban river: Implications for the dispersal of heavy metals. Mar. Pollut. Bull. 2016, 104, 153–161. [Google Scholar] [CrossRef] [PubMed]
- Lv, B.; Xing, M.; Yang, J. Speciation and transformation of heavy metals during vermicomposting of animal manure. Bioresour. Technol. 2016, 209, 397–401. [Google Scholar] [CrossRef] [PubMed]
- Wang, H.X.; Xu, J.L.; Sheng, L.X. Study on the comprehensive utilization of resources city kitchen waste in China. Energy 2019, 173, 263–277. [Google Scholar] [CrossRef]
- Vega, F.A.; Weng, L. Speciation of heavy metals in River Rhine. Water Res. 2013, 47, 363–372. [Google Scholar] [CrossRef]
- Weng, H.X.; Ma, X.W.; Fu, F.X.; Zhang, J.J.; Liu, Z.; Tian, L.X.; Liu, C. Transformation of heavy metal speciation during sludge drying: Mechanistic insights. J. Hazard. Mater. 2014, 265, 96–103. [Google Scholar] [CrossRef]
- Zheng, R.; Zhao, J.; Zhou, X.; Ma, C.; Wang, L.; Gao, X. Land Use Effects on the Distribution and Speciation of Heavy Metals and Arsenic in Coastal Soils on Chongming Island in the Yangtze River Estuary, China. Pedosphere 2016, 26, 74–84. [Google Scholar] [CrossRef]
- Li, J.; Zhu, L.X.; Kang, Z.Q. Characteristics of transfer and their influencing factors of heavy metals in soil-crop system of peri-urban agricultural soils of Nanning, South China. Carsol. Sin. 2018, 37, 43–52. [Google Scholar]
- Thinh, N.V.; Osanai, Y.; Adachi, T.; Thai, P.K.; Nakano, N.; Ozaki, A.; Kuwahara, Y.; Kato, R.; Makio, M.; Kurosawa, K. Chemical speciation and bioavailability concentration of arsenic and heavy metals in sediment and soil cores in estuarine ecosystem, Vietnam. Microchem. J. 2018, 139, 268–277. [Google Scholar] [CrossRef] [Green Version]
- Liang, X.; Ning, X.A.; Chen, G.; Lin, M.; Liu, J.; Wang, Y. Concentrations and speciation of heavy metals in sludge from nine textile dyeing plants. Ecotoxicol. Environ. Saf. 2013, 98, 128–134. [Google Scholar] [CrossRef] [PubMed]
- Zhang, Y.; Chen, J.; Wang, L.; Zhao, Y.; Ou, P.; Shi, W. Establishing a method to assess comprehensive effect of gradient variation human health risk to metal speciation in groundwater. Environ. Pollut. 2018, 241, 887–899. [Google Scholar] [CrossRef] [PubMed]
- Yu, T.; Yang, Z.F.; Zhong, J.; Cheng, X.B. Factors affecting the geochemical behavior of heavy metal elements Pb and Cd in soil. Earth Sci. Front. 2008, 15, 67–73. (In Chinese) [Google Scholar]
- Hei, L.; Jin, P.; Zhu, X.; Ye, W.; Yang, Y. The Tenth International Conference on Waste Management and Technology (ICWMT) Characteristics of speciation of heavy metals in municipal sewage sludge of Guangzhou as fertilizer. Procedia Environ. Sci. 2016, 31, 232–240. [Google Scholar] [CrossRef]
- Dong, B.; Liu, X.; Dai, L.; Dai, X. Changes of heavy metal speciation during high-solid anaerobic digestion of sewage sludge. Bioresour. Technol. 2013, 131, 152–158. [Google Scholar] [CrossRef] [PubMed]
- Huang, R.; Zhang, B.; Saad, E.M.; Ingall, E.D.; Tang, Y. Speciation evolution of zinc and copper during pyrolysis and hydrothermal carbonization treatments of sewage sludges. Water Res. 2018, 132, 260–269. [Google Scholar] [CrossRef]
- Zang, F.; Wang, S.; Nan, Z.; Ma, J.; Zhang, Q.; Chen, Y.; Li, Y. Accumulation, spatio-temporal distribution, and risk assessment of heavy metals in the soil-corn system around a polymetallic mining area from the Loess Plateau, northwest China. Geoderma 2017, 305, 188–196. [Google Scholar] [CrossRef]
- Shi, G.L.; Lou, L.Q.; Zhang, S.; Xia, X.W.; Cai, Q.S. Arsenic, copper, and zinc contamination in soil and wheat during coal mining, with assessment of health risks for the inhabitants of Huaibei, China. Environ. Sci. Pollut. Res. 2013, 20, 8435–8445. [Google Scholar] [CrossRef]
- Liu, B.; Ai, S.; Zhang, W.; Huang, D.; Zhang, Y. Assessment of the bioavailability, bioaccessibility and transfer of heavy metals in the soil-grain-human systems near a mining and smelting area in NW China. Sci Total Environ. 2017, 609, 822–829. [Google Scholar] [CrossRef]
- Huang, M.; Zhou, S.; Sun, B.; Zhao, Q. Heavy metals in wheat grain: Assessment of potential health risk for inhabitants in Kunshan, China. Sci. Total Environ. 2008, 405, 54–61. [Google Scholar] [CrossRef]
- Ran, J.; Wang, D.; Wang, C.; Zhang, G.; Zhang, H. Heavy metal contents, distribution, and prediction in a regional soil–wheat system. Sci. Total Environ. 2016, 544, 422–431. [Google Scholar] [CrossRef] [PubMed]
- Liu, X.; Song, Q.; Tang, Y.; Li, W.; Xu, J.; Wu, J.; Wang, F.; Brookes, P.C. Human health risk assessment of heavy metals in soil–vegetable system: A multi-medium analysis. Sci. Total Environ. 2013, 463, 530–540. [Google Scholar] [CrossRef] [PubMed]
- Song, Y.; Li, H.; Li, J.; Mao, C.; Ji, J.; Yuan, X.; Li, T.; Ayoko, G.A.; Frost, R.L.; Feng, Y. Multivariate linear regression model for source apportionment and health risk assessment of heavy metals from different environment media. Ecotoxicol. Environ. Saf. 2018, 165, 555–563. [Google Scholar] [CrossRef] [PubMed]
- Qu, M.K.; Li, W.D.; Zhang, C.R.; Wang, S.Q.; Yang, Y.; He, L.Y. Source apportionment of heavy metals in soils using multivariate statistics and geostatistics. Pedosphere 2013, 23, 437–444. [Google Scholar] [CrossRef]
- Chai, Y.; Guo, J.; Chai, S.; Cai, J.; Xue, L.; Zhang, Q. Source identification of eight heavy metals in grassland soils by multivariate analysis from the Baicheng-Songyuan area, Jilin Province, Northeast China. Chemosphere 2015, 134, 67–75. [Google Scholar] [CrossRef] [PubMed]
- Tukura, B.W. Statistical Modeling of Heavy Metals Uptake by Capiscum Annum and Habiscus Esculentus Vegetable Crops from Irrigation Soil. Int. J. Adv. Res. Phys. Sci. (IJARPS) 2014, 6, 35–43. [Google Scholar]
- Zhang, X.; Tian, Y.; Wang, Q.; Chen, L.; Wang, X. Heavy metal distribution and speciation during sludge reduction using aquatic worms. Bioresour. Technol. 2012, 126, 41–47. [Google Scholar] [CrossRef]
- Liu, Y.; Ma, L.; Li, Y.; Zheng, L. Evolution of heavy metal speciation during the aerobic composting process of sewage sludge. Chemosphere 2007, 67, 1025–1032. [Google Scholar] [CrossRef]
- Liu, Y.; Bi, J.; Lv, J.; Ma, Z.; Wang, C. Spatial multi-scale relationships of ecosystem services: A case study using a geostatistical methodology. Sci. Rep. 2017, 7, 9486. [Google Scholar] [CrossRef] [Green Version]
- Lv, J. Multivariate receptor models and robust geostatistics to estimate source apportionment of heavy metals in soils. Environ. Pollut. 2019, 244, 72–83. [Google Scholar] [CrossRef]
- Technical Standard of Geological Survey of China Geological Survey. Technical Requirements for Eco-Geochemical Evaluation of Sample Analysis (DD2005-03); Standard Press of China: Beijing, China, 2005. [Google Scholar]
- Chinese Environmental Protection Administration (CEPA). Environmental Quality Standard for Soils (GB15618-2018); Standards Press of China: Beijing, China, 2018. [Google Scholar]
- Chen, L.; Zhou, S.; Shi, Y.; Wang, C.; Li, B.; Li, Y.; Wu, S. Heavy metals in food crops, soil and water in the Lihe River Watershed of the Taihu Region and their potential health risks when ingested. Sci. Total Environ. 2018, 615, 141–149. [Google Scholar] [CrossRef] [PubMed]
- Lu, X.; Zhang, X.; Li, L.Y.; Chen, H. Assessment of metals pollution and health risk in dust from nursery schools in Xian, China. Environ. Res. 2014, 128, 27–34. [Google Scholar] [CrossRef] [PubMed]
- Yu, S.; Zhu, Y.G.; Li, X.D. Trace metal contamination in urban soils of China. Sci. Total Environ. 2012, 421, 17–30. [Google Scholar]
- USEPA. Risk Assessment Guidance for Superfund Volume I Human Health Evaluation Manual (Part A); EPA/540/1-89/002; Environmental Protection Agency: Washington, DC, USA, 1989; pp. 35–52.
- USEPA (United States Environmental Protection Agency). Handbook for Non-cancer Health Effects Evaluation; Environmental Protection Agency: Washington, DC, USA, 2000.
- George, D.; Mallery, M. SPSS for Windows Step by Step: A Simple Guide and Reference; 17.0 Update (10a ed.); Pearson: Boston, MA, USA, 2010. [Google Scholar]
- Hair, J.F.; Black, W.C.; Babin, B.J.; Anderson, R.E. Multivariate Data Analysis, 7th ed; Prentice Hall: Upper Saddle River, NJ, USA, 2010. [Google Scholar]
- Yadav, R.; Pathak, G.S. Young consumers intention towards buying green products in a developing nation: Extending the theory of planned behavior. J. Clean. Prod. 2016, 135, 732–739. [Google Scholar] [CrossRef]
- Chinese Environmental Protection Administration (CEPA). Elemental Background Values of Soils in China; Environmental Science Press of China: Beijing, China, 1990. [Google Scholar]
- Jung, M.C. Heavy Metal Concentrations in Soils and Factors Affecting Metal Uptake by Plants in the Vicinity of a Korean Cu-W Mine. Sensors (Basel) 2008, 8, 2413–2423. [Google Scholar] [CrossRef] [PubMed] [Green Version]
- Proshad, R.; Islam, M.S.; Kormoker, T. Assessment of heavy metals with ecological risk of soils in the industrial vicinity of Tangail district, Bangladesh. Int. J. Adv. Geosci. 2018, 6, 108–116. [Google Scholar] [CrossRef]
- Bhagure, G.R.; Mirgane, S.R. Heavy metal concentrations in groundwaters and soils of Thane Region of Maharashtra, India. Environ. Monit. Assess. 2010, 173, 643–652. [Google Scholar] [CrossRef]
- Dragović, S.; Mihailović, N.; Gajić, B. Heavy metals in soils: Distribution, relationship with soil characteristics and radionuclides and multivariate assessment of contamination sources. Chemosphere 2008, 72, 491–495. [Google Scholar] [CrossRef] [PubMed]
- Aydinalp, C.; Marinova, S. Distribution and Forms of Heavy Metals in Some Agricultural Soils. Pol. J. Environ. 2003, 12, 629–633. [Google Scholar]
- Bird, G.; Brewer, P.A.; Macklin, M.G.; Serban, M.; Balteanu, D.; Driga, B. Heavy metal contamination in the Aries river catchment, western Romania: Implications for development of the Rosia Montana gold deposit. J. Geochem. Explor. 2005, 86, 26–48. [Google Scholar] [CrossRef]
- Roslaili, A.A.; Sahibin, A.R.; Ismail, S.; Wan, M.R.I. Speciation and Availability of Heavy Metals On Serpentinized Paddy Soil and Paddy Tissue. Procedia Soc. Behav. Sci. 2015, 195, 1658–1665. [Google Scholar] [Green Version]
- Presley, B.J.; Trefry, J.H. Heavy metal inputs to Mississippi delta sediments, a historical view. Water Air Soil Pollut. 1980, 13, 481–494. [Google Scholar] [CrossRef]
- Singh, A.K.; Benerjee, D.K. Grain size and geochemical partitioning of heavy metals in sediments of the Damodar River—A tributary of the lower Ganga, India. Environ. Geol. 1999, 39, 91–98. [Google Scholar] [CrossRef]
- Tessier, A. Sequential extraction procedure for the speciation of particulate, trace metals. Anal. Chem. 1979, 51, 844–851. [Google Scholar] [CrossRef]
- Wiese, S.B.O.; Macleod, C.L.; Lester, J.N. A recent history of metal accumulation in the sediments of the Thames Estuary, United Kingdom. Estuaries 1997, 20, 483–493. [Google Scholar] [CrossRef]
- Karlsson, T.; Persson, P.; Skyllberg, U. Complexation of copper(ll) in organic soils and in dissolved organic matter–EXAFS evidence for chelate ring structures. Environ. Sci. Technol. 2006, 40, 2623–2628. [Google Scholar] [CrossRef] [PubMed]
- Yang, S.; Zhou, D.; Yu, H.; Wei, R.; Pan, B. Distribution and speciation of metals (Cu, Zn, Cd, and Pb) in agricultural and non-agricultural soils near a stream upriver from the Pearl River, China. Environ. Pollut. 2013, 177, 64–70. [Google Scholar] [CrossRef] [PubMed]
- Xing, H.L.; Guo, H.M.; Wang, Y.; Li, R.M.; Liu, Y.S.; Xu, H.Z. Fraction distribution and risk assessment of soil heavy metals in Anxin-Qingyuan County in Baoding of Hebei. Hydrogeol. Eng. Geol. 2016, 43, 140–145. [Google Scholar]
- Zhang, L.H.; Xu, H.Z.; Yu, Q.C.; Li, R.M.; Ma, Z.S.; Cao, F.; Li, H.L. The Investigation and Evaluation of the heavy metal pollution in farmland soil and crop in the Qingyuan of Hebei, China. J. Agro-Envrion. Sci. 2010, 29, 2139–2146. [Google Scholar]
- Dong, T.X.; Yang, H.X.; Li, H.F.; Qiao, Y.H.; Su, D.C. Accumulation Characteristics of Heavy Metals in the Soil with Wheat-corn Rotation Systemin North China. J. Agric. Resour. Environ. 2014, 31, 355–365. [Google Scholar]
- Welch, R.M.; Norvell, W.A. Mechanisms of Cadmium Uptake, Translocation and Deposition in Plants; Springer: Dordrecht, The Netherlands, 1999. [Google Scholar]
- Nan, Z.; Li, J.; Zhang, J. Cadmium and zinc interactions and their transfer in soil-crop system under actual field conditions. Sci. Total Environ. 2002, 285, 187–195. [Google Scholar] [CrossRef]
- Li, J.; Zhang, M.; Ye, Z.; Yang, C. Effect of manganese oxide-modified biochar addition on methane production and heavy metal speciation during the anaerobic digestion of sewage sludge. J. Environ. Sci. 2018, 76, 267–277. [Google Scholar] [CrossRef]
- Xu, L.; Wang, T.; Wang, J.; Lu, A. Occurrence, speciation and transportation of heavy metals in 9 coastal rivers from watershed of Laizhou Bay, China. Chemosphere 2017, 173, 61–68. [Google Scholar] [CrossRef]
- Zhang, C.; Shan, B.; Tang, W.; Dong, L.; Zhang, W.; Pei, Y. Heavy metal concentrations and speciation in riverine sediments and the risks posed in three urban belts in the Haihe Basin. Ecotoxicol. Environ. Saf. 2017, 139, 263–271. [Google Scholar] [CrossRef]
- Singh, J.; Kalamdhad, A.S. Effect of Eisenia fetida on speciation of heavy metals during vermicomposting of water hyacinth. Ecol. Eng. 2013, 60, 214–223. [Google Scholar] [CrossRef]
- Huang, J.; Yuan, F.; Zeng, G.; Li, X.; Gu, Y.; Shi, L.; Liu, W.; Shi, Y. Influence of pH on heavy metal speciation and removal from wastewater using micellar-enhanced ultrafiltration. Chemosphere 2017, 173, 199–206. [Google Scholar] [CrossRef] [PubMed]
- Wang, B.; Huang, B.; Qi, Y.B.; Hua, W.Y.; Sun, W.X. Effect of air drying on speciation of heavy metals in flooded rice paddies. Chin. Chem. Lett. 2012, 23, 1287–1290. [Google Scholar] [CrossRef]
- Li, J.Y.; Hou, Y.L.; Hua, Q.X.; Dong, X.Z. Variation of soil nutrient and heavy metal and heavy metal concentrations in greenhouse soil. Soils 2005, 37, 626–629. [Google Scholar]
- Yang, L.L.; Li, J.H. Nutrition and fertilizer effect of saline soil in China. Chin. J. Eco-Agric. CJEA 2001, 9, 79–81. [Google Scholar]
- Wijaya, A.R.; Ouchi, A.K.; Tanaka, K.; Shinjo, R.; Ohde, S. Metal contents and Pb isotopes in road-side dust and sediment of Japan. J. Geochem. Explor. 2012, 118, 68–76. [Google Scholar] [CrossRef]
- Liu, H.M.; Yang, K.; Xiao, Z.W. Research Progress of Soil Cadmium Pollution Control and Exogenous Regulation. Crop Res. 2018, 32, 449–453. [Google Scholar]
- Gao, Y.; Cheng, Q.; Zhang, M.J.; Zhu, Z.Y.; Hu, T.T.; Yang, Y. Research Advance on Remediation Technology of Cadmium Contaminated Soil. Biotechnol. Bull. 2017, 33, 103–110. [Google Scholar]
- Pan, X.; Han, Z.; Ben, W.W. Heavy Metal Contents in Pig Manure and Pig Feeds from Intensive Pig Farms in Shandong Province, China. J. Agro-Environ. Sci. 2013, 32, 160–165. [Google Scholar]
- Wu, Q.; Wang, S.; Li, G.; Liang, S.; Lin, C.J.; Wang, Y.; Cai, S.; Liu, K.; Hao, J. Temporal Trend and Spatial Distribution of Speciated Atmospheric Mercury Emissions in China During 1978–2014. Environ. Sci. Technol. 2016, 50, 13428–13435. [Google Scholar] [CrossRef] [PubMed]
- Xu, P.; Zhang, B.; Zeng, X.; Xu, Y.; Luo, G.; Yao, H. Influence of Hg occurrence in coal on accuracy of Hg direct measurement based on thermal decomposition. Int. J. Coal Geol. 2017, 170, 14–18. [Google Scholar] [CrossRef]
Figure 1.
Map of the sampling sites.

Figure 2.
The predict map of WECH (the concentration’s sum of water-soluble, exchangeable, carbonate-bound and humic acid-bound) of trace metal(loid)s by Kriging method.
Figure 2.
The predict map of WECH (the concentration’s sum of water-soluble, exchangeable, carbonate-bound and humic acid-bound) of trace metal(loid)s by Kriging method.


Figure 3.
Box plots of the (a) bio-accumulation rates and (b) comprehensive pollution levels. (“*” represent the outlier value).
Figure 3.
Box plots of the (a) bio-accumulation rates and (b) comprehensive pollution levels. (“*” represent the outlier value).

Figure 4.
The scree plot (a) and three component plots in the matrix (b).

Figure 5.
The Spatial prediction map of the comprehensive pollution index.

Figure 6.
The contour map of the total target hazard quotients of rural and urban populations (RA = rural adults, RC = rural children, UA = urban adults, and UC = urban children).
Figure 6.
The contour map of the total target hazard quotients of rural and urban populations (RA = rural adults, RC = rural children, UA = urban adults, and UC = urban children).


Table 1.
The statistically optimal model and parameters of semivariogram function of trace metal(loid)s, pollution index, and health risk index.
Table 1.
The statistically optimal model and parameters of semivariogram function of trace metal(loid)s, pollution index, and health risk index.
| Elements | Nugget(C0) | Sill (C0 + C) | Range (m) | C0/(C0 + C) | C/(C0 + C) | Model | R2 |
|---|---|---|---|---|---|---|---|
| P | 0.0054 | 0.055 | 33900 | 0.098 | 0.902 | Exponential | 0.74 |
| Cd | 0.0203 | 0.1306 | 38700 | 0.155 | 0.845 | Exponential | 0.71 |
| Cr | 0.0779 | 0.1568 | 70200 | 0.497 | 0.503 | Spherical | 0.84 |
| Cu | 0.0255 | 0.16 | 41400 | 0.159 | 0.841 | Exponential | 0.62 |
| Ni | 0.0005 | 0.0867 | 16700 | 0.006 | 0.994 | Spherical | 0.83 |
| Pb | 0.0084 | 0.1408 | 23900 | 0.060 | 0.94 | Spherical | 0.80 |
| Zn | 0.0069 | 0.059 | 24900 | 0.117 | 0.88 | Exponential | 0.77 |
| As | 0.08665 | 0.10824 | 202061 | 0.801 | 0.199 | Linear | 0.51 |
| Hg | 0.01196 | 0.02402 | 831000 | 0.498 | 0.502 | Exponential | 0.81 |
| UA | 0.00038 | 0.00756 | 25000 | 0.050 | 0.95 | Spherical | 0.79 |
| RA | 0.00037 | 0.00758 | 24800 | 0.049 | 0.951 | Spherical | 0.78 |
| UC | 0.00038 | 0.00761 | 24700 | 0.050 | 0.95 | Spherical | 0.78 |
| RC | 0.00038 | 0.00756 | 25000 | 0.050 | 0.95 | Spherical | 0.78 |
P represents the comprehensive pollution index. UA, RA, UC, and RC represent the health risk index of adults and children in urban and rural areas. (RA = rural adults, RC = rural children, UA = urban adults, and UC = urban children).
Table 2.
Descriptive statistics of trace metal(loid)s and physicochemical property parameters in the soil in the study area (unit: mg/kg, expect for K, Ca, Mg, Fe, and Mn were %).
Table 2.
Descriptive statistics of trace metal(loid)s and physicochemical property parameters in the soil in the study area (unit: mg/kg, expect for K, Ca, Mg, Fe, and Mn were %).
| Parameters | Mean | Median | Std. Deviation (SD) | Coefficient of Variable (CV) | Skewness | Kurtosis | Minimum | Maximum |
|---|---|---|---|---|---|---|---|---|
| Cu | 25.80 | 24.35 | 15.52 | 0.60 | 10.89 | 138.874 | 13.90 | 228.90 |
| Zn | 74.97 | 73.35 | 25.50 | 0.74 | 9.19 | 113.799 | 42.70 | 393.60 |
| Pb | 24.75 | 23.50 | 9.98 | 0.40 | 8.39 | 79.670 | 15.70 | 125.70 |
| Cr | 67.57 | 67.25 | 7.27 | 0.11 | −0.04 | 0.075 | 47.30 | 86.70 |
| Ni | 28.78 | 28.10 | 4.97 | 0.17 | 0.34 | −0.196 | 16.80 | 43.20 |
| As | 9.87 | 9.59 | 3.09 | 0.31 | 1.33 | 7.015 | 2.47 | 29.50 |
| Cd | 0.19 | 0.16 | 0.30 | 1.60 | 14.32 | 208.451 | 0.08 | 4.52 |
| Hg | 0.06 | 0.05 | 0.04 | 0.64 | 4.59 | 29.665 | 0.02 | 0.36 |
| pH | 8.30 | 8.33 | 0.28 | 0.03 | −0.42 | 0.225 | 7.43 | 9.05 |
| TOC | 1.04 | 0.99 | 0.38 | 0.37 | 1.26 | 3.303 | 0.31 | 2.67 |
| CEC | 10.95 | 10.35 | 3.69 | 0.34 | 0.77 | 0.389 | 3.76 | 24.20 |
| Clay | 98.20 | 90.30 | 41.42 | 0.42 | 1.27 | 2.270 | 16.00 | 265.20 |
Table 3.
The comparison of trace metal(loid)s in local area with others region (unit: mg/kg).
| Country | Area | Pb | Zn | Cr | As | Cd | Hg | Ni | Cu | References |
|---|---|---|---|---|---|---|---|---|---|---|
| China | Local area | 24.75 | 74.97 | 67.57 | 9.87 | 0.19 | 0.06 | 28.78 | 25.8 | This study |
| China | Changshu | 26.3 | 81.9 | - | - | 0.174 | - | 29.5 | 31 | [31] |
| China | Zhejiang | 68.64 | - | 47.74 | 15.51 | 0.72 | 0.76 | - | - | [32] |
| China | Changjiang | 34.79 | 246.22 | - | 9.50 | 0.47 | 0.155 | - | 41.71 | [33] |
| China | Jilin | 18.3 | 35 | 35 | 7.2 | 0.072 | 0.014 | 15.2 | 16.7 | [35] |
| China | Hebei soil | 21.50 | 71.90 | 68.30 | 12.80 | 0.09 | 0.04 | 30.80 | 21.8 | [51] |
| China | Environmental Quality | 170 | 300 | 250 | 25 | 0.6 | 3.4 | 190 | 100 | [42] |
| Korea | southeast | 63 | 136 | - | - | 1.8 | - | - | 183 | [52] |
| Bangladesh | Tangail | 17.46 | 11.56 | 6.11 | 2.01 | 23.92 | 37.27 | [53] | ||
| India | Maharashtra | 42 | 86.5 | 164 | 2.8 | 30 | 1.54 | 171 | 155 | [54] |
| Serbia | Zlatibor | 41.5 | 21.8 | 46.3 | - | 1.42 | - | 320 | 8.64 | [55] |
| Turkey | Bursa | 80.9 | 476.7 | 124.5 | - | 2 | - | 157.8 | 40 | [56] |
Table 4.
Descriptive statistics of trace metal(loid)s in wheat in the study area (unit: mg/kg).
| Trace Metal(loid)s | Mean | Median | Standard Deviation | Coefficient of Variation | Skewness | Kurtosis | Minimum | Maximum | Food Limit [42] |
|---|---|---|---|---|---|---|---|---|---|
| Cu | 4.64 | 4.51 | 0.99 | 0.21 | 0.55 | 0.89 | 2.38 | 8.82 | - |
| Zn | 31.98 | 31.45 | 7.49 | 0.23 | 0.64 | 0.79 | 17.40 | 63.40 | - |
| Pb | 0.06 | 0.05 | 0.04 | 0.60 | 2.96 | 14.95 | 0.02 | 0.32 | 0.2 |
| Ni | 0.10 | 0.09 | 0.04 | 0.44 | 3.63 | 23.98 | 0.04 | 0.46 | 1 |
| Hg | 0.002 | 0.002 | 0.002 | 0.85 | 6.04 | 63.78 | 0.00005 | 0.02 | 0.02 |
| Cr | 0.03 | 0.03 | 0.01 | 0.36 | 0.80 | 3.02 | 0.01 | 0.10 | 1 |
| Cd | 0.03 | 0.03 | 0.02 | 0.51 | 2.77 | 11.52 | 0.01 | 0.14 | 0.1 |
| As | 0.03 | 0.03 | 0.02 | 0.78 | 6.11 | 61.10 | 0.001 | 0.26 | 0.5 |
Table 5.
The comprehensive correlation of the pools of trace metal(loid)s and the physical–chemical properties in soil and wheat.
Table 5.
The comprehensive correlation of the pools of trace metal(loid)s and the physical–chemical properties in soil and wheat.
| pools | Cdwheat | Pbwheat | Cuwheat | Znwheat | Crwheat | Niwheat | Hgwheat | Aswheat |
|---|---|---|---|---|---|---|---|---|
| F1 | 0.046 | 0.188 ** | −0.084 | 0.010 | −0.185 ** | −0.035 | 0.076 | 0.214 ** |
| F2 | 0.320 ** | −0.094 | −0.071 | 0.014 | 0.087 | 0.028 | −0.029 | 0.180 ** |
| F3 | 0.074 * | −0.040 | −0.036 | −0.031 | 0.248 ** | −0.024 | 0.065 | 0.214 ** |
| F4 | 0.300 ** | 0.350 ** | −0.187 ** | 0.005 | 0.301 ** | 0.217 ** | −0.127 | 0.062 |
| Cu | 0.277 ** | 0.216 ** | 0.086 | 0.059 | −0.165 * | 0.049 | 0.147 * | 0.311 ** |
| Pb | 0.173 ** | 0.220 ** | 0.058 | 0.043 | −0.160 * | −0.014 | −0.129 | 0.366 ** |
| Zn | 0.197 ** | 0.209 ** | 0.042 | 0.017 | −0.091 | 0.035 | −0.131 * | 0.305 ** |
| Ni | 0.035 | 0.078 | 0.017 | −0.016 | −0.126 | 0.004 | 0.017 | −0.083 |
| Cr | 0.010 | 0.137 * | −0.024 | 0.009 | −0.137* | 0.079 | -0.007 | −0.075 |
| As | 0.065 | 0.059 | 0.278 ** | 0.083 | 0.041 | 0.057 | −0.029 | 0.043 |
| Cd | 0.208 ** | 0.162 * | 0.001 | 0.006 | −0.051 | 0.025 | −0.195 ** | 0.193 ** |
| Hg | 0.037 | 0.161 * | −0.040 | 0.063 | 0.049 | 0.126 | −0.150 * | 0.097 |
Note: ** denotes p < 0.01 and * denotes p < 0.05.
Table 6.
The correlation analysis matrix of trace metal(loid)s in the study area.
| Elements | Cu | Pb | Zn | Ni | Cr | As | Cd | Hg |
|---|---|---|---|---|---|---|---|---|
| Cu | 1 | - | ||||||
| Pb | 0.615 ** | 1 | - | |||||
| Zn | 0.653 ** | 0.627 ** | 1 | - | ||||
| Ni | 0.712 ** | 0.467 ** | 0.565 ** | 1 | - | |||
| Cr | 0.617 ** | 0.402 ** | 0.486 ** | 0.826 ** | 1 | - | ||
| As | 0.553 ** | 0.419 ** | 0.426 ** | 0.640 ** | 0.569 ** | 1 | - | |
| Cd | 0.510 ** | 0.598 ** | 0.851 ** | 0.248 ** | 0.204 ** | 0.260 ** | 1 | - |
| Hg | 0.293 ** | 0.266 ** | 0.255 ** | -0.001 | 0.138 * | 0.090 | 0.243 ** | 1 |
Note: ** denotes p < 0.01 and * denotes p < 0.05.
Table 7.
The total variance explained and loading values by PCA for the trace metal(loid)s in the study area.
Table 7.
The total variance explained and loading values by PCA for the trace metal(loid)s in the study area.
| Elements | Extraction | PCA1 | PCA2 | PCA3 |
|---|---|---|---|---|
| Cu | 0.742 | 0.462 | 0.619 | 0.382 |
| Pb | 0.619 | 0.355 | 0.610 | 0.346 |
| Zn | 0.809 | 0.034 | 0.892 | −0.108 |
| Ni | 0.885 | 0.933 | 0.077 | −0.093 |
| Cr | 0.796 | 0.892 | 0.007 | 0.031 |
| As | 0.694 | 0.784 | 0.269 | 0.082 |
| Cd | 0.972 | 0.036 | 0.982 | 0.086 |
| Hg | 0.872 | −0.052 | 0.053 | 0.931 |
| Eigenvalues | 2.625 | 2.596 | 1.168 | |
| Total variance (%) | 32.813 | 32.446 | 14.594 | |
| Cumulative variance (%) | 32.813 | 65.259 | 79.853 | |
Rotation method: varimax with Kaiser normalization.
Table 8.
The calculated results of the health risks of rural and urban adults and children. RA, RC, UA, and UC represent rural adults, rural children, urban adults, and urban children, respectively.
Table 8.
The calculated results of the health risks of rural and urban adults and children. RA, RC, UA, and UC represent rural adults, rural children, urban adults, and urban children, respectively.
| Risk Index | RC | UC | RA | UA |
|---|---|---|---|---|
| THQAs | 0.416 ± 0.316 | 0.334 ± 0.254 | 0.379 ± 0.288 | 0.304 ± 0.231 |
| THQCd | 0.047 ± 0.024 | 0.038 ± 0.019 | 0.043 ± 0.022 | 0.035 ± 0.018 |
| THQCu | 0.513 ± 0.107 | 0.411 ± 0.086 | 0.467 ± 0.098 | 0.374 ± 0.079 |
| THQNi | 0.022 ± 0.011 | 0.0181 ± 0.009 | 0.0206 ± 0.01 | 0.017 ± 0.008 |
| THQZn | 0.472 ± 0.109 | 0.378 ± 0.087 | 0.430 ± 0.099 | 0.345 ± 0.08 |
| THQCr | 9.65 × 10⁻⁵ ± 3.38 × 10⁻⁵ | 7.74 × 10⁻⁵ ± 2.71 × 10⁻⁵ | 8.79 × 10⁻⁵ ± 3.08 × 10⁻⁵ | 7.05 × 10⁻⁵ ± 2.47 × 10⁻⁵ |
| THQHg | 0.032 ± 0.026 | 0.025 ± 0.021 | 0.029 ± 0.024 | 0.023 ± 0.019 |
| THQPb | 0.068 ± 0.041 | 0.055 ± 0.033 | 0.062 ± 0.037 | 0.050 ± 0.030 |
| TTHQtotal | 1.572 ± 0.395 | 1.261 ± 0.317 | 1.431 ± 0.360 | 1.148 ± 0.289 |
© 2019 by the authors. Licensee MDPI, Basel, Switzerland. This article is an open access article distributed under the terms and conditions of the Creative Commons Attribution (CC BY) license (http://creativecommons.org/licenses/by/4.0/).
Share and Cite
MDPI and ACS Style
Cai, K.; Zhang, M.; Yu, Y.; Kim, K. Pollution, Source, and Relationship of Trace Metal(loid)s in Soil-Wheat System in Hebei Plain, Northern China. Agronomy 2019, 9, 391. https://0-doi-org.brum.beds.ac.uk/10.3390/agronomy9070391
AMA Style
Cai K, Zhang M, Yu Y, Kim K. Pollution, Source, and Relationship of Trace Metal(loid)s in Soil-Wheat System in Hebei Plain, Northern China. Agronomy. 2019; 9(7):391. https://0-doi-org.brum.beds.ac.uk/10.3390/agronomy9070391
Chicago/Turabian StyleCai, Kui, Minjie Zhang, Yanqiu Yu, and Kangjoo Kim. 2019. "Pollution, Source, and Relationship of Trace Metal(loid)s in Soil-Wheat System in Hebei Plain, Northern China" Agronomy 9, no. 7: 391. https://0-doi-org.brum.beds.ac.uk/10.3390/agronomy9070391
Note that from the first issue of 2016, this journal uses article numbers instead of page numbers. See further details here.