Article

Assessing the Potential of Cereal Production Systems to Adapt to Contrasting Weather Conditions in the Mediterranean Region

1
Lebanese Agricultural Research Institute, P.O. Box 90-1965, Fanar, Lebanon
2
National Research Council of Italy, Institute for Agricultural and Forestry Systems in the Mediterranean (CNR-I.S.A.FO.M.), Via Patacca, 85-80056 Ercolano (NA), Italy
3
Department of Agricultural Sciences, University of Naples Federico II, 80050 Portici, Italy
4
Lebanese Agricultural Research Institute, P.O. Box 287, Tal Amara, Lebanon
5
CIHEAM—Mediterranean Agronomic Institute of Bari, Via Ceglie 9, 70010 Valenzano (BA), Italy
*
Author to whom correspondence should be addressed.
Submission received: 10 June 2019 / Revised: 20 June 2019 / Accepted: 20 June 2019 / Published: 17 July 2019
(This article belongs to the Special Issue Agricultural Water Management)

Abstract

:
Variable rainfall, water stress, and spring frost are the main challenges for cereal growers in the Mediterranean region. The potential of wheat and barley to adapt to contrasting weather conditions was investigated through the adoption of no-till, supplemental irrigation and drought tolerant cultivars over a period of three years. Seasonal precipitation was 732, 336 and 685 mm in the first, second and third seasons, respectively. The second and third seasons were characterized by the occurrence of spring frost. No tillage did not affect productivity in either crop, while supplemental irrigation increased yield only in barley. For wheat, the grain yield was 60 and 43% respectively lower in the second and third seasons than in the first season. For barley, grain yield was 43% higher in the first season than the other two. The negative effect of frost on wheat yield was indirectly assessed by crop growth simulation. Principal component analysis shows that freezing temperatures associated with spring frost and rainfall both dictated crop growth and productivity.

1. Introduction

Cereal production systems are facing challenges posed by climate change, water scarcity, increasing population and economic fluctuations, particularly in semi-arid regions [1,2,3]. The variability of water and temperature regimes definitely affects yield stability, resulting in global food insecurity [4,5,6,7,8,9]. Asseng et al. [10] estimated for wheat a yield loss of 6% per temperature degree increase due to climate change, which corresponds to a quarter of all global wheat trade. Moreover, the variability in water use conditions will enhance variations in the water use efficiency of cereal systems in arid and semi-arid areas [11]. Spring frost occurrence will also negatively affect crop productivity, resulting in increased yield variability [12,13].
Soil tillage and water management, as well as stress-tolerant cultivars, have been promoted as potentially important measures for adaptation to climate change. In particular, no-till as a practice of conservation agriculture was investigated in different studies worldwide [14,15,16]. Chen et al. [17] demonstrated that under no-till practice, soybean yield increased by 14% in the northern region of Northeast China. Sombrero and De Benito [18] reported that the effectiveness of no-till practice depends on soil type and crops. Areas under no-till have spread across all continents and many agro-ecologies [19]. No-tillage has been considered important in the mitigation of climate change effects due to soil carbon sequestration [20,21]. Tillage effects on soil properties are usually site-specific and depend upon the interaction of climatic conditions with soil and crop management practices [22]. Among agronomic practices that could be considered as adaptation measures to climate change, rational supplemental irrigation is widely recognized as one of the most feasible means of increasing cereal yield and water use efficiency in dry areas [23,24,25,26,27]. In fact, yields of rainfed cereals vary with seasonal rainfall and its distribution [28,29]. However, applying supplemental irrigation depends on the availability of sufficient water resources [30]. In addition to the different water and soil conservation practices, choosing suitable cultivars plays a major role for securing yield stability under stress conditions. Therefore, intensive research is needed to achieve high-yielding and stress-tolerant cultivars [31,32,33,34].
Lebanon, with a Mediterranean climate type, has an increasing deficit in cereal production. Wheat and barley are the two major cereals cultivated in Lebanon and represent strategic crops for food security. According to the recent Agricultural Census [35], wheat constitutes almost 66% of the area cropped with cereals in Lebanon. In the Bekaa valley, an inland part of Lebanon, the area cropped with wheat and barley is 29,840 ha and 10,685 ha, respectively. The valley, considered as the food basket of Lebanon, accounts for 58% and 88% of wheat and barley production, respectively [35]. According to the Second National Communication Strategy to the UNFCCC [36], the Bekaa valley was classified as highly vulnerable to climate change. Temperature in the mainland will increase by 2 °C and rainfall will decrease by 10%–20% by 2040 compared to the present, leading to dryer and warmer conditions. Temperature and precipitation extremes will also intensify. All these unfavorable climatic conditions will greatly impair cereal production [36].
A recent investigation highlighted that cereal yields in the Bekaa valley are low and variable mainly as a result of inadequate and erratic seasonal rainfall, spring frost occurrence, as well as associated management factors such as continuous soil tillage and non-rational supplemental irrigation [37]. According to Karam et al. [38], average rainfed-wheat yields across years in the Bekaa valley fluctuate between 3 to 3.5 t ha−1, which is 22% to 28% less than yields under supplemental irrigation, depending on cultivars. Frost damage early in spring and high temperatures and water stress during grain filling late in spring, are the challenges for cereal growers in the Bekaa valley. Under such conditions, benefits would be gained by water conservation opportunities with no-till practice, stress-tolerant cultivars, and rational supplemental irrigation. However, the adoption of no-till by farmers has been slow, but it is nonetheless occurring gradually [39].
The objective of the research presented here was to assess the most appropriate adaptation measures to climate change impacts on the yields of cereal grown under the semi-arid conditions of the Mediterranean region. The effectiveness of on-farm water-productive techniques, i.e., mainly rational spring supplemental irrigation and no-till, combined with stress tolerant wheat and barley cultivars, was tested.

2. Materials and Methods

2.1. Experimental Site and Climate Conditions

The field experiments were carried out in Tal Amara located in the Bekaa valley (Lebanon) (33°51′44″ N latitude, 35°59′32″ E longitude and 905 m above sea level) at the experimental station of the Lebanese Agricultural Research Institute (LARI) during three consecutive growing seasons: 2012–2013, 2013–2014 and 2014–2015.
The climate is typically Mediterranean, characterized by an average annual rainfall of 592 mm mostly concentrated in autumn and winter months (October to March). Tal Amara has a hot and dry season from April to October and a cold season for the remainder of the year. The main weather parameters, including solar radiation, air temperature, relative humidity, and precipitation, were obtained from a standard agro-meteorological station located about 100 m from the experimental field. The soil of study area in Bekaa valley is classified as calcaric Fluvisol. The depth was 0.9 m, and the percentage of clay, sand, and silt were 44%, 31% and 25%, respectively. The main chemical and physical soil characteristics measured at the beginning of the experiment were: pH 8 (1:2.5 soil/water extract); electrical conductivity ECe = 0.43 dS m−1 (1:2 soil/water extract); saturated hydraulic conductivity 42 mm day−1; bulk density 1.41 kg dm−3, the soil total available water was 190 mm/m. Field slope is less than 0.1%.

2.2. Treatments and Agronomic Management

Durum wheat (Triticum durum Desf.) and barley (Hordeum vulgare L.) were sown in rows 15 cm apart. The response of both crops was assessed for two water supply regimes rainfed (RF) and spring supplemental irrigation (SI) and under two soil agronomic management: conventional tillage (CT) and No-till (NT) in two separated experiments. In both experiments, two cultivars for each crop were combined with the investigated management practices: “Icarasha” (W1) and “Miki” (W2) for wheat, “Assi” (B1) and “Rihane” (B2) for barley (Table 1). The chosen wheat and barley cultivars were drought-tolerant and were recently released by LARI [40]. The seeding rate was 250 kg ha−1, according to the standard practices in the central Bekaa valley. A conventional seeder was used to sow the treatments under CT, while a no-till seeder was used for the treatments under NT.
In total, each experiment consisted of eight treatments with three replicates per treatment (Table 1).
Treatments were arranged in a split–split plot design. Agronomic management (conventional tillage/no-till) was the main plot factor, water regime (rainfed/supplemental irrigation) was the sub-plot factor and cultivar was the sub-sub-plot factor. Each experimental plot was 7 m × 7 m. The dates and duration of the main phenological stages of both crops are reported in Table 2.
The whole experimental field had not been subjected to tillage over the previous eight years. At the beginning of the field experiments, the plots under conventional tillage were conventionally ploughed at 30 cm depth.
Irrigation was managed according to local practices aiming to save water resources, which are under threat due to ongoing climate change pressure. Consequently, water was supplied only during the grain-filling, which is a very drought sensitive stage [41].
Irrigation volume was calculated by an Excel-based irrigation tool [42], which uses meteorological, soil and crop data for a day-by-day estimation of the soil water balance in the effective root zone. Daily reference evapotranspiration was calculated from measured weather data using the FAO Penman-Monteith equation [36]. The crop coefficient (Kc) was adopted on the basis of crop phenological stages according to FAO paper N. 56 [40]. Kc was 0.5 during the initial growing stage and at the end of the season and 1.1 during the mid-season (the period from flowering to milk maturity). The allowable depletion of 95 mm was calculated as 0.5 of total available soil water (190 mm) during the whole growing cycle [43]. Runoff and capillary rise were assumed to be negligible, while deep percolation was calculated as the surplus of water over field capacity in the root zone caused by excessive precipitation and/or irrigation. Since the starting of grain filling stage, each time the readily available water was depleted, an amount of 95 mm of water was given in order to replenish the soil moisture back to field capacity. Irrigations occurred on 28 April 2013, while in the season 2014, 95 mm were given on 13 April and again on 30 April. In the season 2015, 95 mm were provided on 9 May and then again, the same amount was given on 19 May. A drip irrigation system involving drippers of 4 L h−1 and drip lines distanced by 40 cm and 70 cm, respectively, was used. A flow-meter was placed on the mainline of the experimental field to accurately measure the amount of water supplied at each irrigation.
N fertilizer was applied as ammonium nitrate (33% of N) at sowing and tillering stages at the rate of 60 kg (N) ha−1, while P fertilizer was applied as diammonium phosphate (18%–46%) only at sowing at the rate of 10 kg (P) ha−1.

2.3. Growth Parameters, Biomass, Yield and Water Use Efficiencies

Phenology was recorded according to Zadoks et al. [44]. Above-ground biomass (AGB) during the whole crop cycle was measured on 0.25 m2 (0.5 m × 0.5 m) surface samples for each plot. Plant sampling was performed, almost regularly during the season, on a 2-week interval. The above-ground biomass was determined by oven drying samples at 70 °C until a constant weight was reached. Canopy cover was measured almost at the same interval of AGB, by taking zenithal photos; then, the photos were processed using ImageJ software in order to estimate the percentage of canopy cover.
At physiological maturity, yield and its components (grains per spike, grain number per m2 and mean grain weight) were measured by harvesting a sample area of 1 m2 at the center of each plot. Harvest index (HI) was also calculated as grain to above ground dry biomass ratio.
Irrigation water use efficiency (expressed in kg m−3) was calculated as the ratio of aboveground dry biomass or dry grain yield to the seasonal rain + irrigation (yield water use efficiency—IWUEy; biomass water use efficiency—IWUEb).

2.4. Soil-Plant Atmosphere Model

The water balance in the soil-plant-atmosphere system was investigated using the SWAP model [45]. This calculates the soil water flow by solving the Richards’ equation, which requires known functions of water retention and hydraulic conductivity.
Van Genuchten [46] proposes soil water retention and hydraulic conductivity functions expressed here in terms of the effective saturation Se, and relative hydraulic conductivity, respectively:
S e = [ 1 1 + ( α | h | ) n ] m
K r ( S e ) = K ( S e ) K 0 = S e τ × [ 1 ( 1 S e 1 m ) m ] 2
with Se = (θθr)/(θ0θr), θr and θ0 being the residual water content and the water content at h = 0, respectively, and in which α (cm−1), n, and m=1-1/n are curve-fitting parameters. k0 is the hydraulic conductivity at θ0, and τ is a parameter which accounts for the tortuosity and partial correlation between adjacent pores.
Upper boundary condition includes precipitation, potential evapotranspiration (ETp) and in case irrigation. According to Ritchie [47] ETp is partitioned into potential transpiration (Tp) and potential evaporation (Ep). Unit gradient (dH/dz = −1) was assumed at lower boundary condition.
Water uptake, S (h), considered an additive term in the Richards’ equation, is described in the following equation as a function of the pressure head, h [48]:
S ( h ) = α ( h ) × S m a x = α ( h ) · T p / | z r |
with zr (cm) being the thickness of the root zone and α (h) a semi-empirical function of pressure head h, varying between 0 and 1. The shape of the function α (h) depends on some critical values of h, which are related to crop type (wheat and barley) and to the level of potential transpiration rate: the pressure head below which roots start to extract water from the soil, h1 = 0 cm; the pressure head below which roots extract water at the maximum possible rate in the top- and sub-layer, h2top = −1 cm, h2sub = −25 cm; the pressure head below which roots cannot longer extract water at the high transpiration rate (0.5 cm d−1), h3High = −500 cm; the pressure head below which roots cannot longer extract water at the low transpiration rate (0.1 cm d−1), h3Low = −900 cm; the pressure head below which root water uptake ceases h4 = −16,000 cm.
The actual transpiration rate Tact (cm d−1) is then computed by the integration of S over the root layer.
To get a reliable soil water balance, a calibration procedure is required. Details on the model calibration at the same experimental field can be found in Bonfante et al. [49]. Above ground biomass (AGB) was estimated by SWAP model on the basis of normalized water productivity concept [50], as follows: AGB = −0.3534 + 0.0175 × Σ Tact/ETp [49].

2.5. Statistical Analysis

Each dependent variable was preliminary evaluated for normal distribution according to the Kolmogorov-Smirnov test [51]. Combined analyses were run for all three years after verifying the homogeneity of error variances using Bartlett’s chi-square test [52]. A 3-way ANOVA, repeated over years, was used for data analysis, whereby factors (agronomic management, water regime and cultivar) and their interactions were treated as fixed effects, while year, block nested within year and year × block × treatments factors interactions were considered random. Statistical analyses were performed through the GLM procedure of SAS/STAT. Duncan test at 0.05 probability level was used a mean separation test. Both were executed using SAS® University Edition.
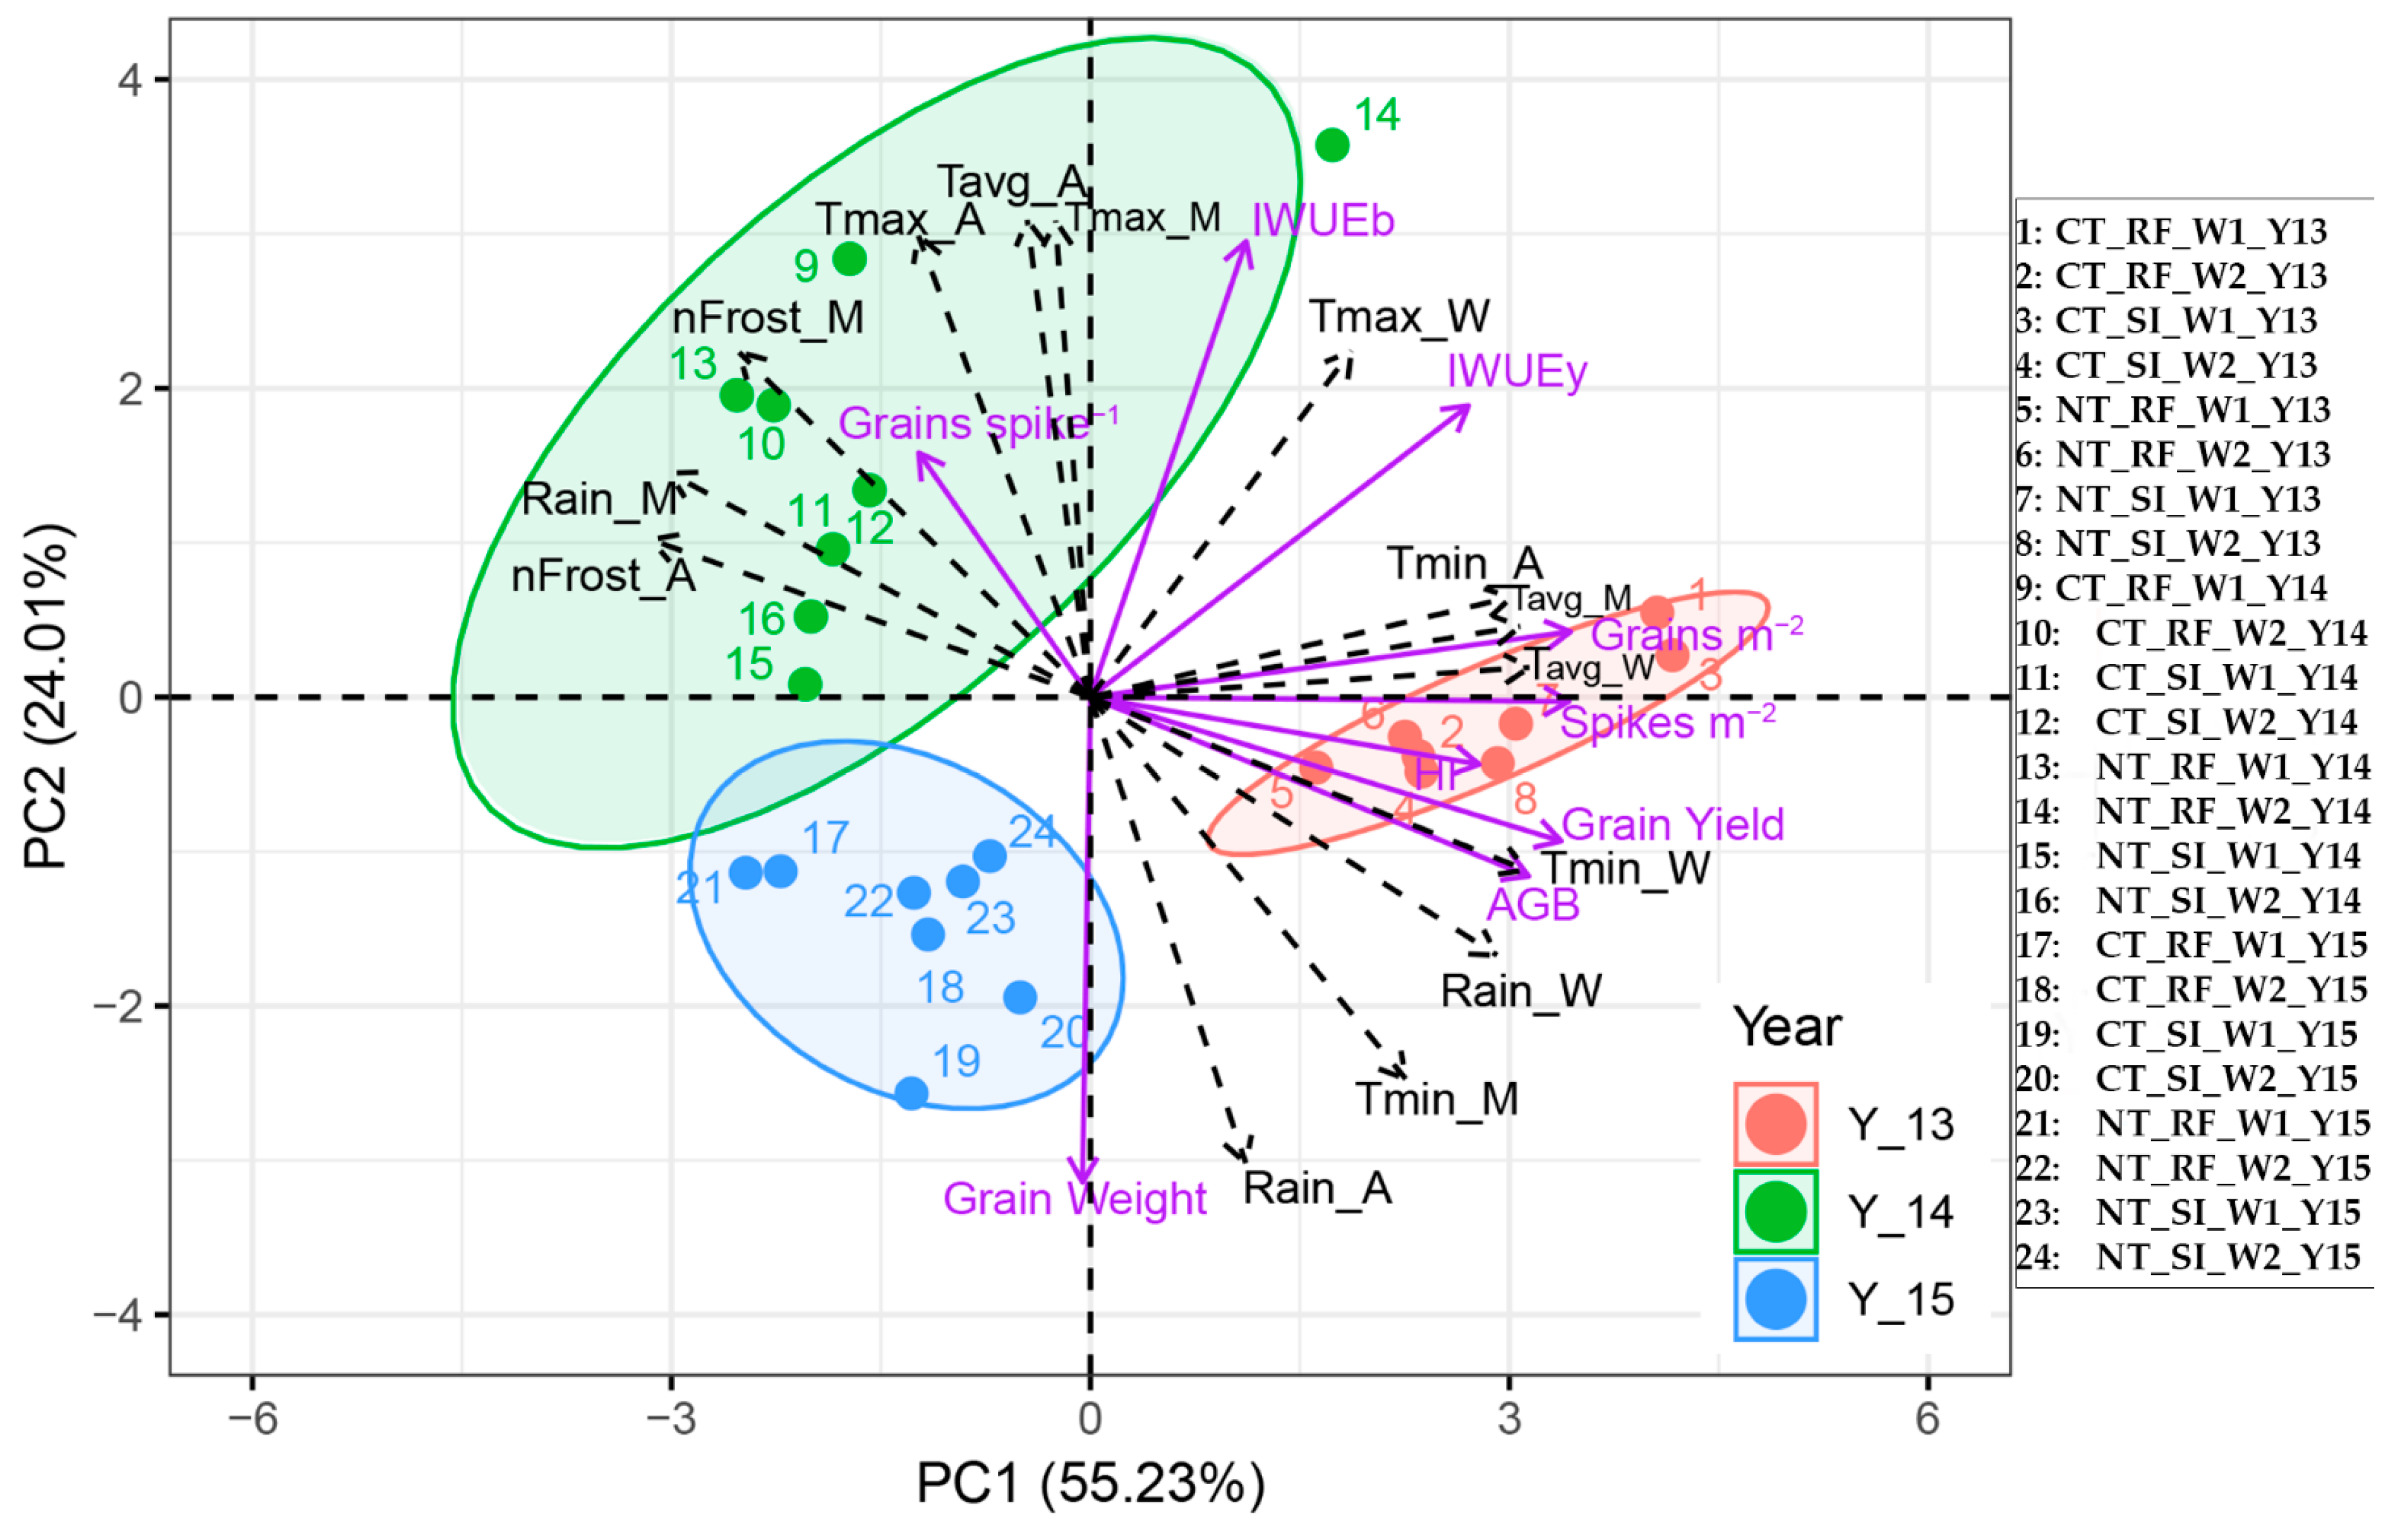
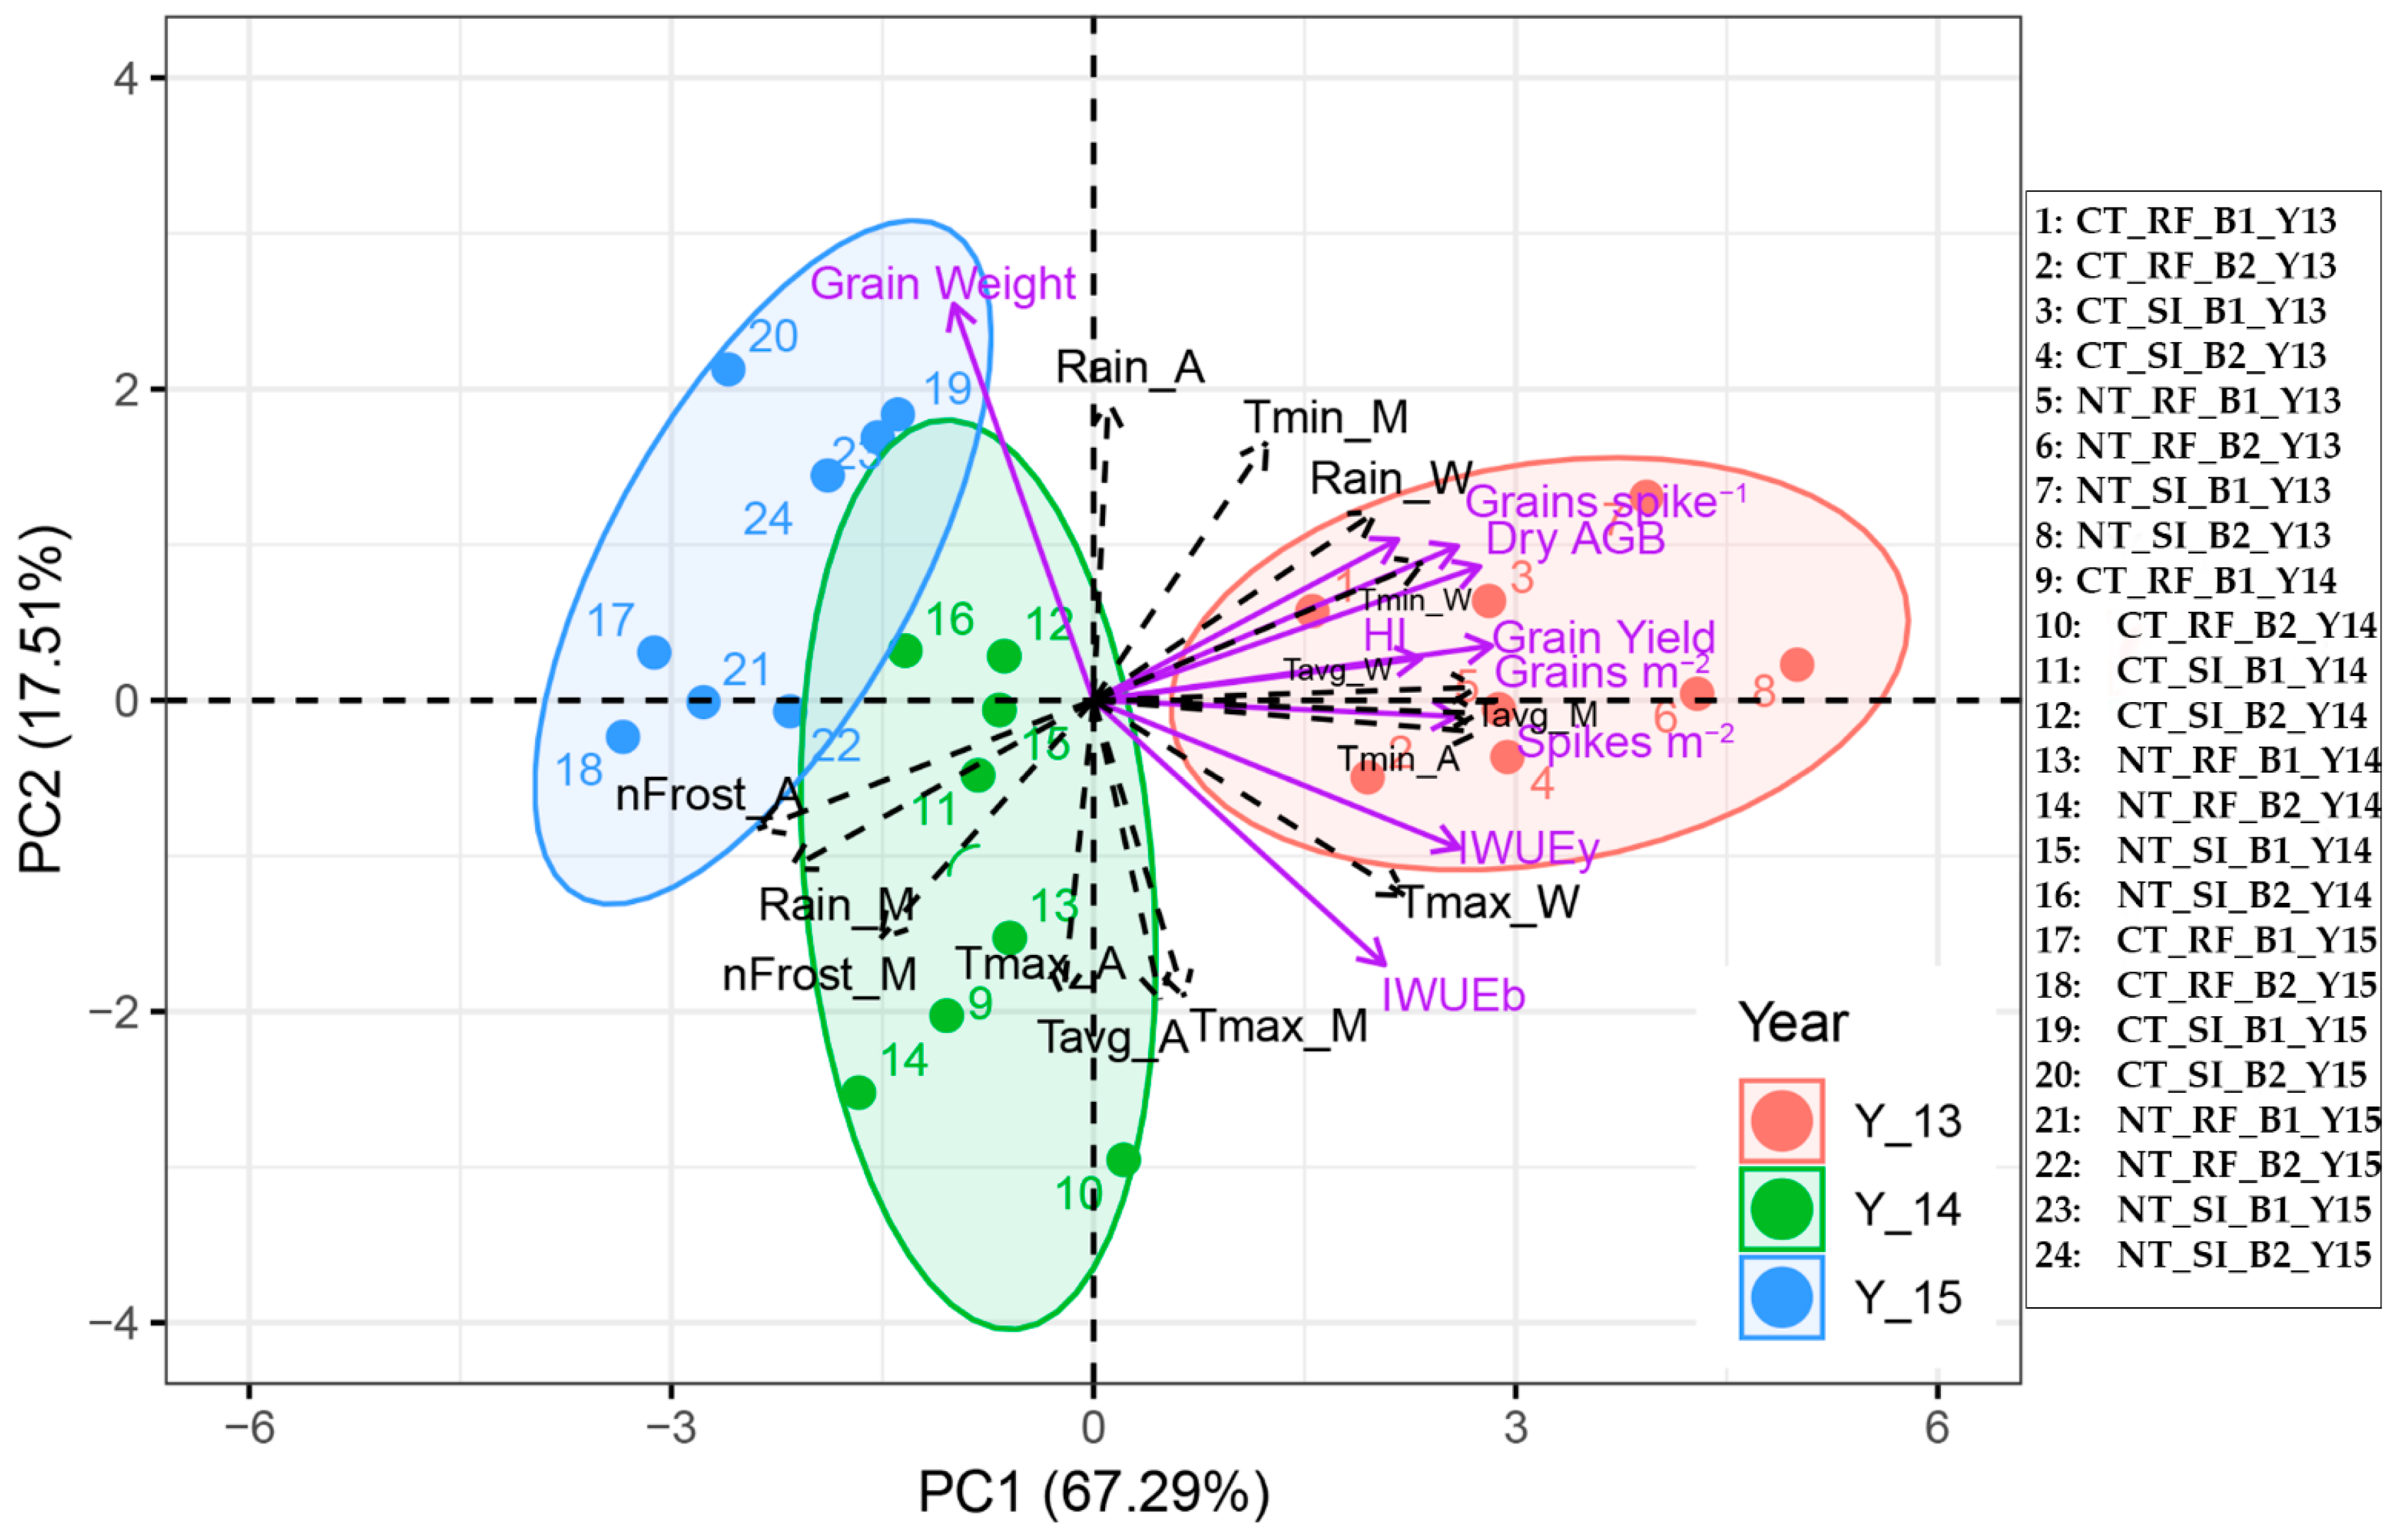
Principal component analysis (PCA) using the correlation matrix was performed on yield, yield components, IWUEy and IWUEb to explore relationships among variables and treatments and also to determine which traits were the most effective in discriminating between soil tillage practice, water regime, and cultivar. PCA outputs included treatment component scores and variable loadings to each selected component. The first two principal components (PC1 and PC2) were selected for the ordination analysis, and the correlation between the original traits and the respective PC was calculated. The PCs with eigenvalues greater than 1 were selected, [53] and loadings greater than |0.6| indicate significant correlations between the original variables and the extracted components [54]. This analysis was carried out using the software package FactoMineR [55] in R studio software [56]. The package is available via the Comprehensive R Archive Network (CRAN, https://cran.r-project.org).

3. Results

3.1. Weather Conditions

The weather regime in terms of precipitation (P), reference evapotranspiration (ETo), minimum and maximum temperatures (Tmin and Tmax) and the lowest minimum temperature reached during each month (Tmin-lowest) for the three growing seasons as compared to the year historical means (1954–2010) are given in Table 3.
Seasonal precipitation (Nov-Jun) was 732, 336 and 685 mm in the first, second and third growing season, respectively, while the historical average was 570 mm. After computing the Standardized Precipitation Index (SPI), one of the most widely used drought indices, designed by McKee et al. [57], the first (2012–2013) and third (2014–2015) growing seasons were classified as normal (SPI = 0.39 and 0.29, respectively), whereas the second (2013–2014) season was considered extremely dry (SPI = −4.38).
Overall average Tmax during the first and second growing seasons was 0.4 and 0.9 °C, respectively, greater than the historical average value, whereas it was 1.1 °C lower in the third season. The relatively warm weather conditions that prevailed during the first and second seasons increased seasonal ETo compared to the third growing season. Consistently, seasonal ETo (November–June, Table 3) was in the first (810 mm) and second season (848 mm) higher than the last year (785 mm). The trial carried out in the third season was characterized by much colder winter season (January–February) compared to the other two growing seasons: it was especially evident in January 2015 (tillering stage) with the minimum air temperature respectively 3.5 and 1.8 °C lower than the value recorded in the same month in both 2013 and 2014. During grain filling stage (April–May) minimum temperature below zero occurred on 8 days in 2014 and 5 days in 2015 (Figure 1).

3.2. Biomass, Yield and Irrigation Water Use Efficiencies

In the wheat experiment, AGB, grain yield and HI were significantly different from one year to the next (Table 4), with the highest values for the first and the lowest values for the second season (Table 5). The effect of the year was also evident on both weight of grains and the number of grains per square meter, although the values of both parameters were missing in the first year. Grain yield was 60% and 43%, respectively, lower in the second and third seasons in respect to the first season. The AGB was 49% and 31% less in the second and third seasons, respectively, as compared to the first season. Considering the other sources of variance (management practice, water regime and cultivar), the above-mentioned parameters were not significantly different. Irrigation water use efficiencies were significantly affected by the year: IWUEb was 22%, and IWUEy was 37% lower in the third than the first season. IWUEb was also significantly affected by water regime (Table 4 and Table 5).
In the barley experiment, grain yield, AGB, the number of grains per spike and HI were significantly different from one growing season to the next (Table 6), with the highest value for the first and the lowest value for the second season (Table 7). The grain weight was significantly higher in the third than the second year. Grain yield was 43% and AGB about two-fold higher in the first compared to the other two seasons. All examined variables were not affected by management tillage as well as by cultivar (Table 6). As regard water regime, the grain yield was 72% significantly higher in SI than RF (Table 7). The year also significantly affected both IWUEy and IWUEb (Table 6), which were 37% and 55%, respectively, lower in the third than the first season (Table 7). Management tillage, water regime and cultivar did not affect both IWUEy and IWUEb.

3.3. Principal Component Analysis.

To obtain a comprehensive overview of the morphological traits, yield, yield components and IWUE of wheat and barley in response to cultivar, management tillage, water supply regimes and growing seasons, the whole data set, including the climatic parameters during the three consecutive growing seasons, was subjected to principal component analysis (PCA). For both crops, the first two principal components (PCs) were associated with eigenvalues higher than one, and explained 79 and 85% of the cumulative variance for wheat and barley, respectively. PC1 accounted for 55% and 67% and PC2 for 24% and 18% for wheat and barley, respectively (Table 8 and Table 9).
For wheat, PC1 was positively and strongly correlated (>0.6) with grain yield, AGB, harvest index, grains per square meter, IWUEy, spike per square meter, minimum temperature in winter and April, average temperature in winter and May. PC1 was also negatively correlated with the number of frost days during April and May as well as to rainfall during May (Table 8). PC2 was positively correlated with increased weight of 1000 grains, and negatively correlated with IWUEb and maximum air temperature during winter, April and May (Table 8).
In barley, PC1 was positively correlated with grain yield, AGB, HI, grains per square meter, spike per square meter, grains per spike, IWUEb, IWUEy, minimum, maximum, average temperature and rainfall during winter, whereas PC2 was significantly correlated only with the weight of 1000 grains. PC2 was negatively correlated with maximum and average temperature in April, as well as with maximum air temperature and number of frost days during May (Table 9).
The loading plots (Figure 2 and Figure 3) illustrate the relationships among variables where two vectors with an angle <90° are positively correlated and two vectors with an angle >90° are not correlated. In wheat, the variation in spike per square meter was most closely aligned to that of grains per square meter, and variation in grain yield was more strongly correlated with AGB rather than weight of 1000 grains, whereas variation in grain yield was not correlated with the number of frost days during April and May (Figure 2). In barley, yield was strongly correlated with 1000 grains per square meter and AGB, whereas yield was not correlated with the weight of 1000 grains as well as the number of days per month (April and May) with minimum temperature below 0 °C (Figure 3).
In the current study, the score plot of the PCA highlighted crucial information on agronomical traits, as well as on IWUE for both wheat and barley in relation to the growing seasons, expressed in terms of temperature, rainfall and number of frost days. For instance, the positive side of PC1, in particular the lower right quadrant (C), included both water supply regimes and management tillage as well as both cultivars for the 2013 growing season (Figure 2). The treatments from the lower right quadrant were characterized by high yield, AGB, spike per square meter, grains per square meter and HI. Wheat cultivar Miki cultivated under no-tillage and rainfed conditions (upper right quadrant; A) delivered wheat plants with high IWUEb (Figure 2). Finally, the treatments from the lower and upper left quadrant (C and D) (treatments coming from 2014 and 2015 growing seasons) were characterized by lower growth and productivity (only high weight of 1000 grains for the 2015 growing season). The low crop growth and productivity in both 2014 and 2015 was mainly related to spring frost. In barley, similarly to wheat, the highest spike per square meter, grain yield, dry AGB, HI, grains per spike and grains per square meter were recorded in 2013 irrespective of treatments (Figure 3). All treatments coming from the 2015 growing season were characterized by an increased 1000 seeds weight, whereas those of 2014 depicted barley of lowest agronomic traits (Figure 3). The results of the PCA may provide the basis for a more in-depth approach to elucidate the effects of cultivar, water regime, agronomic management and climatic factors among years (rainfall, number of frost days and maximum temperature) on the agronomical behavior of these two important cereal crops grown under semi-arid conditions.

3.4. Water Balance Simulation

The ratio between actual and potential transpiration (Tact/Tp), which was simulated using the SWAP model, is widely recognized as a water stress index. For conventional tillage under supplementary irrigation in the three growing seasons, Tact/Tp was proximal to one along both 2012–2013 and 2014–2015 growing seasons, except for two short periods at the end of March and at the beginning of May 2013 (Figure 4a,c). During the season 2013-14, at beginning of March, beginning of April and end of May, Tact/Tp reached the very low peaks of 0.4, 0.1 and 0.2 (Figure 4b). A similar behavior was found for no-till practice (data not shown). The rainfall was irregularly distributed during the 2012–2013 with high amount occurred during the winter time, and low amount during spring, whereas 2013–2014 and 2014–2015 growing seasons both showed a more regular rainfall distribution.

4. Discussion

Cereal yields in the Mediterranean basin are variable, mainly because of inadequate and erratic seasonal rainfall [37,38] and extreme events such as spring frost occurrence [58]. The rainfall distribution during the growing season greatly affected the behavior of the two crops. It is widely reported in the literature that yields of cereals vary not only in relation to seasonal rainfall, but also to its distribution [28,29,59,
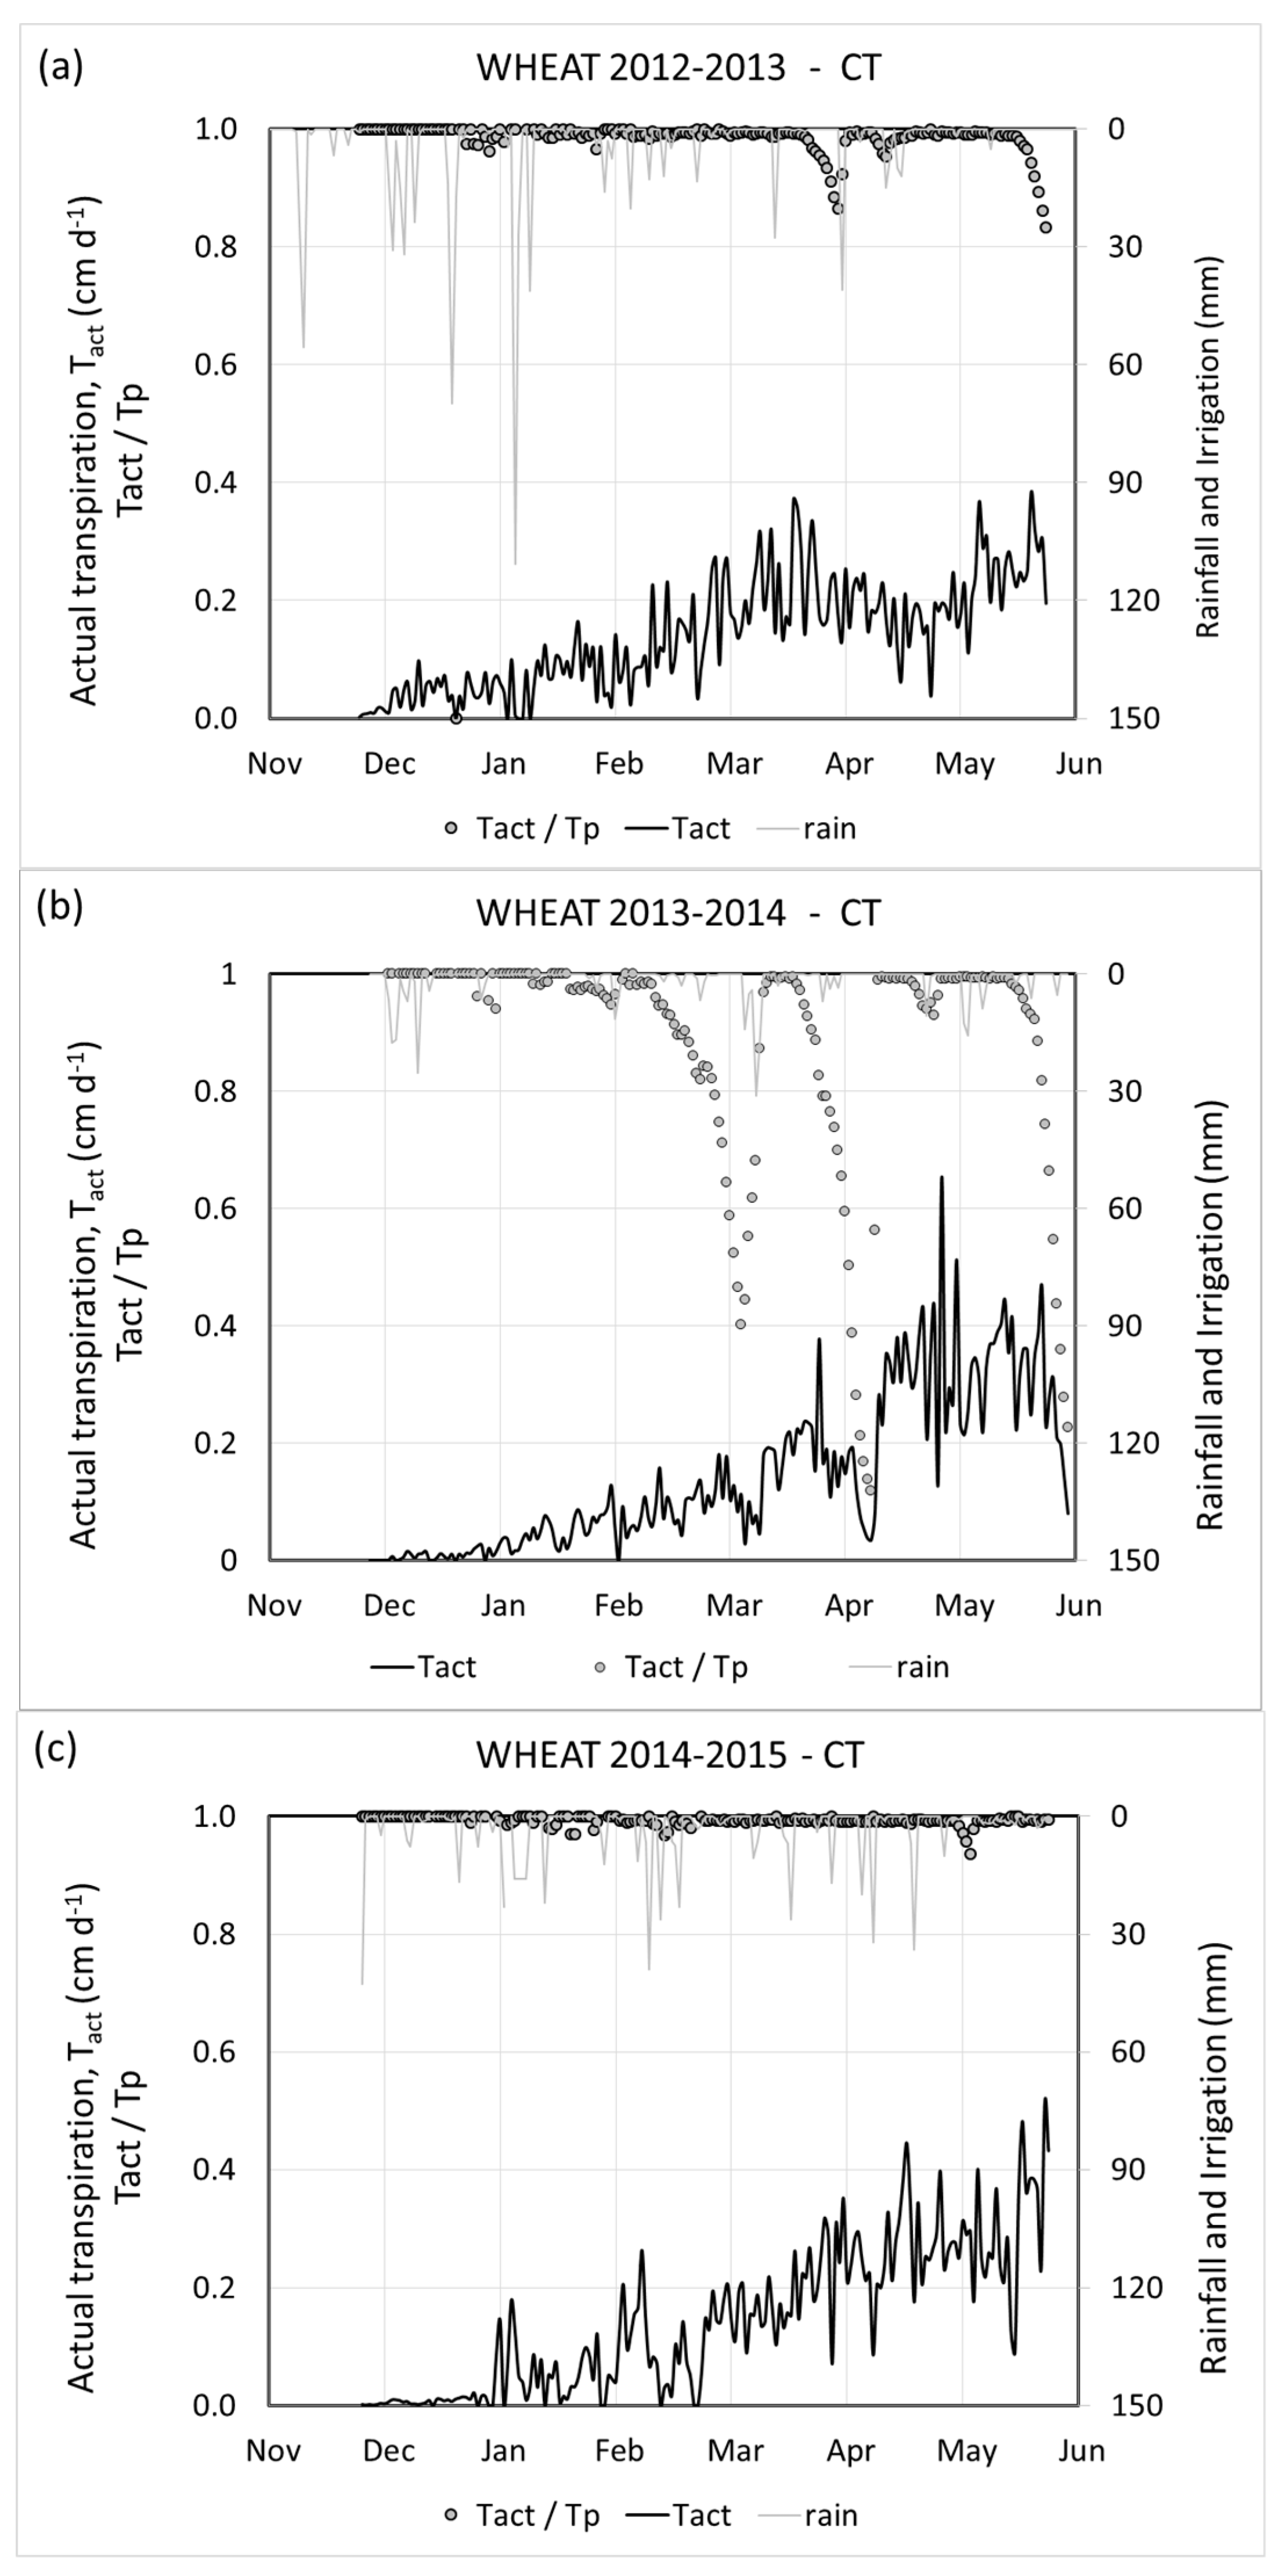
60]. In our experiment, the first season imposed favorable environmental conditions to the crops, as compared to the other two growing seasons. In comparison with the first, the second growing season had half amount of rainfall (lowest SPI), higher ETo and higher air temperature, which imposed more severe stress conditions. This was evident also from the simulated water stress index (Tact/Tp), which remained proximal to unit during first and third seasons. Conversely, two periods of stress (minimum peaks of Tact/Tp of 0.4 and 0.1) occurred in the second season, before the irrigation at grain-filling stage recovered any further crop stress. The second season was characterized by a combination of drought and heat stress, which synergistic interaction is known to exacerbate the negative effects on growth, yield and its components [61,62].
The yields of both crops in the second season were about 40% lower compared to the first season, mostly due to halved dry matter, and to a lesser extent to lower harvest index. Our results agree with what reported in wheat by many authors [27,30,63,
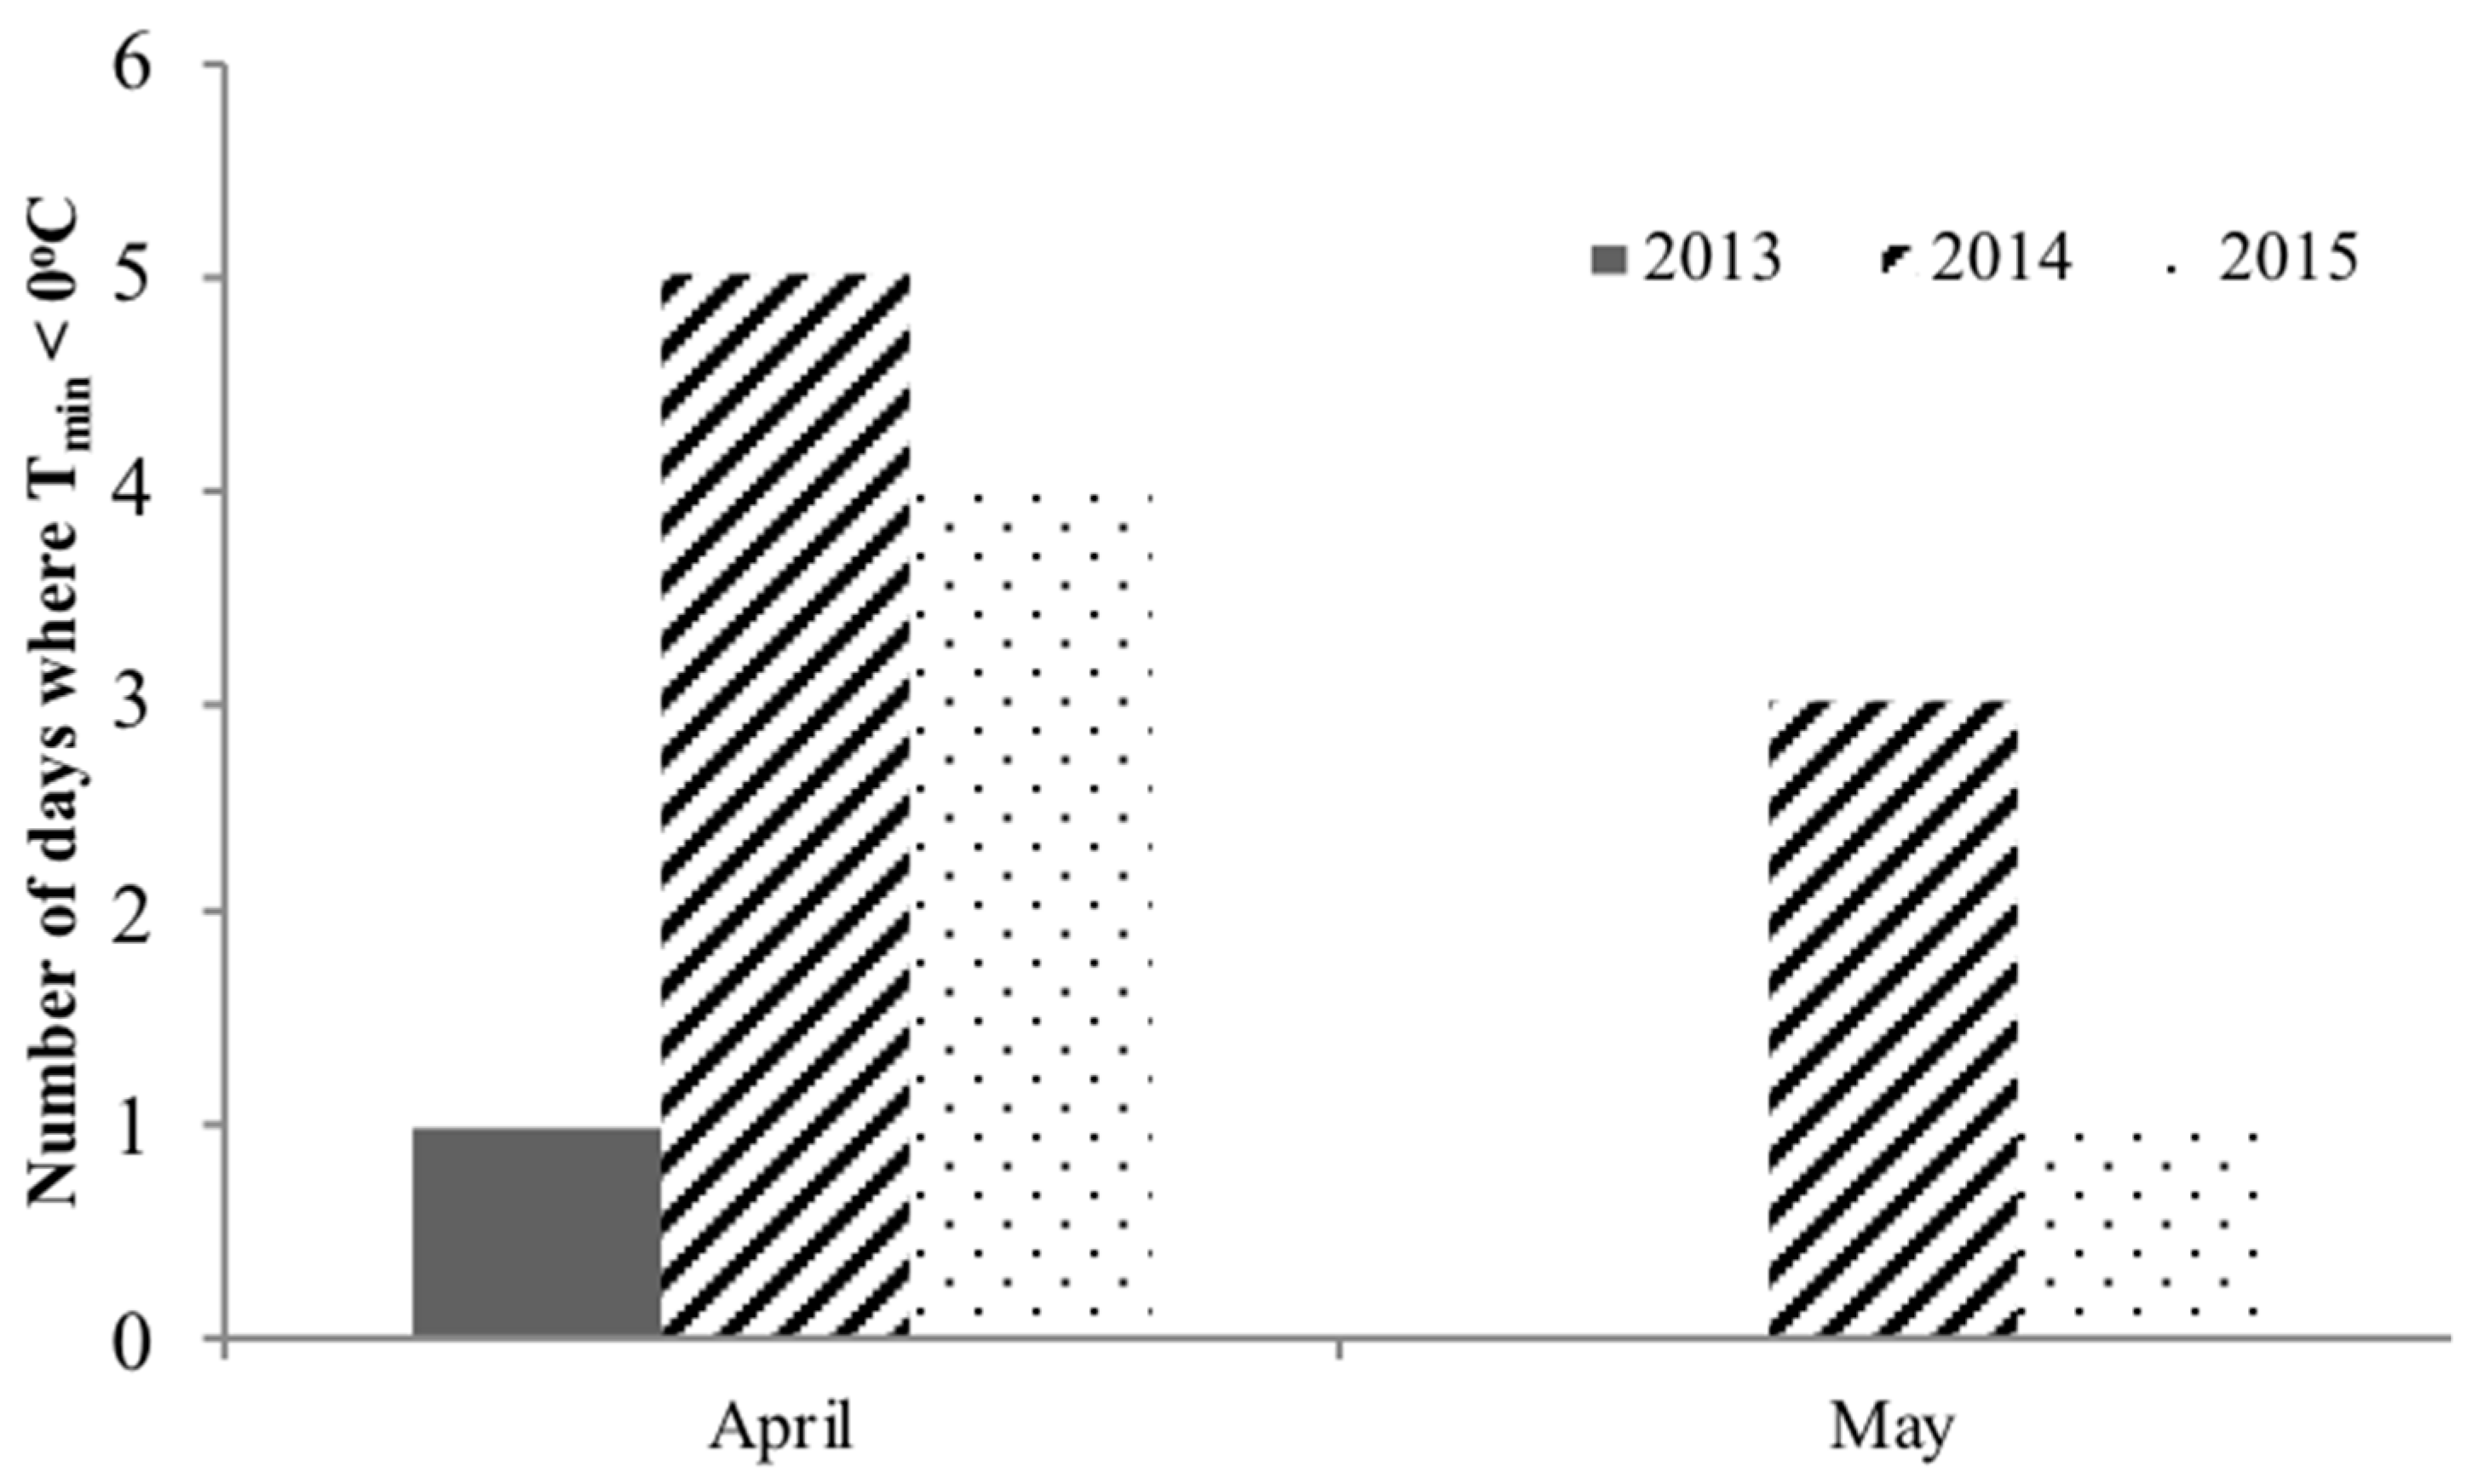
64] who found that limited rainfall at either anthesis or grain setting stage (April) affected grain weight more than grain number per square meter, as it occurred in the second year of our experiments. Moreover, in the second season, in addition to drought conditions, crops experienced more nights with freezing-temperature than the other two seasons. The frost nights in the second season certainly caused further yield reduction. In fact, some frost events occurred as well in the third season, resulted in yield of wheat significantly lower (57%) than the first season, despite comparable rainfalls and SPI, and a better distribution in the third season. Frost also affected barley yield. However, in the most unfavorable season (second one) yield was not lower than the third season yield, probably because the latter was impaired by the lodging, which we observed at maturity by visual inspection.
It is worth noting the detrimental effect of spring frost on yields, caused by low night temperature, low humidity and still air under clear sky, which boost radiant energy loss from soil and crop. Frost can affect cereal productivity in otherwise warm environments such as in the Mediterranean and continental areas [58,65,66]. In their review, Barlow et al. [58] concluded that sterility and grain abortion at anthesis are the main causes of cereal yield reduction. Accordingly, frost was found to be responsible for damages during active growth, head formation and flowering in both wheat and barley by Asseng et al. [40] and by Fredricks et al. [67]. Moreover, in the near future, both “last frost” and “first heat” during the growing season are predicted to occur early than present [68] leading to further negative climate change effects on cereal productivity. In our study, frost nights at flowering and grain filling stages (April–May) occurred on 8 days in the second season and 5 days in the third growing season. Zheng et al. [13] reviewed that a single frost event occurring between mid-heading and start of dough maturity can be responsible for up to 90% yield loss in wheat. The significant reduction of wheat yield in the third compared to the first season, despite almost similar rainfall and a better distribution, can be ascribed to the frost events in April and May. In the second growing season, instead, frost occurrence negatively affected yield in addition to water stress.
In order to sustain such an interpretation of data and to indirectly quantify the frost effect, the SWAP model was used to simulate AGB in wheat for both traditional and conservation tillage under supplemental irrigation. Results were expressed by the relative difference between simulated and measured above ground biomass, (AGBsim-AGBmeas)/AGBsim × 100. In absence of freezing temperatures as occurred only in the first growing season, SWAP model well simulated AGB, because the ratio was only −4%. Conversely, the ratio increased to 44% in the second season and 29% in the third seasons, which were characterized by 8 and 5 frost nights, respectively (Table 10). As the model does not take into account the frost effect on growth, the discrepancy between simulated and measured AGB may be ascribed to the frost effect in the third season, when no water limitation occurred (Figure 4c, Table 3), while the higher reduction observed in the second year was due to more frost events. Similar results were found for no-tillage.
Literature reports contrasting results on the effects of no-till on crop yields. For instance, Dalal et al. [69] reported higher wheat grain yield under no-till than conventional tillage. In contrast, according to meta-analysis performed on 260 studies, wheat yield was slightly reduced (−2.6%) in no-till as compared to conventional tillage [70]. Our results agree with Hernanz et al. [71], who found that yields of rainfed wheat and barley in monoculture were not affected by conservation tillage. It should be highlighted that in order to consider tillage soil management a valid option for sustainable agriculture, it is sufficient to have no reduction of yield, because the farmers would save money and energy [39].
In Mediterranean environments, the supplemental irrigation of cereals during reproduction and grain filling can contribute to alleviating yield reduction caused by drought [23,33,34,60]. Oweis et al. [26] reported for Iranian wheat cultivars supplied with 50 kg N ha−1, an amount that is comparable to our fertilization rate, a 26% yield increase in the 1/3 full irrigation treatment, while Zhang et al. [66] reported an increase of 36%. In our experiment, we found in wheat a comparable yield increase of 24% in response to irrigation, although it was not statistically significant. Karam et al. [38] found in the same site of our experiment that harvest index and water use efficiency in wheat were both not significantly affected by supplemental irrigation in agreement with our results. The supplemental irrigation at grain filling increased barley yield by +72%, which is much higher than the non-significant increase (22%) reported by Vahamidis et al. [72] in response to supplemental irrigation comparable to our watering volumes.

5. Conclusions

In this three-year study, the potential of cereal production systems to adapt to contrasting weather conditions was investigated. Different climate conditions over several years played a preeminent role on the yield of wheat, while the yield response of barley was mainly determined by supplemental irrigation. No-till practice can assure farmland sustainability because it guarantees similar yield as compared to conventional tillage. Modelling of wheat biomass indicated that the reduction observed in the third growing season as compared to the first season, which was characterized by absence of crop stress, was due to the occurrence of some night frost events in the spring. The further reduction observed in the second season was caused by the occurrence of more spring frost events. Our results imply that in order to minimize the negative effects on grain yield under frost risk conditions, irrigation strategy should be considered [58] by applying water before the occurrence of a frost event on the basis of early warnings. Overall, on-farm water-productive techniques, if coupled with improved irrigation management options, appropriate cultural practices and timely interventions for frost management, will help to improve cereal production as well as to secure yield stability. Such a combination of practices is needed to ensure the sustainability of agriculture in the Mediterranean region, particularly under the challenges of climate change and water scarcity.

Author Contributions

Conceptualization, M.T.A.S.; methodology, M.T.A.S.; formal analysis, M.H.S., A.B. (Angelo Basile) and A.B. (Antonello Bonfante); investigation, M.T.A.S., I.J., S.F., R.M., C.S., R.K., M.H.S. and A.B. (Antonello Bonfante); data curation, M.T.A.S. and M.H.S.; writing—original draft preparation, M.T.A.S., M.H.S., P.G. and R.A.; writing—review and editing, M.T.A.S., P.G., A.B. (Angelo Basile), R.A, Y.R.; visualization, M.T.A.S., M.H.S., P.G. and R.A.; supervision, M.T.A.S., R.A.; project administration, M.T.; funding acquisition, M.T.A.S.

Funding

This research was funded by EUROPEAN COMMISSION, within the project “ACLIMAS—Adaptation to Climate Change of Mediterranean Agricultural Systems—(ENPI/2011/269-668)” that is a demonstration project within the ‘Sustainable Water Integrated Management’ program—SWIM.

Acknowledgments

The authors gratefully acknowledge N. Orefice for soil hydraulic properties measurements.

Conflicts of Interest

The authors declare no conflict of interest.

References

  1. Eigenbrode, S.D.; Binna, W.P.; Huggina, D.R. Confronting Climate Change Challenges to Dryland Cereal Production: A Call for Collaborative, Transdisciplinary Research, and Producer Engagement. Front. Ecol. Evol. 2018, 5, 164. [Google Scholar] [CrossRef]
  2. Hubert, B.; Rosegrant, M.; van Boekel, M.A.J.S.; Ortiz, R. The future of food: Scenarios for 2050. Crop. Sci. 2010, 50, 33–50. [Google Scholar] [CrossRef]
  3. Keating, B.A.; Carberry, P.S.; Bindraban, P.S.; Asseng, S.; Meinke, H.; Dixon, J. Eco-efficient agriculture: Concepts, challenges, and opportunities. Crop. Sci. 2010, 50, 109–119. [Google Scholar] [CrossRef]
  4. Wang, J.; Vanga, S.K.; Saxena, R.; Orsat, V.; Raghavan, V. Effect of Climate Change on the Yield of Cereal Crops: A Review. Climate 2018, 6, 41. [Google Scholar] [CrossRef]
  5. Hochman, Z.; Van Rees, H.; Carberry, P.S.; Hunt, J.R.; McCown, R.L.; Gartmann, A.; Holzworth, D.; Van Rees, S.; Dalgliesh, N.P.; Long, W.; et al. Reinventing model-based decision support with Australian dry land farmers. 4.Yield Prophets helps farmers monitor and manage crops in a variable climate. Crop. Pasture Sci. 2009, 60, 1057–1070. [Google Scholar] [CrossRef]
  6. Chenu, K.; Deihimfard, R.; Chapman, S.C. Large-scale characterization of drought pattern: A continent-wide modelling approach applied to the Australian wheatbelt–spatial and temporal trends. New Phytol. 2013, 198, 801–820. [Google Scholar] [CrossRef]
  7. Bracho-Mujica, G.; Hayman, P.T.; Ostendorf, B. Modelling long-term risk profiles of wheat grain yield with limited climate data. Agric. Syst. 2019, 173, 393–402. [Google Scholar] [CrossRef]
  8. Lollato, R.P.; Edwards, J.T.; Ochsner, T.E. Meteorological limits to winter wheat productivity in the US southern Great Plains. Field Crops Res. 2017, 203, 212–226. [Google Scholar] [CrossRef]
  9. Sadok, W.; Schoppach, R.; Ghanem, M.E.; Zucca, C.; Sinclair, T.R. Wheat drought-tolerance to enhance food security in Tunisia, birthplace of the Arab Spring. Eur. J. Agron. 2019, 107, 1–9. [Google Scholar] [CrossRef]
  10. Asseng, S.; Ewert, F.; Martre, P.; Rötter, R.P.; Lobell, D.B.; Cammarano, D.; Kimball, B.A.; Ottman, M.J.; Wall, G.W.; White, J.W.; et al. Rising temperatures reduce global wheat production. Nat. Clim. Chang. 2015, 5, 143–147. [Google Scholar] [CrossRef]
  11. Jin, N.; Ren, W.; Tao, B.; He, L.; Ren, Q.; Li, S.; Yu, Q. Effects of water stress on water use efficiency of irrigated and rainfed wheat in the Loess Plateau, China. Sci. Total Environ. 2018, 642, 1–11. [Google Scholar] [CrossRef] [PubMed]
  12. Porter, J.R.; Xie, L.; Challinor, A.J.; Cochrane, K.; Howden, S.M.; Iqbal, M.M.; Lobell, D.B.; Travasso, M.I.; NetraChhetri, N.C.; Garrett, K.; et al. Food Security and Food Production Systems; Climate Change Cambridge University Press: Cambridge, UK; New York, NY, USA, 2014; pp. 485–533. [Google Scholar]
  13. Zheng, B.; Chapman, S.C.; Christopher, J.T.; Frederiks, T.M.; Chenu, K. Frost trends and their estimated impact on yield in the Australian wheat belt. J. Exp. Bot. 2015, 66, 3611–3623. [Google Scholar] [CrossRef] [PubMed]
  14. FAO. What is Conservation Agriculture? 2014. Available online: http://www.fao.org/ag/ca/1a.html (accessed on 1 April 2019).
  15. Pittelkow, C.M.; Liang, X.L.; Bruce, A.; Van Groenigen, K.J.; Lee, J.; Lundy, M.; van Gestel, N.; Six, J.; Venterea, R.T.; van Kessel, C. Productivity limits and potentials of the principles of conservation agriculture. Nature 2014, 517, 365–368. [Google Scholar] [CrossRef] [PubMed]
  16. Sayre, K.D.; Govaerts, B. The Principles of Conservation Agriculture. In Physiological Breeding I: Interdisciplinary Approaches to Improve Crop Adaptation; Reynolds, M., Pask, A., Mullan, D., Eds.; CIMMYT: Texcoco, Mexico, 2012; pp. 164–174. [Google Scholar]
  17. Chen, Y.; Liu, S.; Li, H.; Li, X.F.; Song, C.Y.; Cruse, R.M.; Zhang, X.Y. Effects of conservation tillage on corn and soybean yield in the humid continental climate region of Northeast China. Soil Till. Res. 2011, 115, 56–61. [Google Scholar] [CrossRef]
  18. Sombrero, A.; De Benito, A. Carbon accumulation in soil. Ten-year study of conservation tillage and crop rotation in a semi-arid area of Castile-Leon, Spain. Soil Tillage Res. 2010, 107, 64–70. [Google Scholar] [CrossRef]
  19. Derpsch, R.; Friedrich, T.; Kassam, A.; Hongwen, L. Current status of adoption of no-till farming in the world and some of its main benefits. Int. J. Agric. Biol. Eng. 2010, 3, 1–25. [Google Scholar]
  20. Lal, R.; Kimble, J.M.; Follett, R.F.; Cole, C.V. The Potential of U.S. Cropland to Sequester Carbon and Mitigate the Greenhouse Effect; Sleeping Bear Press: Chelsea, MI, USA, 1998. [Google Scholar]
  21. Lal, R. Soil carbon sequestration impacts on global climate change and food security. Science 2004, 304, 1623–1627. [Google Scholar] [CrossRef]
  22. So, H.B.; Kirchhof, G.; Bakker, R.; Smith, G.D. Low input tillage/cropping systems for limited resource areas. In ISTRO 2000 Proc. International Conference of the International Soil Tillage Research Organisation; CD-ROM; Morrison, J.E., Ed.; USDA-ARS: Temple, TX, USA, 2000. [Google Scholar]
  23. Cooper, P.J.M.; Gregory, P.J.; Tully, D.; Harris, H. Improving water-use efficiency in the rainfed farming systems of west Asia and north Africa. Exp. Agric. 1987, 23, 113–158. [Google Scholar] [CrossRef]
  24. Siddique, K.H.M.; Tennant, D.; Perry, M.W.; Belford, R.K. Water use and water use efficiency of old and modern wheat cultivars in a Mediterranean type environment. Aust. J. Agric. Res. 1990, 41, 431–447. [Google Scholar] [CrossRef]
  25. Anderson, W.K.; Smith, W.R. Yield advantage of semi dwarf compared to tall wheat depends on sowing time. Aust. J. Agric. Res. 1990, 41, 811–826. [Google Scholar] [CrossRef]
  26. Oweis, T.; Pala, M.; Ryan, J. Stabilizing rainfed wheat yields with supplemental irrigation and nitrogen in a Mediterranean climate. Agron. J. 1998, 90, 672–681. [Google Scholar] [CrossRef]
  27. Oweis, T.; Pala, M.; Ryan, J. Management alternatives for improved durum wheat production under supplemental irrigation in Syria. Eur. J. Agron. 1999, 11, 225–266. [Google Scholar] [CrossRef]
  28. Tavakkoli, A.R.; Oweis, T.Y. The role of supplemental irrigation and nitrogen in producing bread wheat in the highlands of Iran. Agric. Water Manag. 2004, 65, 225–236. [Google Scholar] [CrossRef]
  29. Simane, B. Drought Resistance in Durum Wheat. Ph.D. Thesis, Wageningen Agricultural University, Wageningen, The Netherlands, 1993. [Google Scholar]
  30. Karrou, M.; Oweis, T. Water and land productivities of wheat and food legumes with deficit supplemental irrigation in a Mediterranean environment. Agric. Water Manag. 2012, 107, 94–103. [Google Scholar] [CrossRef]
  31. Djanaguiraman, M.; Prasad, P.V.V. High temperature stress. In Plant Genetic Resources and Climate Change; Jackson, M., Ford-Lloyd, M., Parry, M., Eds.; CABI: Wallingford, UK, 2014; pp. 201–220. [Google Scholar]
  32. Djanaguiraman, M.; Vara Prasad, P.V.; Murugan, M.; Perumal, R.; Reddy, U.K. Physiological differences among sorghum (Sorghum bicolor L. Moench) genotypes under high temperature stress. Environ. Exp. Bot. 2014, 100, 43–54. [Google Scholar] [CrossRef]
  33. Reynolds, M.P.; Tattaris, M.; Cossani, C.M.; Ellis, M.; Yamaguchi-Shinozaki, K.; Saint Pierre, C. Exploring genetic resources to increase adaptation of wheat to climate change. In Advances in Wheat Genetics: From Genome to Field; Ogihara, Y., Takumi, S., Handa, H., Eds.; Springer: Tokyo, Japan, 2015; pp. 355–368. [Google Scholar]
  34. Sciarresi, C.; Patrignani, A.; Soltani, A.; Sinclair, T.; Lollato, R. Plant traits to increase winter wheat yield in semiarid and subhumid environments. Agron. J. 2019. [Google Scholar] [CrossRef]
  35. MoA/FAO. Agricultural Cencus; Ministry of Agriculture: Lebanon, 2010.
  36. UNDP/MoE. Second National Communication to the UNFCCC. 2011. Available online: http://unfccc.int/resource/docs/natc/lbnnc01.pdf (accessed on 1 November 2018).
  37. Abi Saab, M.T.; Jomaa, I.; Skaf, S.; Fahed, S.; Todorovic, M. Assessment of a Smartphone Application for Real-Time Irrigation Scheduling in Mediterranean Environments. Water 2019, 11, 252. [Google Scholar] [CrossRef]
  38. Karam, F.; Kabalan, R.; Breidi, J.; Rouphael, Y.; Oweis, T. Yield and water-production functions of two durum wheat cultivars grown under different irrigation and nitrogen regimes. Agric. Water Manag. 2009, 96, 603–615. [Google Scholar] [CrossRef]
  39. Bashour, I.; Al-Ouda, A.; Kassam, A.; Bachour, R.; Jouni, K.; Hansmann, B.; Estephan, C. An overview of Conservation Agriculture in the dry Mediterranean environments with a special focus on Syria and Lebanon. AIMS Agric. Food 2016, 1, 67–84. [Google Scholar] [CrossRef]
  40. LARI. Lebanese Agricultural Research Institute Annual Report; Ministry of Agriculture: Lebanon, 2010.
  41. Asseng, S.; Milroy, S.; Bassu, S.; Abi Saab, M.T. Book Chapter: WHEAT. In Crop Yield Response to Water; Irrigation and Drainage Paper 66; FAO: Rome, Italy, 2012. [Google Scholar]
  42. Todorovic, M. An Excel-based tool for real time irrigation management at field scale. In Proceedings of the International Symposium on “Water and Land Management for Sustainable Irrigated Agriculture”, Çukurova Univercity, Adana, Turkey, 4–8 April 2006. [Google Scholar]
  43. Allen, R.G.; Pereira, L.S.; Raes, D.; Smith, M. Crop Evapotranspiration. Guidelines for Computing Crop Water Requirements; Irrigation and Drainage Paper 56; Food and Agriculture Organization: Rome, Italy, 1998. [Google Scholar]
  44. Zadoks, J.C.; Chang, T.T.; Konzak, C.F. A decimal code for the growth stages of cereals. Weed Res. 1974, 14, 415–421. [Google Scholar] [CrossRef]
  45. Kroes, J.G.; van Dam, J.C.; Groenendijk, P.; Hendriks, R.F.A.; Jacobs, C.M.J. SWAP Version 3.2: Theory Descripon and User Manual; Alterra Report 1649; Alterra: Wageningen, The Netherlands, 2008; Available online: http.content.alterra.wur.nl/Webdocs/PDFFiles/Alterrarapporten/AlterraRapport1649.pdf (accessed on 1 November 2018).
  46. Van Genuchten, M.T. A closed-form equation for predicting the hydraulic conductivity of unsaturated soils 1. Soil Sci. Soc. Am. J. 1980, 44, 892–898. [Google Scholar] [CrossRef]
  47. Ritchie, J.T. Model for predicting evaporation from a row crop with incomplete cover. Water Resour. Res. 1972, 8, 1204–1213. [Google Scholar] [CrossRef] [Green Version]
  48. Feddes, R.A.; Raats, P.A.C. Parameterizing the soil–water–plant root system. Unsaturated-Zone Model. Prog. Chall. Appl. 2004, 6, 95–141. [Google Scholar]
  49. Bonfante, A.; Sellami, M.H.; Abi Saab, M.A.; Albrizio, R.; Basile, A.; Fahed, S.; Giorio, P.; Langella, G.; Monaco, E.; Bouma, J. The role of soils in the analysis of potential agricultural production: A case study in Lebanon. Agric. Syst. 2017, 156, 67–75. [Google Scholar] [CrossRef]
  50. Steduto, P.; Hsiao, T.C.; Fereres, E.; Raes, D. Crop yield response to water. In FAO Irrigation and Drainage Paper. 66; FAO: Rome, Italy, 2012; p. 500. [Google Scholar]
  51. Neter, J.; Kutner, M.H.; Nachtsheim, C.J.; Wasserman, W. Applied Linear Statistical Models; Irwin: Chicago, IL, USA, 1996; Volume 4, p. 318. [Google Scholar]
  52. Gomez, K.A.; Gomez, A.A. Statistical Procedures in Agricultural Research, 2nd ed.; Wiley: New York, NY, USA; Chichester, UK, 1984; 680p. [Google Scholar]
  53. Dunteman, G.H. Principal Components Analysis. Quantitative Applications in the Social Sciences; Sage Publications: Newbury Park, CA, USA, 1989; Volume 69, pp. 96–101. [Google Scholar]
  54. Matus, I.M.; Gonzales, G.; del Poso, A. Evaluation of phenotypic variation in a Chilean collection of garlic (Allium sativum L.) clones using multivariate analysis. Plant. Genet. Resour. Newslett. 1999, 117, 31–36. [Google Scholar] [CrossRef]
  55. Husson, F.; Josse, J.; Le, S.; Mazet, J. FactoMineR: Multivariate Exploratory Data Analysis and Data Mining with R. R Package Version. 1. 2014, pp. 102–123. Available online: http://factominer.free.fr/ (accessed on 1 November 2018).
  56. R Core Team. R: A Language and Environment for Statistical Computing; R Foundation for Statistical Computing: Vienna, Austria, 2013; Available online: https://www.scirp.org/(S(vtj3fa45qm1ean45vvffcz55))/reference/ReferencesPapers.aspx?ReferenceID=1742158 (accessed on 1 November 2018).
  57. McKee, T.B.; Doesken, N.J.; Kleist, J. The relationship of drought frequency and duration to time scales. In Proceedings of the 8th Conference on Applied Climatology, American Meteorological Society Boston, Boston, MA, USA, 17–22 January 1993; pp. 179–184. [Google Scholar]
  58. Barlow, K.M.; Christy, B.P.; O’leary, G.J.; Riffkin, P.A.; Nuttall, J.G. Simulating the impact of extreme heat and frost events on wheat crop production: A review. Field Crop. Res. 2015, 171, 109–119. [Google Scholar] [CrossRef]
  59. Richards, R.A. Crop improvement for temperate Australia: Future opportunities. Field Crop. Res. 1991, 26, 141–169. [Google Scholar] [CrossRef]
  60. Lollato, R.P.; Edwards, J.T. Maximum attainable wheat yield and resource-use efficiency in the southern Great Plains. Crop. Sci. 2015, 55, 2863–2876. [Google Scholar] [CrossRef]
  61. Barnabas, B.; Jager, K.; Feher, A. The effect of drought and heat stress on reproductive processes in cereals. Plant. Cell Environ. 2008, 31, 11–38. [Google Scholar] [CrossRef]
  62. Flohr, B.M.; Hunt, J.R.; Kirkegaard, J.A.; Evans, J.R. Water and temperature stress define the optimal flowering period for wheat in south-eastern Australia. Field Crop. Res. 2017, 209, 108–119. [Google Scholar] [CrossRef]
  63. Acevedo, E.; Silva, H.; Silva, P. Wheat growth physiology. In Bread Wheat Improvement and Production; Curtic, B.C., Rajarm, S., Macpherson, H.G., Eds.; FAO: Rome, Italy, 2002. [Google Scholar]
  64. Albrizio, R.; Todorovic, M.; Matic, T.; Stellacci, A.M. Comparing the interactive effects of water and nitrogen on durum wheat and barley grown in a Mediterranean environment. Field Crops Res. 2010, 115, 179–190. [Google Scholar] [CrossRef]
  65. Neely, C.; Trostle, C.; Welch, M. Wheat Freeze Injury in Texas; Texas, A&M, Agrilife Extension: Educational programs of Texas A&M AgriLife Extension Service and the Texas A&M University: College Station, TX, USA, 2014; 12p. [Google Scholar]
  66. Zhang, H.; Oweis, T.; Garabet, S.; Pala, M. Water-use efficiency and transpiration efficiency of wheat under rainfed conditions and supplemental irrigation in a Mediterranean-type environment. Plant. Soil 1998, 201, 295–305. [Google Scholar] [CrossRef]
  67. Frederiks, T.M.; Christopher, J.T.; Harvey, G.L.; Sutherland, M.W.; Borrell, A.K. Current and emerging screening methods to identify post-head-emergence frost adaptation in wheat and barley. J. Exp. Bot. 2012, 63, 5405–5416. [Google Scholar] [CrossRef] [PubMed] [Green Version]
  68. Zheng, B.; Chenu, K.; Dreccer, M.F.; Chapman, S.C. Breeding for the future: What are the potential impacts of future frost and heat events on sowing and flowering time requirements for Australian bread wheat (Triticum aestivium) varieties? Glob. Chang. Biol. 2012, 18, 2899–2914. [Google Scholar] [CrossRef] [PubMed]
  69. Dalal, R.C.; Strong, W.M.; Cooper, J.E.; King, A.J. Relationship between water use and nitrogen use efficiency discerned by 13C discrimination and 15N isotope ratio in bread wheat grown under no-till. Soil. Till. Res. 2013, 128, 110–118. [Google Scholar] [CrossRef]
  70. Pittelkow, C.M.; Linquist, B.A.; Lundy, M.E.; Liang, X.; Van Groenigen, K.J.; Lee, J.; Van Gestel, N.; Six, J.; Venterea, R.T.; Van Kessel, C. When does no-till yield more? A global meta-analysis. Field Crop. Res. 2015, 183, 156–168. [Google Scholar] [CrossRef] [Green Version]
  71. Hernanz, J.L.; Sanchez-Giron, V.; Navarrete, L. Soil carbon sequestration and stratification in a cereal/leguminous crop rotation with three tillage systems in semiarid conditions. Agric. Ecosyst. Environ. 2009, 133, 114–122. [Google Scholar] [CrossRef]
  72. Vahamidis, P.; Stefopoulou, A.; Kotoulas, V.; Lyra, D.; Dercas, N.; Economou, G. Yield, grain size, protein content and water use efficiency of null-LOX malt barley in a semiarid Mediterranean agroecosystem. Field Crop. Res. 2017, 206, 115–127. [Google Scholar] [CrossRef]
Figure 1. Number of days with minimum temperature below 0°C in April and May (grain filling period) for the three growing seasons.
Agronomy 09 00393 g001
Figure 2. Principal component loading plots and scores of principal component analysis for dry biomass (AGB), yield, yield components and irrigation water use efficiencies (IWUEb, IWUEy) in wheat as function of year, agronomic management, water regime and cultivar.
Agronomy 09 00393 g002
Figure 3. Principal component loading plots and scores of principal component analysis for dry biomass (AGB), yield, yield components and irrigation water use efficiencies (IWUEb, IWUEy) in barley as function of year, agronomic management, water regime and cultivar.
Agronomy 09 00393 g003
Figure 4. Actual transpiration (Tact), ratio between actual transpiration and potential transpiration (Tact/Tp) and rainfall in the three growing seasons for wheat under conventional tillage (CT).
Agronomy 09 00393 g004
Table 1. Description of the treatments in wheat and barley experiments.
Wheat
TreatmentDescription
CT_RF_W1Conventional tillage, rainfed, cv Icarasha
CT_SI_W1Conventional tillage, spring supplemental irrigation, cv Icarasha
CT_RF_W2Conventional tillage, rainfed, cv Miki
CT_SI_W2Conventional tillage, spring supplemental irrigation, cv Miki
NT_RF_W1No-till, rainfed, cv Icarasha
NT_SI_W1No-till, spring supplemental irrigation, cv Icarasha
NT_RF_W2No-till, rainfed, cv Miki
NT_SI_W2No-till, spring supplemental irrigation, cv Miki
Barley
TreatmentDescription
CT_RF_B1Conventional tillage, rainfed, cv Assi
CT_SI_B1Conventional tillage, spring supplemental irrigation, cv Assi
CT_RF_B2Conventional tillage, rainfed, cv Rihane
CT_SI_B2Conventional tillage, spring supplemental irrigation, cv Rihane
NT_RF_B1No-till, rainfed, cv Assi
NT_SI_B1No-till, spring supplemental irrigation, cv Assi
NT_RF_B2No-till, rainfed, cv Rihane
NT_SI_B2No-till, spring supplemental irrigation, cv Rihane
Table 2. Experimental details and dates of the main phenological stages for durum wheat and barley during the three growing seasons. In brackets the days after sowing (DAS) are reported.
Wheat
2012–20132013–20142014–2015
Sowing6 November128 November 1320 November 14
Emergence24 November 2012 (19)27 November 2013 (19)7 December 2014 (18)
Tillering14 January 2013 (70)25 January 2014 (79)2 February 2015 (75)
Booting20 March 2013 (135)29 March 2014 (141)10 April 2015 (142)
Flowering30 March 2013 (145)10 April 2014 (153)22 April 2015 (154)
Grain filling (milk stage)17 April 2013 (162)25 April (168)2 May 2015 (164)
Harvesting29 May 2013 (205)4 June 2014 (208)8 June 2015 (201)
Length of crop cycle (days)205208201
Barley
2012–20132013–20142014–2015
Sowing6 November 128 November 1320 November 14
Emergence23 November 2012 (18)26 November 2013 (18)7 December 2014 (18)
Tillering8 January 2013 (64)12 January 2014 (66)18 January 2015 (60)
Booting15 March 2013 (130)24 March 2014 (136)6 April 2015 (138)
Flowering26 March 2013 (141)5 April 2014 (148)16 April 2015 (148)
Grain filling (milk stage)13 April 2013 (158)22 April 2014 (165)27 April 2015 (159)
Harvesting25 May 2013 (200)28 May 2014 (201)7 June 2015 (201)
Length of crop cycle (days)200201200
Table 3. Weather parameters during the three growing seasons, compared to long-term means.
NovemberDecemberJanuaryFebruaryMarchAprilMayJune
P (mm)2012–201393.5225.3209.474.530.890.67.40.0
2013201418.695.06.633.180.019.250.233.4
20142015151.251.7126.7128.763.9111.033.618.0
Long-term means58.0124.0145.0103.081.041.017.01.0
ETo (mm)2012201358.265.462.868.8112.2103.7184.1154.9
2013201462.044.653.660.6109.3146.0173.8199.0
2014201552.029.946.960.7102.8135.2165.6192.1
Long-term means58.747.243.747.473.5101.7133.3162.3
Tmax [°C]2012201319.113.512.214.317.920.126.730.5
2013201420.410.813.714.818.224.127.629.2
2014201516.915.18.811.517.019.225.927.8
Long-term means19.813.611.312.516.121.226.230.7
Tmin [°C]201220136.52.71.32.83.65.59.111.1
201320145.8−0.2−0.4−0.43.54.67.39.9
201420154.53.3−2.20.13.94.28.78.2
Long-term means4.31.80.30.82.04.56.810.4
Tmin-lowest[°C]201220130.0−2.7−3.0−0.7−3.20.04.65.5
201320140.3−11.4−4.6−5.6−2.9−0.40.00.0
201420150.9−0.6−16.1−7.8−2.2−0.50.00.0
Long-term means−7.0−14.7−13.6−9.0−8.0−4.0−2.02.0
Table 4. Significance levels of analysis of variance over 2012–2013, 2013–2014 and 2014–2015 for the wheat experiment.
Source of Variationd.f.Spike m−2 Grains Spike−1zx 1000 Grains m−21000 Grain Weight zGrain YieldAGBHI IWUEb IWUEy
Year (Y)2 ****************
Management (Man)1
Y × Man2
Water regime (WR)1 *
Man × WR1
Y × WR2 ***
Y × Man × WR2 *
Cultivars (C)1
Man × C1
WR × C1
Man × WR × C1
Y × C2 *
Y × Man × C2
Y × WR × C2
Y × Man × WR × C2 *
AGB, HI, IWUEb and IWUEy represent, respectively, dry above ground biomass, harvest index, biomass- and yield- irrigation water use efficiency. *, **, ***, **** indicate, respectively, differences at p ≤ 0.05, p ≤ 0.01, p ≤ 0.001 and p ≤ 0.0001. z data analysis only for the two consecutive years 2014 and 2015 due to missing data on 2013.
Table 5. Yield and yield components and irrigation water use efficiencies as affected by year, agronomic management, water regime and cultivar under wheat experiment.
Source of VariationSpike m−2Grains Spike−1zx 1000 Grains m−21000 Grain Weight zGrain YieldAGBHIIWUEbIWUEy
(n m−2)(n spike−1)(n m−2)(g)(Mg ha−1)(Mg ha−1) (kg m−3)
Year
2013-26.75 ± 1.37--5.20 ± 0.60 a11.70 ± 1.57 a44.92 ± 3.52 a1.49 ± 0.23 a0.67 ± 0.13 a
2014182.6 ± 56.332.61 ± 3.345.86 ± 1.90 a35.33 ± 2.21 b2.06 ± 0.54 c6.00 ± 0.53 c34.49 ± 8.20 b1.60 ± 0.49 a0.55 ± 0.25 b
2015205.7 ± 98.828.61±4.934.96 ± 1.24 b60.47 ± 6.95 a2.97 ± 0.64 b8.07 ± 1.01 b36.99 ± 4.98 b1.16 ± 0.24 b0.42 ± 0.07 c
Management
CT180.0 ± 60.229.56 ± 4.355.66 ± 1.8450.08 ± 10.583.39 ± 1.408.53 ± 2.7138.34 ± 7.151.43 ± 0.400.54 ± 0.17
NT208.3 ± 95.829.31 ± 4.275.16 ± 1.4345.71 ± 17.073.28 ± 1.588.37 ± 2.6938.73 ± 7.561.40 ± 0.380.55 ± 0.22
RF190.0 ± 86.427.95±4.424.99 ± 1.9145.65 ± 12.322.97 ± 1.417.78 ± 2.3637.24 ± 9.061.54 ± 0.450.57 ± 0.23
SI198.3 ± 77.230.88±3.575.83±1.2550.15 ± 15.843.69 ± 1.499.11 ± 2.8739.79 ± 4.791.29 ± 0.290.51 ± 0.15
Cultivar
W1175.9 ± 85.230.29 ± 3.334.97 ± 1.3748.27 ± 14.643.27 ± 1.668.46 ± 3.1537.23 ± 5.871.40 ± 0.410.52 ± 0.16
W2212.4 ± 72.528.61 ± 5.005.85 ± 1.8247.52 ± 14.133.39 ± 1.308.44 ± 2.1539.80 ± 8.411.43 ± 0.370.56 ± 0.21
Means followed by different letter in each row are significantly different according to the Duncan test (P = 0.05). AGB, HI, IWUEb, IWUEy, CT, NT, RF, SI, W1 and W2 represent, respectively, dry above ground biomass, harvest index, biomass- and yield- irrigation water use efficiency, conventional tillage, no-till, rainfed, supplemental irrigation; “Icarasha”; “Miki”.z data analysis only for the two consecutive years 2014 and 2015 due to missing data on 2013.
Table 6. Significance levels of analysis of variance over 2012–2013, 2013–2014 and 2014–2015 for the barley experiment.
Source of Variationd.f.Spike m−2Grains Spike−1zx 1000 Grains m−21000 Grain Weight zGrain YieldAGBHIIWUEbIWUEy
Year (Y)2 ** ****************
Management (Man)1
Y × Man2 **
Water regime (WR)1 **
Man × WR1
Y × WR2
Y × Man × WR2
Cultivars (C)1
Man × C1 *
WR × C1 *
Man × WR × C1 *
Y × C2
Y × Man × C2
Y × WR × C2 *
Y × Man × WR × C2
AGB, HI, IWUEb and IWUEy represent, respectively, dry above ground biomass, harvest index, biomass- and yield- irrigation water use efficiency.*, **, ***, **** indicate, respectively, differences at p ≤ 0.05, p ≤ 0.01, p ≤ 0.001 and p ≤ 0.0001. z data analysis only for the two consecutive years 2014 and 2015 due to missing data on 2013.
Table 7. Yield and yield components and irrigation water use efficiencies as affected by year, agronomic management, water regime and cultivar under barley experiment.
Source of VariationSpike m−2Grains Spike−1zx 1000 Grains m−21000 Grain Weight zGrain YieldAGBHIIWUEbIWUEy
(n m−2)(n spike−1)(n m−2)(g)(Mg ha−1)(Mg ha−1) (kg m−3)
Year
2013-41.97 ± 6.39 a--5.81 ± 0.91 a13.14 ± 2.21 a44.27 ± 2.55 a1.68 ± 0.38 a0.75 ± 0.15 a
2014199.4 ± 75.331.89 ± 5.10 b6.03±1.6138.95±5.32 b2.39 ± 0.50 b6.19 ± 0.88 b37.69±3.90 b1.61±0.38 a0.61 ± 0.20 a
2015173.8 ± 62.631.94 ± 5.25 b5.40±2.0344.91±4.37 a2.40 ± 0.61 b7.37 ± 1.10 b31.85 ± 5.29 c1.06 ± 0.24 b0.34 ± 0.12 b
Management
CT190.7 ± 81.433.54 ± 8.385.68 ± 1.7341.74 ± 5.473.27 ± 2.068.27 ± 3.9338.03 ± 6.571.38 ± 0.420.54 ± 0.21
NT182.5 ± 57.136.62 ± 5.595.75 ± 1.9842.12 ± 6.133.67 ± 1.519.29 ± 2.8437.48 ± 6.691.51 ± 0.450.58 ± 0.25
RF182.1 ± 68.333.74 ± 8.085.22 ± 1.5937.69 ± 4.222.29 ± 1.69 b7.95 ± 3.1936.06 ± 8.051.52 ± 0.440.57 ± 0.25
SI191.2 ± 72.336.41 ± 6.146.21 ± 1.9646.17 ± 2.953.95 ± 1.80 a9.62 ± 3.5139.45 ± 4.161.38 ± 0.420.56 ± 0.24
Cultivar
W1178.3 ± 57.335.03 ± 6.095.65 ± 1.7042.75 ± 4.823.47 ± 1.778.69±2.9737.97 ± 7.661.45 ± 0.410.55 ± 0.23
W2194.9 ± 80.635.12 ± 8.405.78 ± 2.0041.12 ± 6.553.47 ± 1.878.87 ± 3.9237.55 ± 5.421.45 ± 0.470.57 ± 0.21
Means followed by different letter in each row are significantly different according to the Duncan test (p = 0.05). AGB, HI, IWUEb, IWUEy, CT, NT, RF, SI, B1 and B2 represent, respectively, dry above ground biomass, harvest index, biomass and yield water use efficiency, conventional tillage, no-till; rainfed, supplemental irrigation; “Assi”; “Rihane”.z data analysis only for the two consecutive years 2014 and 2015 due to missing data on 2013.
Table 8. Eigen values, relative and cumulative percentage of total variance, and correlation coefficients for wheat traits with respect to the two principal components (PC1 and PC2).
Principal ComponentsPC1PC2
Eigen value4.972.16
Relative variance (%)55.2224.01
Cumulative variance (%)55.2279.23
Eigen vectors
AGB0.8840.327
Grain Yield0.9500.263
Grains spike−1−0.346−0.446
Spikes m−20.9650.008
Grains m−20.969−0.119
Weight 1000 Grains−0.0160.885
Harvest index0.7840.123
IWUEb0.314−0.831
IWUEy0.763−0.532
Supplementary variables
Tavg_W0.886−0.054
Tmax_W0.526−0.632
Tmin_W0.8800.315
Rain_W0.8200.471
Tavg_A−0.128−0.871
Tmax_A−0.347−0.842
Tmin_A0.850−0.183
nFrost_A−0.886−0.287
Rain_A0.3140.850
Tavg_M0.867−0.129
Tmax_M−0.070−0.869
Tmin_M0.6360.697
nFrost_M−0.709−0.629
Rain_M−0.849−0.409
Boldface factor loadings indicate the most relevant characters for each principal component. Tavg_W: average temperature in winter; Tmax_W: maximum temperature in winter; Tmin_W: minimum temperature in winter; Rain_W: rainfall in winter; Tavg_A: average temperature in April; Tmax_A: maximum temperature in April; Tmin_A: minimum temperature in April; nFrost_A: Number of days per month where minimum temperature dropped below 0°C in April; Rain_A: rainfall in April; Tavg_M: average temperature in May; Tmax_M: maximum temperature in May; Tmin_M: minimum temperature in May; nFrost_M: Number of days per month where minimum temperature dropped below 0 °C in May; Rain_M: rainfall in May.
Table 9. Eigen values, relative and cumulative percentage of total variance, and correlation coefficients for barley traits with respect to the two principal components (PC1 and PC2).
Principal ComponentsPC1PC2
Eigen value6.061.58
Relative variance (%)67.2917.51
Cumulative variance (%)67.2984.80
Eigen vectors
AGB0.8920.341
Grain Yield0.9460.296
Grains spike−10.7450.356
Spikes m−20.890−0.035
Grains m−20.9750.121
Weight 1000 Grains−0.3430.877
Harvest index0.8010.093
IWUEb0.712−0.586
IWUEy0.895−0.327
Supplementary variables
Tavg_W0.9390.029
Tmax_W0.762−0.432
Tmin_W0.8070.306
Rain_W0.6920.418
Tavg_A0.164−0.663
Tmax_A−0.074−0.659
Tmin_A0.945−0.070
nFrost_A−0.823−0.285
Rain_A0.0360.662
Tavg_M0.945−0.029
Tmax_M0.223−0.657
Tmin_M0.4240.572
nFrost_M−0.522−0.527
Rain_M−0.743−0.373
Boldface factor loadings indicate the most relevant characters for each principal component. Tavg_W: average temperature in winter; Tmax_W: maximum temperature in winter; Tmin_W: minimum temperature in winter; Rain_W: rainfall in winter; Tavg_A: average temperature in April; Tmax_A: maximum temperature in April; Tmin_A: minimum temperature in April; nFrost_A: Number of days per month where minimum temperature dropped below 0°C in April; Rain_A: rainfall in April; Tavg_M: average temperature in May; Tmax_M: maximum temperature in May; Tmin_M: minimum temperature in May; nFrost_M: Number of days per month where minimum temperature dropped below 0 °C in May; Rain_M: rainfall in May.
Table 10. Measured aboveground biomass (AGB) and simulated AGB by SWAP model during the three growing seasons for wheat under traditional and conservation tillage.
Growing SeasonsAGB (Kg m−2)
2012–20132013–20142014–2015
Traditional TillageSimulated 1.240.911.14
Measured 1.290.510.81
Conservation TillageSimulated 1.210.811.14
Measured 1.080.50.92

