Article

Influence of Pyrolyzed Grape-Seeds/Sewage Sludge Blends on the Availability of P, Fe, Cu, As and Cd to Maize

by
Sara Aceña-Heras
1,
Jeff Novak
2,
María Luz Cayuela
3,
Jesus M. Peñalosa
1 and
Eduardo Moreno-Jiménez
1,*
1
Department o de Química Agrícola y Bromatología, Universidad Autónoma de Madrid, 28049 Madrid, Spain
2
Department of Agriculture, Agriculture Research Service, Coastal Plains Research Center, 2611 West Lucas Street, Florence, SC 29501, USA
3
Department of Soil and Water Conservation and Waste Management, CEBAS-CSIC, Campus Universitario de Espinardo, 30100 Murcia, Spain
*
Author to whom correspondence should be addressed.
Submission received: 24 May 2019 / Revised: 11 July 2019 / Accepted: 18 July 2019 / Published: 22 July 2019
(This article belongs to the Special Issue Remediation of Contaminated Soil for Food Security)

Abstract

:
Current intensive agricultural practices, although highly successful in terms of production, have been found to be environmentally unsustainable. One of the crucial approaches to increase agricultural sustainability is the recycling of organic wastes, since these materials often contain many beneficial nutrients for soil and agriculture. Recently, pyrolytic conversion of biodegradable waste into charred material has gained global attention as an amendment to recycle nutrients while improving soil health. Increasing interest in the beneficial applications of pyrolyzed biomass has expanded multidisciplinary areas for science and engineering. The fertilizers used in this study were prepared by pyrolyzing mixtures of two abundant residues in Mediterranean areas: grape seeds and sewage sludge, in different proportions (100% GS, 75% GS-25% SS, 50% GS-50% SS, 25% GS-75% SS, 100% SS). In addition, fresh sludge was mixed with pyrolyzed grape seeds and included as an additional treatment. In this study, the positives and negatives of the application of biochars on agronomic potential and environmental risk have been addressed, taking into account P, Zn, Cu, Fe, As and Cd. In order to choose the best mixture, it is necessary to find a compromise between maximizing the beneficial elements that are translocated to the plant crop, as well as reducing the elements that are leached. Results of a 6-week greenhouse study indicated that the unpyrolyzed sludge mixture contained the largest amount of available nutrients Fe, Cu and P. In agreement, this treatment mixed with a Chromic Luvisol soil (40 ton/ha) increased the uptake of these elements in corn (Zea mays L.—LG ambitious). The yield also increased by 60% in this treatment. However, this mixture also contained more contaminants (As, Cd) which were extracted with Ammonium Bicarbonate-DTPA. According to our results, the treatments where grape seeds and sewage sludge were mixed at 50% and then pyrolyzed exhibited the optimal compromise between efficiency (nutrients uptake) and tolerable levels of potentially toxic elements in leachates.

1. Introduction

The FAO gives a central role to agriculture in order to achieve the Millennium objectives. By improving agricultural productivity and promoting better nutrition, the targeted reductions in worldwide poverty and hunger could be met [1]. However intensive agriculture does generate a large negative impact due to high levels of agriculture inputs, such as chemical fertilizers. These produce the highest yield of crops at the lowest possible cost [2], thus maximizing food production. This is an efficient use of resources; however, the high levels of contamination forces the consideration of other sustainable alternatives for agriculture.
According to this, the real objective is to replace the linear process—based on production, consumption and disposal—with a circular economy in which the materials are reincorporated into the production process in order to create new products. In this approach, waste management plays a key role, since many residues contain beneficial nutrients for agriculture [3]. In this way, up to 30% of inorganic fertilizers could be substituted [4]. Nevertheless, it must be ensured that these fertilizers from waste do not cause negative effects on the soil and the environment.
Sewage sludge is the solid waste produced in urban wastewater treatment plants. It is one of the most abundant types of organic wastes from the tertiary sector and its production is expected to increase due to expanding urbanization and industrialization [5]. Sewage sludge composition varies with treatment technology, but in general, it contains valuable nutrients (it is particularly rich in C, P and N) and therefore its recycling as a soil amendment is promoted in agriculture [6,7,8]. However, the application of sewage sludge as a fertilizer for food production is often limited by its high concentrations of potentially toxic elements [9]. In addition, the presence of pathogens and salinity in its composition jeopardize soil-plant systems and may further threaten human health [10,11,12]. For this reason, extensive research has been developed during recent decades to guarantee the safe application of sewage sludge to agricultural soils [13]. One technological treatment that has gained attention is the pyrolysis of sewage sludge to produce biochar [14]. If the carbon content in the biochar remains below 50%, the product is called “pyrolyzed material” instead [15]. The high treatment temperatures during pyrolysis ensure the sanitization of the sludge by decreasing the availability of potentially toxic elements [16]. Before the large-scale implementation of biochar and other pyrolyzed biomasses can be seriously contemplated and developed into policy, it is essential to have scientific evidence of its agronomic and agro-environmental footprint. Some progress has been made in this regard [17,18,19], but more work needs to be done. Experimental results, when available, are often inconsistent and largely dependent on the experimental conditions and design, while causative mechanisms remain unclear [20].
With respect to fuel savings, nutrient recovery and control of potentially toxic elements, pyrolytic conversion of sewage sludge into biochar is an improvement over the conventional incineration processes [21,22]. For this reason, a growing body of research is examining the pros and cons of pyrolyzing sewage sludge for its use as fertilizer in agricultural soils [23,24,25]. Among the main pros are: (i) the recycling of relevant nutrients, such as P [26,27] or N [28], (ii) the destruction of potential pathogens [29] and (iii) the reduction of toxic organic contaminants [30]. The cons might include: (i) biochars toxicity ([31]) and (ii) the release and accumulation of potentially toxic elements in soil [32]. These disadvantages can be minimized by mixing the sludge with other lignocellulosic residues for their co-pyrolysis. For instance, Wang et al (2018) [33] added cotton stalk to sewage sludge and observed the migration and transformation of potentially toxic elements from bioavailable to stable fractions. This significantly reduced the potential environmental risks of using biosolids.
Increased crop production is the most commonly anticipated effect of the application of pyrolyzed material to soils. This reflects its potential to partially substitute chemical fertilizers [34]. For instance, the results from field trials have shown significant increases in N agronomic use efficiency with biochar amendment in rice paddies [35]. Qiao et al. (2014) [36] showed a crop performance response comparable to those seen when using a chemical fertilizer. In contrast, in the experiments developed by Zhang et al. (2010) [37], rice yields were not significantly different between plots with or without nitrogenous fertilization under a single treatment with biochar. In a meta-analysis conducted by Jeffery et al. (2011) [38] and by Liu et al. (2013) [39], results showed that the crop yield increase was significant in acidic soils and poorly structured sand and clay soils. This was speculated to be due to a liming effect and an aggregating effect. It is also possible to find research, where biochar is combined with other materials in order to improve its own characteristics and promote sustainable agriculture [40]. It has been observed that the combination of biochar with fertilizers maximizes the positive impacts of biochar application to soil [41,42]. Nevertheless, more research is needed to critically evaluate biochar application to other soil types to improve plant yield and avoid negative environmental effects.
Numerous previous projects failed to fully investigate either nutrient supply versus contamination, or uptake versus leaching. Conversely, the purpose of this study was to produce different pyrolyzed materials based on mixtures of grape seeds and sewage sludge waste—both of which are abundant in Mediterranean agricultural areas—and to examine their agronomic potential and environmental impacts. This was carried out firstly by characterizing the pyrolyzed materials—as in previous studies in Spain [43]. Then, secondly, by testing them in pots with one typical Mediterranean agricultural soil with corn plants grown in the greenhouse. We hypothesized that increasing the ratio of grape seeds: sludge mixture would decrease the fertilization potential of the biochars but also reduce their environmental risks. These differences would impact nutrient availability to support crop growth and to minimize contaminant leaching.

2. Materials and Methods

2.1. Feedstocks

Two abundant organic wastes were selected for the production of pyrolyzed materials. Sewage sludge was provided by Ferrovial (Madrid, Spain). Its origin was from municipal wastewater treatment plants and was mixed with pruning waste compost used in agriculture and land restoration. Grape seeds, a residue from wine making, were supplied by the Department of Chemical Engineering of UAM (Madrid). Their main chemico-physical characteristics are shown in Table 1 and Table 2. Before pyrolysis, feedstocks were air dried. While grape seeds conserved their original particle size (approximately 10 mm) the sewage sludge was ground to <2 mm.

2.2. Pyrolyzed Materials

Five pyrolyzed materials were produced by mixing different proportions of sewage sludge and grape seeds (Table S1). The air-dried feedstocks were first homogeneously mixed and introduced in a rotary oven (CARBOLITE CB HTR11/150P8, Spain) under a nitrogen atmosphere (flow rate 1 L/min). The pyrolysis temperature ramp was programmed as follows: (1) linear heating at a rate of 10 °C/min from room temperature 22 °C to 400 °C; (2) isotherm for 1 h at the highest treatment temperature (HTT) of 400 °C (3) cooling down to ambient temperature (4 h in total).
An additional treatment, where raw sewage sludge was incubated with 100% grape seeds pyrolyzed material was also tested. This treatment will be referred to hereafter as the Incubated mixture. It consisted of a 50%–50% mixture (dry weight basis) of raw sewage sludge with pyrolyzed grape seeds. Deionized water was added to the mixture to reach 80% moisture (by 172 g water/kg of mixture) and pre-incubated for 15 days before its use as soil amendment. Pyrolyzed material elemental composition (C, H, N) was determined by automatic elemental analysis (LECO CHNS-932, Model 601-800-500, Isomass scientific Inc, Calgary, AB, USA). Dissolved organic C (DOC) was determined in 1:10 (w: v) water extracts (shaken for 4 h, centrifuged for 10min at 180 rpm and filtered (1238 Filter-Lab, 20–25 μm filters) with a TOC analyzer (Shimadzu Total Carbon Analyzer, TOC-V CSH, Kanagawa Japan). The pH and electrical conductivity were measured in 1:2.5 and 1:5 (w: v) suspensions, respectively. Soluble cation determination (Ca2+ Mg2+, Na+) was carried out following the procedure of Rayment et al., (2011) [44] and measured by Inductively Coupled Plasma spectroscopy ICP-OES (ICAP 6500 DUO/IRIS INTREPID II XDL, Thermo Scientific, Waltham, USA). Extractable micronutrients (Fe, Cu) and potentially toxic elements (As, Cd) in soil were measured after their extraction in a 1:5 (w: v) ratio with a solution of diethylenetriaminepentaacetic acid (DTPA) (0.02M) and CaCl2.2H2O (0.1M) [45] and analyzed by ICP-OES. For the determination of soluble P, 1 g of the pyrolyzed material was sequentially washed with twelve portions of water measuring 10 mL each. The volume—previously filtered (1238 Filter-Lab, 20–25 μm filters)—was later brought up to 250 mL [46] and determined using an ion chromatograph Dionex ICS-900. The concentration of total elements was determined by an acid digestion with HNO3 (13.7 M) and H2O2 (33% w: v) in autoclave at 125 °C and 24 kPa for 30 min [47,48]. This was then measured with ICP-OES. The detection limits of the ICP-OES for As, Cd and P ranged from 1–10 μg/L.

2.3. Pot Experiment with Calcareous Soil and Corn

Pot experiments with corn (Zea mays L.—LG ambitious) were carried out at the greenhouse facility of the Department of Agricultural and Food Chemistry in the UAM. The greenhouse kept temperatures between 10 °C and 26 °C, relative humidity (37.8% to 89.7%), and a photoperiod of 12 h for the duration of the experiments (6 weeks during March–April).
Pots (methacrylate cylinders, size 3.2 cm diameter, 17 cm height with a mesh at the bottom) were filled with 600 grams (dry weight) of a 50%–50% mixture of Chromic Luvisol soil (Table S2) [49], which had been previously cultivated with vineyards, and limestone. This was done in order to create aeration in the mixture. The different materials were added and homogeneously mixed with the soil at a 2% rate (dry weight basis) as individual treatments, equivalent to an agronomic dose of 40 ton/ha. A treatment without fertilization was included as a control. This made up a total of seven treatments (five pyrolyzed materials, the Incubated mixture and the control). Each treatment was replicated four times. The pots were spatially distributed in a randomized block design and moved to a new random location once a week. During the incubation, the pots were irrigated with 105 mL of deionized water to reach 80% of their field capacity. Regarding the seeds, these were previously germinated in controlled conditions (28 °C, 48 h). Secondly, two germinated plants of maize were sown in each pot. After a week, the germinated plants were later thinned to one plant per pot. The plants were watered regularly (every two days) with deionized water to maintain the soil at a moisture content of 80% of its field capacity (172 g water per kg of dry soil). No leaching was observed after each regular irrigation event.
A leaching experiment was conducted to evaluate the movement of potentially toxic elements present in the treatments. For this, 100 mL of extra-water (156% of its field capacity) was added to the pots after five and six weeks. The leachate was collected after each leaching event. Then, after being filtered, (1238 Filter-Lab, 20–25 μm filters) the corresponding samples were combined to make one sample to measure the cumulative leached elements (As, Cd, Cu, Fe and P) with ICP-OES.
After six weeks of growth, both the above and belowground corn biomass were harvested. The biomass was washed with deionized water and oven-dried at 70 °C in paper bags for 24 h. The dry matter yield was recorded and the dried samples were sieved to a fine powder using a mechanical grinder. The total concentration of elements in corn biomass was extracted by acid digestion with HNO3 (13.7 M) and H2O2 (33% w: v) in an autoclave at 125 °C and 24 kPa for 30 min, and then measured with ICP-OES.
Once the corn was harvested, the soil was oven-dried for 48 h at 70 °C, sieved to 2 mm and stored until further analysis. Soils were analyzed for pH, and soluble nutrients were extracted by the Ammonium Bicarbonate-DTPA method [50], and measured by ICP-OES.

2.4. Data Processing and Statistical Analysis

The translocation of metals As, Cd and Pb to the aerial part was calculated according to the following equation:
% Translocation = Dry   weight   Aerial   part × Metal   concentration   in   Aerial   part BC   weight   added   in   the   pot × Total   metal   concentration   in   that   BC × 100
The percentage of fertilizer efficiency as the amount of nutrients initially applied in the pyrolyzed material that was taken up in shoots at harvesting was calculated with the following formula:
% Efficiency = ( Dry   root   weight × Metal   concentration   in   root ) + ( Dry   weight   Aerial   part   pa × Metal   concentration   in   Aerial   part ) BC   weight   added   in   the   pot × Total   metal   concentration   in   that   BC × 100
The percentage of an element that was leached from the materials which are being analyzed was calculated as:
% Leaching = Collected   volume   of   leachates × Metal   concentration   in   those   leachates BC   weight   added   in   the   pot × Total   metal   concentration   in   that   BC × 100
In order to select the treatments which could be used most appropriately for agricultural applications, we compared the corresponding percentages of efficiency and leaching obtained by each treatment. Color codes were then used to illustrate the differing efficiencies among the treatments.
Firstly, in order to identify the results for “total efficiency” and “total leaching”, a ranking scale was created. The scale consists of numbers 1 to 4. These were assigned to the different treatments according to the results from % Efficiency (Table S3) and % Leaching (Table S4). Number 4 refers to the treatment that obtained the highest percentage. Number three was given to the one that produced the second highest percentage and so on until number one was designated to the treatment with the lowest percentage.
The treatments were ranked by efficiency and leaching for the five different elements: Cu, Fe, P, As and Cd. Once these were applied, the rankings were then added up. These totals provided an overall score for each treatment for their total leaching and total efficiency.
Whereas, a higher number for total leaching indicates a greater environmental risk irrespective of the element, the evaluation of total efficiency differs depending on whether it is a contaminant or a nutrient.
The color code system was then employed to illustrate the relative total efficiency and the relative total leaching for each treatment. Green represents the treatment which produced the most favorable results for the crop and the environment. Yellow for those that produced moderate results. Then, finally, red was given to the treatment that provided the least favorable results.
Nutrients:    Efficiency: 1–4 (red), 5–8 (yellow), 9–12 (green)
       Leaching: 1–4 (green), 5–8 (yellow), 9–12 (red)
Contaminants:  Efficiency: 1–3 (red), 4–6 (yellow), 7–8 (green)
       Leaching: 1–3 (green), 4–6 (yellow), 7–8 (red)

2.5. Statistics

All data was analyzed using a 1-way analysis of the variance (ANOVA) followed by a Tukey post-hoc test (p < 0.05) using SPSS. For non-normal data, a nonparametric test, such as the Games-Howell, was used.

3. Results

3.1. Pyrolyzed Materials Characteristics

Increasing the proportion of sewage sludge decreased the total C concentration (from 66% to 18%), the C/N ratio (from 21 to 8) and increased the EC (from 0.004 to 2.5 S/m) in the pyrolyzed materials (Table 3).
The degree of aromaticity, as determined by the H:C molar ratio, decreased with increasing sludge proportions (H:C increased from 0.69 to 0.90). The pH values ranged between 7 and 8, although the rise was not gradual, but sharp, occurring when both residues were mixed at equal proportions. Pyrolysis of materials increased the total concentration of micro-nutrients, P and potentially toxic metals (As, Cd) (Table 4) when compared to the original raw mixtures (Table 2). However, the pyrolysis process reduced the bioavailability of many of these elements (As, Cd, Cu and Fe). On the contrary, available phosphorus concentration increased after pyrolysis (Table 2 and Table 4).
The Incubated mixture showed the highest concentrations of available micronutrients (Fe, Cu) and P, an intermediate C/N ratio and pH, and the lowest degree of aromaticity (highest H:C molar ratio). All of which demonstrates the low stabilization of this material [51].

3.2. Pot Experiment with Corn

Two determinations were carried out to evaluate the response of maize to the pyrolyzed materials: biomass growth and element uptake. The Incubated mixture was the only treatment with a significant effect on plant growth; with an increase of 60% (Figure 1).
Regarding element uptake, the cultivated plants with the Incubated mixture treatment had the lowest concentration of toxic metals—As and Cd—in their edible part (Table 5).
Figure 2 shows the concentration of DTPA-extractable metals and P in soil at the end of the growth experiment. Whereas As and Cu concentrations did not vary significantly with respect to the Control treatment, Fe and P concentrations increased as the proportion of sludge increased.
Comparing all of the treatments, the soil with the Incubated mixture (followed by the material which is 100% sewage sludge) generally presented the highest increases of metals and P concentration with respect to the Control treatment.
Despite having achieved the stabilization of micronutrients with pyrolysis (Table 4), As and Cu leaching tend be higher in all soils treated with pyrolyzed materials in comparison to the Control soils (Figure 3), but no differences were significant. Regarding P, high concentrations were found in the leachates, with the highest value for the pyrolyzed material from 100% sewage sludge (Figure 3). The Incubated mixture was, in general, the treatment with the highest concentration of metals and nutrients leached.
Comparing the pyrolyzed materials, the mixture with 50% grape seeds-50% sewage sludge exhibited intermediate behavior regarding both leaching and efficiency (Table 6 and Table 7). The Incubated mixture treatment showed the highest efficiency (Table S3) in the uptake of nutrients by plants, but also contributes the most pollutants and the most leaching (Table S4) due to its greater availability in the fresh sludge.

4. Discussion

4.1. Characteristics of the Pyrolyzed Materials

Although several studies have examined the pyrolysis of sewage sludge and its application in soil, few have looked into how blending (prior to pyrolysis) with other organic materials may affect biochar properties and behavior in the soil-plant system. As noted by other authors such as Rehrah et al. (2014) [52] and Liu et al. (2014) [7], we found that pyrolysis led to an increase in pH relative to the initial materials. Furthermore, we observed that pH increased when higher proportions of sludge were added to the feedstock mixture. It is known that high temperature pyrolysis produces a rise in the concentration of inorganic elements, and the formation of basic surface oxides [53,54]. The rise in material pH after pyrolysis is also due to the loss of acidic containing structures like acetic acid in the form of bio-oil [55,56]. Likewise, the electrical conductivity increased with rising proportions of sludge, but remained lower than the conductivity of the Incubated mixture. The low salinity (with values of Ca, Mg and K in greater proportions than the values of Na (Table 3) implies that the pyrolyzed materials do not represent a risk for soil salinization in the long term. The low Na concentrations are noteworthy because this cation negatively affects the physical and chemical properties of soil, and crop yields [57].
The total potentially toxic elements content was enriched in the pyrolyzed materials due to the concentration of ashes during pyrolysis [54]. However, the quantities of extractable elements (except Fe and P) were lower than those of the original feedstocks. As previously observed by other authors, the pyrolysis reduced the bioavailability of potentially toxic elements [58]. We found that increasing the proportion of sludge gradually increased the concentration of available Cu, Fe and P in the pyrolyzed materials, but not of available As and Cd, which stayed below 0.03 mg kg−1. This has important implications for the safe use of sewage sludge in agriculture, since pyrolysis reduces the risk of As or Cd pollution by minimizing their availability [59]. The concentration of As in all materials was found to be below the limits of the most strict international regulations [60]. However, Cd concentration in the pyrolyzed 100% sewage sludge (1.7 mg kg−1) would surpass the European thresholds for soil amendments (1.4 mg kg−1). The maximum permitted concentrations of Cu according to European jurisdiction (143 mg kg−1) would be also exceeded for three pyrolyzed mixtures (100% sewage sludge, 75% sewage sludge-25% grape seeds and 75% grape seeds-25% sewage sludge). Therefore, it is prudent to ensure that potentially toxic elements do not create an environmental or health risk (leaching and transfer to crops).
The pyrolyzed materials showed a moderate fertilization potential. The concentration of N (between 2%–3%) decreased with respect to the original feedstocks and it is known that this N is embedded in recalcitrant C structures and mineralizes slowly in soil [61]. The Incubated mixture had similar N concentrations (2.8%), but N is in chemical forms more readily available to plants as this treatment contains unpyrolyzed sludge [5]. Therefore, the idea of developing a blended material in which one part was pyrolyzed—to provide the mixture with stability—while the other part (which hitherto had not been treated) contributed fresh nutrients, is of great agronomic interest [12].
Regarding P, pyrolysis led to an increase of both total and available P concentrations in all pyrolyzed materials. These results are in line with other studies using sludge as feedstock for pyrolysis [62,63,64] and confirms the potential of pyrolyzed sludge as P fertilizer [34].

4.2. Effects on Corn Production

Increased crop yields are one of the important anticipated benefits of using biochar, especially if the biochar is intended to be used as an organic fertilizer—as is true in our case. Several meta-analyses have summarized the results of hundreds of studies analyzing the relationships between biochar and crop productivity. For instance, Jeffery et al. (2011) [38] and Liu et al (2013) [39] estimated that crop productivity increased on average by 10 and 11% after the addition of biochar. While in 2013, Biederman et al. [65] reported a significant increase in both aerial biomass and crop yields with biochar application. However, there have also been reported cases where biochar caused a decrease in plant growth [66] or no change in yields [67]. This variability in the results is mediated by the properties of the applied biochars, as well as by soil properties. In our study, the application of pyrolyzed materials did not increase maize yield compared to the control treatment. This might be due to their low N availability, since maize is known to be a crop with high N demand [68,69]. On the contrary, we observed an increase in plant growth—meaning the aerial part—of 60% for the Incubated mixture (Figure 1). This material showed the highest fertilizing potential due to the greater availability of micronutrients as well as the macronutrients P and N.
Several studies have identified that biochar applied to soils can increase the availability of some elements, particularly P [70]. Our study provides further evidence for this finding. Moreover, increasing the proportion of sludge in the feedstock mixture led to higher availability of both Fe and P in soil. Thus, the Incubated mixture and pyrolyzed 100% sewage sludge contributed the highest concentrations of available P in soil. This is not surprising, since both amendments supplied the highest direct P inputs to soil. However, we cannot discard a second mechanism, where the introduction of organic C to soil could decrease Ca-bound inorganic P, or reduce its sorption on soil colloids, rendering P more available [64]. Our study shows similarities to previous investigations regarding elements bioavailability in amended soils; for instance in the case of As [59], Cd [71] and Cu [30]. On the other hand, less is known about the influence of biochar on Fe availability. Some studies did not find differences in Fe availability in soil after amendment with biochars from different wastes [72]. Whereas others, such as Speratti et al., (2017) [69], found that Fe availability doubled after the application of sugarcane filtercake biochar in a tropical arenosol.
Our study shows that the different feedstock proportions (sludge: grape seeds ratio) as well as the option of pyrolysing the sludge (or adding it fresh) influenced the fertilizing potential of the final product. The Incubated mixture—followed by 100% sewage sludge—were the two combinations that showed the most potential in this sense, as demonstrated by the superior growth of the plants under these conditions. The plants cultivated with these treatments were those that absorbed the highest amount of P and micro nutrients from soil (Table S3). In the case of the Incubated mixture, this greater capacity for crop fertilization is probably due to the fact that the material had a higher concentration of P and micronutrients than the rest of the treatments. This suggests that there is a relationship between crop efficiency and the greater availability of elements in the material. Additionally, the high concentration of soluble organic carbon in the Incubated mixture influences the mobilization of metals [73], since it causes solubilization. Consequently, these metals are more available for plant uptake. The accumulation of potentially toxic elements—(i.e., As, Cd, etc.)—is of great concern in agricultural production due to the potential threat towards human and animal health [7]. In other studies, potentially toxic elements and nutrients were retained by the biochar instead of being absorbed by the plants [74], thus leading to suppressed plant growth. Conversely, our results show that our results show that the elements are taken up by corn. With respect to the translocation of metals to shoots, the As and Cd content has been evaluated based on the limits set by The European Commission (2013) [75] for graze feeding and determined that they do not present risk. Plants obtained with any of these treatments could, therefore, be used for animal feeding (Table 8). It must be remembered that the introduction of these toxic metals into the human diet is restricted [76,77]; hence, their concentration in the plants must be limited too. The most appropriate plants for human consumption are those which have been cultivated with the Incubated mixture treatment. This is due to the extremely low levels of As and Cd that are retained in the edible part of the plant when using this treatment. Indeed, these are the lowest levels in this study. This mitigation seems to be caused by the concentration-dilution effect due to changes in plant biomass in this experiment [78], e.g., bigger biomass in some of the treatments.

4.3. The Environmental Impact of the Application of Pyrolyzed Materials in Agroecosystems

Excessive application of fertilizers, sludge or other materials to the soil has the potential to mobilize contaminants and nutrients. They reach the ground-water by runoff or by leaching, fertilizing them and causing eutrophication and a loss of water quality [79,80].
As occurs in the case of N [81], P has been widely studied for the negative effects of its leaching [82]. The risk of P losses through leaching rises as the content of phosphorus in the soil increases [83] or as the soil becomes progressively saturated [84]. Another way in which biochar can affect soil elements is through the reduction of leaching losses [81]. Biochar’s porous structure, large surface area, and negative surface charge [85,86] increases the soil’s cation exchange capacity. This allows for the retention of nutrients and contaminants [87], thus delaying leaching [88]. Nevertheless, it has been observed in this project that a higher P leaching in pyrolyzed material treatments was presented compared to the Control.
Some previous studies, such as Lu et al. (2016) [89], have assessed the concentration of potentially toxic elements in leachate of sewage sludge and biochar. Indeed, that particular study concluded that converting sewage sludge into biochar significantly reduces potentially toxic elements’ leaching toxicity. However, few projects have scrutinized the environmental impact of the application of pyrolyzed materials in agrosystems. One study developed by Méndez et al. (2012) [43] analyzed the leaching of Cu and Cd in a sewage sludge biochar amended soil. Méndez’s project, which mirrors findings in this project, showed that the risk of metal leaching decreases after treating the original materials. Although the pyrolyzed materials did not result in a significant decrease in leaching compared to the Control treatment, neither did it produce an increase. Both As and Fe are stable. The data shows no significant changes between the various treatments. Due to the combination of the studies carried out in this investigation, the most appropriate treatments can now be identified and utilized for future experiments. For instance, the treatments 50% grape seeds-50% sewage sludge and the 25% grape seeds-75% sewage sludge have shown an intermediate behavior of leaching and efficiency. On the other hand, the Incubated mixture is the treatment with the highest leaching of metals and nutrients, which indicates that pyrolysis is an efficient technology for sequestering metals and reducing the risk of leaching (Table S4). As previously mentioned, the Incubated mixture had the highest concentration of metals and nutrients available in its composition. Although the greater availability was beneficial for the crop, it poses a risk to the environment; the uptake of elements by plants does not reduce the risks of leaching [90].

5. Conclusions

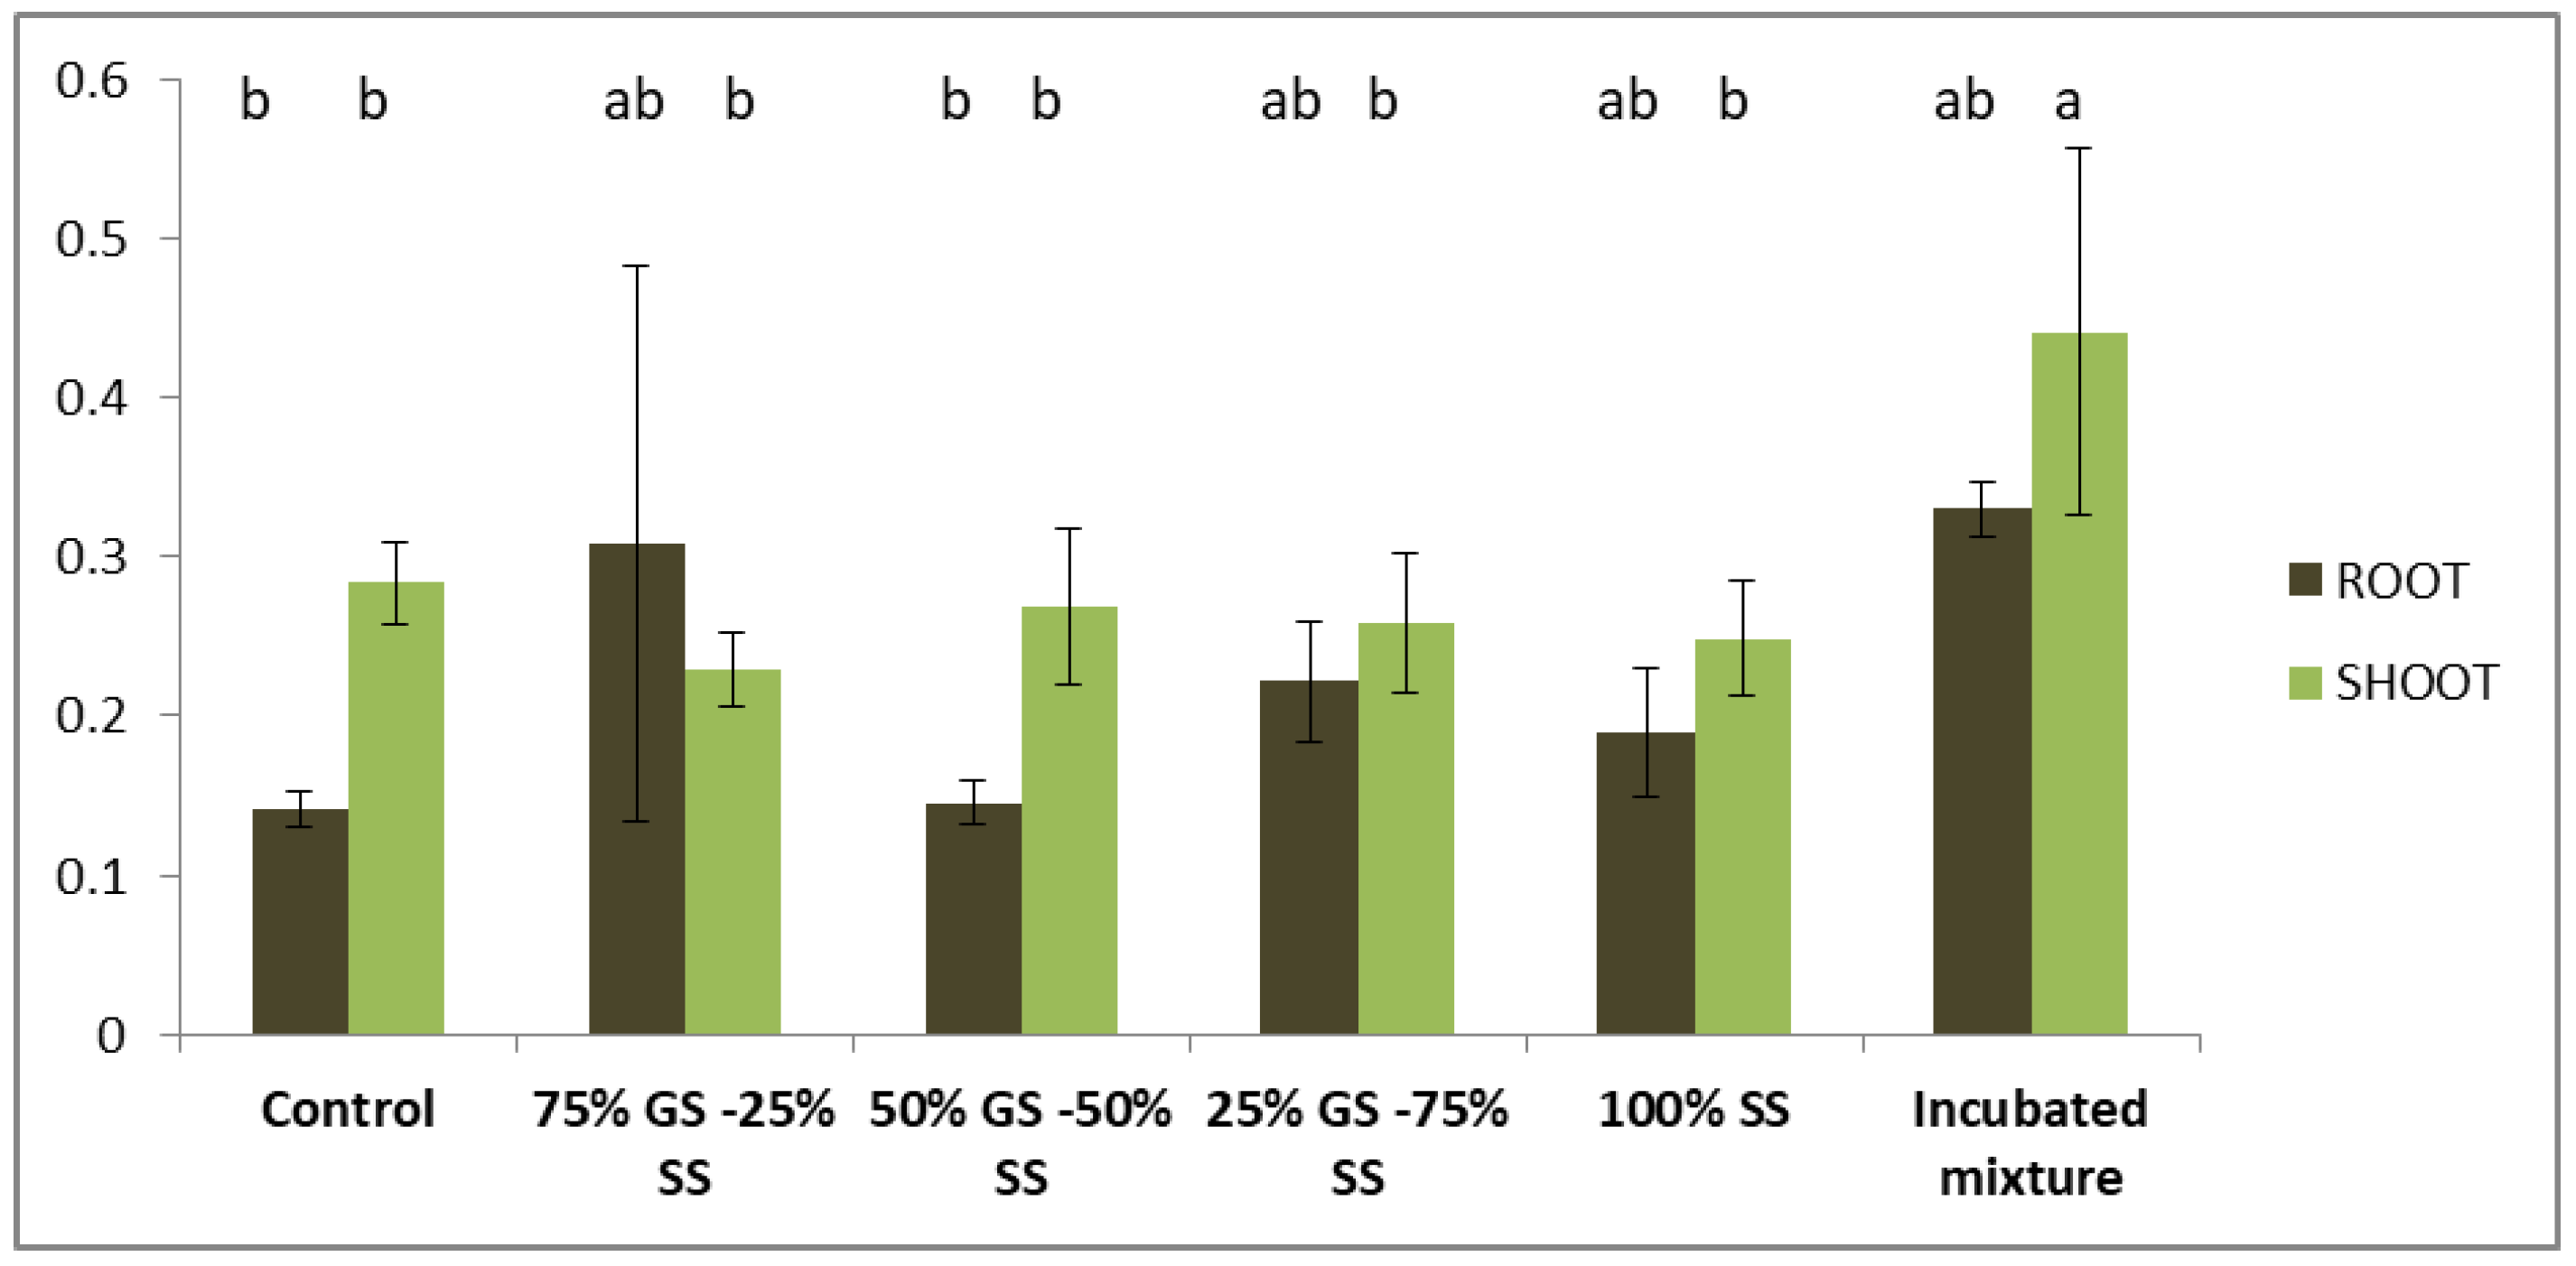
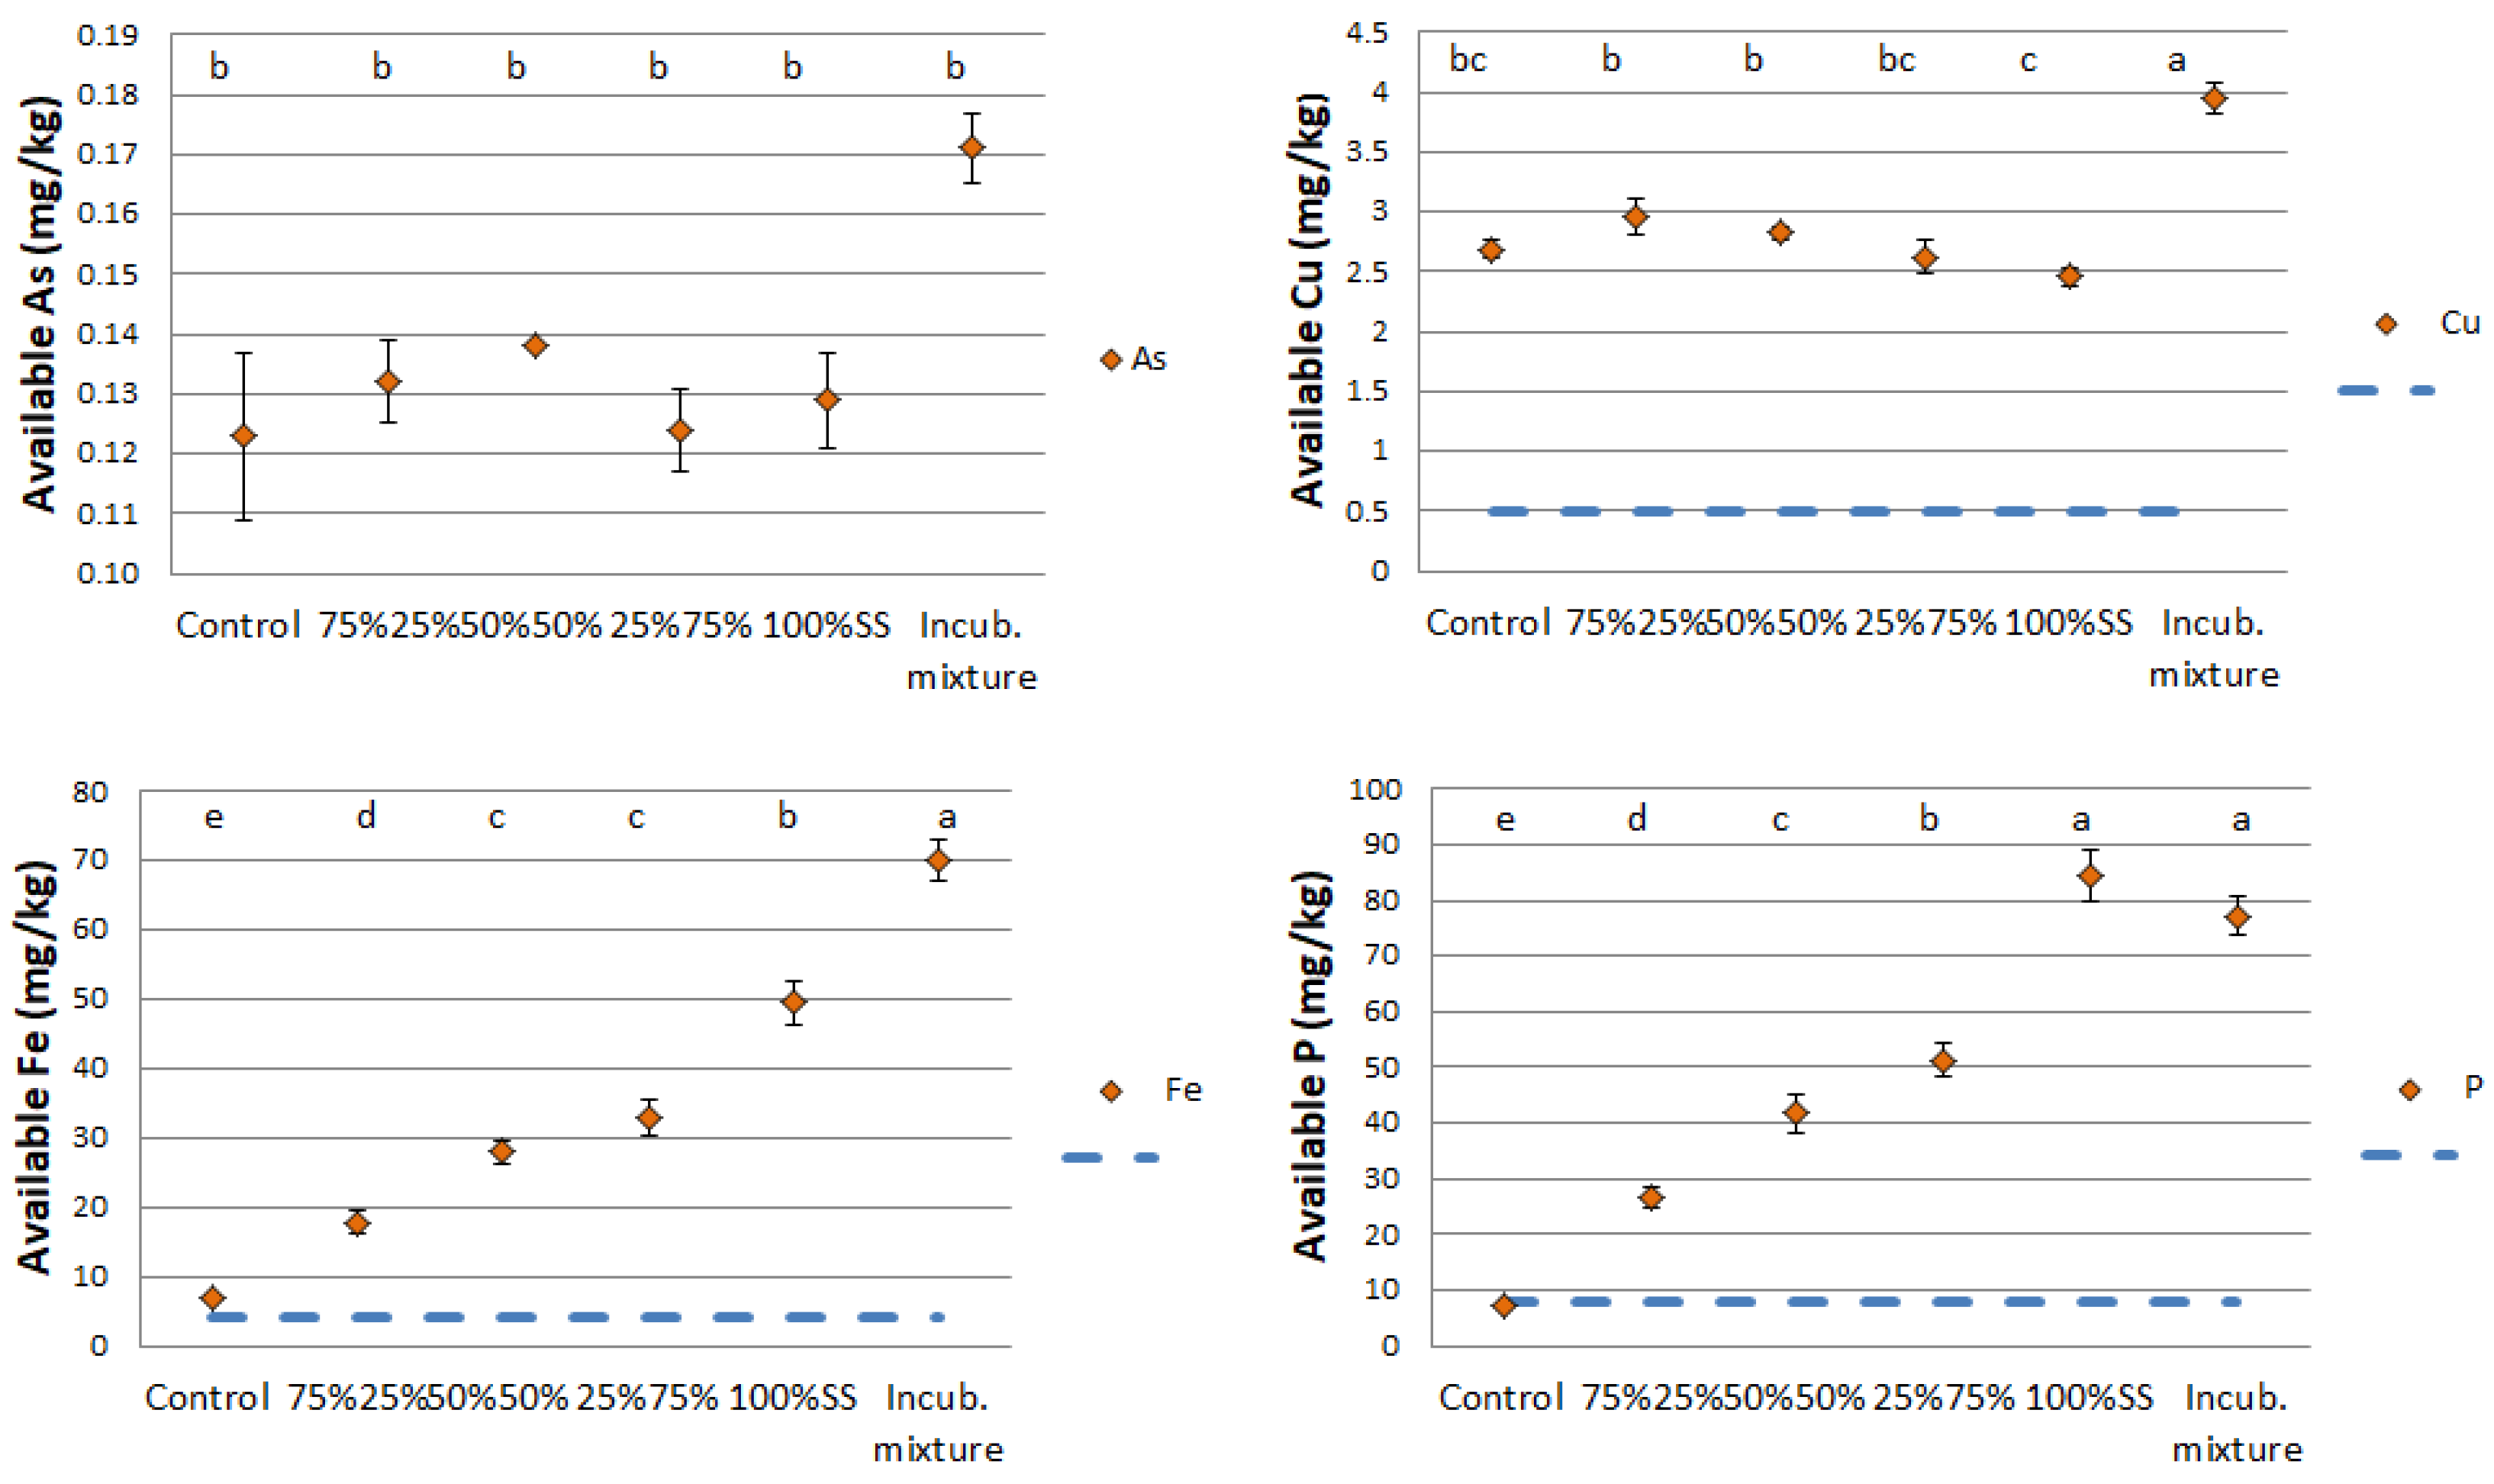
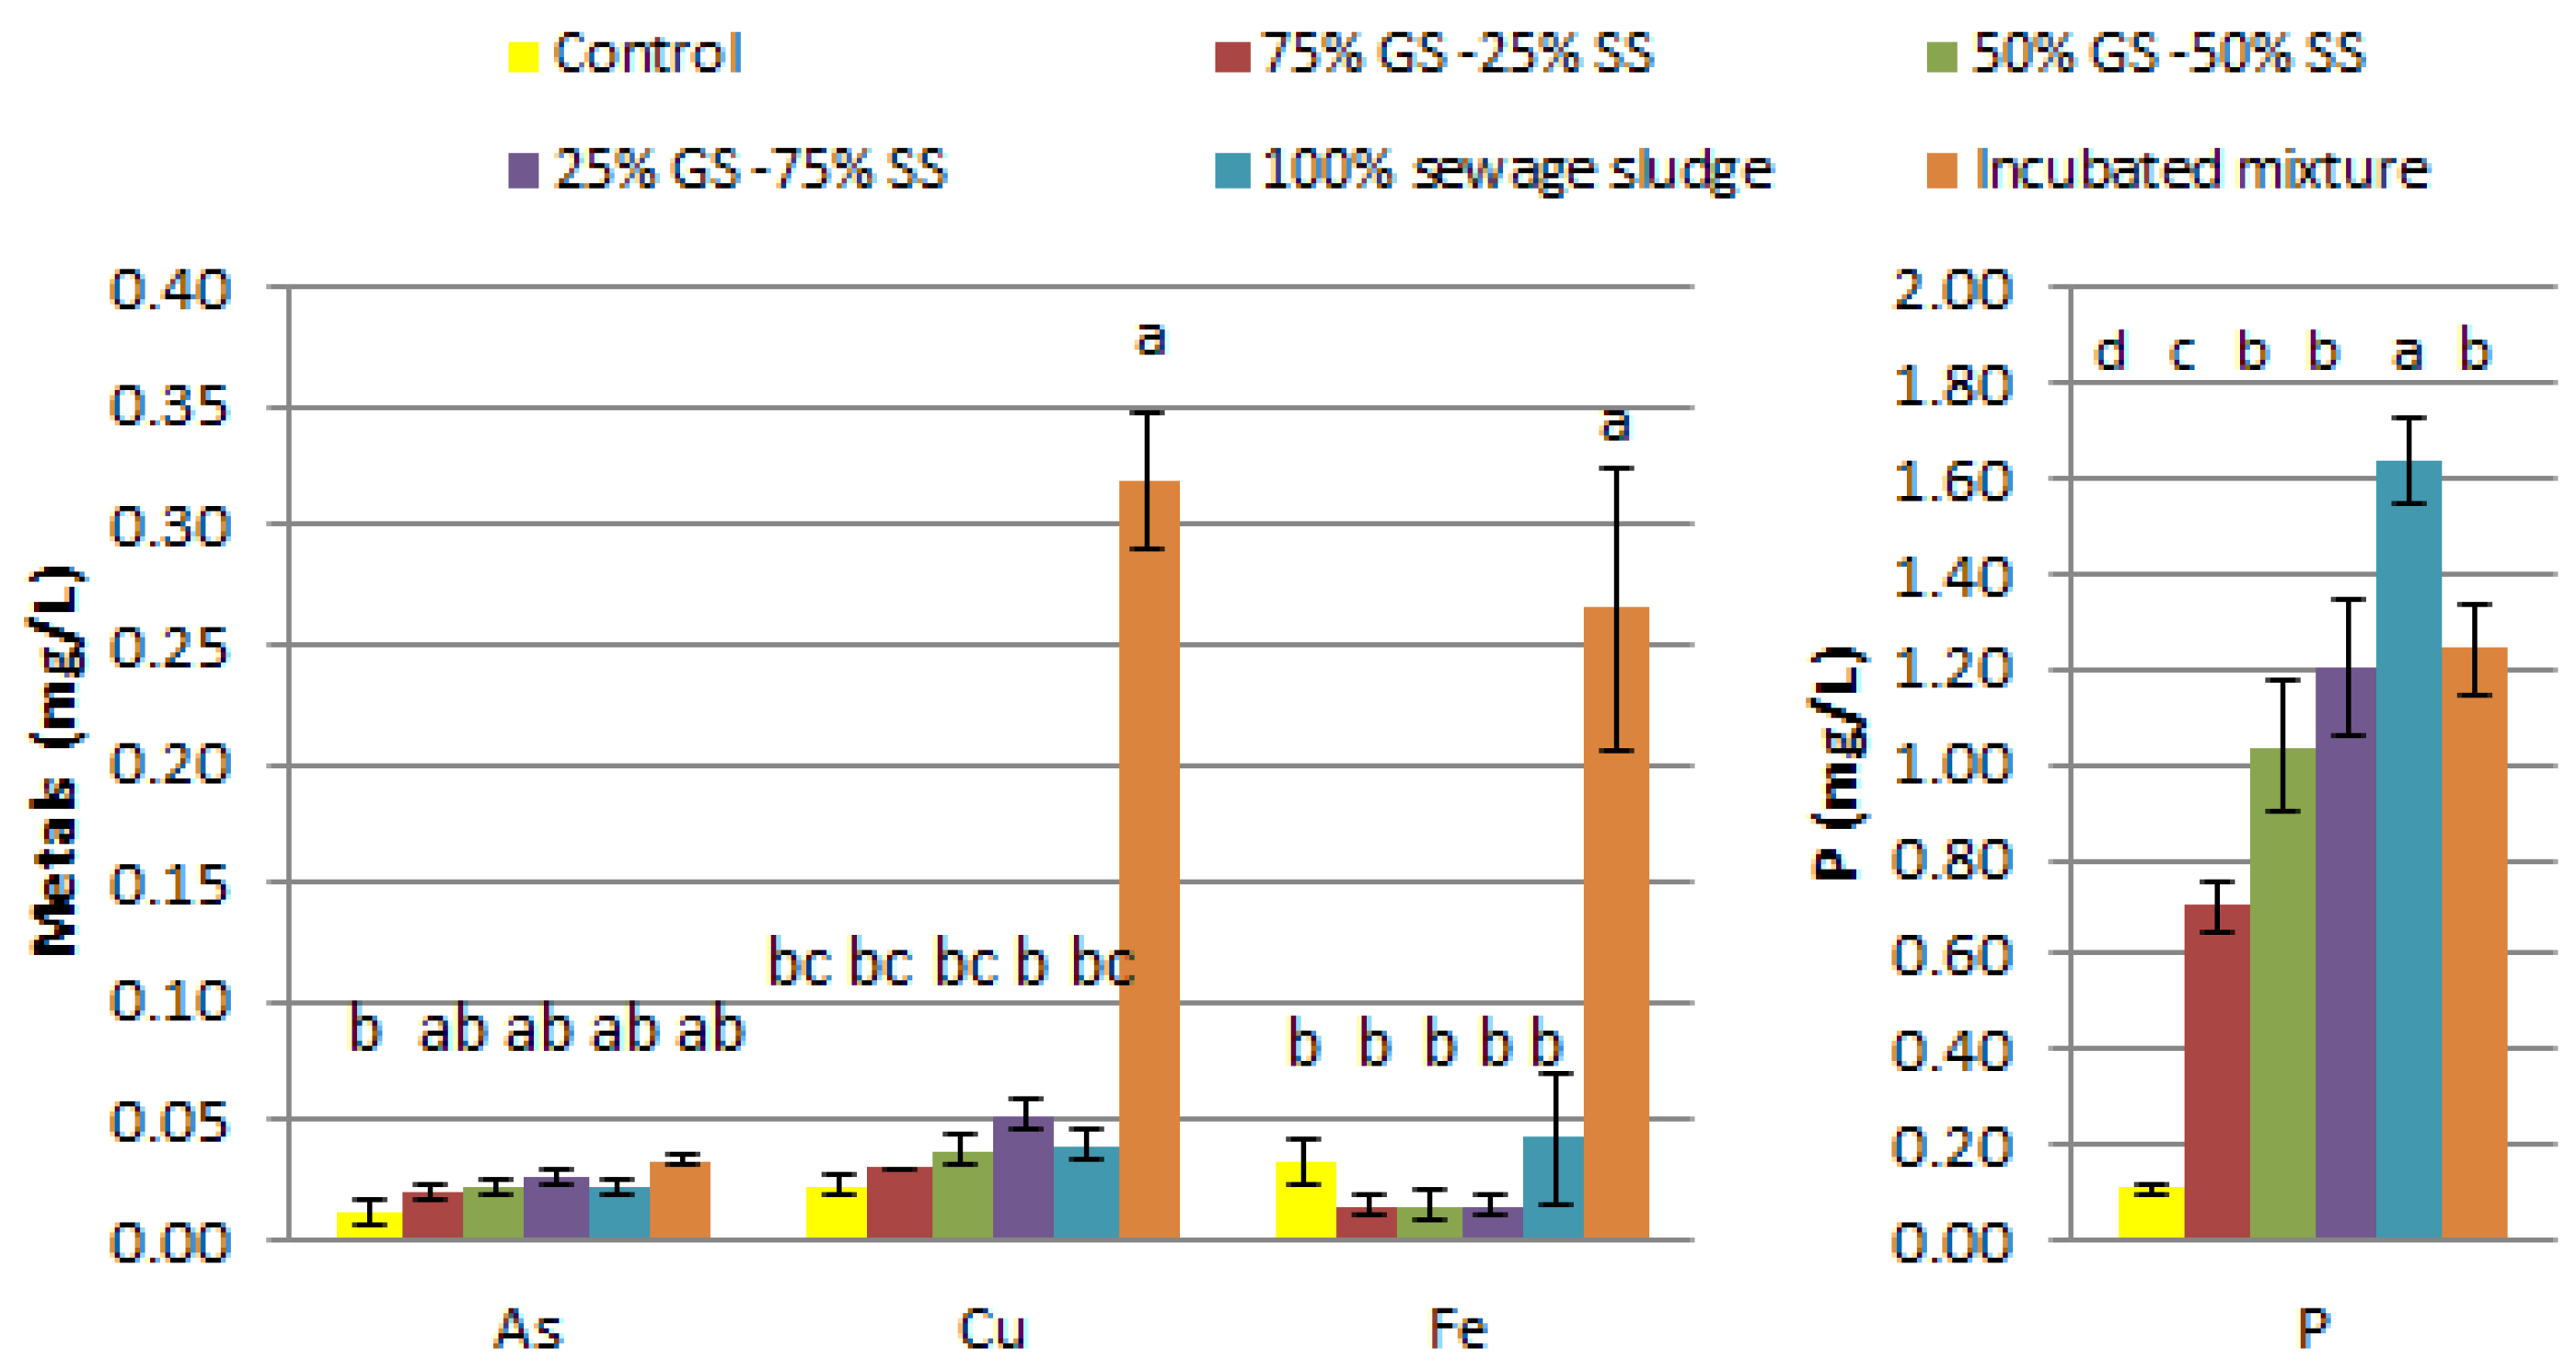
Until now, there have been a great number of studies which have described how biochars, or incubated biochars, are a good source of nutrients for crops, following the idea of waste management. Nevertheless, these projects lack a global vision, in which nutrient supply versus contamination, as well as uptake versus leaching, are fully investigated. In this study, the positives and negatives of the application of biochars on agronomic potential and environmental risk have been addressed, taking into account P, Zn, Cu, Fe, As and Cd. Different materials have been produced based on total or partial pyrolysis of mixtures of grape seeds and sewage sludge wastes. Some products have shown different characteristics regarding their potential use as macro fertilizers (P) and micronutrients (Cu, Fe) sources. On the basis of the presented results, the recommended ratio of sludge:grape seeds treatment is 50% grape seeds-50% sewage sludge due to its intermediate behavior of leaching and efficiency. Nevertheless, in the agronomic trial, the Incubated mixture showed the highest corn biomass production as well as providing the plants with macronutrients and micronutrients. However, the environmental impact from the Incubated mixture was greater than the rest of the treatments. Therefore, the optimization of this material is considered a suitable option as a soil amendment for the future. This could be done by improving the ratio of pyrolyzed material:sludge to decrease leaching while maintaining fertility. This would provide a compromise between maximizing the elements that are translocated to the plant, along with reducing those that are leached. A reduction in the dosage of sludge compared to the pyrolyzed material in the incubation is expected in future investigations.

Supplementary Materials

The following are available online at https://0-www-mdpi-com.brum.beds.ac.uk/2073-4395/9/7/406/s1, Table S1: Different proportions of sewage sludge and grape seeds used, Table S2: Characterization of the soil, Table S3: Percentage of efficiency of elements (%) (averaged value ± standard error; n = 3 or 4), Table S4: Percentage of lixiviation of elements (%) (averaged value ± standard error; n = 3 or 4).

Author Contributions

Conceptualization, E.M.-J.; methodology, E.M.-J.; validation, E.M.-J. and S.A.-H.; formal analysis, S.A.-H.; investigation, S.A.-H.; resources, E.M.-J.; data curation, E.M.-J.; and S.A.-H.; writing—original draft preparation, S.A.-H.; writing—review and editing, S.A.-H., J.N., M.L.C., J.M.P. and E.M.-J.; visualization, E.M.-J. and S.A.-H.; supervision, E.M.-J.; project administration, E.M.-J.

Funding

Part of this research was funded by Project UAM-Santander 2017/ASIA/07.

Acknowledgments

The authors thank the Project UAM-Santander 2017/ASIA/07 “Applications of modified biochars for agro-environmental management” for funding this research. The authors also express appreciation to the following: IMIDRA (Madrid, Spain), Chemical Engineering Department (University Autónoma de Madrid) for the materials provided and technical advices and to Boynton for his English corrections.

Conflicts of Interest

The authors declare no conflict of interest. The funders had no role in the design of the study; in the collection, analyses, or interpretation of data; in the writing of the manuscript, or in the decision to publish the results.

References

  1. Sachs, J.D.; John, W.M. The millennium project: A plan for meeting the millennium development goals. Lancet 2005, 365, 347–353. [Google Scholar]
  2. Tilman, D.; Cassman, K.G.; Matson, P.A.; Naylor, R.; Polasky, S. Agricultural Sustainability and Intensive Production Practices. Nature 2002, 418, 671–677. [Google Scholar] [CrossRef] [PubMed]
  3. McHenry, M.P. Agricultural Bio-Char Production, Renewable Energy Generation and Farm Carbon Sequestration in Western Australia: Certainty, Uncertainty and Risk. Agric. Ecosyst. Environ. 2009, 129, 1–7. [Google Scholar] [CrossRef]
  4. The Commission. Circular economy: New Regulation to boost the use of organic and waste-based fertilisers. Available online: http://europa.eu/rapid/press-release_MEMO-16-826_en.htm (accessed on 23 July 2017).
  5. Paz-Ferreiro, J.; Nieto, A.; Méndez, A.; Askeland, M.P.J.; Gascó, G. Biochar from Biosolids Pyrolysis: A Review. Int. J. Environ. Res. Public Health 2018, 15, 956. [Google Scholar] [CrossRef] [PubMed]
  6. Petersen, S.O.; Henriksen, K.; Mortensen, G.K.; Krogh, P.H.; Brandt, K.K.; Sørensen, J.; Madsen, T.; Petersen, J.; Grøn, C. Recycling of Sewage Sludge and Household Compost to Arable Land: Fate and Effects of Organic Contaminants, and Impact on Soil Fertility. Soil Tillage Res. 2003, 72, 139–152. [Google Scholar] [CrossRef]
  7. Liu, T.; Liu, B.; Zhang, W. Nutrients and Heavy Metals in Biochar Produced by Sewage Sludge Pyrolysis: Its Application in Soil Amendment. Polish J. Environ. Stud. 2014, 23, 271–275. [Google Scholar]
  8. Torri, S.I.; Correa, R.S.; Renella, G. Biosolid Application to Agricultural Land—A Contribution to Global Phosphorus Recycle: A Review. Pedosphere 2017, 27, 1–16. [Google Scholar] [CrossRef]
  9. McGrath, S.P.; Brookes, P.C.; Giller, K.E. Effects of Potentially Toxic Metals in Soil Derived from Past Applications of Sewage Sludge on Nitrogen Fixation by Trifolium Repens L. Soil Biol. Biochem. 1988, 20, 415–424. [Google Scholar] [CrossRef]
  10. Viau, E.; Peccia, J. Survey of Wastewater Indicators and Human Pathogen Genomes in Biosolids Produced by Class A and Class B Stabilization Treatments. Appl. Environ. Microbiol. 2009, 75, 164–174. [Google Scholar] [CrossRef] [Green Version]
  11. Pritchard, D.L.; Penney, N.; McLaughlin, M.J.; Rigby, H.; Schwarz, K. Land Application of Sewage Sludge (Biosolids) in Australia: Risks to the Environment and Food Crops. Water Sci. Technol. 2010, 62, 48–57. [Google Scholar] [CrossRef]
  12. Paramashivam, D.; Dickinson, N.M.; Clough, T.J.; Horswell, J.; Robinson, B.H. Potential Environmental Benefits from Blending Biosolids with Other Organic Amendments before Application to Land. J. Environ. Qual. 2017, 46, 481–489. [Google Scholar] [CrossRef] [Green Version]
  13. Alvarenga, P.; Mourinha, C.; Farto, M.; Santos, T.; Palma, P.; Sengo, J.; Morais, M.C.; Cunha-Queda, C. Sewage Sludge, Compost and Other Representative Organic Wastes as Agricultural Soil Amendments: Benefits versus Limiting Factors. Waste Manag. 2015, 40, 44–52. [Google Scholar] [CrossRef] [PubMed]
  14. Raheem, A.; Sikarwar, V.S.; He, J.; Dastyar, W.; Dionysiou, D.D.; Wang, W.; Zhao, M. Opportunities and Challenges in Sustainable Treatment and Resource Reuse of Sewage Sludge: A Review. Chem. Eng. J. 2017. [Google Scholar] [CrossRef]
  15. European Biochar Foundation (EBC). European Biochar Certificate—Guidelines for a Sustainable Production of Biochar; European Biochar Foundation (EBC): Arbaz, Switzerland, 2016. [Google Scholar]
  16. Hwang, I.H.; Ouchi, Y.; Matsuto, T. Characteristics of Leachate from Pyrolysis Residue of Sewage Sludge. Chemosphere 2017, 68, 1913–1919. [Google Scholar] [CrossRef] [PubMed]
  17. Shackley, S.; Sohi, S. An Assessment of the Benefits and Issues Associated with the Application of Biochar to Soil. Epartment Environ. Food Rural Aff. 2010, 1–132. [Google Scholar]
  18. Woolf, D.; Amonette, J.E.; Street-Perrott, F.A.; Lehmann, J.; Joseph, S. Sustainable Biochar to Mitigate Global Climate Change. Nat. Commun. 2010, 1, 1–9. [Google Scholar] [CrossRef] [PubMed]
  19. Lehmann, J.; Joseph, S. Biochar for Environmental Management. Science, Technology and Implementation; Earthscan from Routledge: London, UK, 2015. [Google Scholar]
  20. Atkinson, C.J.; Fitzgerald, J.D.; Hipps, N.A. Potential Mechanisms for Achieving Agricultural Benefits from Biochar Application to Temperate Soils: A Review. Plant Soil 2010, 337, 1–18. [Google Scholar] [CrossRef]
  21. Karayildirim, T.; Yanik, J.; Yuksel, M.; Bockhorn, H. Characterisation of Products from Pyrolysis of Waste Sludges. Fuel 2006, 85, 1498–1508. [Google Scholar] [CrossRef]
  22. Karaca, C.; Sözen, S.; Orhon, D.; Okutan, H. High Temperature Pyrolysis of Sewage Sludge as a Sustainable Process for Energy Recovery High Temperature Pyrolysis of Sewage Sludge as a Sustainable Process for Energy Recovery. Waste Manag. 2018, 78, 217–226. [Google Scholar] [CrossRef]
  23. Hossain, M.K.; Strezov, V.; Chan, K.Y.; Nelson, P.F. Agronomic Properties of Wastewater Sludge Biochar and Bioavailability of Metals in Production of Cherry Tomato (Lycopersicon Esculentum). Chemosphere 2010, 78, 1167–1171. [Google Scholar] [CrossRef]
  24. Isidoria, M.; Gonzaga, S.; Mackowiak, C.L.; Brian, N.; Flávio, E.; Shirley, J.P.; Vieira, D. Pyrolysis Methods Impact Biosolids-Derived Biochar Composition, Maize Growth and Nutrition. Soil Tillage Res. 2017, 165, 59–65. [Google Scholar] [CrossRef]
  25. Abdur, R.; Rizwan, M.; Farooq, M.; Ali, S.; Zia-ur-rehman, M.; Zafar-ul-hye, M.; Hafeez, F.; Fasih, M. E Ffi Ciency of Various Sewage Sludges and Their Biochars in Improving Selected Soil Properties and Growth of Wheat (Triticum Aestivum). J. Environ. Manag. 2018, 223, 607–613. [Google Scholar] [CrossRef]
  26. Uchimiya, M.; Hiradate, S.; Antal, M.J. Dissolved Phosphorus Speciation of Flash Carbonization, Slow Pyrolysis, and Fast Pyrolysis Biochars. ACS Sustain. Chem. Eng. 2015, 3, 1642–1649. [Google Scholar] [CrossRef]
  27. Mackay, J.E.; Cavagnaro, T.R.; Jakobsen, I.; Macdonald, L.M.; Grønlund, M.; Thomsen, T.P. Evaluation of Phosphorus in Thermally Converted Sewage Sludge: P Pools and Availability to Wheat. Plant Soil 2017, 418, 307–317. [Google Scholar] [CrossRef]
  28. Yuan, H.; Lu, T.; Wang, Y.; Chen, Y.; Lei, T. Geoderma Sewage Sludge Biochar: Nutrient Composition and Its Effect on the Leaching of Soil Nutrients. Geoderma 2016, 267, 17–23. [Google Scholar] [CrossRef]
  29. Fristak, V.; Pipíska, M.; Soja, G. Pyrolysis Treatment of Sewage Sludge: A Promising Way to Produce Phosphorus Fertilizer St a. J. Clean. Prod. 2018, 172, 1772–1778. [Google Scholar] [CrossRef]
  30. Khan, S.; Wang, N.; Reid, B.J.; Freddo, A.; Cai, C. Reduced Bioaccumulation of PAHs by Lactuca Satuva L. Grown in Contaminated Soil Amended with Sewage Sludge and Sewage Sludge Derived Biochar. Environ. Pollut. 2013, 175, 64–68. [Google Scholar] [CrossRef] [PubMed]
  31. Oleszczuk, P.; Jo, I.; Ku, M. Biochar Properties Regarding to Contaminants Content and Ecotoxicological Assessment. J. Hazard. Mater. 2013, 260, 375–382. [Google Scholar] [CrossRef]
  32. Inguanzo, M.; Domı, A.; Mene, J.A.; Blanco, C.G.; Pis, J.J. On the Pyrolysis of Sewage Sludge: The Influence of Pyrolysis Conditions on Solid, Liquid and Gas Fractions. J. Anal. Appl. Pyrolysis 2002, 63, 209–222. [Google Scholar] [CrossRef]
  33. Wang, Z.; Shu, X.; Zhu, H.; Xie, L.; Cheng, S. Characteristics of biochars prepared by co-pyrolysis of sewage sludge and cotton stalk intended for use as soil amendments. Environ. Technol. 2018, 1–22. [Google Scholar] [CrossRef]
  34. Faria, W.M.; De Figueiredo, C.C.; Coser, T.R.; Vale, A.T.; Schneider, B.G. Is Sewage Sludge Biochar Capable of Replacing Inorganic Fertilizers for Corn Production? Evidence from a Two-Year Field Experiment. Arch. Agron. Soil Sci. 2018, 64, 505–519. [Google Scholar] [CrossRef]
  35. Huang, M.; Yang, L.; Qin, H.; Jiang, L.; Zou, Y. Quantifying the Effect of Biochar Amendment on Soil Quality and Crop Productivity in Chinese Rice Paddies. Field Crops Res. 2013, 154, 172–177. [Google Scholar] [CrossRef]
  36. Qiao, Z.; Chen, L.; Li, L. Effects of Biochar Fertilizer on Growth and Nitrogen Utilizing Rate of Rice. Chin. Agric. Sci. Bull. 2014, 30, 175–180. [Google Scholar]
  37. Zhang, A.; Cui, L.; Pan, G.; Li, L.; Hussain, Q.; Zhang, X.; Zheng, J.; Crowley, D. Effect of Biochar Amendment on Yield and Methane and Nitrous Oxide Emissions from a Rice Paddy from Tai Lake Plain, China. Agric. Ecosyst. Environ. 2010, 139, 469–475. [Google Scholar] [CrossRef]
  38. Jeffery, S.; Verheijen, F.G.A.; van der Velde, M.; Bastos, A.C. A Quantitative Review of the Effects of Biochar Application to Soils on Crop Productivity Using Meta-Analysis. Agric. Ecosyst. Environ. 2011, 144, 175–187. [Google Scholar] [CrossRef]
  39. Liu, X.; Zhang, A.; Ji, C.; Joseph, S.; Bian, R.; Li, L.; Pan, G.; Paz-Ferreiro, J. Biochar’s Effect on Crop Productivity and the Dependence on Experimental Conditions-a Meta-Analysis of Literature Data. Plant Soil 2013, 373, 583–594. [Google Scholar] [CrossRef]
  40. Zhang, J.; Lü, F.; Shao, L.; He, P. The Use of Biochar-Amended Composting to Improve the Humification and Degradation of Sewage Sludge. Bioresour. Technol. 2014, 168, 252–258. [Google Scholar] [CrossRef] [PubMed]
  41. Steiner, C.; Teixeira, W.G.; Lehmann, J.; Nehls, T.; De MacÊdo, J.L.V.; Blum, W.E.H.; Zech, W. Long Term Effects of Manure, Charcoal and Mineral Fertilization on Crop Production and Fertility on a Highly Weathered Central Amazonian Upland Soil. Plant Soil 2007, 291, 275–290. [Google Scholar] [CrossRef]
  42. Fiorentino, N.; Sánchez-monedero, M.A.; Lehmann, J.; Enders, A.; Fagnano, M. Interactive Priming of Soil N Transformations from Combining Biochar and Urea Inputs: A 15 N Isotope Tracer Study. Soil Biol. Biochem. 2019, 131, 166–175. [Google Scholar] [CrossRef]
  43. Méndez, A.; Gómez, A.; Paz-Ferreiro, J.; Gascó, G. Effects of Sewage Sludge Biochar on Plant Metal Availability after Application to a Mediterranean Soil. Chemosphere 2012, 89, 1354–1359. [Google Scholar] [CrossRef]
  44. Rayment, G.E.; Lyons, D.J. Soil Chemical Methods—Australasia; CSIRO: Clayton South, VIC, Australia, 2011. [Google Scholar]
  45. Normalización Española. Norma UNE-EN 13651:2002. Available online: https://www.une.org/encuentra-tu-norma/busca-tu-norma/norma/?c=N0026422 (accessed on 23 June 2019).
  46. Ministerio de Agricultura pesca y alimentacion (MAPA). Métodos Oficiales de Analisis En La Union Europea; Ministerio de Agricultura, Pesca y Alimentación, Secretaría General Técnica: Madrid, Spain, 1998.
  47. Moreno-Jiménez, E.; Plaza, C.; Saiz, H.; Manzano, R.; Flagmeier, M.; Maestre, F.T. Aridity and Reduced Soil Micronutrient Availability in Global Drylands. Nat. Sustain. 2019, 2, 371–377. [Google Scholar] [CrossRef]
  48. Moreno-Jiménez, E.; Peñalosa, J.M.; Manzano, R.; Carpena-Ruiz, R.O.; Gamarra, R.; Esteban, E. Heavy Metals Distribution in Soils Surrounding an Abandoned Mine in NW Madrid (Spain) and Their Transference to Wild Flora. J. Hazard. Mater. 2009, 162, 854–859. [Google Scholar] [CrossRef]
  49. FAO soil unit. Soil Map of the World; United Nations Educational, Scientific and Cultural Organization: Paris, France, 1974. [Google Scholar] [CrossRef]
  50. Benton Jones, J. Soil Analysis Handbook of Reference Methods; CRC Press: Boca raton, FL, USA, 1999. [Google Scholar]
  51. Kim, K.H.; Kim, J.Y.; Cho, T.S.; Choi, J.W. Influence of Pyrolysis Temperature on Physicochemical Properties of Biochar Obtained from the Fast Pyrolysis of Pitch Pine (Pinus Rigida). Bioresour. Technol. 2012, 118, 158–162. [Google Scholar] [CrossRef] [PubMed]
  52. Rehrah, D.; Reddy, M.R.; Novak, J.M.; Bansode, R.R.; Schimmel, K.A.; Yu, J.; Watts, D.W.; Ahmedna, M. Production and Characterization of Biochars from Agricultural by-Products for Use in Soil Quality Enhancement. J. Anal. Appl. Pyrolysis 2014, 108, 301–309. [Google Scholar] [CrossRef]
  53. Singh, B.P.; Cowie, A.L. Characterisation and Evaluation of Biochars for Their Application as a Soil Amendment. Aust. J. Soil Res. 2010, 48, 516–525. [Google Scholar] [CrossRef]
  54. Gascó, G.; Paz-Ferreiro, J.; Méndez, A. Thermal Analysis of Soil Amended with Sewage Sludge and Biochar from Sewage Sludge Pyrolysis. J. Therm. Anal. Calorim. 2012, 108, 769–775. [Google Scholar] [CrossRef]
  55. Özçimen, D.; Ersoy-Meriçboyu, A. Characterization of Biochar and Bio-Oil Samples Obtained from Carbonization of Various Biomass Materials. Renew. Energy 2010, 35, 1319–1324. [Google Scholar] [CrossRef]
  56. Yin, R.; Liu, R.; Mei, Y.; Fei, W.; Sun, X. Characterization of Bio-Oil and Bio-Char Obtained from Sweet Sorghum Bagasse Fast Pyrolysis with Fractional Condensers. Fuel 2013, 112, 96–104. [Google Scholar] [CrossRef]
  57. Pearson, K.E.; Bauder, J.W. The Basics of Salinity and Sodicity Effects on Soil Physical Properties. MSU Ext. Water Qual. 2006, 1–11. [Google Scholar]
  58. Hua, L.; Wu, W.; Liu, Y.; McBride, M.B.; Chen, Y. Reduction of Nitrogen Loss and Cu and Zn Mobility during Sludge Composting with Bamboo Charcoal Amendment. Environ. Sci. Pollut. Res. 2009, 16, 1–9. [Google Scholar] [CrossRef]
  59. Beesley, L.; Moreno-Jiménez, E.; Gomez-Eyles, J.L. Effects of Biochar and Greenwaste Compost Amendments on Mobility, Bioavailability and Toxicity of Inorganic and Organic Contaminants in a Multi-Element Polluted Soil. Environ. Pollut. 2010, 158, 2282–2287. [Google Scholar] [CrossRef]
  60. Camps-Arbestain, M.; Amonette, J.; Singh, B.P.; Wang, T.; Schmidt, H.P. A Biochar Classification System and Associated Test Methods. In Biochar for Environmental Management. Science, Technology and Implementation; Lehmann, J., Joseph, S., Eds.; Routledge: Abingdou, UK, 2015; pp. 165–193. [Google Scholar]
  61. Schouten, S.; van Groenigen, J.W.; Oenema, O.; Cayuela, M.L. Bioenergy from Cattle Manure? Implications of Anaerobic Digestion and Subsequent Pyrolysis for Carbon and Nitrogen Dynamics in Soil. GCB Bioenergy 2012, 4, 751–760. [Google Scholar] [CrossRef]
  62. Wang, T.; Camps-arbestain, M.; Hedley, M.; Bishop, P. Predicting Phosphorus Bioavailability from High-Ash Biochars. Plant Soil 2012, 357, 173–187. [Google Scholar] [CrossRef]
  63. Qian, T.; Zhang, X.; Hu, J.; Jiang, H. Effects of Environmental Conditions on the Release of Phosphorus from Biochar. Chemosphere 2013, 93, 2069–2075. [Google Scholar] [CrossRef] [PubMed]
  64. Schneider, F.; Haderlein, S.B. Potential Effects of Biochar on the Availability of Phosphorus—Mechanistic Insights. Geoderma 2016, 277, 83–90. [Google Scholar] [CrossRef]
  65. Biederman, L.A.; Stanley Harpole, W. Biochar and Its Effects on Plant Productivity and Nutrient Cycling: A Meta-Analysis. GCB Bioenergy 2013, 5, 202–214. [Google Scholar] [CrossRef]
  66. Van Zwieten, L.; Kimber, S.; Morris, S.; Chan, K.Y.; Downie, A.; Rust, J.; Joseph, S.; Cowie, A. Effects of Biochar from Slow Pyrolysis of Papermill Waste on Agronomic Performance and Soil Fertility. Plant Soil 2010, 327, 235–246. [Google Scholar] [CrossRef]
  67. Laird, D.A.; Novak, J.M.; Collins, H.P.; Ippolito, J.A.; Karlen, D.L.; Lentz, R.D.; Sistani, K.R.; Spokas, K.; Van Pelt, R.S. Multi-Year and Multi-Location Soil Quality and Crop Biomass Yield Responses to Hardwood Fast Pyrolysis Biochar. Geoderma 2017, 289, 46–53. [Google Scholar] [CrossRef]
  68. Rajkovich, S.; Enders, A.; Hanley, K.; Hyland, C.; Zimmerman, A.R. Corn Growth and Nitrogen Nutrition after Additions of Biochars with Varying Properties to a Temperate Soil. Springerlink 2012, 271–284. [Google Scholar] [CrossRef]
  69. Speratti, A.B.; Johnson, M.S.; Sousa, H.M. Biochars from Local Agricultural Waste Residues Contribute to Soil Quality and Plant Growth in a Cerrado Region (Brazil) Arenosol. GCB Bioenergy 2017, 1–15. [Google Scholar] [CrossRef]
  70. Gao, S.; Deluca, T.H. Wood Biochar Impacts Soil Phosphorus Dynamics and Microbial Communities in Organically-Managed Croplands. Soil Biol. Biochem. 2018, 126, 144–150. [Google Scholar] [CrossRef]
  71. Waqas, M.; Li, G.; Khan, S. Application of Sewage Sludge and Sewage Sludge Biochar to Reduce Polycyclic Aromatic Hydrocarbons (PAH) and Potentially Toxic Elements (PTE) Accumulation in Tomato. Springerlink 2015, 22, 12114–12123. [Google Scholar] [CrossRef]
  72. López-Cano, I.; Cayuela, M.L.; Sánchez-García, M.; Sánchez-Monedero, M. Suitability of Different Agricultural and Urban Organic Wastes as Feedstocks for the Production of Biochar—Part 2: Agronomical Evaluation as Soil Amendment. Sustainability 2018, 10, 2077. [Google Scholar] [CrossRef]
  73. Strobel, B.W.; Borggaard, O.K.; Hansen, H.C.B.; Andersen, M.K.; Raulund-Rasmussen, K. Dissolved Organic Carbon and Decreasing pH Mobilize Cadmium and Copper in Soil. Eur. J. Soil Sci. 2005, 56, 189–196. [Google Scholar] [CrossRef]
  74. Song, X.D.; Xue, X.Y.; Chen, D.Z.; He, P.J.; Dai, X.H. Application of Biochar from Sewage Sludge to Plant Cultivation: Influence of Pyrolysis Temperature and Biochar-to-Soil Ratio on Yield and Heavy Metal Accumulation. Chemosphere 2014, 109, 213–220. [Google Scholar] [CrossRef] [PubMed]
  75. The European Commission. COMMISSION REGULATION (EU) No 1275/2013. Off. J. Eur. Union 2013, 328, 1–7. [Google Scholar]
  76. European Food Safety Authority (EFSA). Scientific Opinion on Arsenic in Food. EFSA J. 2009, 7, 1351. [Google Scholar] [CrossRef]
  77. European Food Safety Authority (EFSA). Cadmium Dietary Exposure in the European Population. EFSA J. 2012, 10, 2551. [Google Scholar] [CrossRef]
  78. Terman, G.L.; Giordano, P.M.; Allen, S.E. Relationships Between Dry Matter Yields and Concentrations of Zn and P in Young Corn Plants. Agron. J. 1972, 64, 684. [Google Scholar] [CrossRef]
  79. Correll, D.L. The Role of Phosphorus in the Eutrophication of Receiving Waters: A Review. J. Environ. Qual. 1998, 27, 261. [Google Scholar] [CrossRef]
  80. Daniel, T.C.; Sharpley, A.N.; Lemunyon, J.L. Agricultural Phosphorus and Eutrophication: A Symposium Overview. J. Environ. Qual. 1998, 27, 251. [Google Scholar] [CrossRef]
  81. Laird, D.; Fleming, P.; Wang, B.; Horton, R.; Karlen, D. Biochar Impact on Nutrient Leaching from a Midwestern Agricultural Soil. Geoderma 2010, 158, 436–442. [Google Scholar] [CrossRef]
  82. Stutter, M.I. The Composition, Leaching, and Sorption Behavior of Some Alternative Sources of Phosphorus for Soils. Springerlink 2015, 44, 207–216. [Google Scholar] [CrossRef] [PubMed]
  83. Svanbäck, A.; Ulén, B.; Etana, A.; Bergström, L.; Kleinman, P.J.A.; Mattsson, L. Influence of Soil Phosphorus and Manure on Phosphorus Leaching in Swedish Topsoils. Nutr. Cycl. Agroecosyst. 2013, 96, 133–147. [Google Scholar] [CrossRef]
  84. Novak, J.M.; Busscher, W.J.; Watts, D.W.; Laird, D.A.; Ahmedna, M.A.; Niandou, M.A.S. Short-Term CO2 Mineralization after Additions of Biochar and Switchgrass to a Typic Kandiudult. Geoderma 2010, 154, 281–288. [Google Scholar] [CrossRef]
  85. Cheng, C.H.; Lehmann, J.; Engelhard, M.H. Natural Oxidation of Black Carbon in Soils: Changes in Molecular Form and Surface Charge along a Climosequence. Geochim. Cosmochim. Acta 2008, 72, 1598–1610. [Google Scholar] [CrossRef]
  86. Bird, M.I.; Ascough, P.L.; Young, I.M.; Wood, C.V.; Scott, A.C. X-Ray Microtomographic Imaging of Charcoal. J. Archaeol. Sci. 2008, 35, 2698–2706. [Google Scholar] [CrossRef]
  87. Major, J.; Rondon, M.; Molina, D.; Riha, S.J.; Lehmann, J. Nutrient Leaching in a Colombian Savanna Oxisol Amended with Biochar. J. Environ. Qual. 2012, 41, 1076. [Google Scholar] [CrossRef] [PubMed]
  88. Beck, D.A.; Johnson, G.R.; Spolek, G.A. Amending Greenroof Soil with Biochar to Affect Runoff Water Quantity and Quality. Environ. Pollut. 2011, 159, 2111–2118. [Google Scholar] [CrossRef]
  89. Lu, T.; Yuan, H.; Wang, Y.; Huang, H. Characteristic of Heavy Metals in Biochar Derived from Sewage Sludge. J. Mater. Cycles Waste Manag. 2016, 725–733. [Google Scholar] [CrossRef]
  90. Ding, Y.; Liu, Y.X.; Wu, W.X.; Shi, D.Z.; Yang, M.; Zhong, Z.K. Evaluation of Biochar Effects on Nitrogen Retention and Leaching in Multi-Layered Soil Columns. Water. Air. Soil Pollut. 2010, 213, 47–55. [Google Scholar] [CrossRef]
Figure 1. Dry weight of corn plants (g) (averaged value ± standard error; n = 4). Letters are comparing the treatments.
Agronomy 09 00406 g001
Figure 2. Concentrations (mg/kg) of metals (As, Cu, Fe) and P in soils treated with pyrolyzed materials (averaged value ± standard error; n = 3 or 4). Values for Cd are not shown because its concentration was always below the detection limit. The blue line represents a reference level for the different elements at the following values: Cu (0.5 mg/kg), Fe (4 mg/kg) and P (8 mg/kg) according to Benton Jones (1999). Letters are comparing the treatments.
Agronomy 09 00406 g002
Figure 3. Concentrations (mg/L) of metals (As, Cu, Fe) and P in leachates from soils treated with pyrolyzed materials (averaged value ± standard error; n = 3 or 4). Values for Cd are not shown because its concentration was always below the detection limit. Letters are comparing the treatments.
Agronomy 09 00406 g003
Table 1. Characterization of the initial feedstocks (averaged value ± standard error; n = 3).
Feedstock%C%H%NC/NpHEC (S/m)
Grape seeds53.6 ± 0.41.7 ± 0.1 6.8 ± 0.1 84.31 ± 0.030.0017 ± 0.0010
Sewage sludge22.6 ± 0.1 3.5 ± 0.1 3.6 ± 0.1 64.88 ± 0.060.54 ± 0.01
Statistical differences have not been carried out because it is shown a characterization of different materials.
Table 2. Diethylenetriaminepentaacetic acid (DTPA)/CaCl2 extractable and total concentrations of potentially toxic elements and P in initial feedstocks (mg/kg) (averaged value ± standard error; n = 2 or 3).
As (mg/kg)Cd (mg/kg)Cu (mg/kg)Fe (mg/kg)P (mg/kg)
FeedstockAvailableTotalAvailableTotalAvailableTotalAvailableTotalAvailableTotal
Grape seedsBDLBDLBDLBDL0.23 ± 0.0216 ± 71.5 ± 0.165 ± 20BDL43 ± 1
Sewage sludge0.420 ± 0.0092.3 ± 0.40.1 ± 0.01.3 ± 0.44.12 ± 0.05153 ± 468.5 ± 0.42341 ± 1038BDL335 ± 12
BDL: below the detection limit; statistical differences have not been carried out because it is shown a characterization of different materials.
Table 3. Characterization of the pyrolyzed materials (averaged value ± standard error; n = 3).
Treatment%C%H%NC/NH:CpHEC (μS/cm)DOC (mg/L)Ca (g/kg)Mg (g/kg)Na (g/kg)K (mg/kg)
100% GS66 ± 1 a3.81 ± 0.03 a3.16 ± 0.17 a210.697.0 ± 0.1 b40 ± 3 c9.0 ± 0.8 b1.27 ± 0.01 b0.2570 ± 0.0010 b4.00E + 02 ± 8E − 06 c781 ± 17 a
75% GS-25% SS39 ± 2 b2.6 ± 0.1 b2.72 ± 0.07 ab140.807.0 ± 0.1 b710 ± 71 b12 ± 2 b12 ± 2 ab1.37 ± 0.07 ab0.15 ± 0.02 bc801 ± 79 a
50% GS-50% SS27.3 ± 0.8 cd1.98 ± 0.04 c2.33 ± 0.03 c120.878.0 ± 0.1 a1156 ± 23 b12 ± 4 b22 ± 4 a2.5 ± 0,5 a0.216 ± 0.002 ab739 ± 10 a
25% GS-75% SS23 ± 1 d1.73 ± 0.09 c2.4 ± 0.1 bc100.907.7 ± 0.2 a1411 ± 322 ab17 ± 6 b26 ± 2 a2.4 ± 0.2 a0.287 ± 0.010 a620 ± 24 a
100% SS17.7 ± 0.5 e1.32 ± 0.04 d2.23 ± 0.07 c80.907.9 ± 0.1 a2497 ± 54 a13.7 ± 0.3 b24.0 ± 0.5 a2.2 ± 0.2 a0.26 ± 0.05 ab672 ± 36 a
Incubated mixture28.9 ± 1.0 c3.42 ± 0.13 a2.83 ± 0.04 ab101.427.65 ± 0.08 a2757 ± 166 a97 ± 3 a18 ± 4 a1.6 ± 0.3 ab0.19 ± 0.02 ab587 ± 68 a
Letters are comparing the treatments in each row.
Table 4. DTPA/CaCl2 extractable and total concentrations of potentially toxic elements and P in the pyrolyzed materials (mg/kg) (averaged value ± standard error; n = 2 or 3).
As (mg/kg)Cd (mg/kg)Cu (mg/kg)Fe (mg/kg)P (mg/kg)
TreatmentAvailableTotalAvailableTotalAvailableTotalAvailableTotalAvailableTotal
100% GSBDLBDLBDLBDL0.23 ± 0.11b17 ± 1 d2± 1 d127 ± 20 d17 ± 4 c5431 ± 188 c
75% GS-25% SSBDL1.0 ± 0.5 cBDL0.993 ± 0.001 b0.20 ±0.06 b184 ± 7 b34 ± 1 c24783 ± 1902 b52 ± 5 b20481 ± 1641 ab
50% GS-50% SS0.03 ± 0.02 b0.7 ± 0.3 cBDL0.996 ± 0.001 b0.17 ± 0.02 b127 ± 10 c36 ± 1 c16081 ± 1239 c52 ± 5 b15435 ± 138 ab
25% GS-75% SS0.03 ± 0.02 b2.3 ± 0.3 abBDL0.995 ± 0.002 b0.25 ± 0.00 b194 ± 11 ab55 ± 1 b26641 ± 1083 b67 ± 2 b21544 ± 546 a
100% SS0.03 ± 0.03 b2.7 ± 0.3 a0.02 ± 0.02 a1.658 ± 0.334 a0.35 ± 0.05 b228 ± 4 a110 ± 1 a30766 ± 802 a116 ± 6 a25173 ± 1285 a
Incubated mixture0.32 ± 0.02 a2.00 ± 0.01 ab0.12 ± 0.02 a0.997 ± 0.003 b7.87 ± 0.34 a132 ± 9 c156 ± 8 a15374 ± 1272 c146 ± 4 a13872 ± 807 b
Letters are comparing the treatments in each row. BDL: below the detection limit.
Table 5. Total concentration of elements in the aerial part of corn plants (mg/kg) (averaged value ± standard error; n = 3 or 4).
As (mg/kg)Cd (mg/kg)Cu (mg/kg)Fe (mg/kg)P (mg/kg)
TreatmentShootShootShootShootShoot
ControlBDL0.009 ± 0.003 a6 ± 3 a78 ± 12 a1187 ± 37 b
75% GS-25% SS0.099 ± 0.060 a0.023 ± 0.015 a4 ± 1 a101 ± 37 a2983 ± 280 a
50% GS-50% SS0.003 ± 0.002 a0.015 ± 0.003 a5 ± 1 a89 ± 33 a3564 ± 747 a
25% GS-75% SS0.032 ± 0.046 a0.030 ± 0.024 a6 ± 2 a72 ± 22 a3015 ± 201 a
100% sewage sludge0.080 ± 0.113 a0.012 ± 0.006 a6 ± 1 a116 ± 67 a3270 ± 86 a
Incubated mixtureBDL0.012 ± 0.003 a3 ± 1 a69 ± 33 a1756 ± 275 b
Letters are comparing the treatments in each row. BDL: below the detection limit.
Table 6. Relative ranking colorimetric comparison of the percentages of Efficiency and Leaching analysed in the nutrients. The color code has been generated based on the interests of the crop and environment: the most favorable results are in green, followed by yellow, with red representing the least favorable state (2.4 Materials and Methods).
Cu (mg/kg)Fe (mg/kg)P (mg/kg)Total EfficiencyTotal Leaching
TreatmentEfficiencyLeachingEfficiencyLeachingEfficiencyLeaching
75% GS-25% SS21221154
50% GS-50% SS433233108
25% GS-75% SS23312276
100% sewage sludge22332479
Incubated mixture4444441212
Total efficiency (higher to lower score): green, yellow, red. Total leaching (higher to lower score): red, yellow, green.
Table 7. Relative ranking colorimetric comparison of the percentages of Efficiency and Leaching analysed in the contaminants. The color code has been generated based on the interests of the crop and environment: the most favorable results are in green, followed by yellow and orange, with red representing the least favorable state (2.4 Materials and Methods).
As (mg/kg)Cd (mg/kg)Total EfficiencyTotal Leaching
TreatmentEfficiencyLeachingEfficiencyLeaching
75% GS-25% SS142135
50% GS-50% SS342155
25% GS-75% SS223153
100% sewage sludge223153
Incubated mixture434184
Total efficiency (higher to lower score): red, yellow, green. Total leaching (higher to lower score): red, yellow, green.
Table 8. Percentage of translocation of elements to the aerial part (%) (averaged value ± standard error; n = 3 or 4).
TreatmentAs (%)Cd (%)Cu (%)Fe (%)P (%)
75% GS-25% SS0.13 ± 0.05 a0.014 ± 0.005 ab0.04 ± 0.01 b0.007 ± 0.001 a0.29 ± 0.04 a
50% GS-50% SS0.01 ± 0.0 a0.035 ± 0.004 a0.08 ± 0.01 ab0.011 ± 0.003 a0.49 ± 0.07 a
25% GS-75% SS0 ± 0 a0.030 ± 0.003 ab0.06 ± 0.01 b0.005 ± 0.001 a0.30 ± 0.04 a
100% sewage sludge0 ± 0 a0.014± 0.002 b0.05 ± 0.01 b0.007 ± 0.001 a0.27 ± 0.04 a
Incubated mixture0 ± 0 a0.062 ± 0.005 a0.11 ± 0.02 a0.018 ± 0.001 a0.51 ± 0.07 a
Letters are comparing the treatments in each row. Limits for animal feed are: 2 mg/kg As and 1 mg/kg Cd. Limits for human feed are: range from 0.13 to 0.56 μg/kg As bodyweight per day and weekly intake of 2.5 μg/kg Cd bodyweight.

