
Identification of Accessible Hepatic Gene Signatures for Interindividual Variations in Nutrigenomic Response to Dietary Supplementation of Omega-3 Fatty Acids

 , , and
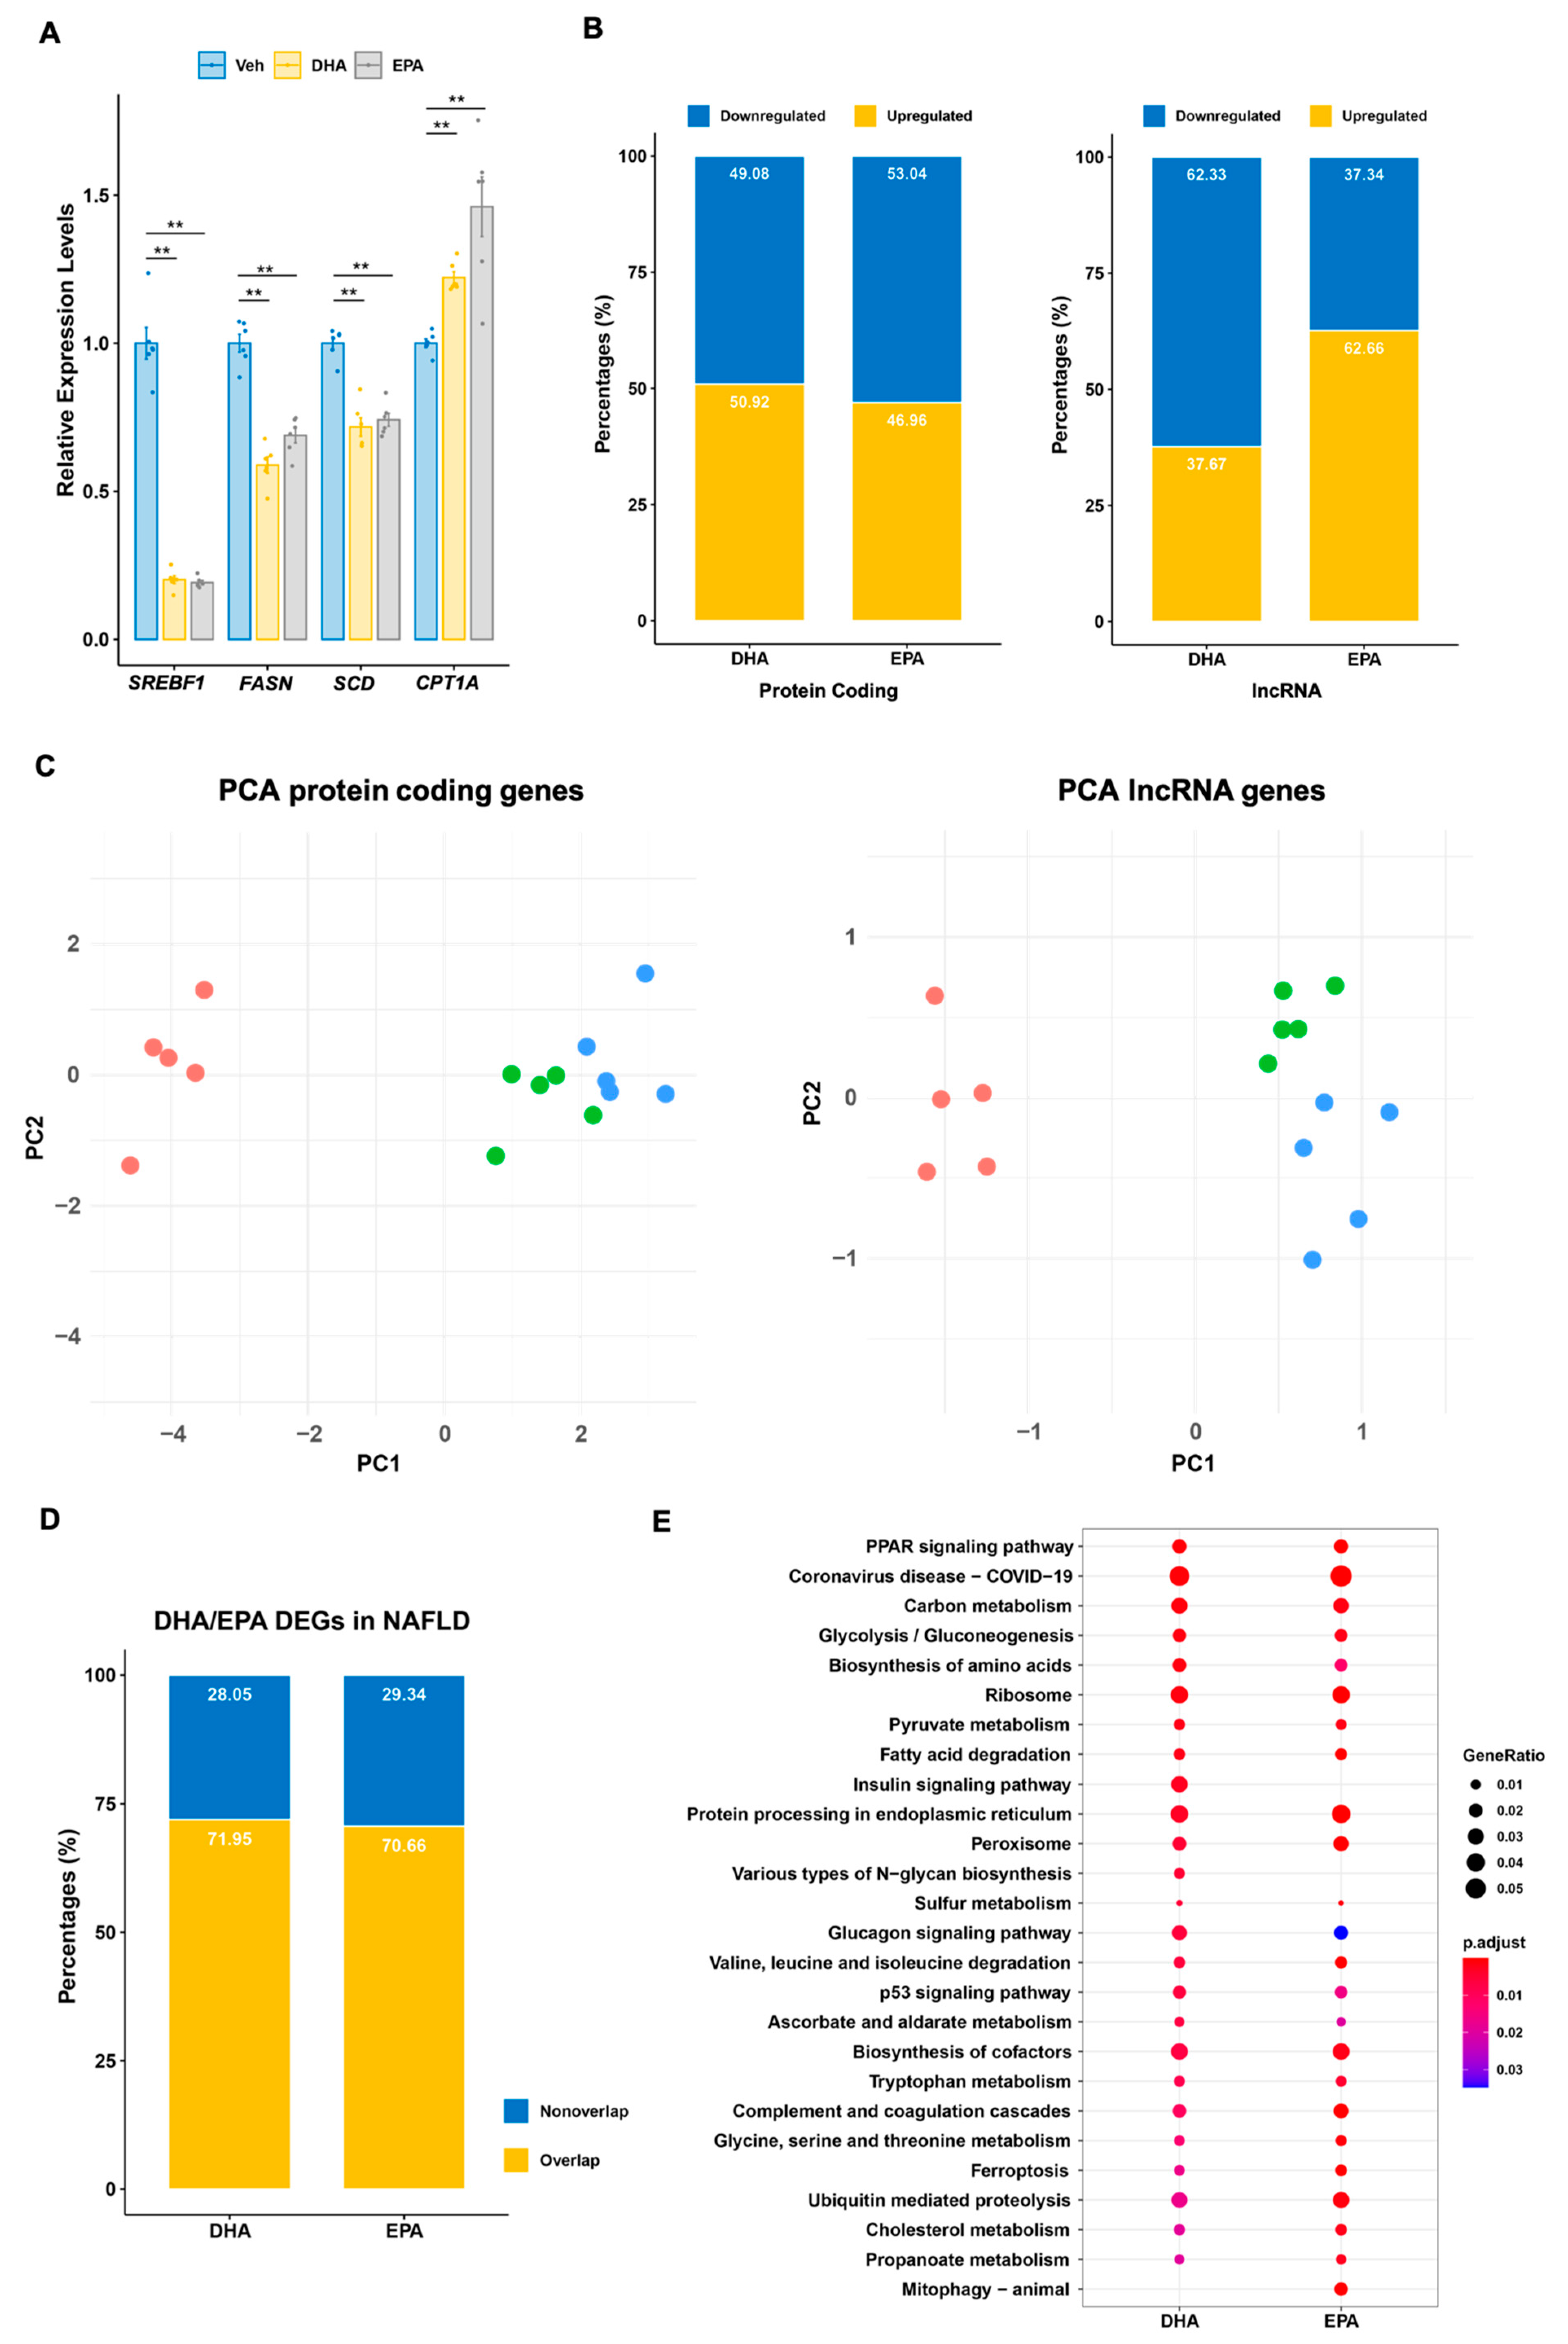
Abstract
:1. Introduction
2. Materials and Methods
2.1. RNA-seq Analysis Pipeline
2.2. NAFLD RNA Sequencing Data
2.3. Exosome-RNA Sequencing Data
2.4. Differential Expression Analysis and PCA
2.5. Gene Variability Analysis
2.5.1. Population Expression Variability
2.5.2. Hepatocyte Response Variability
2.6. Functional Gene Enrichment of Protein Coding Genes Responsive to DHA/EPA
2.7. Functional Prediction of lncRNAs Using a lncRNA–mRNA Correlation Approach
2.8. Motif Finding and Enrichment Analysis
2.9. Primary Culture of Human Hepatocytes
2.10. RNA Extraction, RNA-seq and Quantitative Real-Time PCR Analysis
| Ensembl Gene ID | Gene Symbol | Sense Primer Sequence 5′-3′ | Antisense Primer Sequence 5′-3′ |
| ENSG00000072310 | SREBF1 | GGAGCCATGGATTGCACTTT | GGGTCAAATAGGCCAGGGAA |
| ENSG00000099194 | SCD | CAAGTGCCTCACCTCGAAAG | TGTGTTCAGCAGGGTTTGTG |
| ENSG00000110090 | CPT1A | GACAATACCTCGGAGCCTCA | CCACAGCATCAAGAGACTGC |
| ENSG00000283568 | 18s | AGTCCCTGCCCTTTGTACACA | CGATCCGAGGGCCTCACTA |
| ENSG00000146592 | CREB5 | AGGAAGAGGAGAGCAGCAAG | AAGGTGCCTGAGTGATGACA |
| ENSG00000131016 | AKAP12 | GGTGGCGTACCTGACATAGA | GGCTGAAGCACATCTTCTGG |
| ENSG00000198431 | TXNRD1 | GACCACGTTACTTGGGCATC | GCACTCCAAAGCGACATAGG |
| ENSG00000106366 | SERPINE1 | CCGCCTCTTCCACAAATCAG | GTAGGGCAGTTCCAGGATGT |
| ENSG00000108984 | MAP2K6 | TTCACAGAGACGTCAAGCCT | TGGTTTGCAACCTGCATCAA |
| ENSG00000137801 | THBS1 | GCTCTACCAGTGTCCTCCTC | TGGCTTGCAAGTCCTTTGTC |
| ENSG00000054967 | RELT | TCTGGGTACTCATGGCTGTG | CATGAGGCAGAAGACAGGGA |
| ENSG00000147852 | VLDLR | TGCTCCGACCAATCTGATGA | AGTTGACCTCATCACTGCCA |
| ENSG00000114107 | CEP70 | GGCTGAGGACACAGAGAAGA | TGATGCTACACAGCACCTGA |
| ENSG00000088035 | ALG6 | TGTGGCTTCCTTCGTTCTCT | AATCCACGATCAACCGGGAA |
| ENSG00000159082 | SYNJ1 | CACCCAAGTTAGCTGGCATC | ACAGCCCAGAGCTTCTGATT |
| ENSG00000119408 | NEK6 | GATAGGCCGAGGACAGTTCA | AGAGCCACTGTCTTCCTGTC |
| ENSG00000131724 | IL13RA1 | AGTCTGCTGTGACTGAGCTT | GTGTCGGGACTGGTATTCCT |
| ENSG00000066583 | ISOC1 | AAATTCGTGGTGCAGCTGTT | TTTCCCAGGGTAGTGAGCTG |
| ENSG00000237767 | LINC01370 | TGAGAGGCCATGTGGGTATG | ATCACAAGTCTGGCACCTCA |
| ENSG00000248810 | LINC02432 | GGGACAATGCAGGAACATGG | ATCTGGTGTCTGGGTCTTCC |
| ENSG00000259953 | AL138756.1 | TGGAGACACCAAACTCAGACA | CCAAGGGCACAAATCAGCTT |
| ENSG00000172965 | MIR4435-2HG | CCTTCCATGCAAAGTTGGCT | ACACGCAGGAGTATCAGGAG |
2.11. Exosomal RNA-Sequencing
3. Results
3.1. Nutrigenomic Response to Omega-3 Fatty Acid in Human Hepatocytes
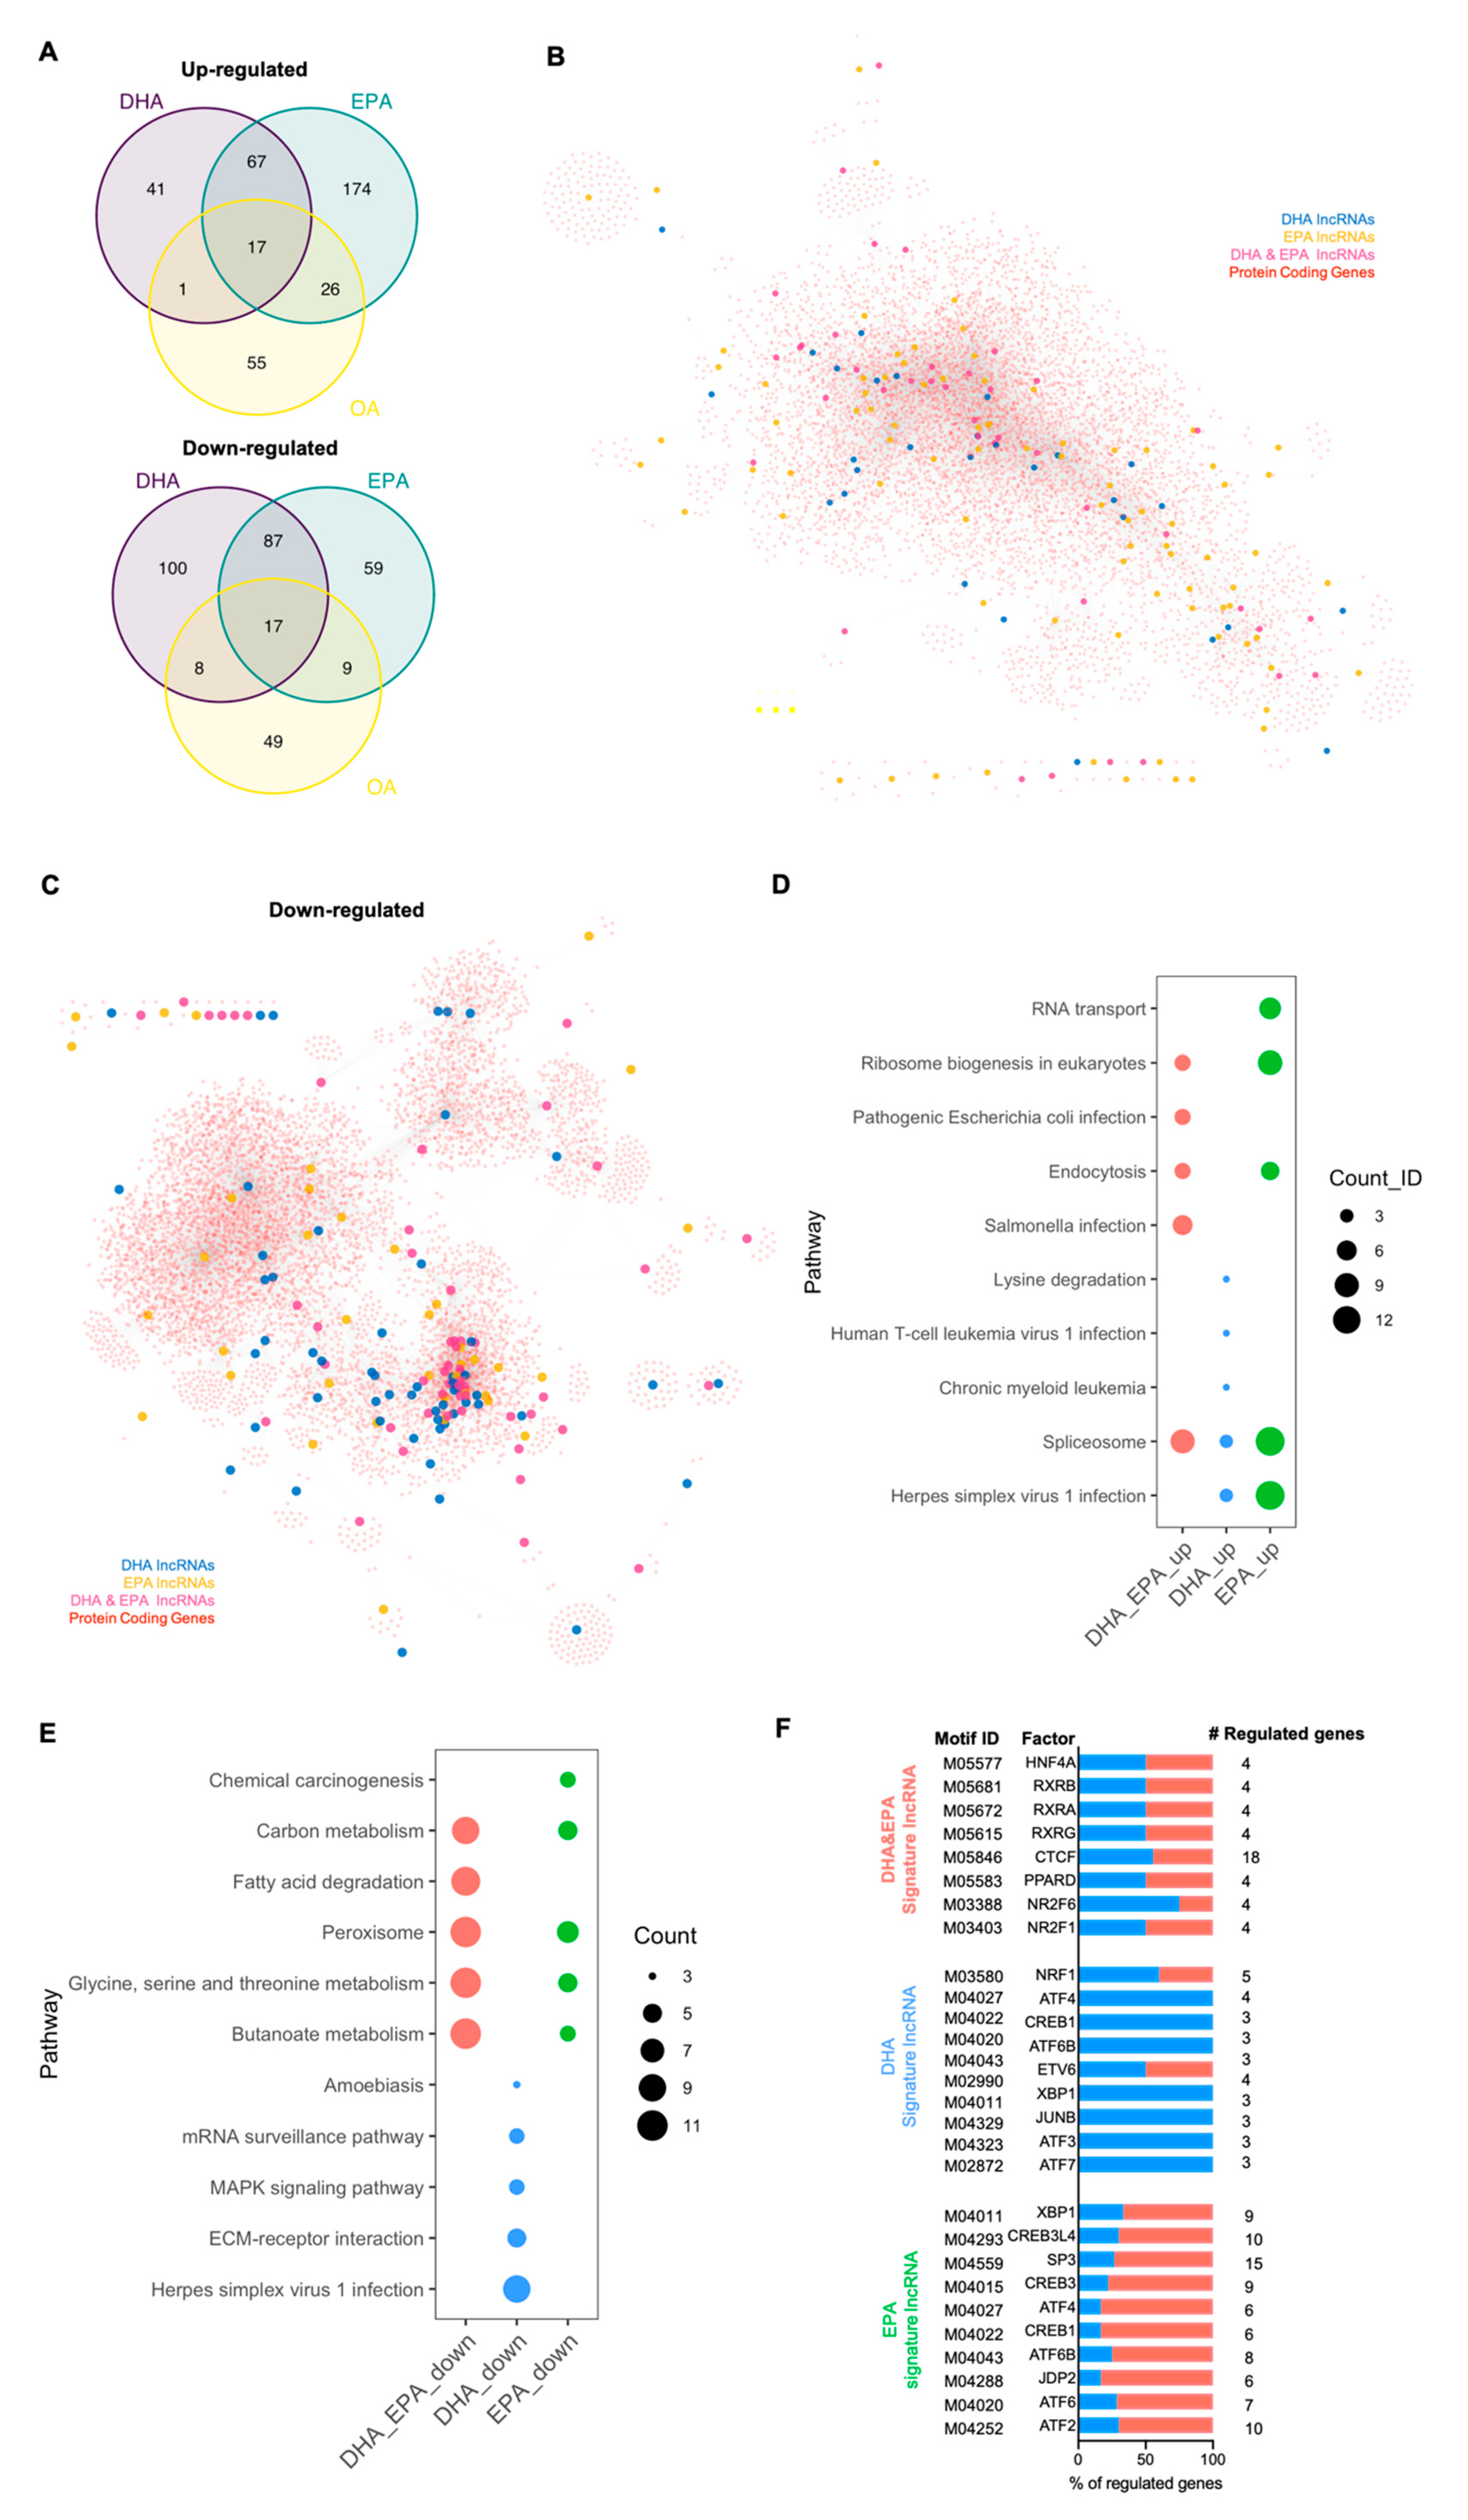
3.2. Protein Coding Signature Genes Responsive to DHA/EPA Supplementation
3.3. Signature lncRNA Genes Responsive to DHA/EPA Supplementation
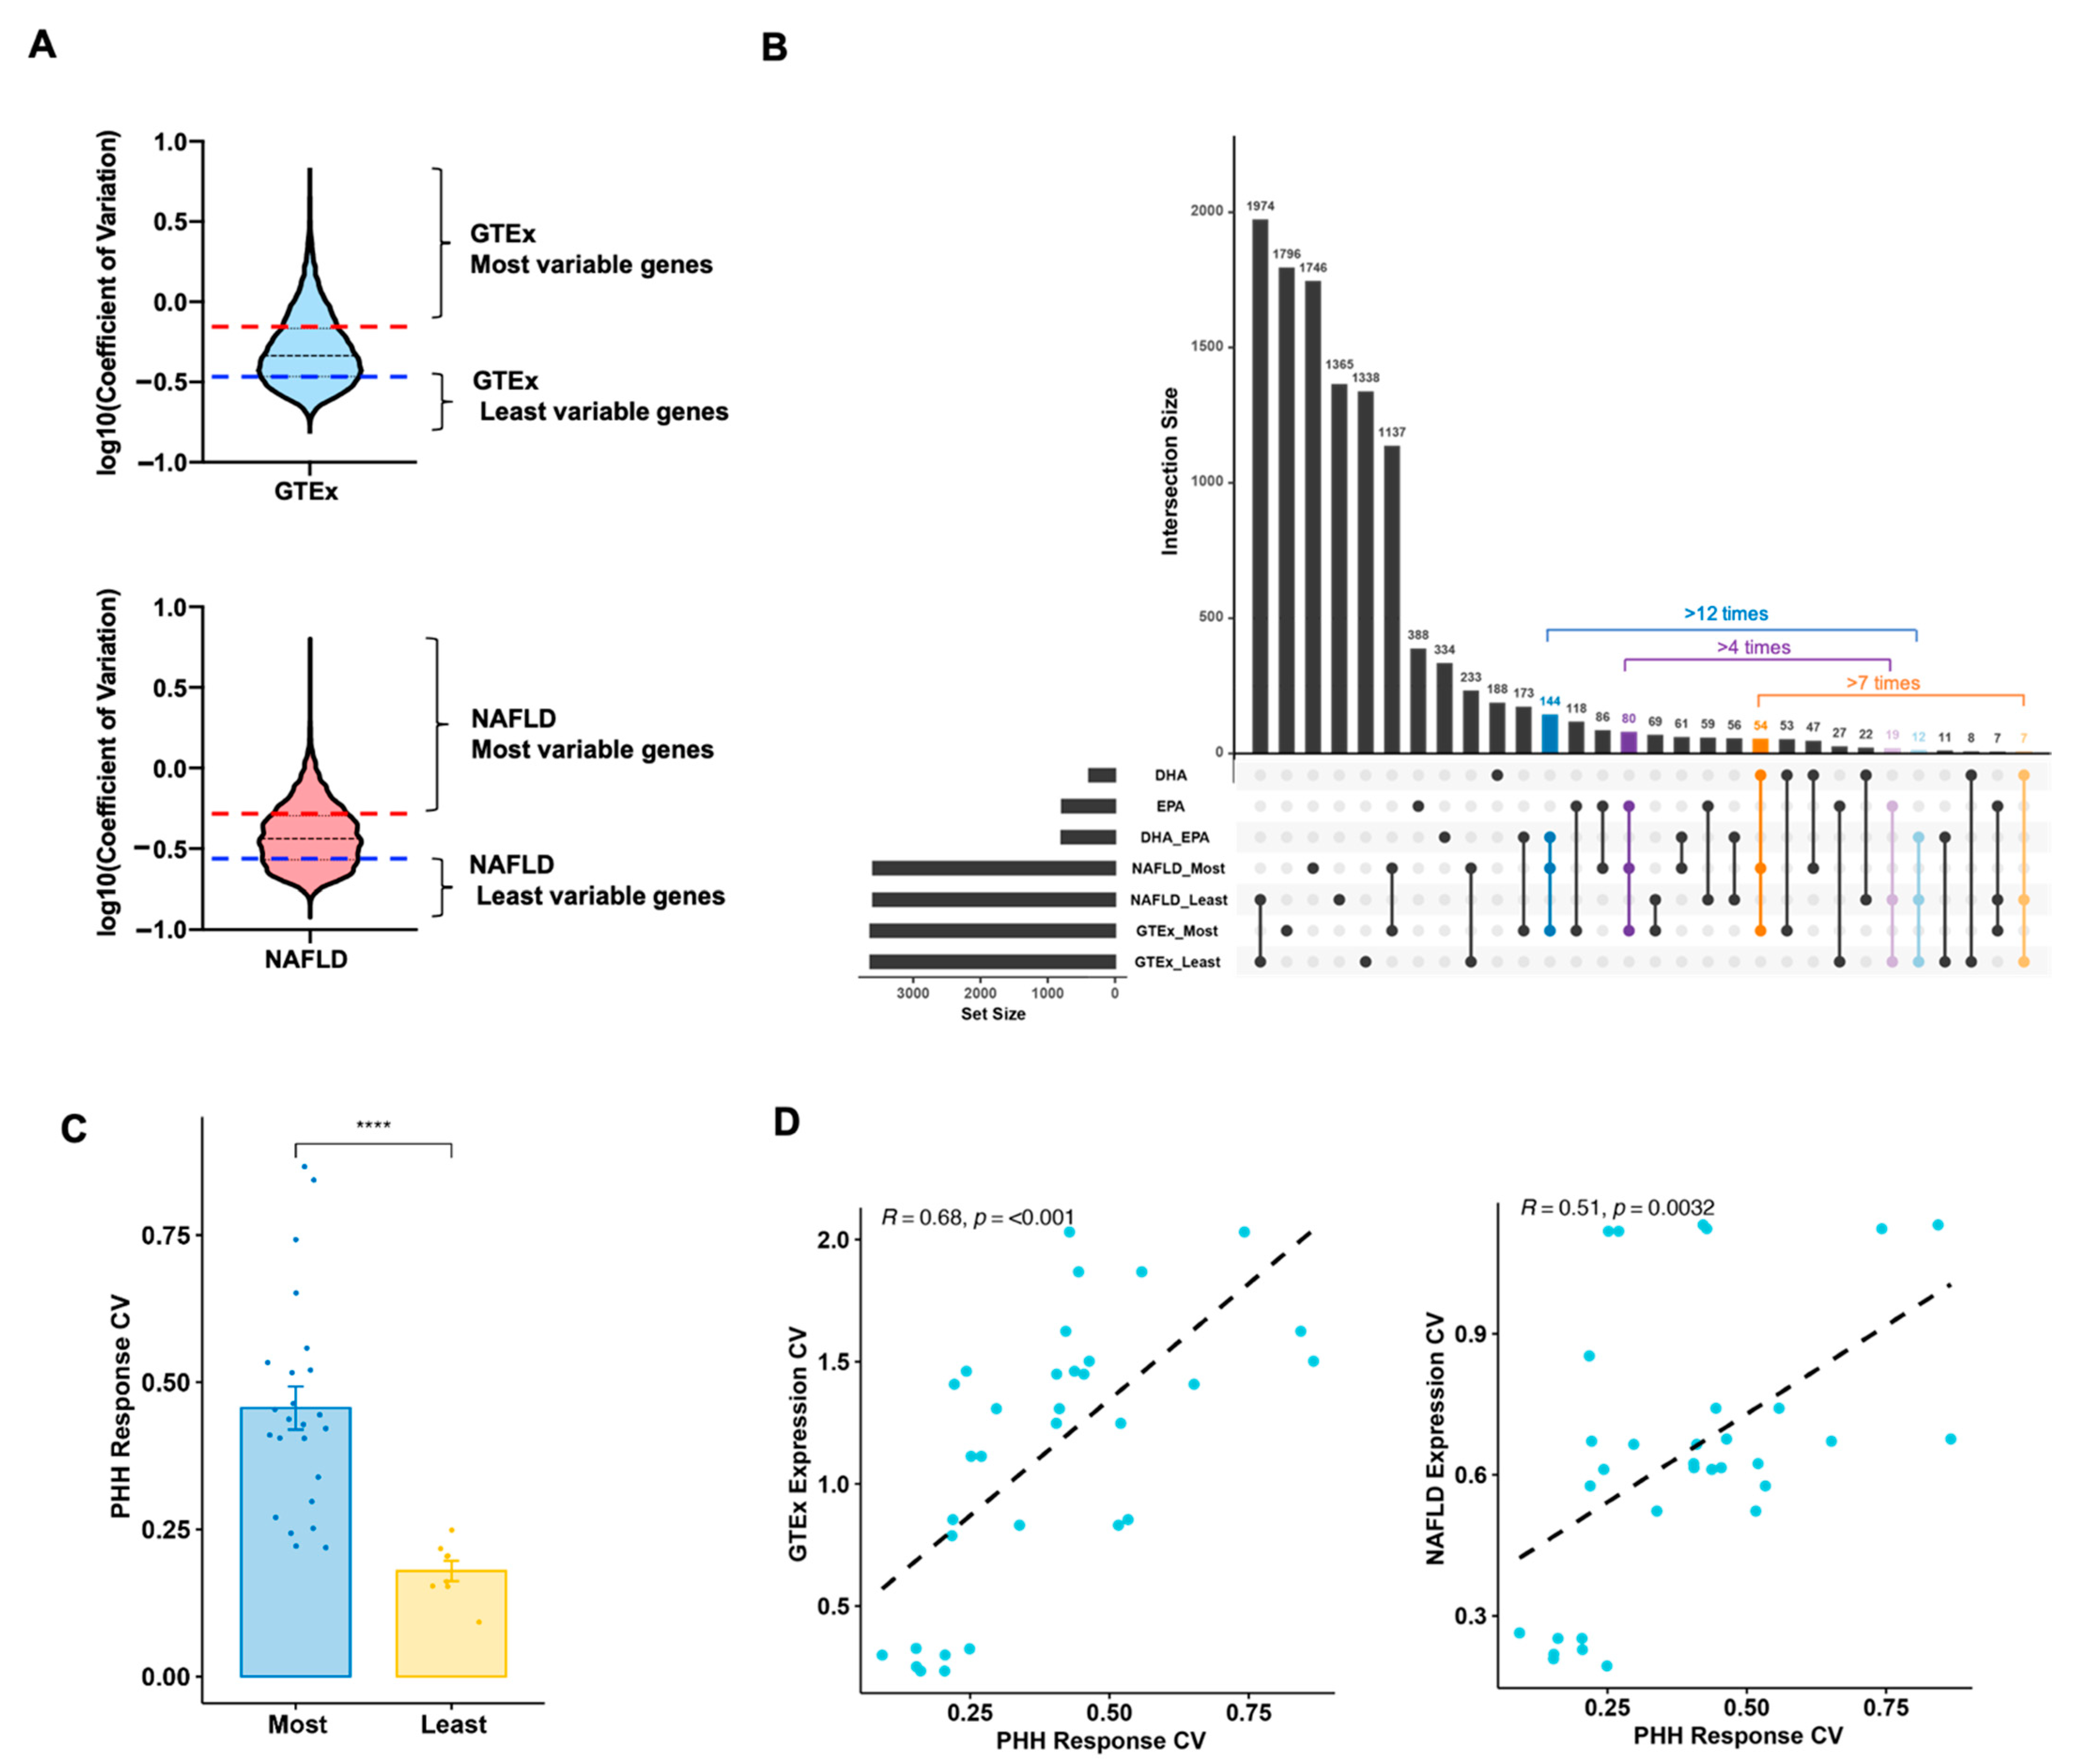
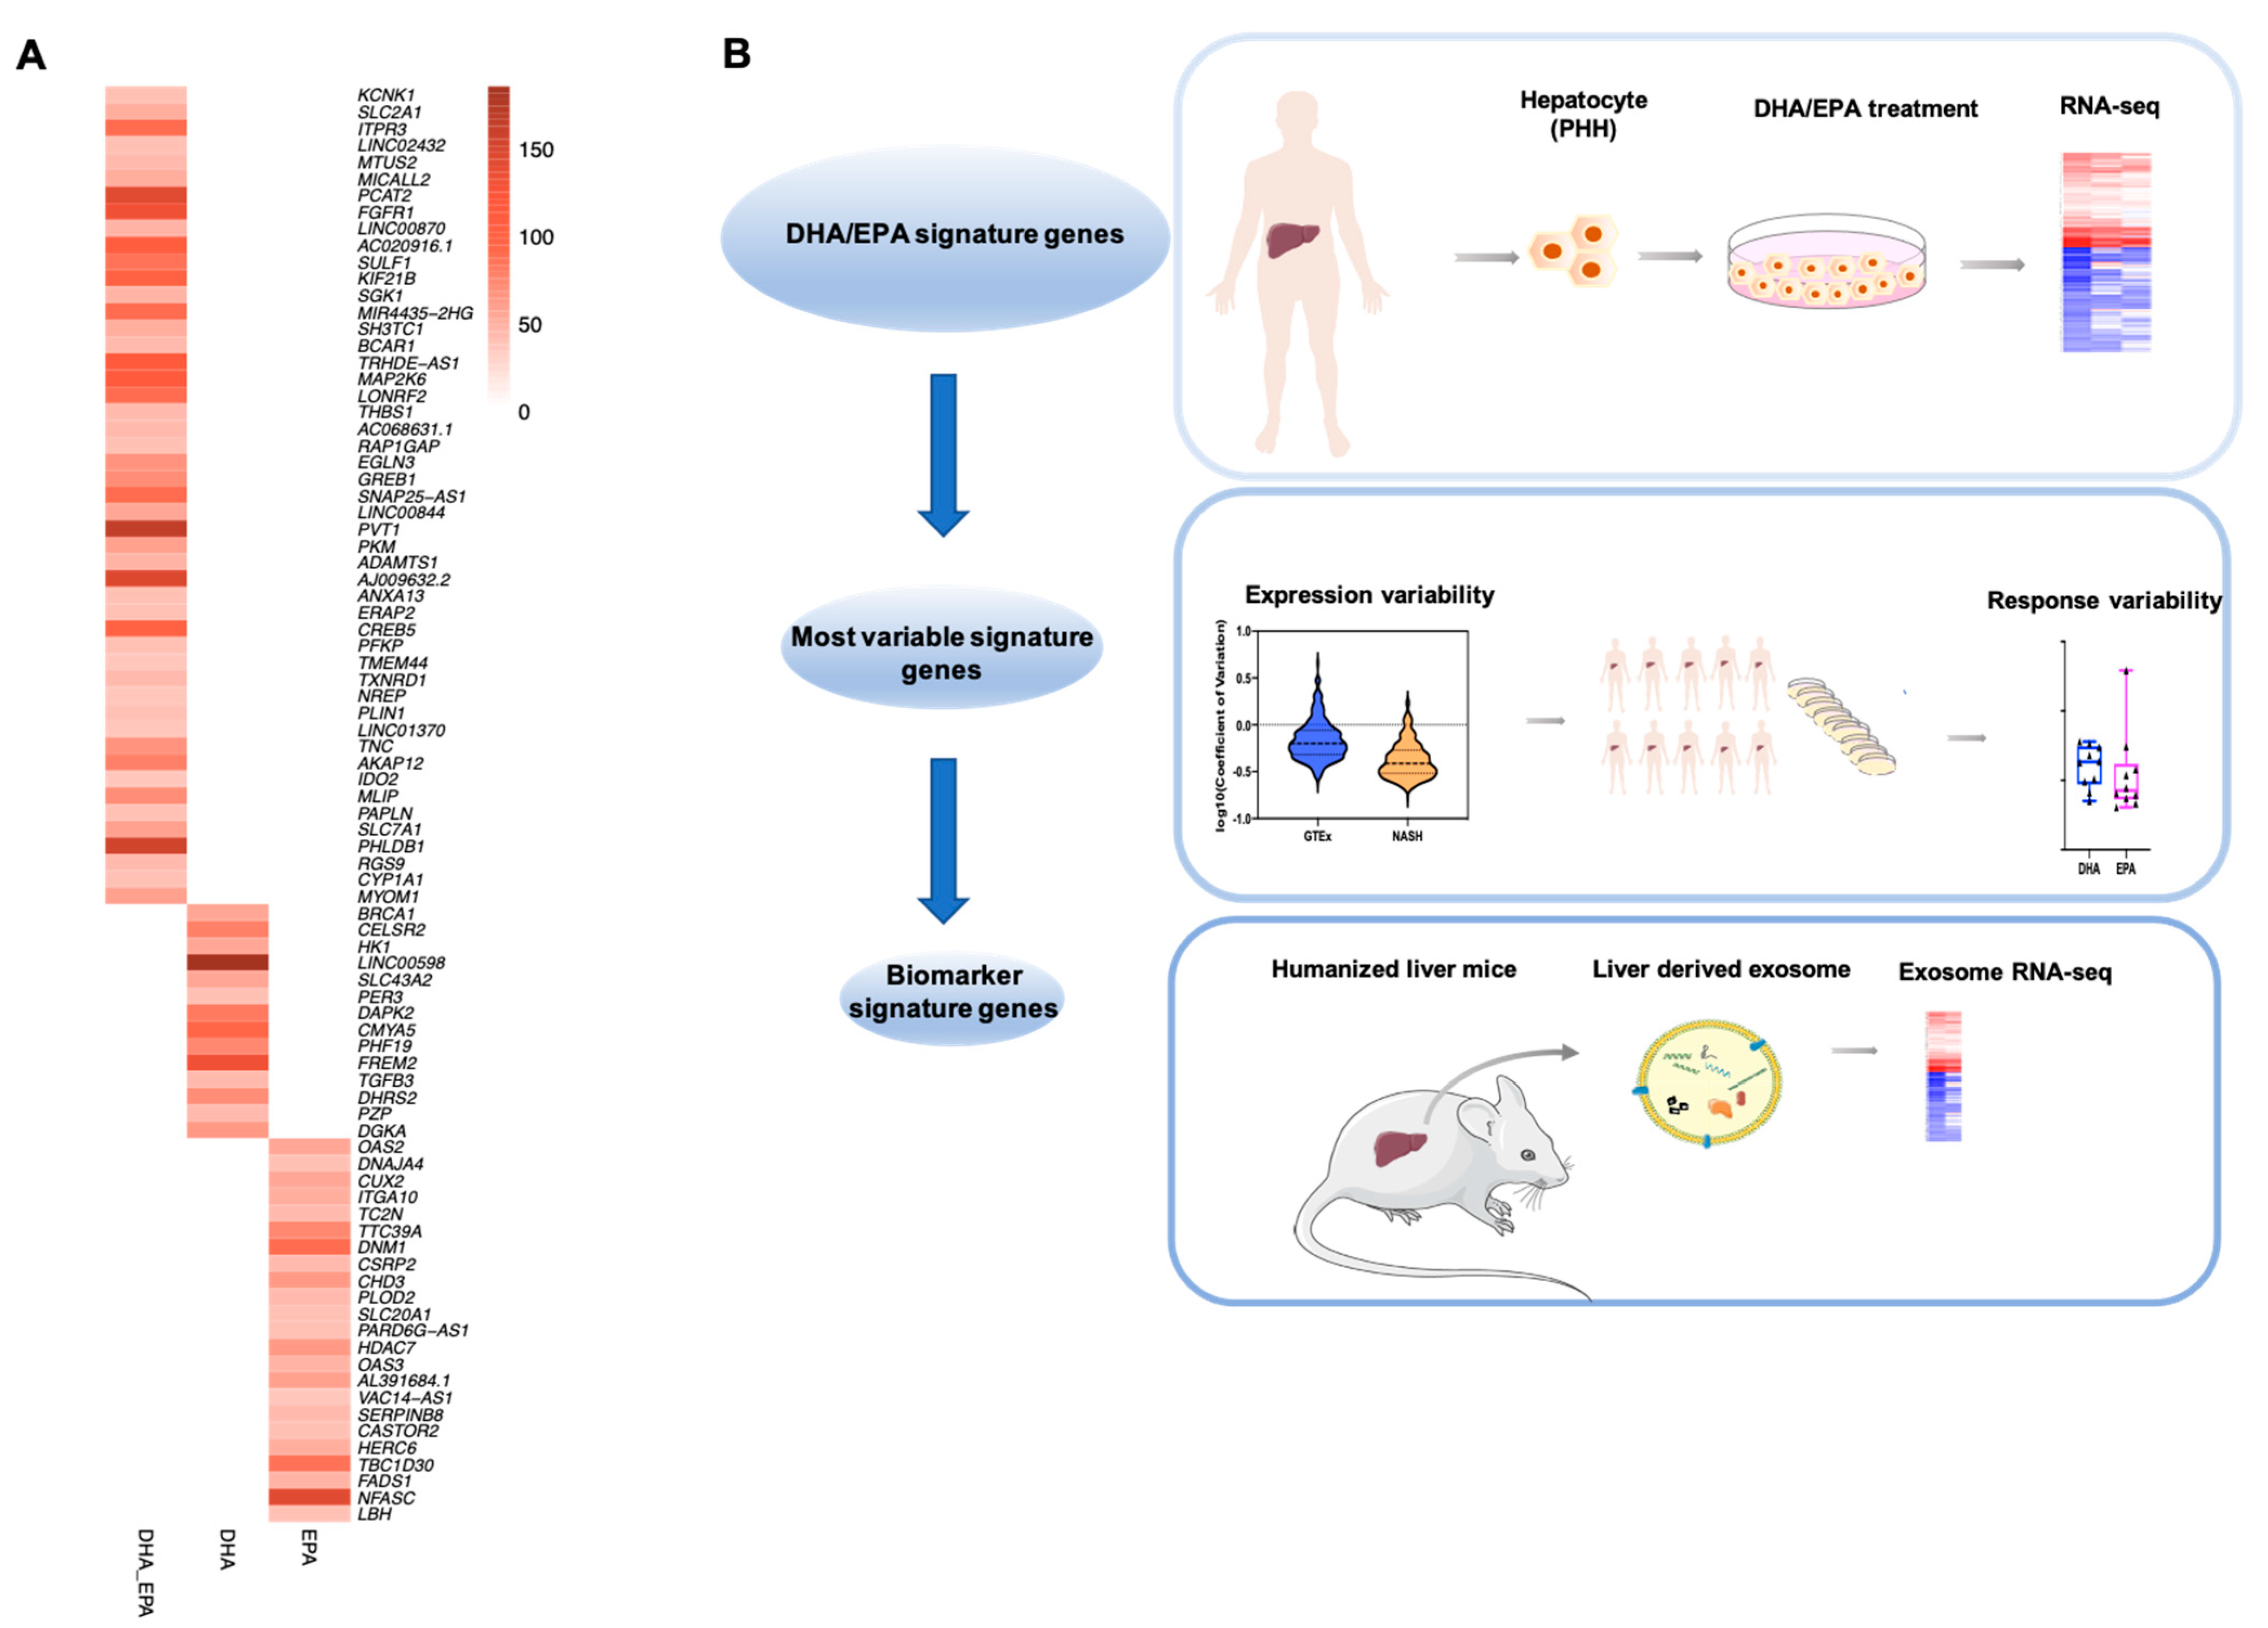
3.4. Biomarker Genes Contributing to Individual Variation in Nutritional Response to DHA/EPA
3.5. Detection of Transcripts of DHA/EPA Biomarker Genes in Liver-Derived Exosomes in Circulation
4. Discussion
Supplementary Materials
Author Contributions
Funding
Institutional Review Board Statement
Data Availability Statement
Acknowledgments
Conflicts of Interest
References
- Rautiainen, S.; Manson, J.E.; Lichtenstein, A.H.; Sesso, H.D. Dietary supplements and disease prevention-a global overview. Nat. Rev. Endocrinol. 2016, 12, 407–420. [Google Scholar] [CrossRef]
- Bailey, R.L.; Gahche, J.J.; Miller, P.E.; Thomas, P.R.; Dwyer, J.T. Why US adults use dietary supplements. JAMA Intern. Med. 2013, 173, 355–361. [Google Scholar] [CrossRef] [PubMed] [Green Version]
- Muller, M.; Kersten, S. Nutrigenomics: Goals and strategies. Nat. Rev. Genet. 2003, 4, 315–322. [Google Scholar] [CrossRef] [PubMed]
- Scorletti, E.; Byrne, C.D. Omega-3 fatty acids, hepatic lipid metabolism, and nonalcoholic fatty liver disease. Annu. Rev. Nutr. 2013, 33, 231–248. [Google Scholar] [CrossRef]
- Caslake, M.J.; Miles, E.A.; Kofler, B.M.; Lietz, G.; Curtis, P.; Armah, C.K.; Kimber, A.C.; Grew, J.P.; Farrell, L.; Stannard, J.; et al. Effect of sex and genotype on cardiovascular biomarker response to fish oils: The FINGEN Study. Am. J. Clin. Nutr. 2008, 88, 618–629. [Google Scholar] [CrossRef] [Green Version]
- Aung, T.; Halsey, J.; Kromhout, D.; Gerstein, H.C.; Marchioli, R.; Tavazzi, L.; Geleijnse, J.M.; Rauch, B.; Ness, A.; Galan, P.; et al. Associations of Omega-3 Fatty Acid Supplement Use With Cardiovascular Disease Risks: Meta-analysis of 10 Trials Involving 77917 Individuals. JAMA Cardiol. 2018, 3, 225–234. [Google Scholar] [CrossRef] [PubMed] [Green Version]
- Iyer, M.K.; Niknafs, Y.S.; Malik, R.; Singhal, U.; Sahu, A.; Hosono, Y.; Barrette, T.R.; Prensner, J.R.; Evans, J.R.; Zhao, S.; et al. The landscape of long noncoding RNAs in the human transcriptome. Nat. Genet. 2015, 47, 199–208. [Google Scholar] [CrossRef] [PubMed]
- Ruan, X.; Li, P.; Chen, Y.; Shi, Y.; Pirooznia, M.; Seifuddin, F.; Suemizu, H.; Ohnishi, Y.; Yoneda, N.; Nishiwaki, M.; et al. In vivo functional analysis of non-conserved human lncRNAs associated with cardiometabolic traits. Nat. Commun. 2020, 11, 45. [Google Scholar] [CrossRef] [PubMed] [Green Version]
- Ruan, X.; Li, P.; Ma, Y.; Jiang, C.F.; Chen, Y.; Shi, Y.; Gupta, N.; Seifuddin, F.; Pirooznia, M.; Ohnishi, Y.; et al. Identification of human long noncoding RNAs associated with nonalcoholic fatty liver disease and metabolic homeostasis. J. Clin. Investig. 2021, 131. [Google Scholar] [CrossRef]
- Ransohoff, J.D.; Wei, Y.; Khavari, P.A. The functions and unique features of long intergenic non-coding RNA. Nat. Rev. Mol. Cell Biol. 2018, 19, 143–157. [Google Scholar] [CrossRef] [PubMed]
- Masyuk, A.I.; Masyuk, T.V.; Larusso, N.F. Exosomes in the pathogenesis, diagnostics and therapeutics of liver diseases. J. Hepatol. 2013, 59, 621–625. [Google Scholar] [CrossRef] [PubMed] [Green Version]
- Weirauch, M.T.; Yang, A.; Albu, M.; Cote, A.G.; Montenegro-Montero, A.; Drewe, P.; Najafabadi, H.S.; Lambert, S.A.; Mann, I.; Cook, K.; et al. Determination and inference of eukaryotic transcription factor sequence specificity. Cell 2014, 158, 1431–1443. [Google Scholar] [CrossRef] [PubMed] [Green Version]
- McLeay, R.C.; Bailey, T.L. Motif Enrichment Analysis: A unified framework and an evaluation on ChIP data. BMC Bioinformatics 2010, 11, 165. [Google Scholar] [CrossRef] [PubMed] [Green Version]
- de Toro-Martin, J.; Arsenault, B.J.; Despres, J.P.; Vohl, M.C. Precision Nutrition: A Review of Personalized Nutritional Approaches for the Prevention and Management of Metabolic Syndrome. Nutrients 2017, 9, 913. [Google Scholar] [CrossRef] [PubMed] [Green Version]
- Astley, S.B. An introduction to nutrigenomics developments and trends. Genes Nutr. 2007, 2, 11–13. [Google Scholar] [CrossRef] [PubMed] [Green Version]
- Harris, W.S. n-3 fatty acids and serum lipoproteins: Human studies. Am. J. Clin. Nutr. 1997, 65, 1645S–1654S. [Google Scholar] [CrossRef]
- Vedin, I.; Cederholm, T.; Freund-Levi, Y.; Basun, H.; Garlind, A.; Irving, G.F.; Eriksdotter-Jonhagen, M.; Wahlund, L.O.; Dahlman, I.; Palmblad, J. Effects of DHA-rich n-3 fatty acid supplementation on gene expression in blood mononuclear leukocytes: The OmegAD study. PLoS ONE 2012, 7, e35425. [Google Scholar] [CrossRef] [Green Version]
- Polus, A.; Zapala, B.; Razny, U.; Gielicz, A.; Kiec-Wilk, B.; Malczewska-Malec, M.; Sanak, M.; Childs, C.E.; Calder, P.C.; Dembinska-Kiec, A. Omega-3 fatty acid supplementation influences the whole blood transcriptome in women with obesity, associated with pro-resolving lipid mediator production. Biochim. Biophys. Acta 2016, 1861, 1746–1755. [Google Scholar] [CrossRef] [Green Version]
- Green, C.J.; Pramfalk, C.; Charlton, C.A.; Gunn, P.J.; Cornfield, T.; Pavlides, M.; Karpe, F.; Hodson, L. Hepatic de novo lipogenesis is suppressed and fat oxidation is increased by omega-3 fatty acids at the expense of glucose metabolism. BMJ Open Diabetes Res. Care 2020, 8. [Google Scholar] [CrossRef] [Green Version]
- Madec, S.; Cerec, V.; Plee-Gautier, E.; Antoun, J.; Glaise, D.; Salaun, J.P.; Guguen-Guillouzo, C.; Corlu, A. CYP4F3B expression is associated with differentiation of HepaRG human hepatocytes and unaffected by fatty acid overload. Drug Metab. Dispos 2011, 39, 1987–1996. [Google Scholar] [CrossRef] [Green Version]
- Calder, P.C. Very long-chain n-3 fatty acids and human health: Fact, fiction and the future. Proc. Nutr. Soc. 2018, 77, 52–72. [Google Scholar] [CrossRef] [PubMed] [Green Version]
- Lauritzen, L.; Brambilla, P.; Mazzocchi, A.; Harslof, L.B.; Ciappolino, V.; Agostoni, C. DHA Effects in Brain Development and Function. Nutrients 2016, 8, 6. [Google Scholar] [CrossRef] [Green Version]
- Klingel, S.L.; Metherel, A.H.; Irfan, M.; Rajna, A.; Chabowski, A.; Bazinet, R.P.; Mutch, D.M. EPA and DHA have divergent effects on serum triglycerides and lipogenesis, but similar effects on lipoprotein lipase activity: A randomized controlled trial. Am. J. Clin. Nutr. 2019, 110, 1502–1509. [Google Scholar] [CrossRef] [PubMed]
- Allam-Ndoul, B.; Guenard, F.; Barbier, O.; Vohl, M.C. A Study of the Differential Effects of Eicosapentaenoic Acid (EPA) and Docosahexaenoic Acid (DHA) on Gene Expression Profiles of Stimulated Thp-1 Macrophages. Nutrients 2017, 9, 424. [Google Scholar] [CrossRef] [PubMed]
- Eslam, M.; Valenti, L.; Romeo, S. Genetics and epigenetics of NAFLD and NASH: Clinical impact. J. Hepatol. 2018, 68, 268–279. [Google Scholar] [CrossRef]
- Friedman, S.L.; Neuschwander-Tetri, B.A.; Rinella, M.; Sanyal, A.J. Mechanisms of NAFLD development and therapeutic strategies. Nat. Med. 2018, 24, 908–922. [Google Scholar] [CrossRef] [PubMed]
- Li, P.; Ruan, X.; Yang, L.; Kiesewetter, K.; Zhao, Y.; Luo, H.; Chen, Y.; Gucek, M.; Zhu, J.; Cao, H. A liver-enriched long non-coding RNA, lncLSTR, regulates systemic lipid metabolism in mice. Cell Metab. 2015, 21, 455–467. [Google Scholar] [CrossRef] [PubMed] [Green Version]
- Yang, L.; Li, P.; Yang, W.; Ruan, X.; Kiesewetter, K.; Zhu, J.; Cao, H. Integrative Transcriptome Analyses of Metabolic Responses in Mice Define Pivotal LncRNA Metabolic Regulators. Cell Metab. 2016, 24, 627–639. [Google Scholar] [CrossRef] [PubMed] [Green Version]
- Radaeva, S.; Jaruga, B.; Hong, F.; Kim, W.H.; Fan, S.; Cai, H.; Strom, S.; Liu, Y.; El-Assal, O.; Gao, B. Interferon-alpha activates multiple STAT signals and down-regulates c-Met in primary human hepatocytes. Gastroenterology 2002, 122, 1020–1034. [Google Scholar] [CrossRef]
- Thum, T.; Borlak, J. Detection of early signals of hepatotoxicity by gene expression profiling studies with cultures of metabolically competent human hepatocytes. Arch Toxicol. 2008, 82, 89–101. [Google Scholar] [CrossRef]
- Aronson, J.K.; Ferner, R.E. Biomarkers-A General Review. Curr. Protoc. Pharmacol. 2017, 76, 9–23. [Google Scholar] [CrossRef] [PubMed]
- Tebani, A.; Bekri, S. Paving the Way to Precision Nutrition Through Metabolomics. Front. Nutr. 2019, 6, 41. [Google Scholar] [CrossRef] [PubMed] [Green Version]
- Kita, S.; Maeda, N.; Shimomura, I. Interorgan communication by exosomes, adipose tissue, and adiponectin in metabolic syndrome. J. Clin. Investig. 2019, 129, 4041–4049. [Google Scholar] [CrossRef] [PubMed] [Green Version]
- Rome, S.; Forterre, A.; Mizgier, M.L.; Bouzakri, K. Skeletal Muscle-Released Extracellular Vesicles: State of the Art. Front. Physiol. 2019, 10, 929. [Google Scholar] [CrossRef] [PubMed]
- Kim, C.K.; He, P.; Bialkowska, A.B.; Yang, V.W. SP and KLF Transcription Factors in Digestive Physiology and Diseases. Gastroenterology 2017, 152, 1845–1875. [Google Scholar] [CrossRef] [PubMed] [Green Version]
- Karpen, S.J. Nuclear receptor regulation of hepatic function. J. Hepatol. 2002, 36, 832–850. [Google Scholar] [CrossRef]


Publisher’s Note: MDPI stays neutral with regard to jurisdictional claims in published maps and institutional affiliations. |
© 2021 by the authors. Licensee MDPI, Basel, Switzerland. This article is an open access article distributed under the terms and conditions of the Creative Commons Attribution (CC BY) license (http://creativecommons.org/licenses/by/4.0/).
Share and Cite
Shi, Y.; Li, P.; Jiang, C.-f.; Chen, Y.; Ma, Y.; Gupta, N.; Ruan, X.; Cao, H. Identification of Accessible Hepatic Gene Signatures for Interindividual Variations in Nutrigenomic Response to Dietary Supplementation of Omega-3 Fatty Acids. Cells 2021, 10, 467. https://0-doi-org.brum.beds.ac.uk/10.3390/cells10020467
Shi Y, Li P, Jiang C-f, Chen Y, Ma Y, Gupta N, Ruan X, Cao H. Identification of Accessible Hepatic Gene Signatures for Interindividual Variations in Nutrigenomic Response to Dietary Supplementation of Omega-3 Fatty Acids. Cells. 2021; 10(2):467. https://0-doi-org.brum.beds.ac.uk/10.3390/cells10020467
Chicago/Turabian StyleShi, Yu, Ping Li, Cheng-fei Jiang, Yi Chen, Yonghe Ma, Nikhil Gupta, Xiangbo Ruan, and Haiming Cao. 2021. "Identification of Accessible Hepatic Gene Signatures for Interindividual Variations in Nutrigenomic Response to Dietary Supplementation of Omega-3 Fatty Acids" Cells 10, no. 2: 467. https://0-doi-org.brum.beds.ac.uk/10.3390/cells10020467