
A New Epigenetic Model to Stratify Glioma Patients According to Their Immunosuppressive State

 ,
,  , , , , ,
  , , , , and
Abstract
:1. Introduction
2. Materials and Methods
2.1. Data
2.2. Feature Selection
- The genes linked to the putative response of immune suppression in the study by Thorston et al. [18];
- The genes with the angiomatrix signatures [36];
- The genes associated with the putative response for ICIs in GBMs [37];
- The genes reported as with prognostic value for gliomas by Mesrati et al. [38];
- The genes related to the extracellular matrix (ECM) recently linked to the glioma by Zhao et al. [39].
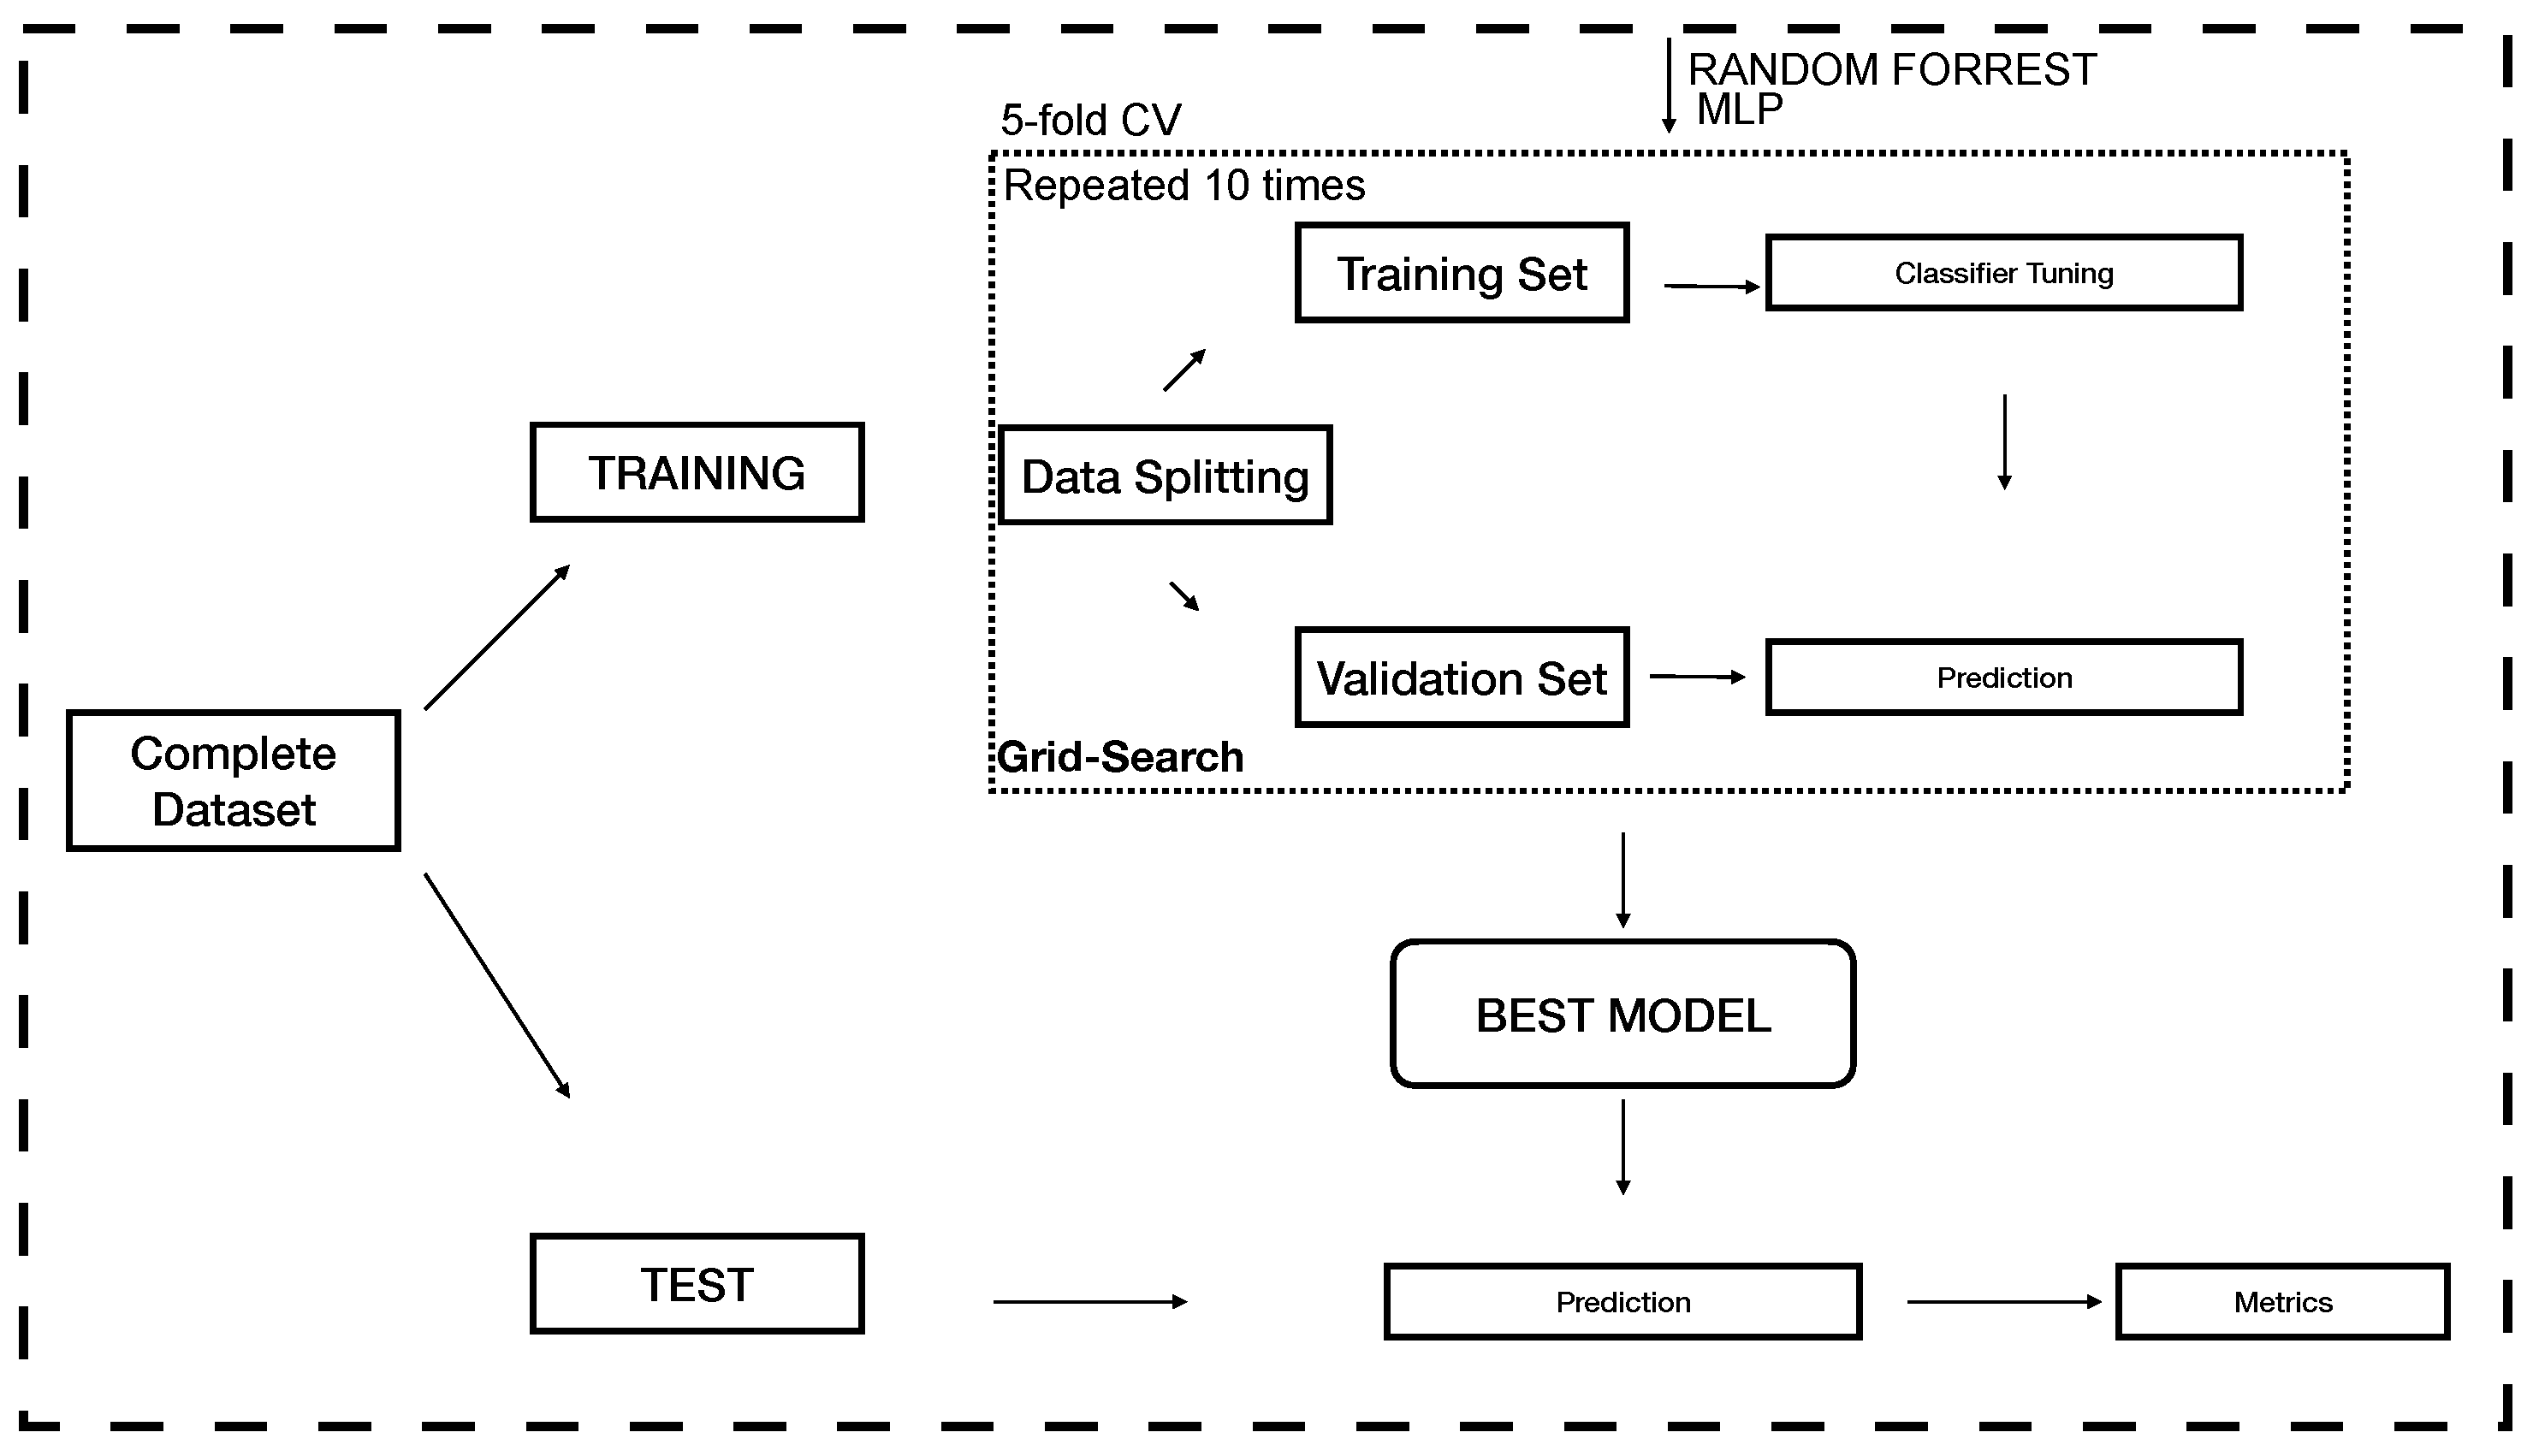
2.3. Modelling
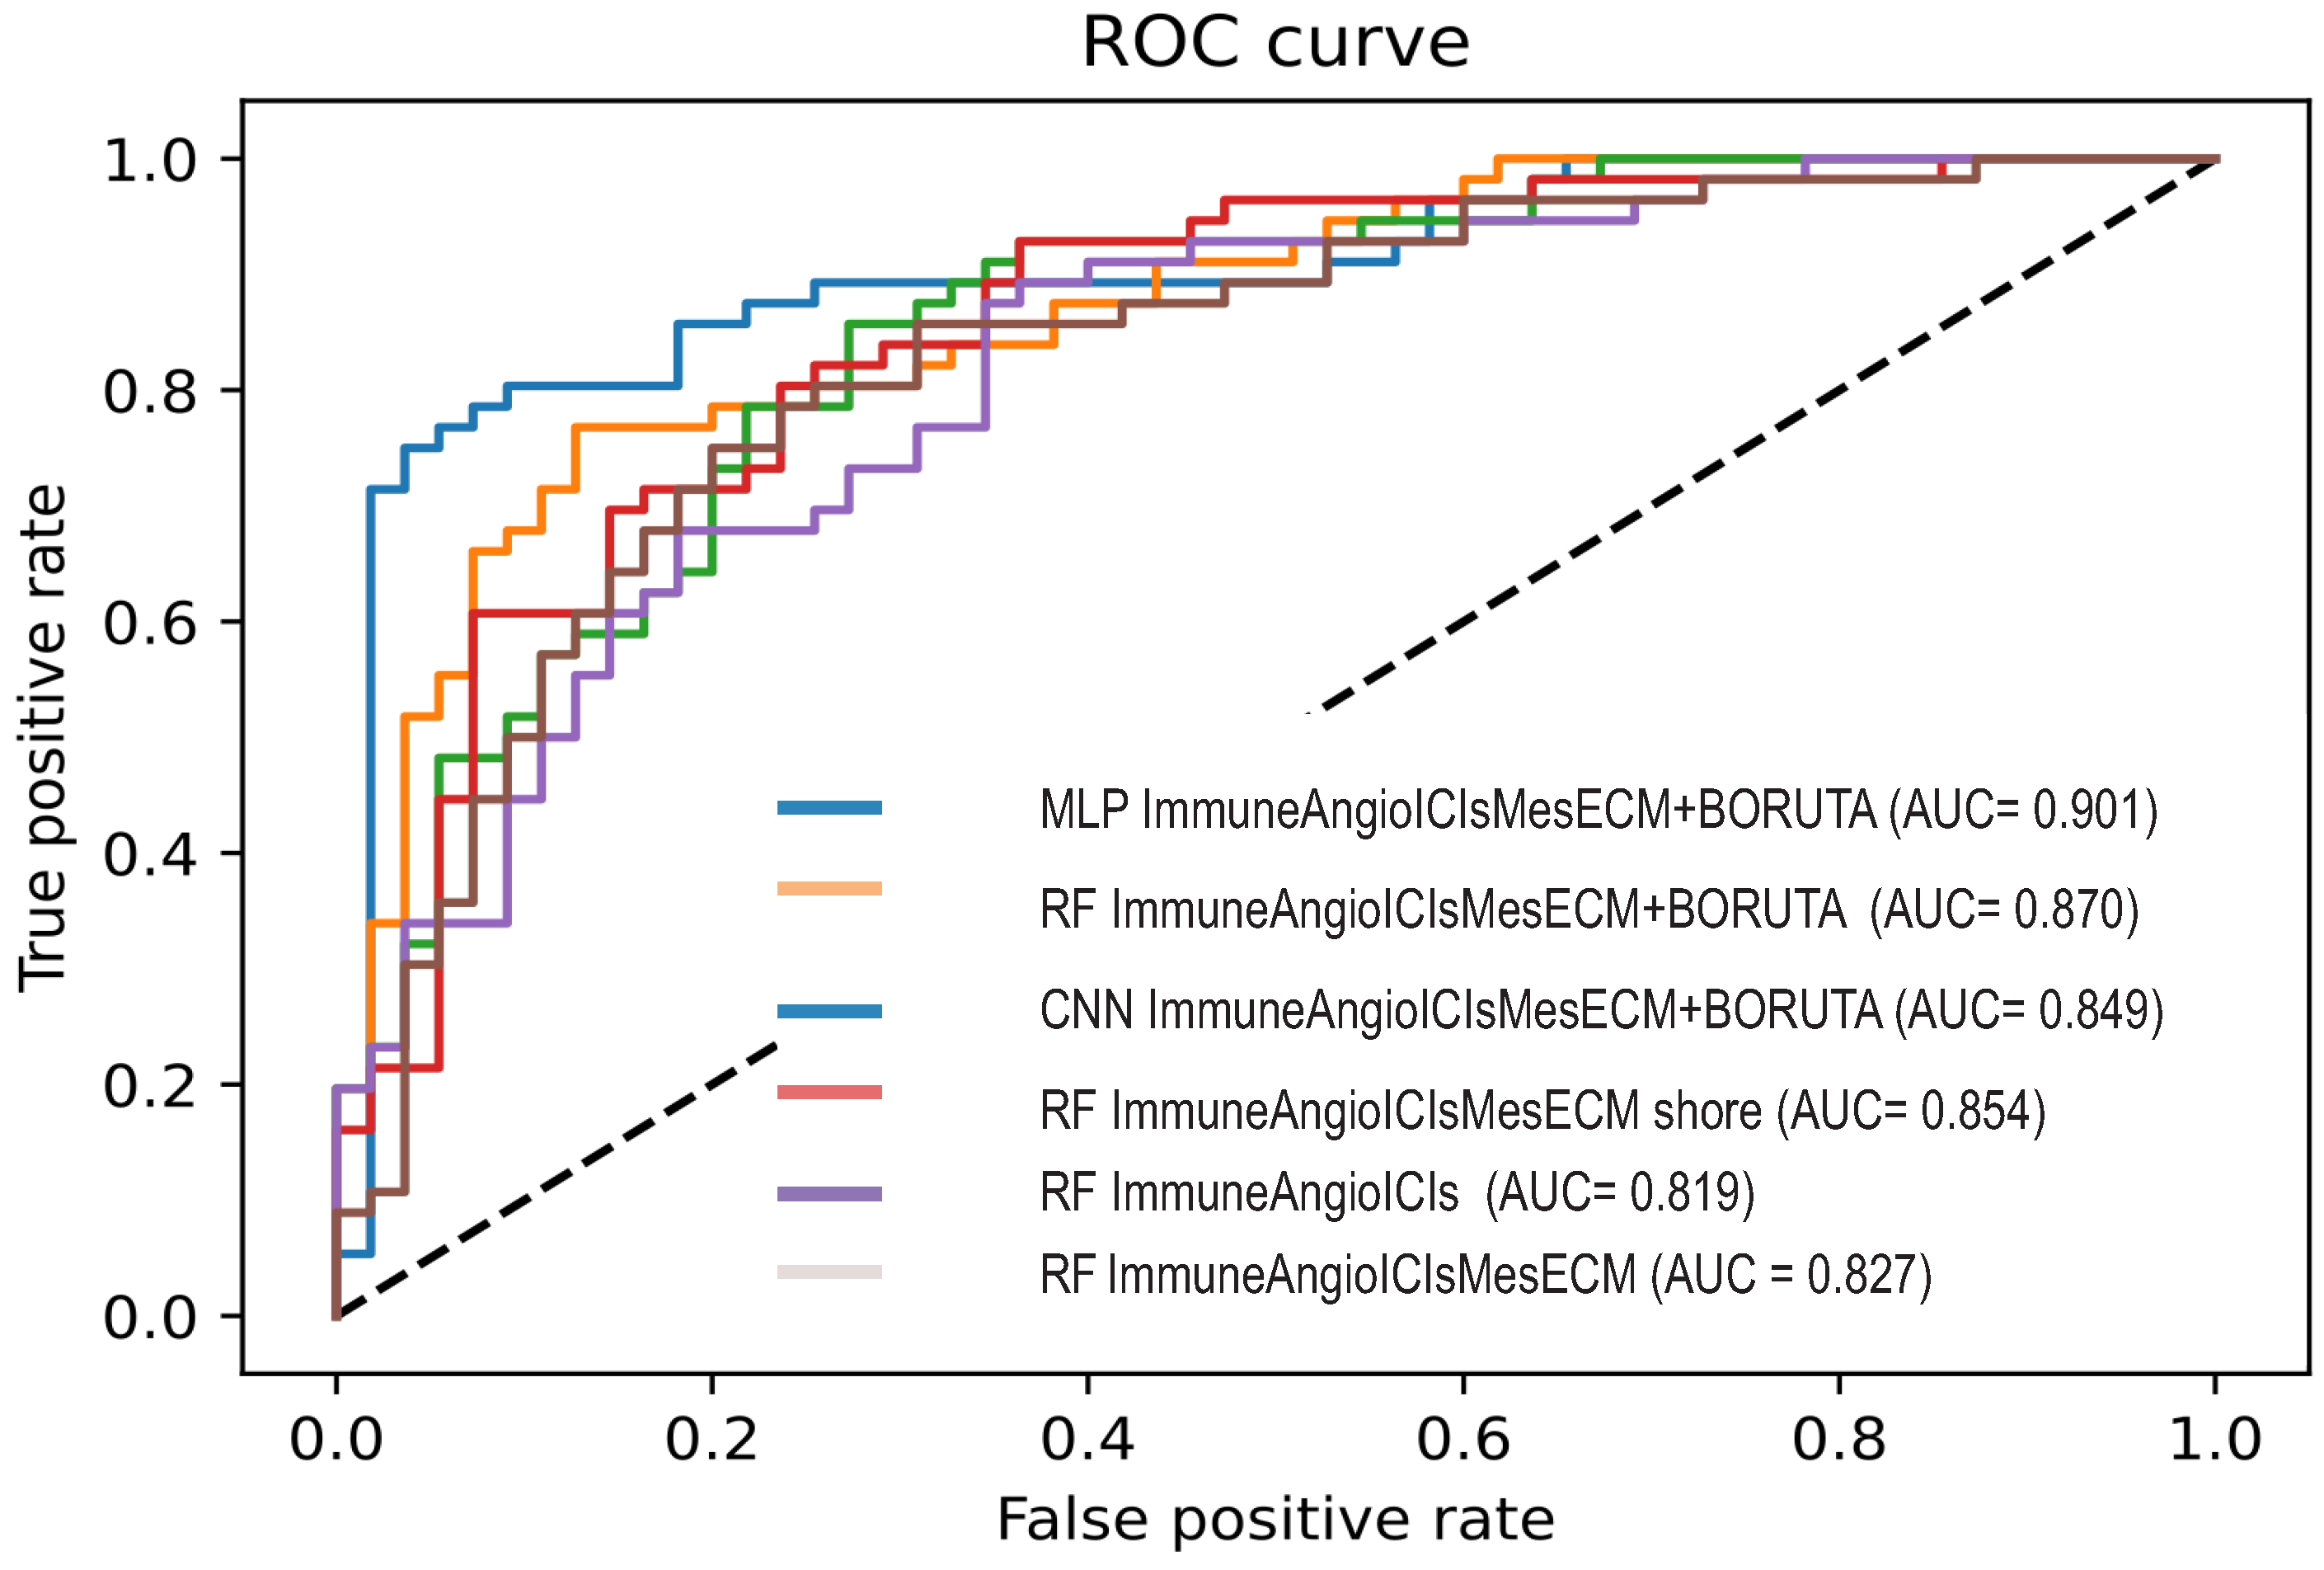
2.4. Evaluation
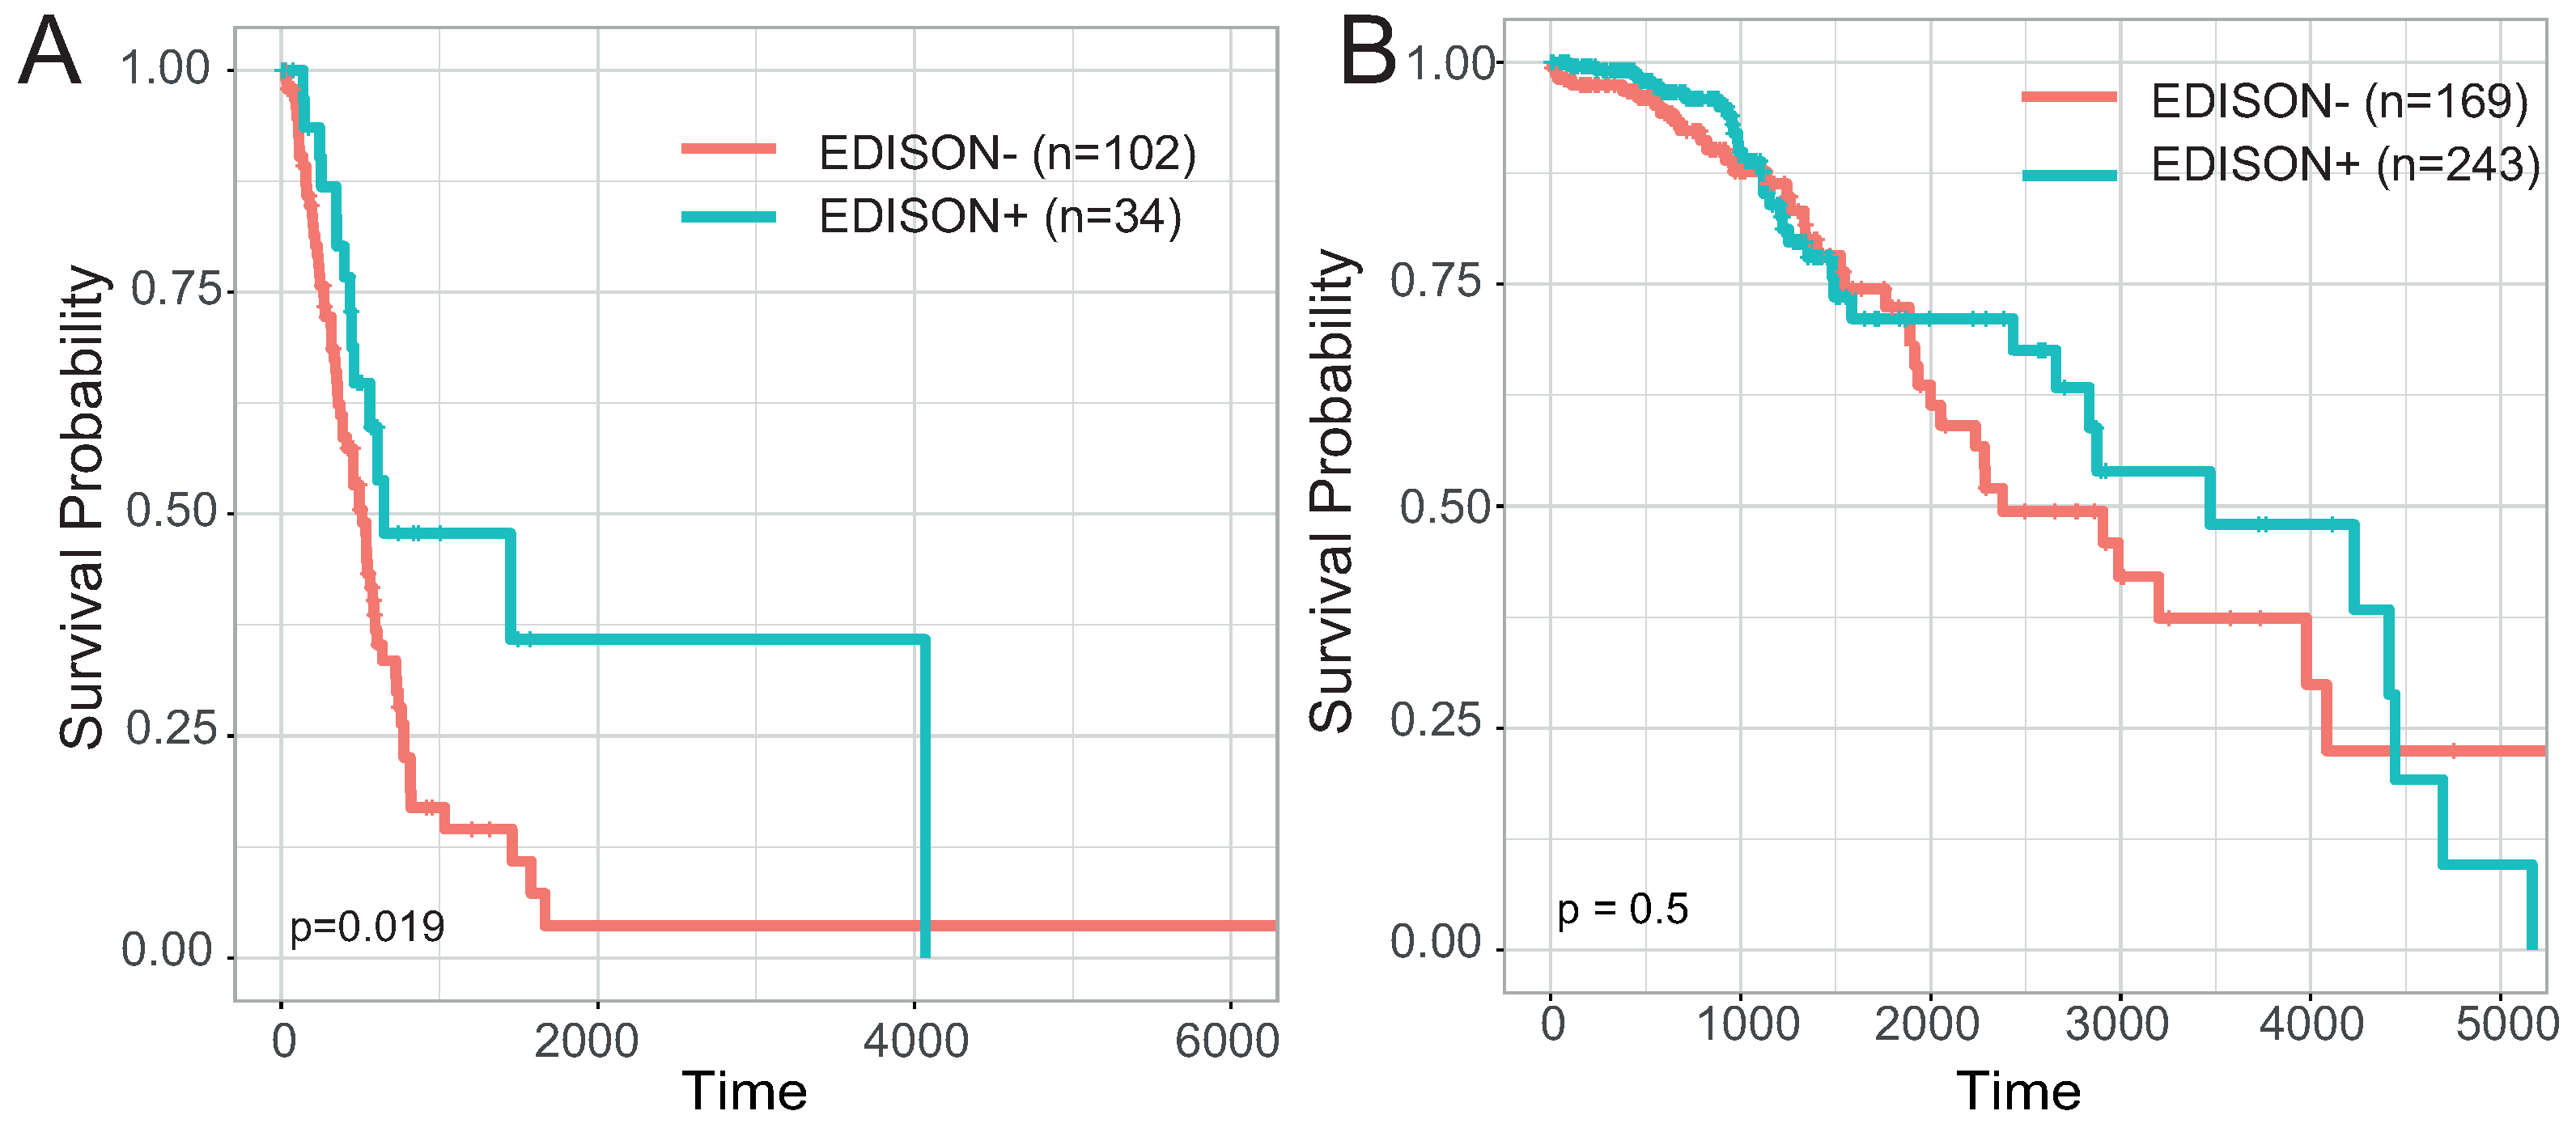
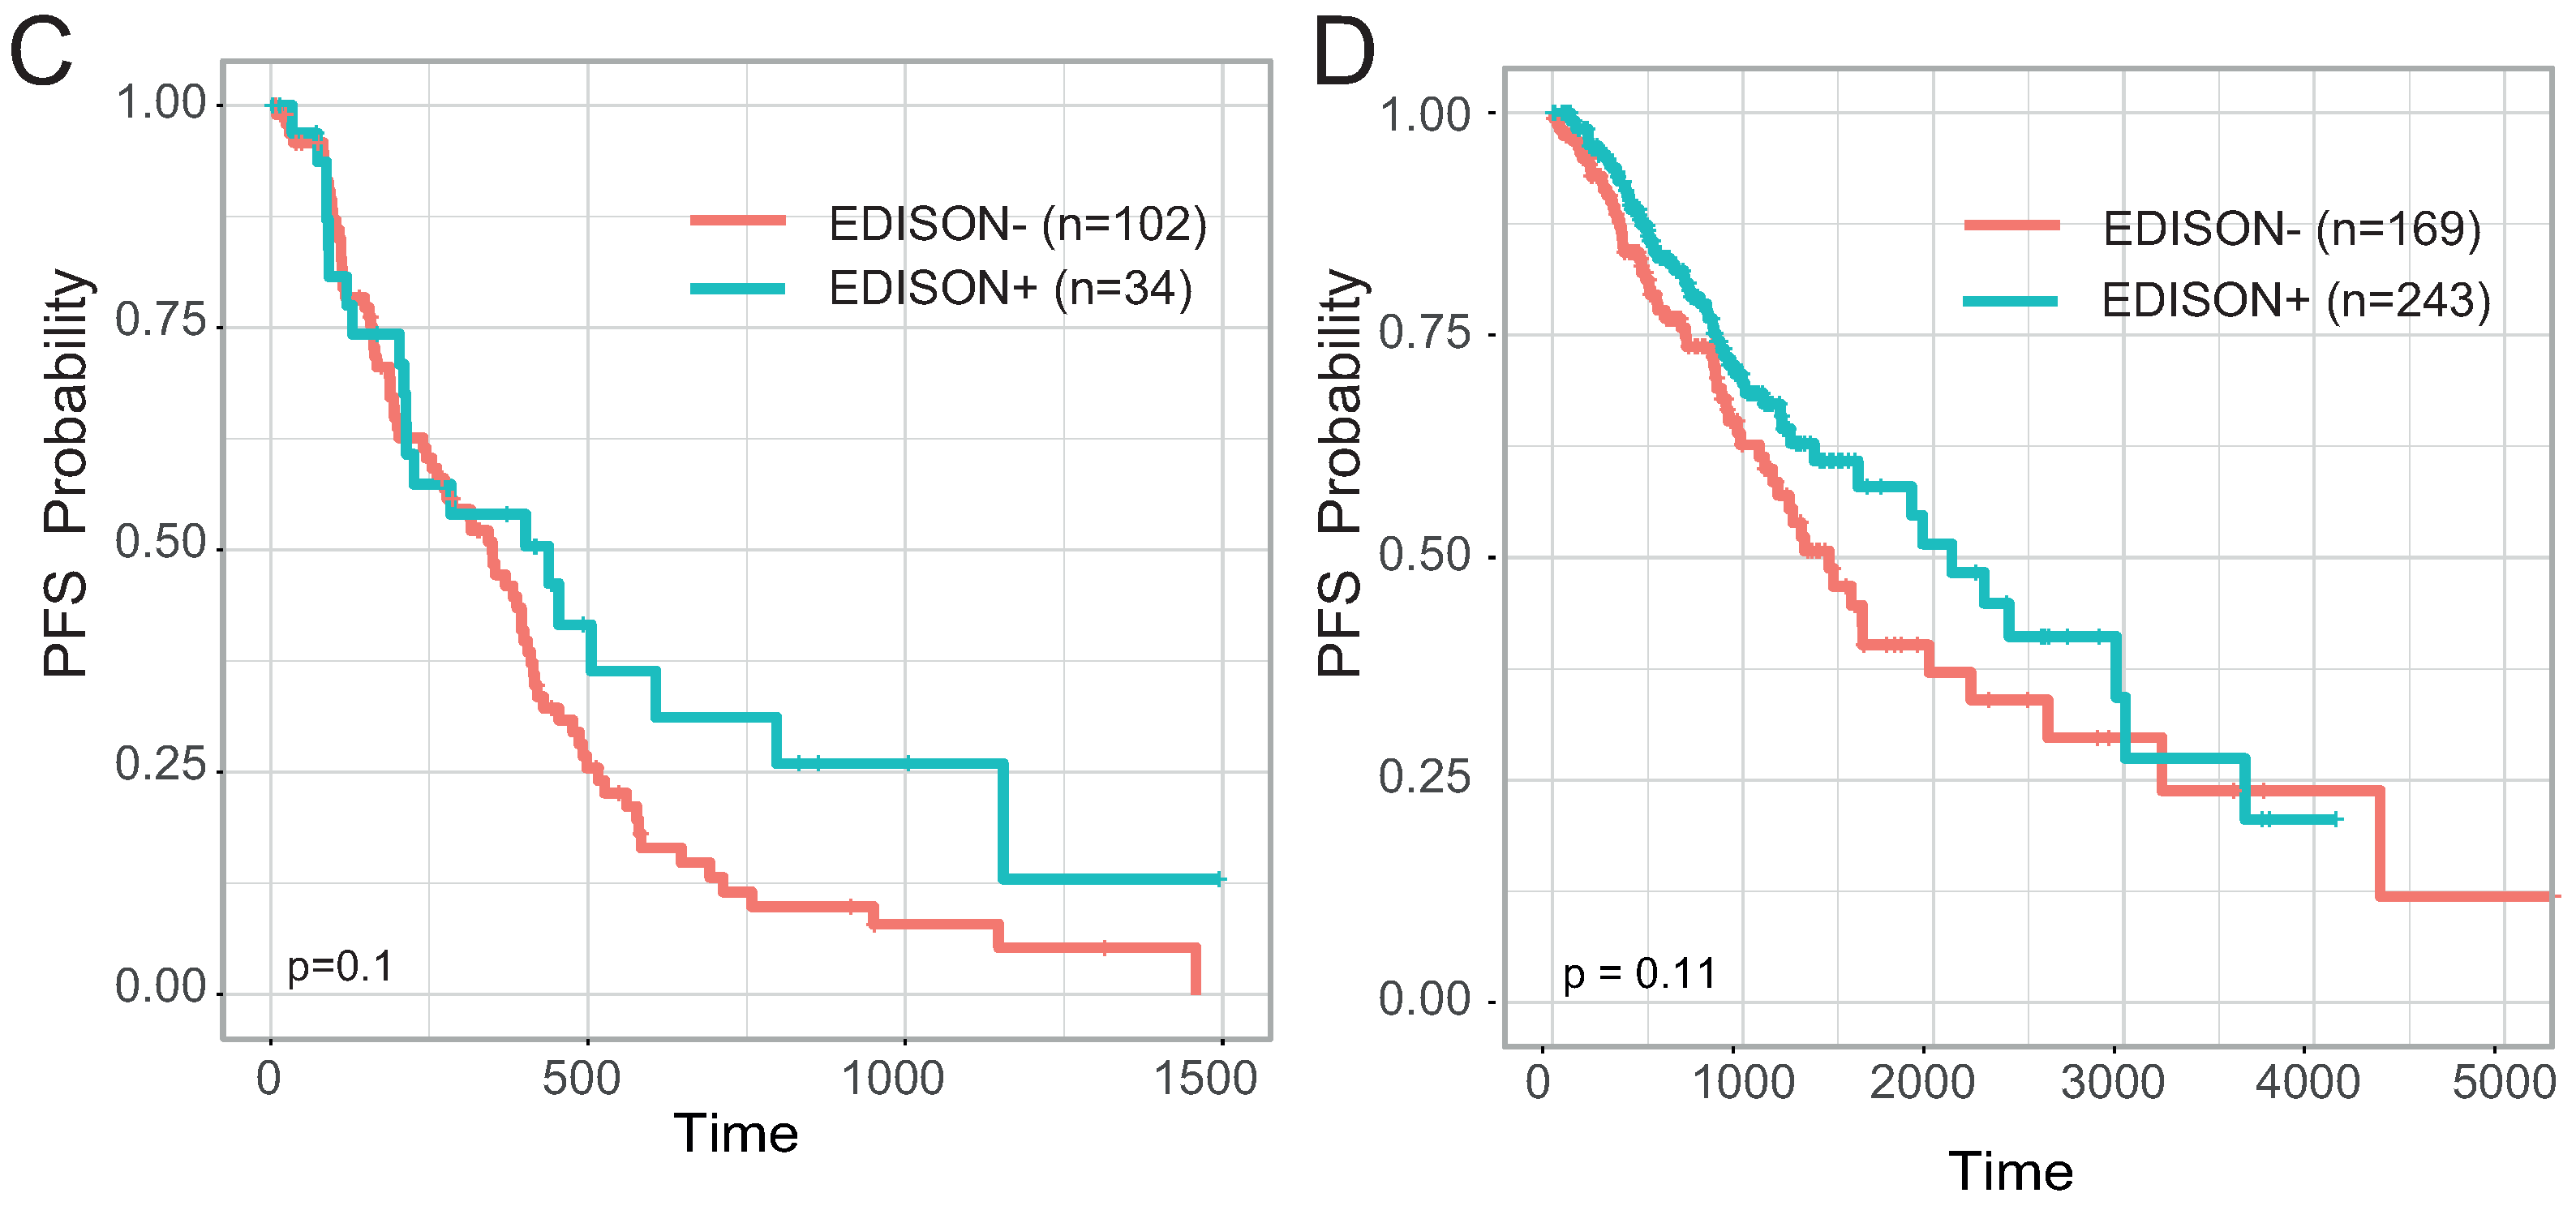
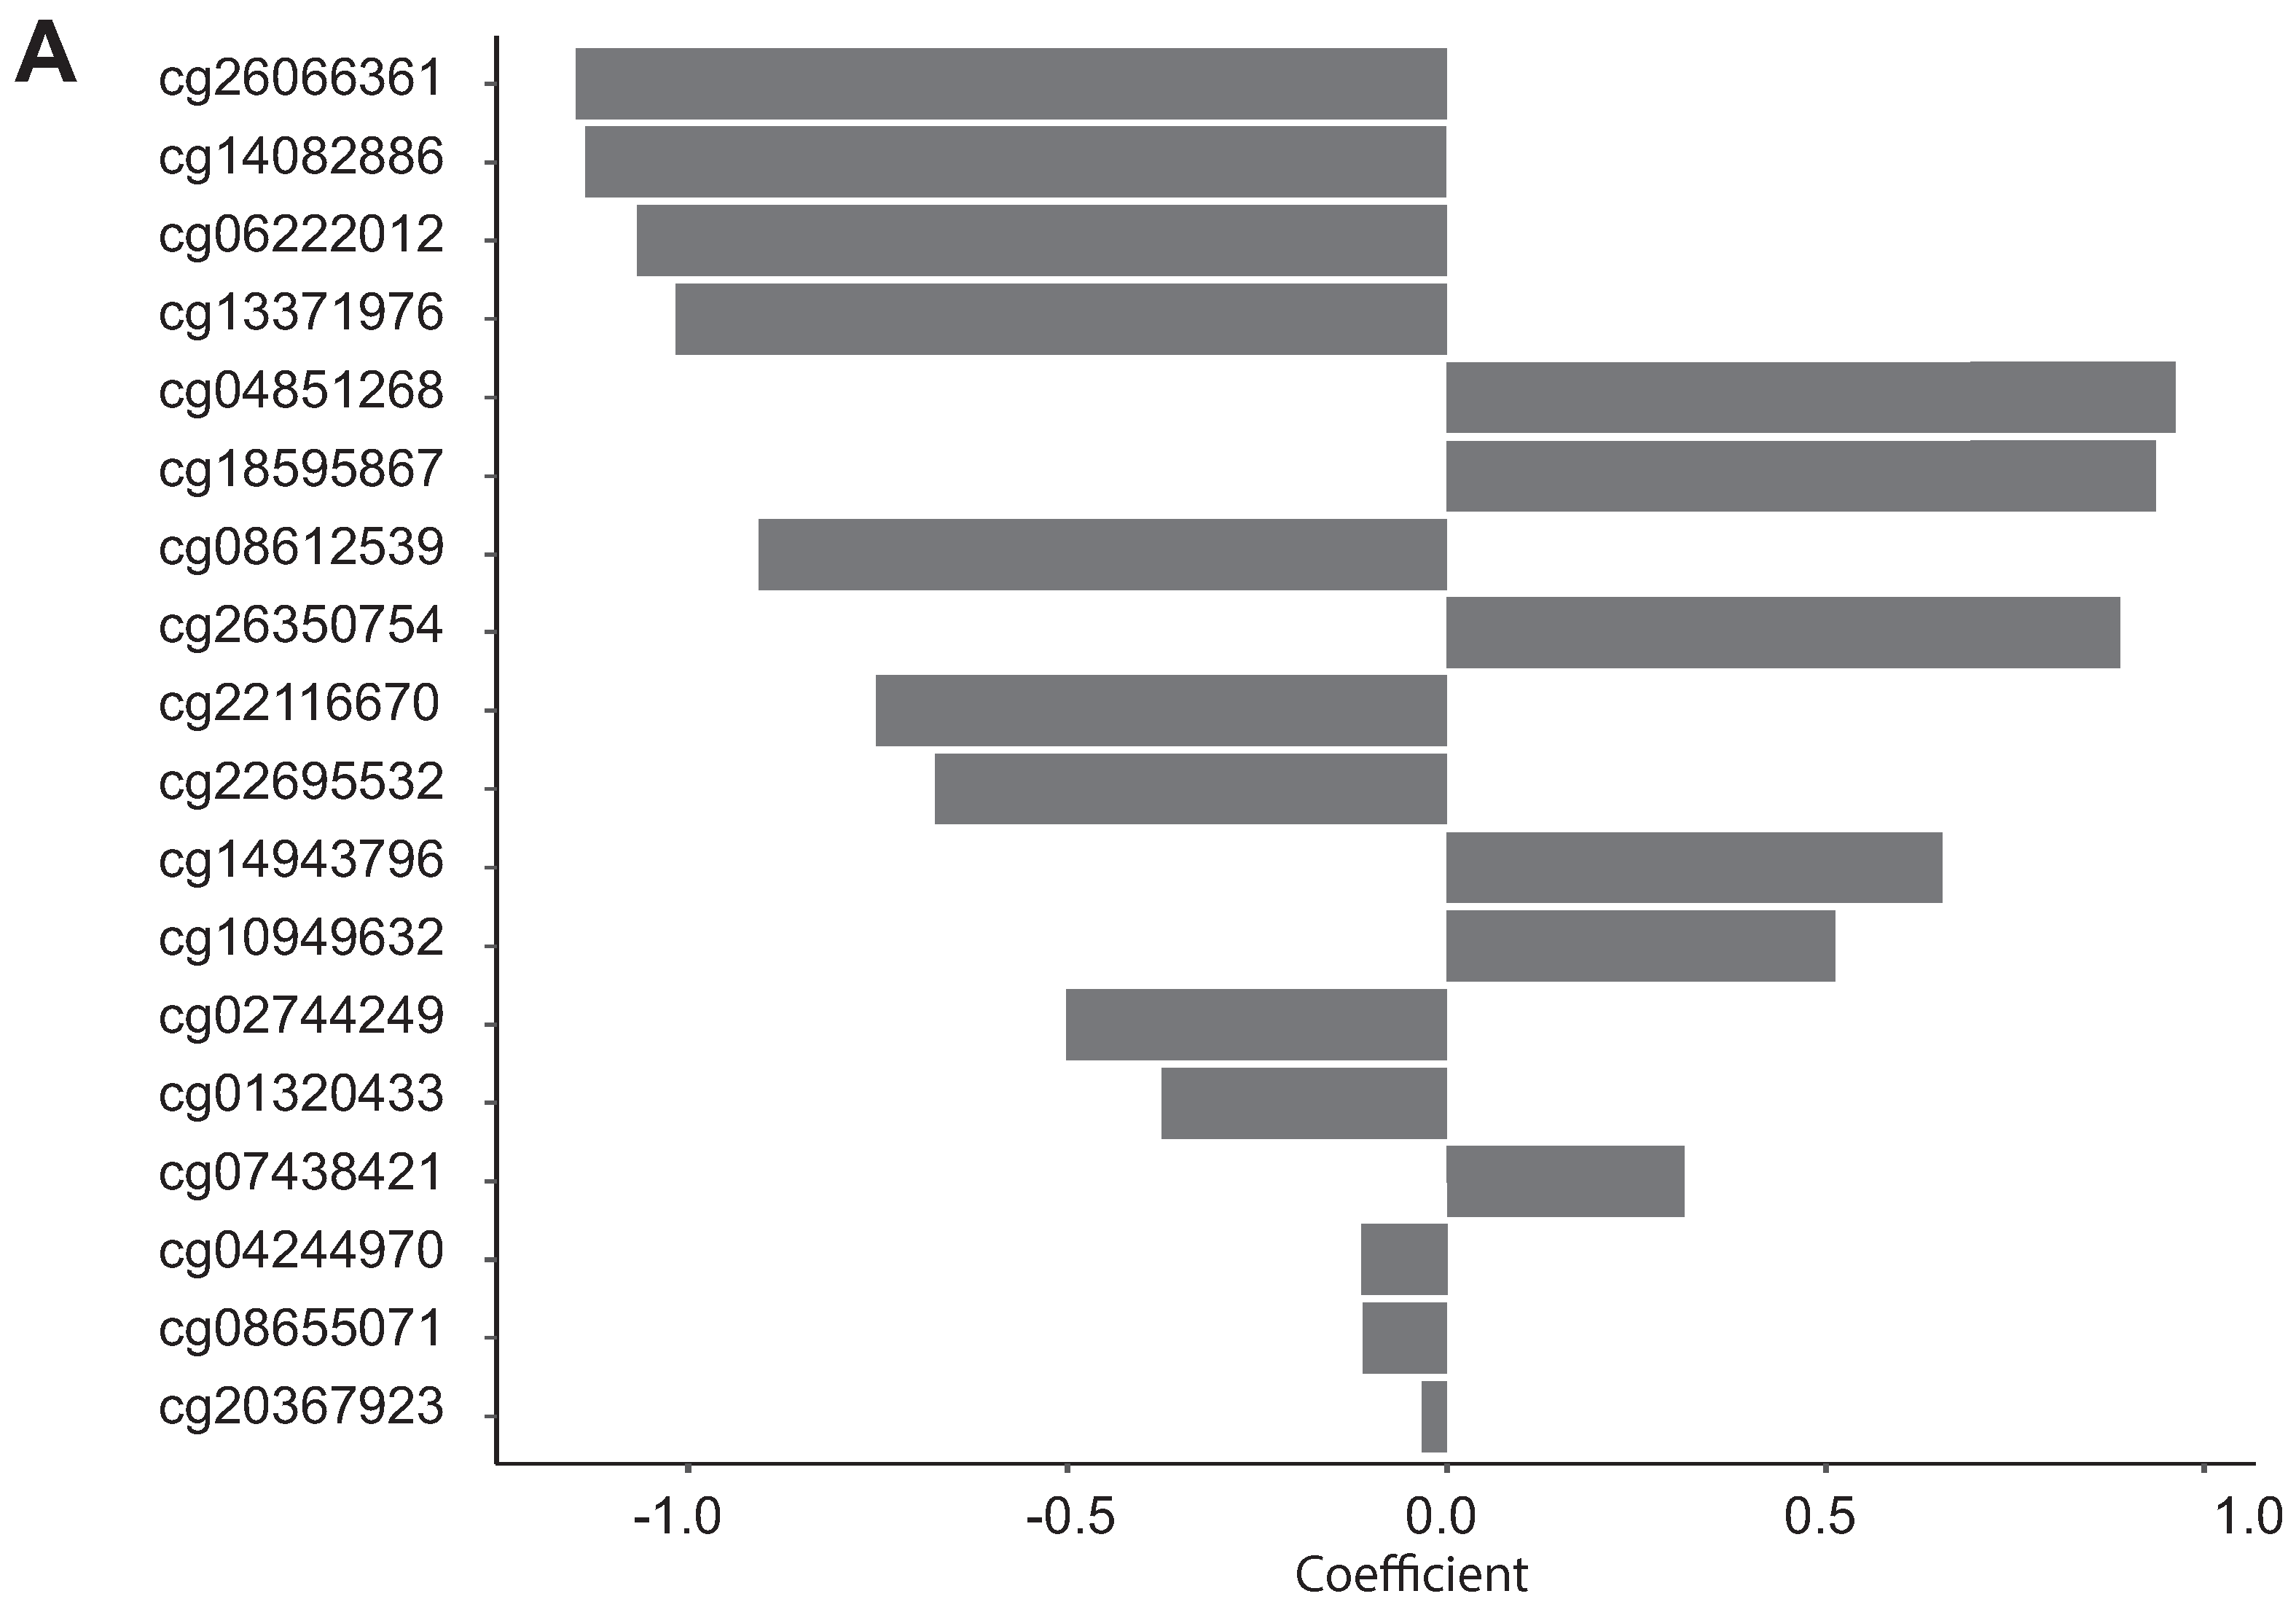
2.5. Evaluation of the 338 CpG Probes Used for the Model as Survival Prognosticator
2.6. Definition of a Possible CpG Signature Useful for Liquid Biopsy
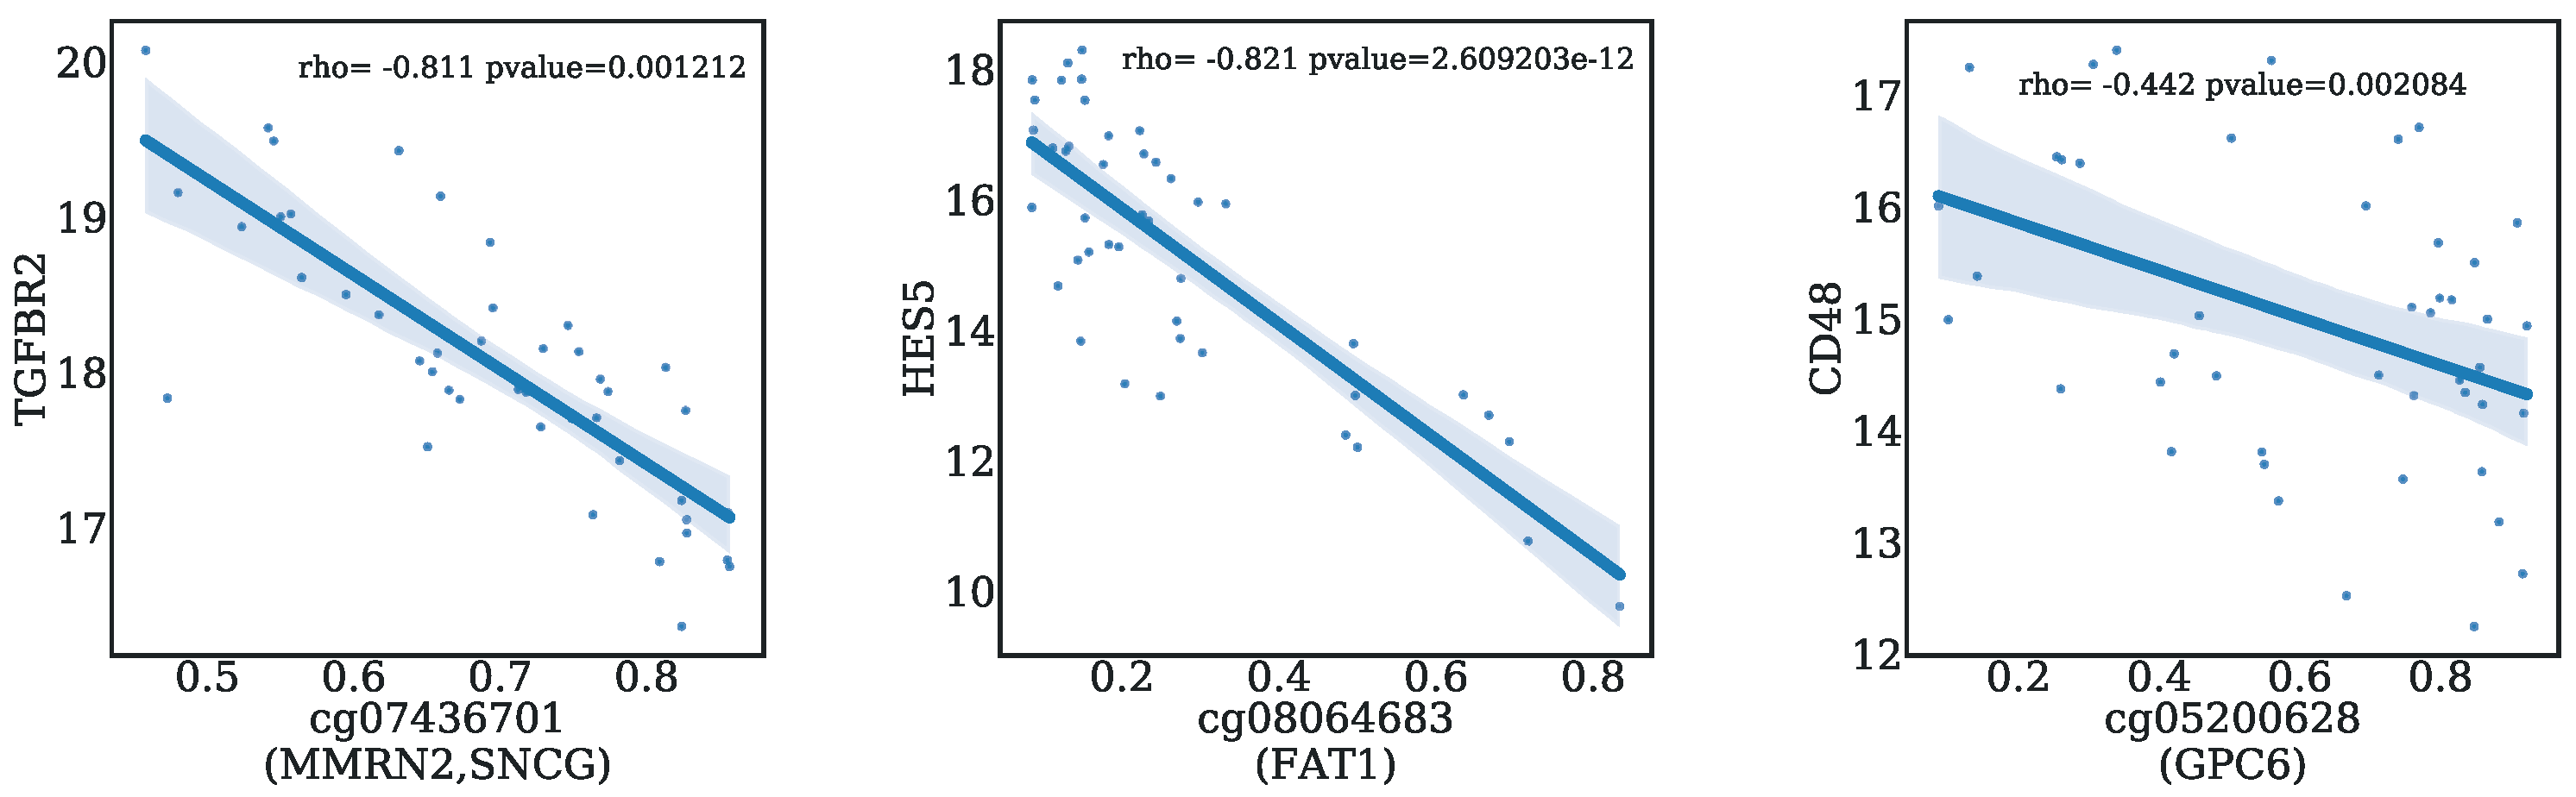
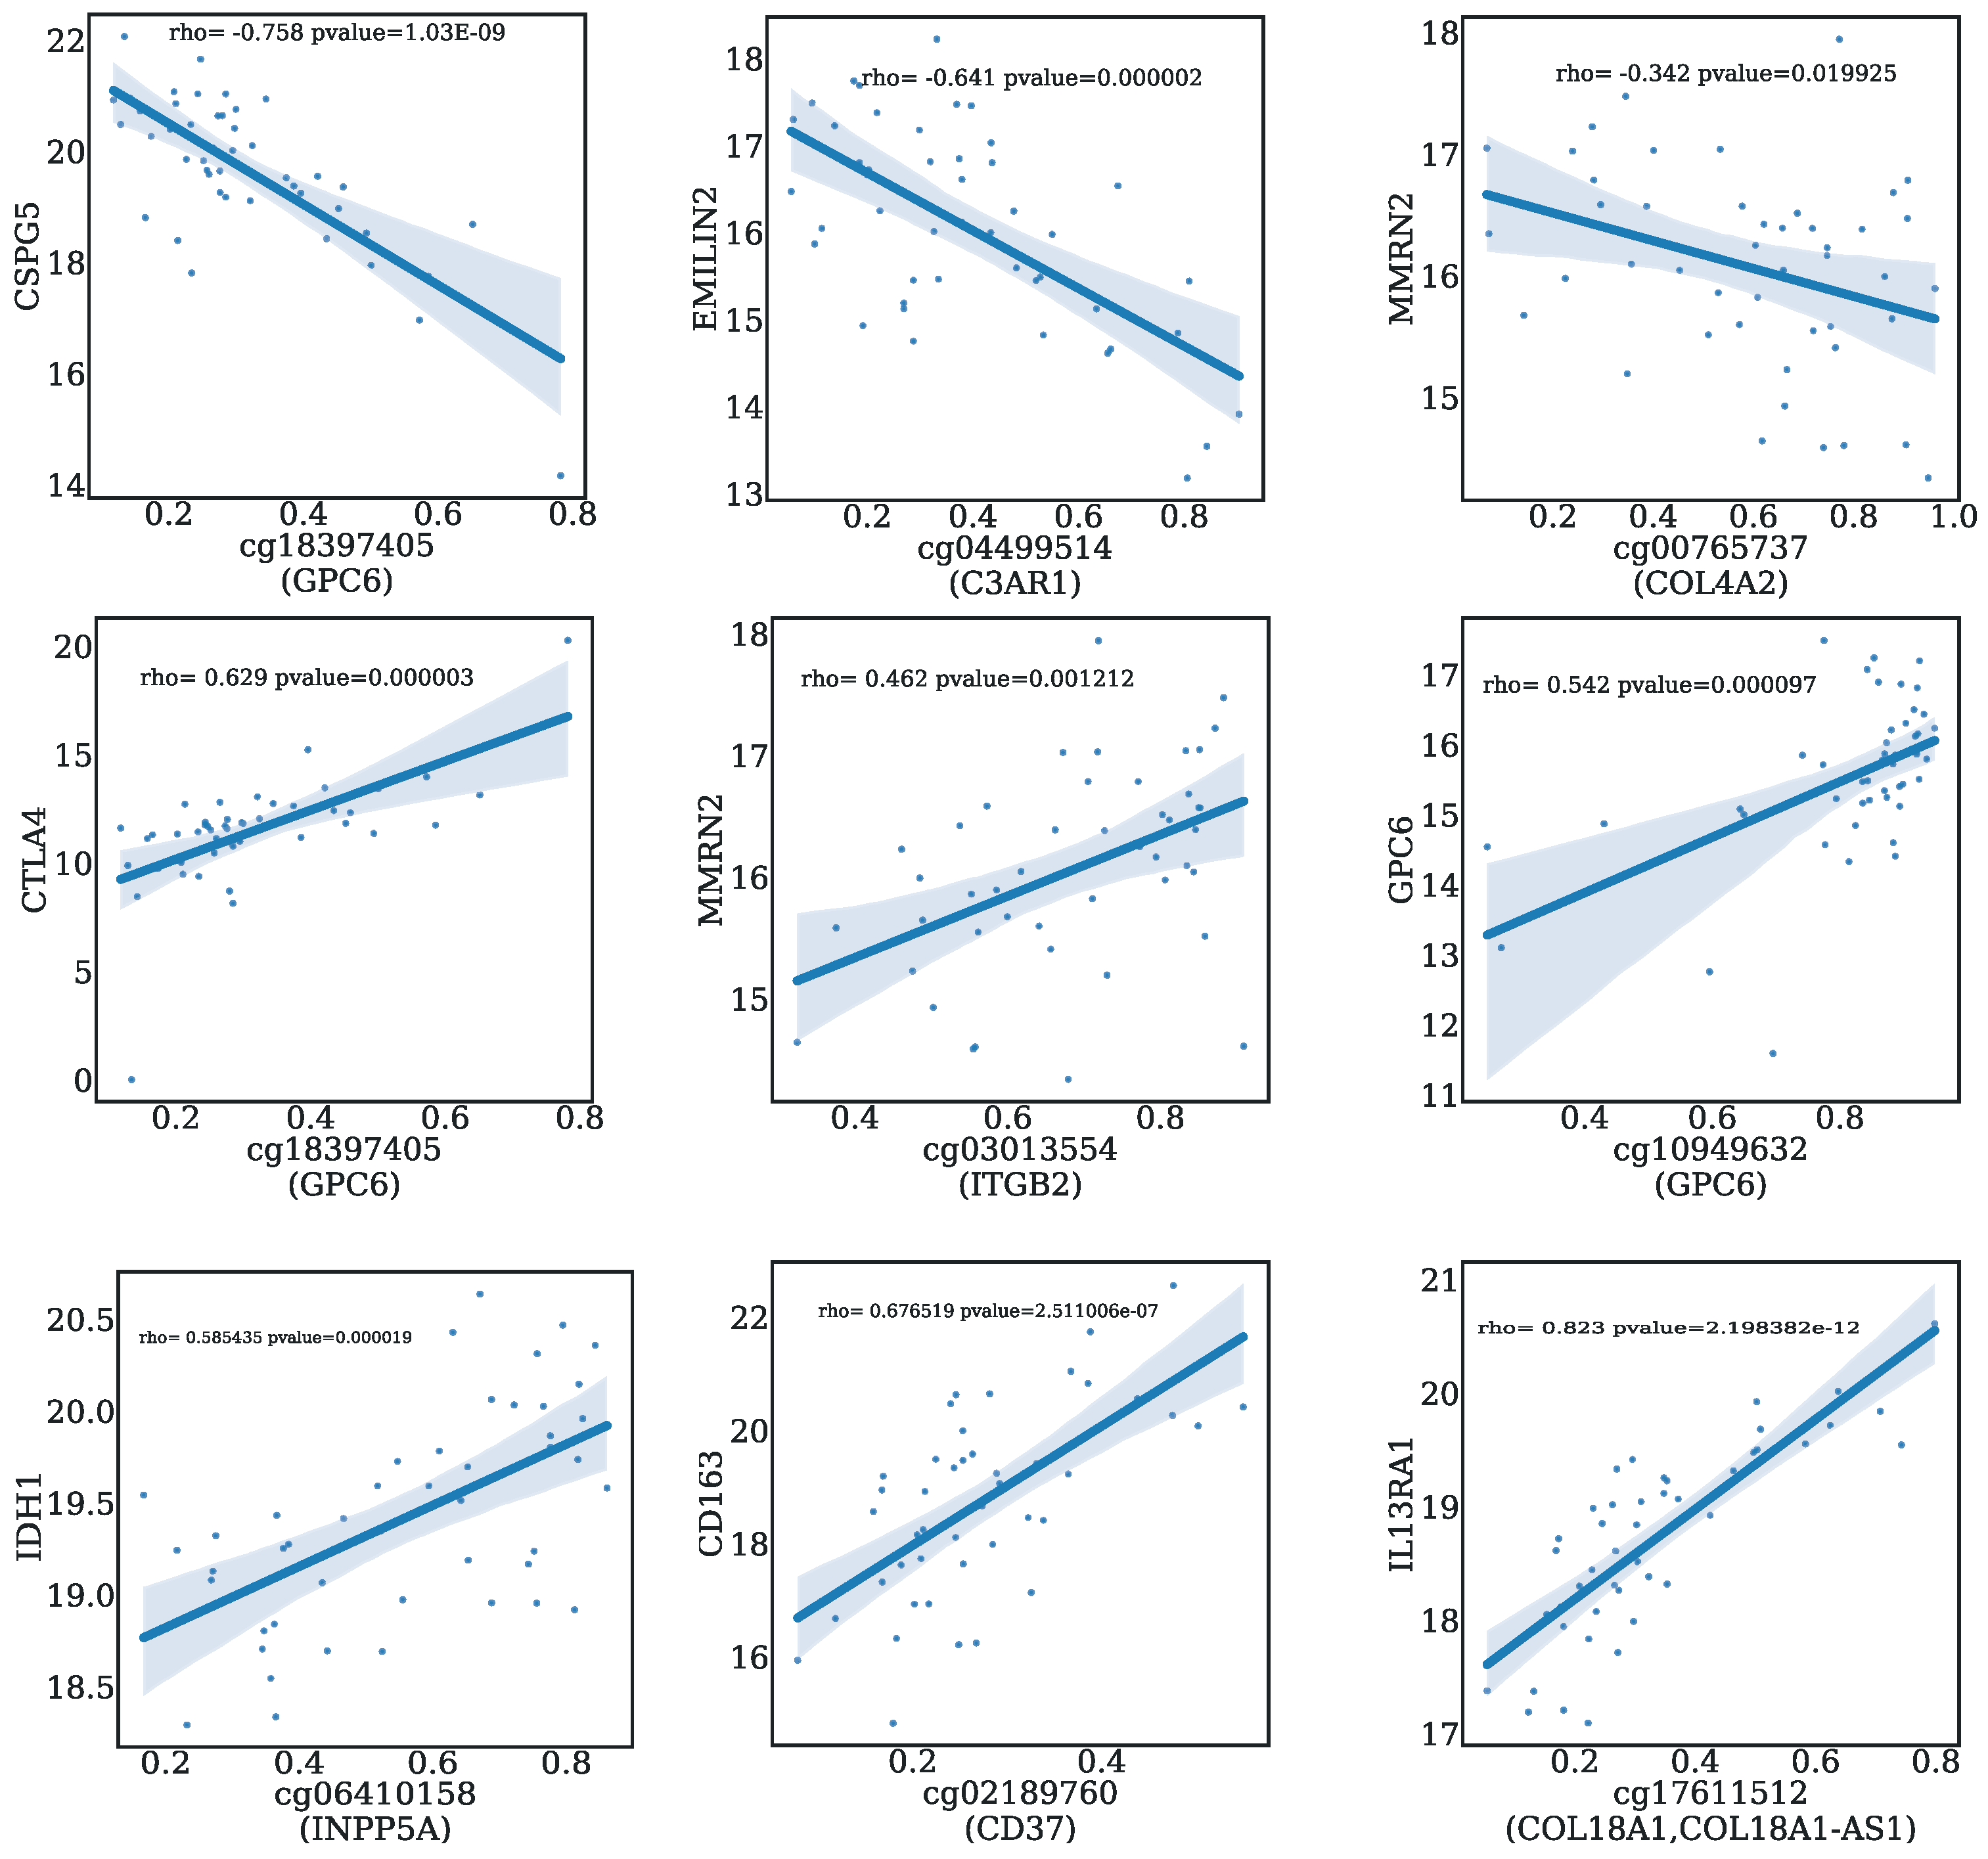
2.7. Correlation Analysis between CpGs and Genes
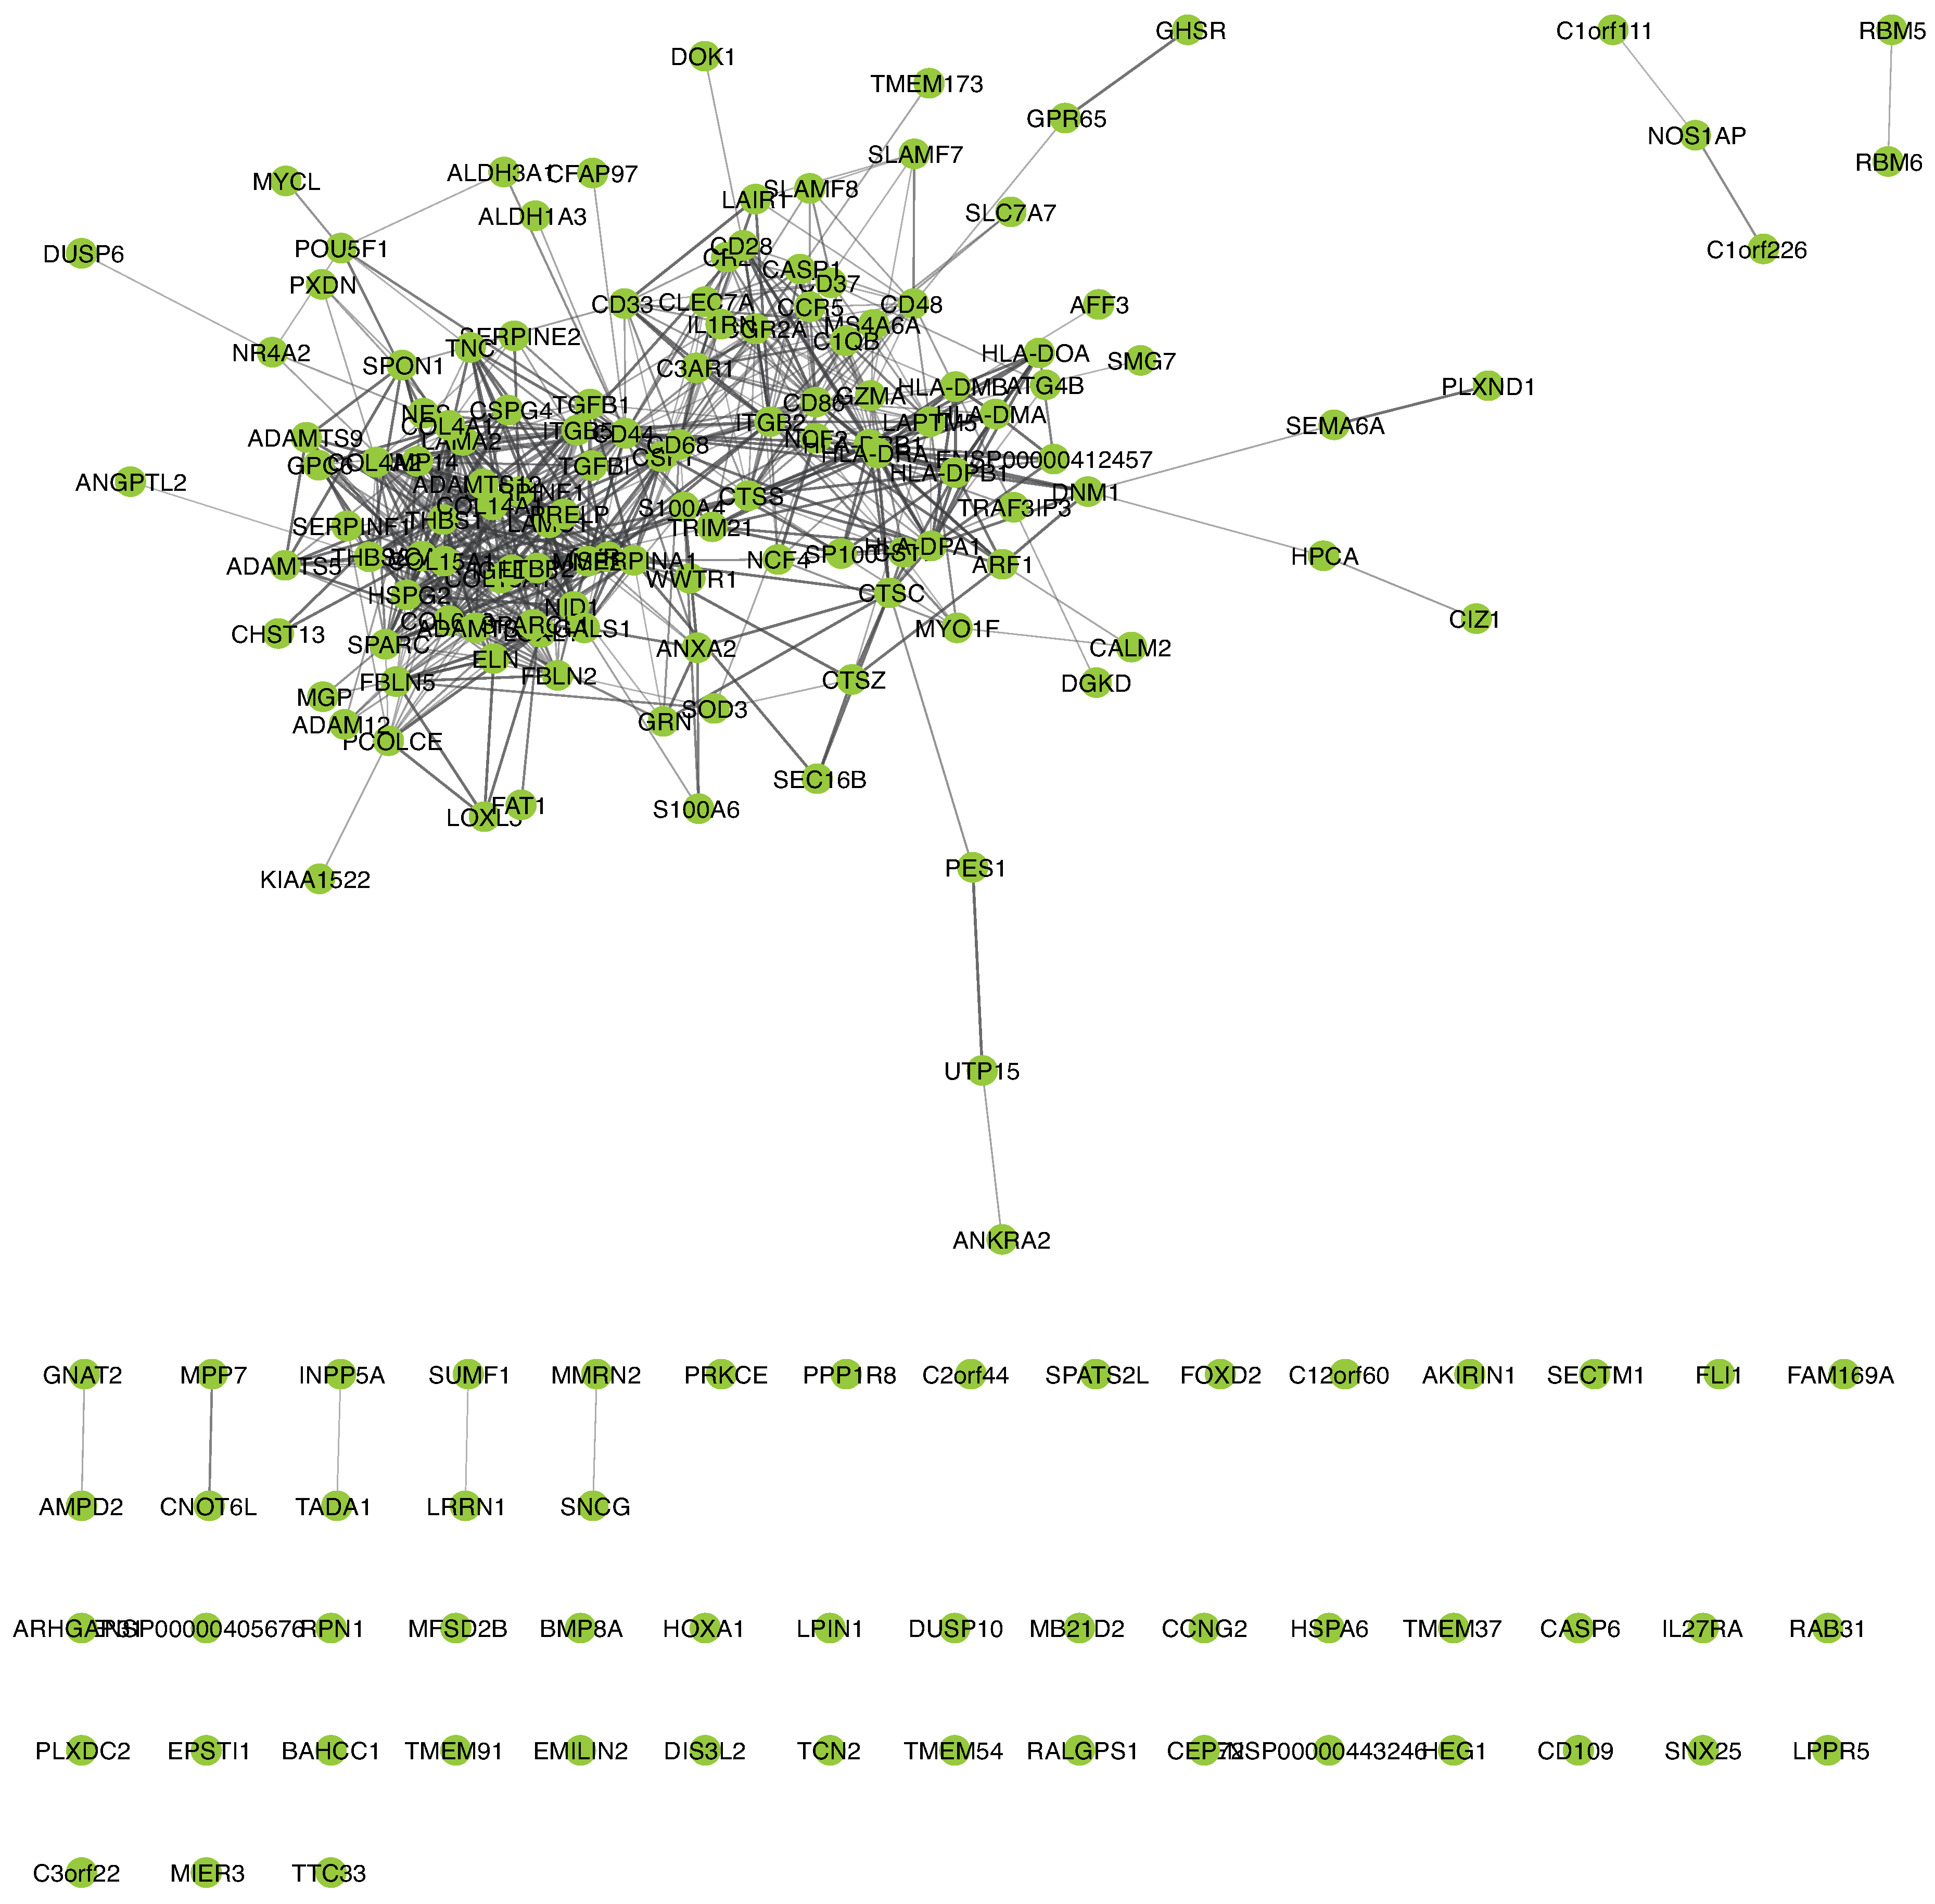
2.8. PPI Network Analysis of DNA Methylation-Driven Genes
2.9. Computational Details
3. Results
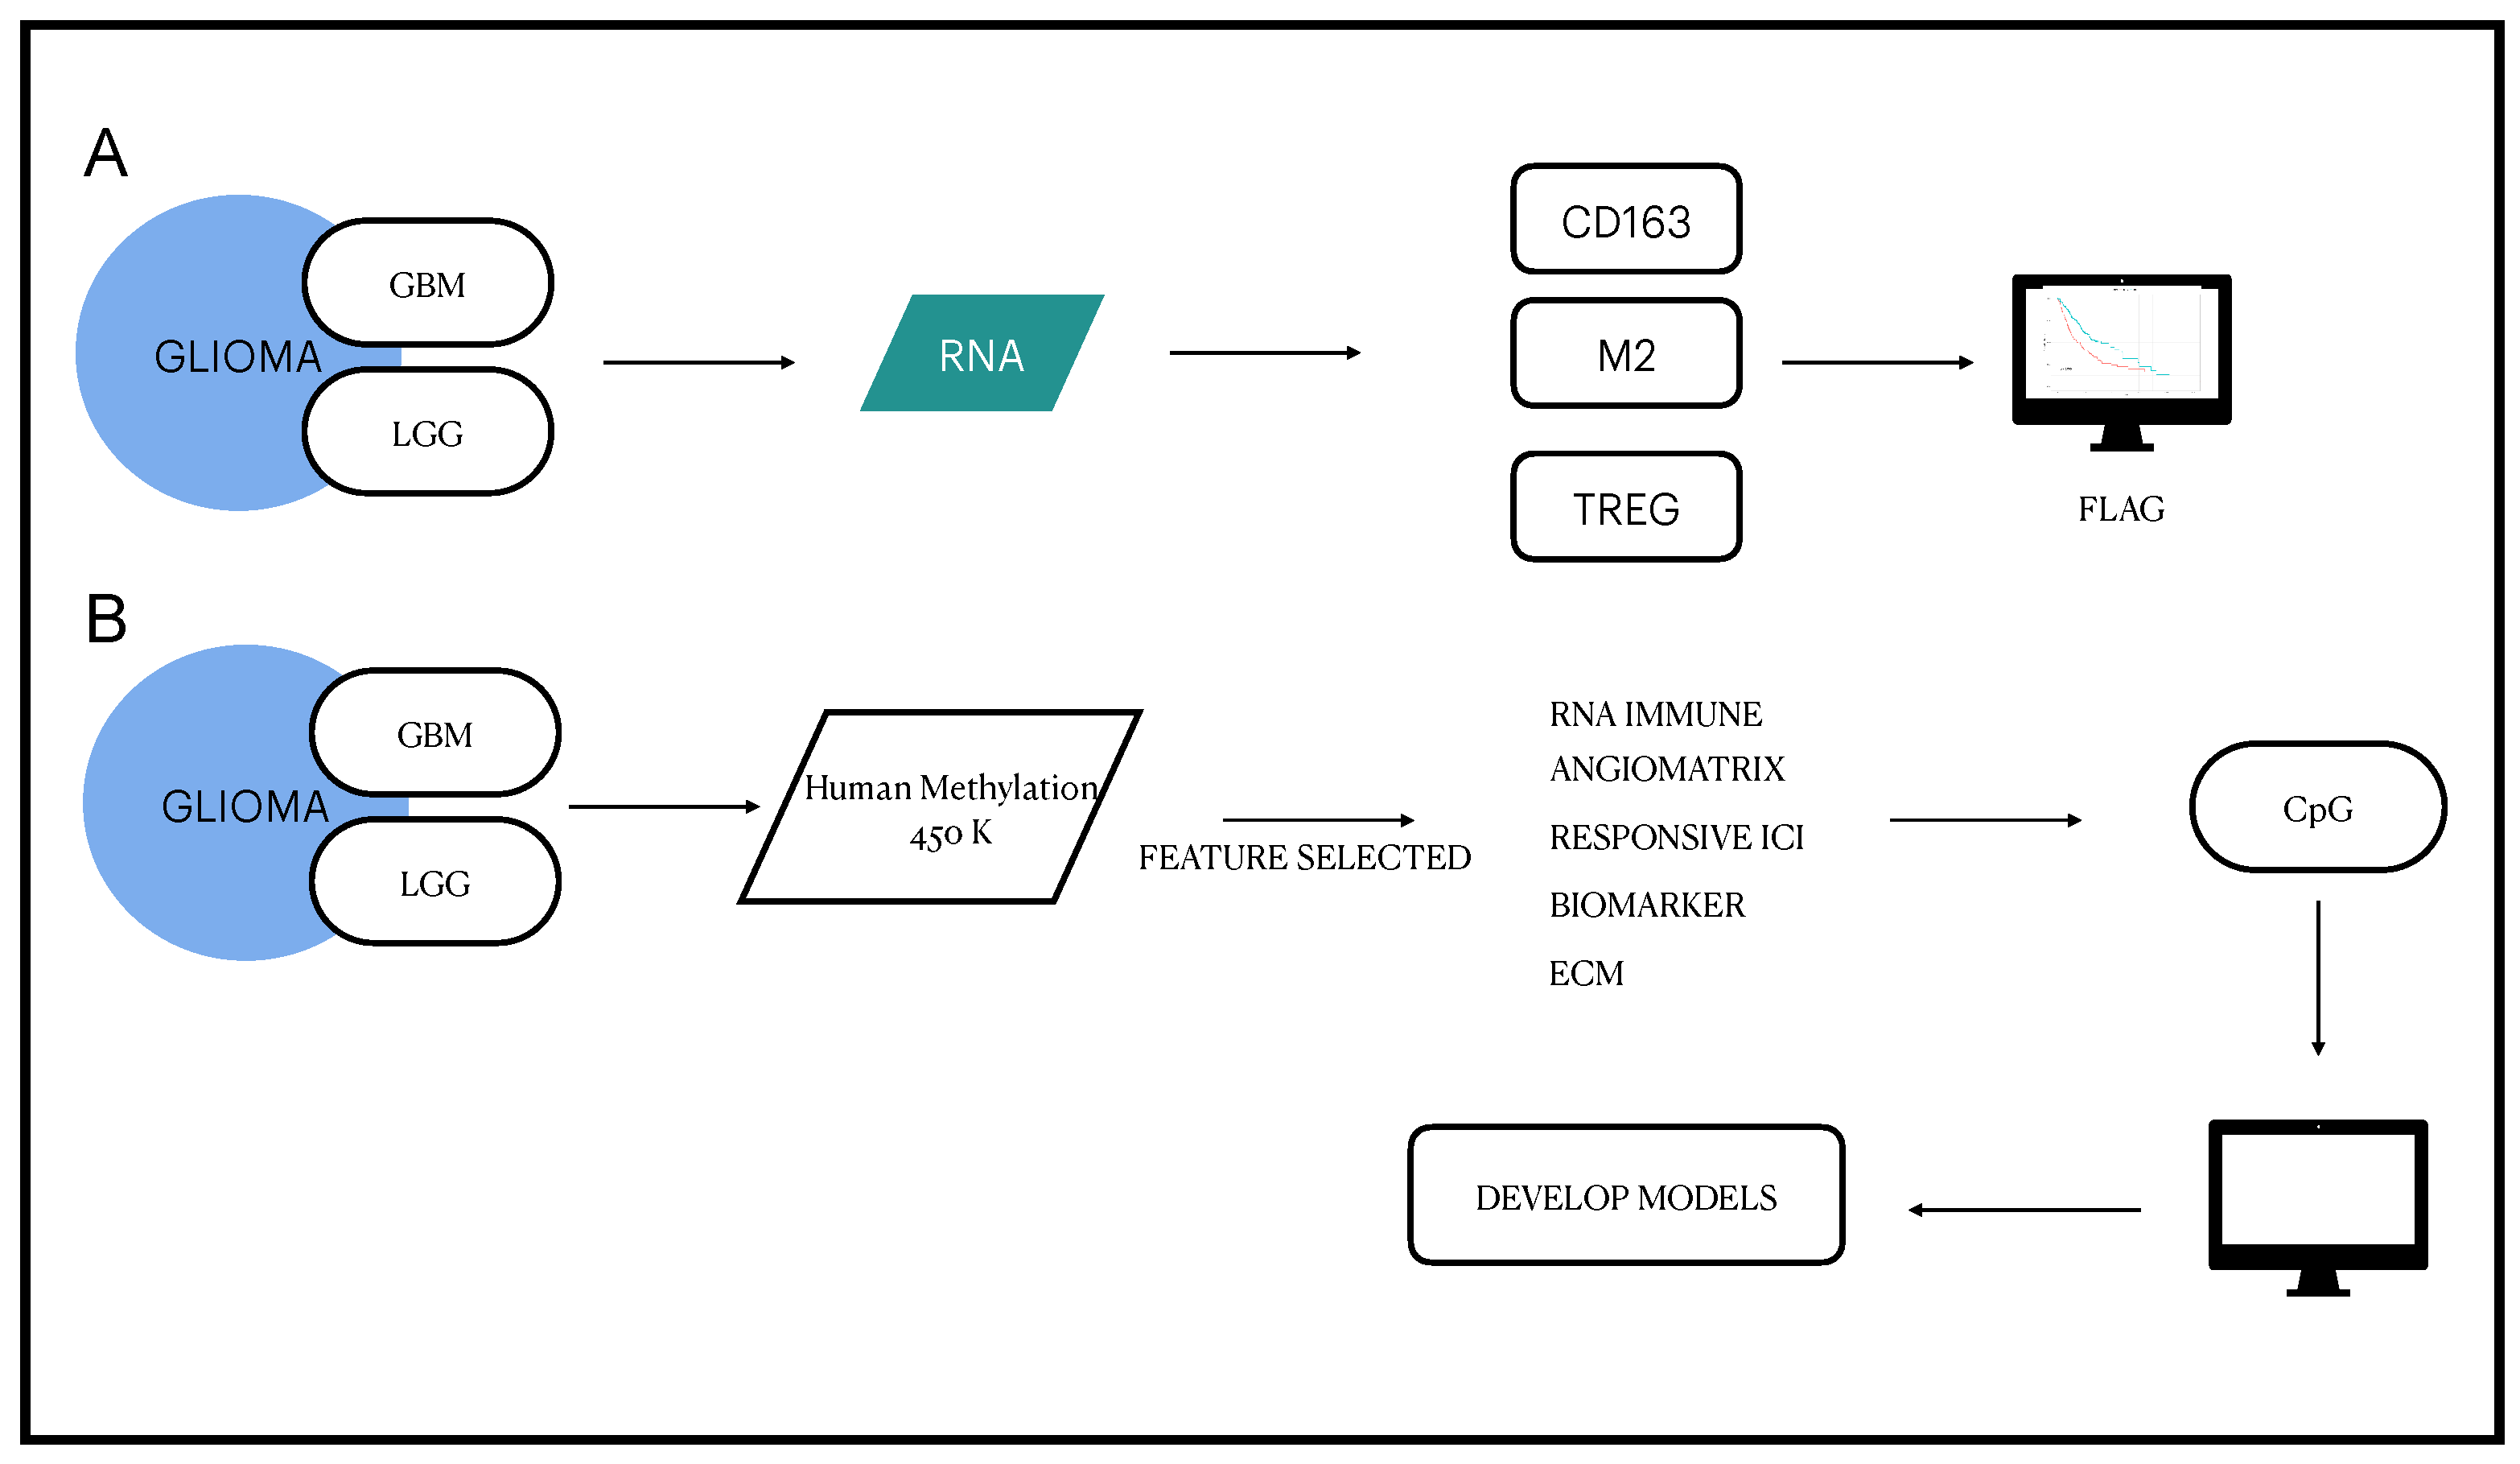
3.1. Definition of the EDISON Classification Flag
3.2. From RNA Genes to the Classification Model
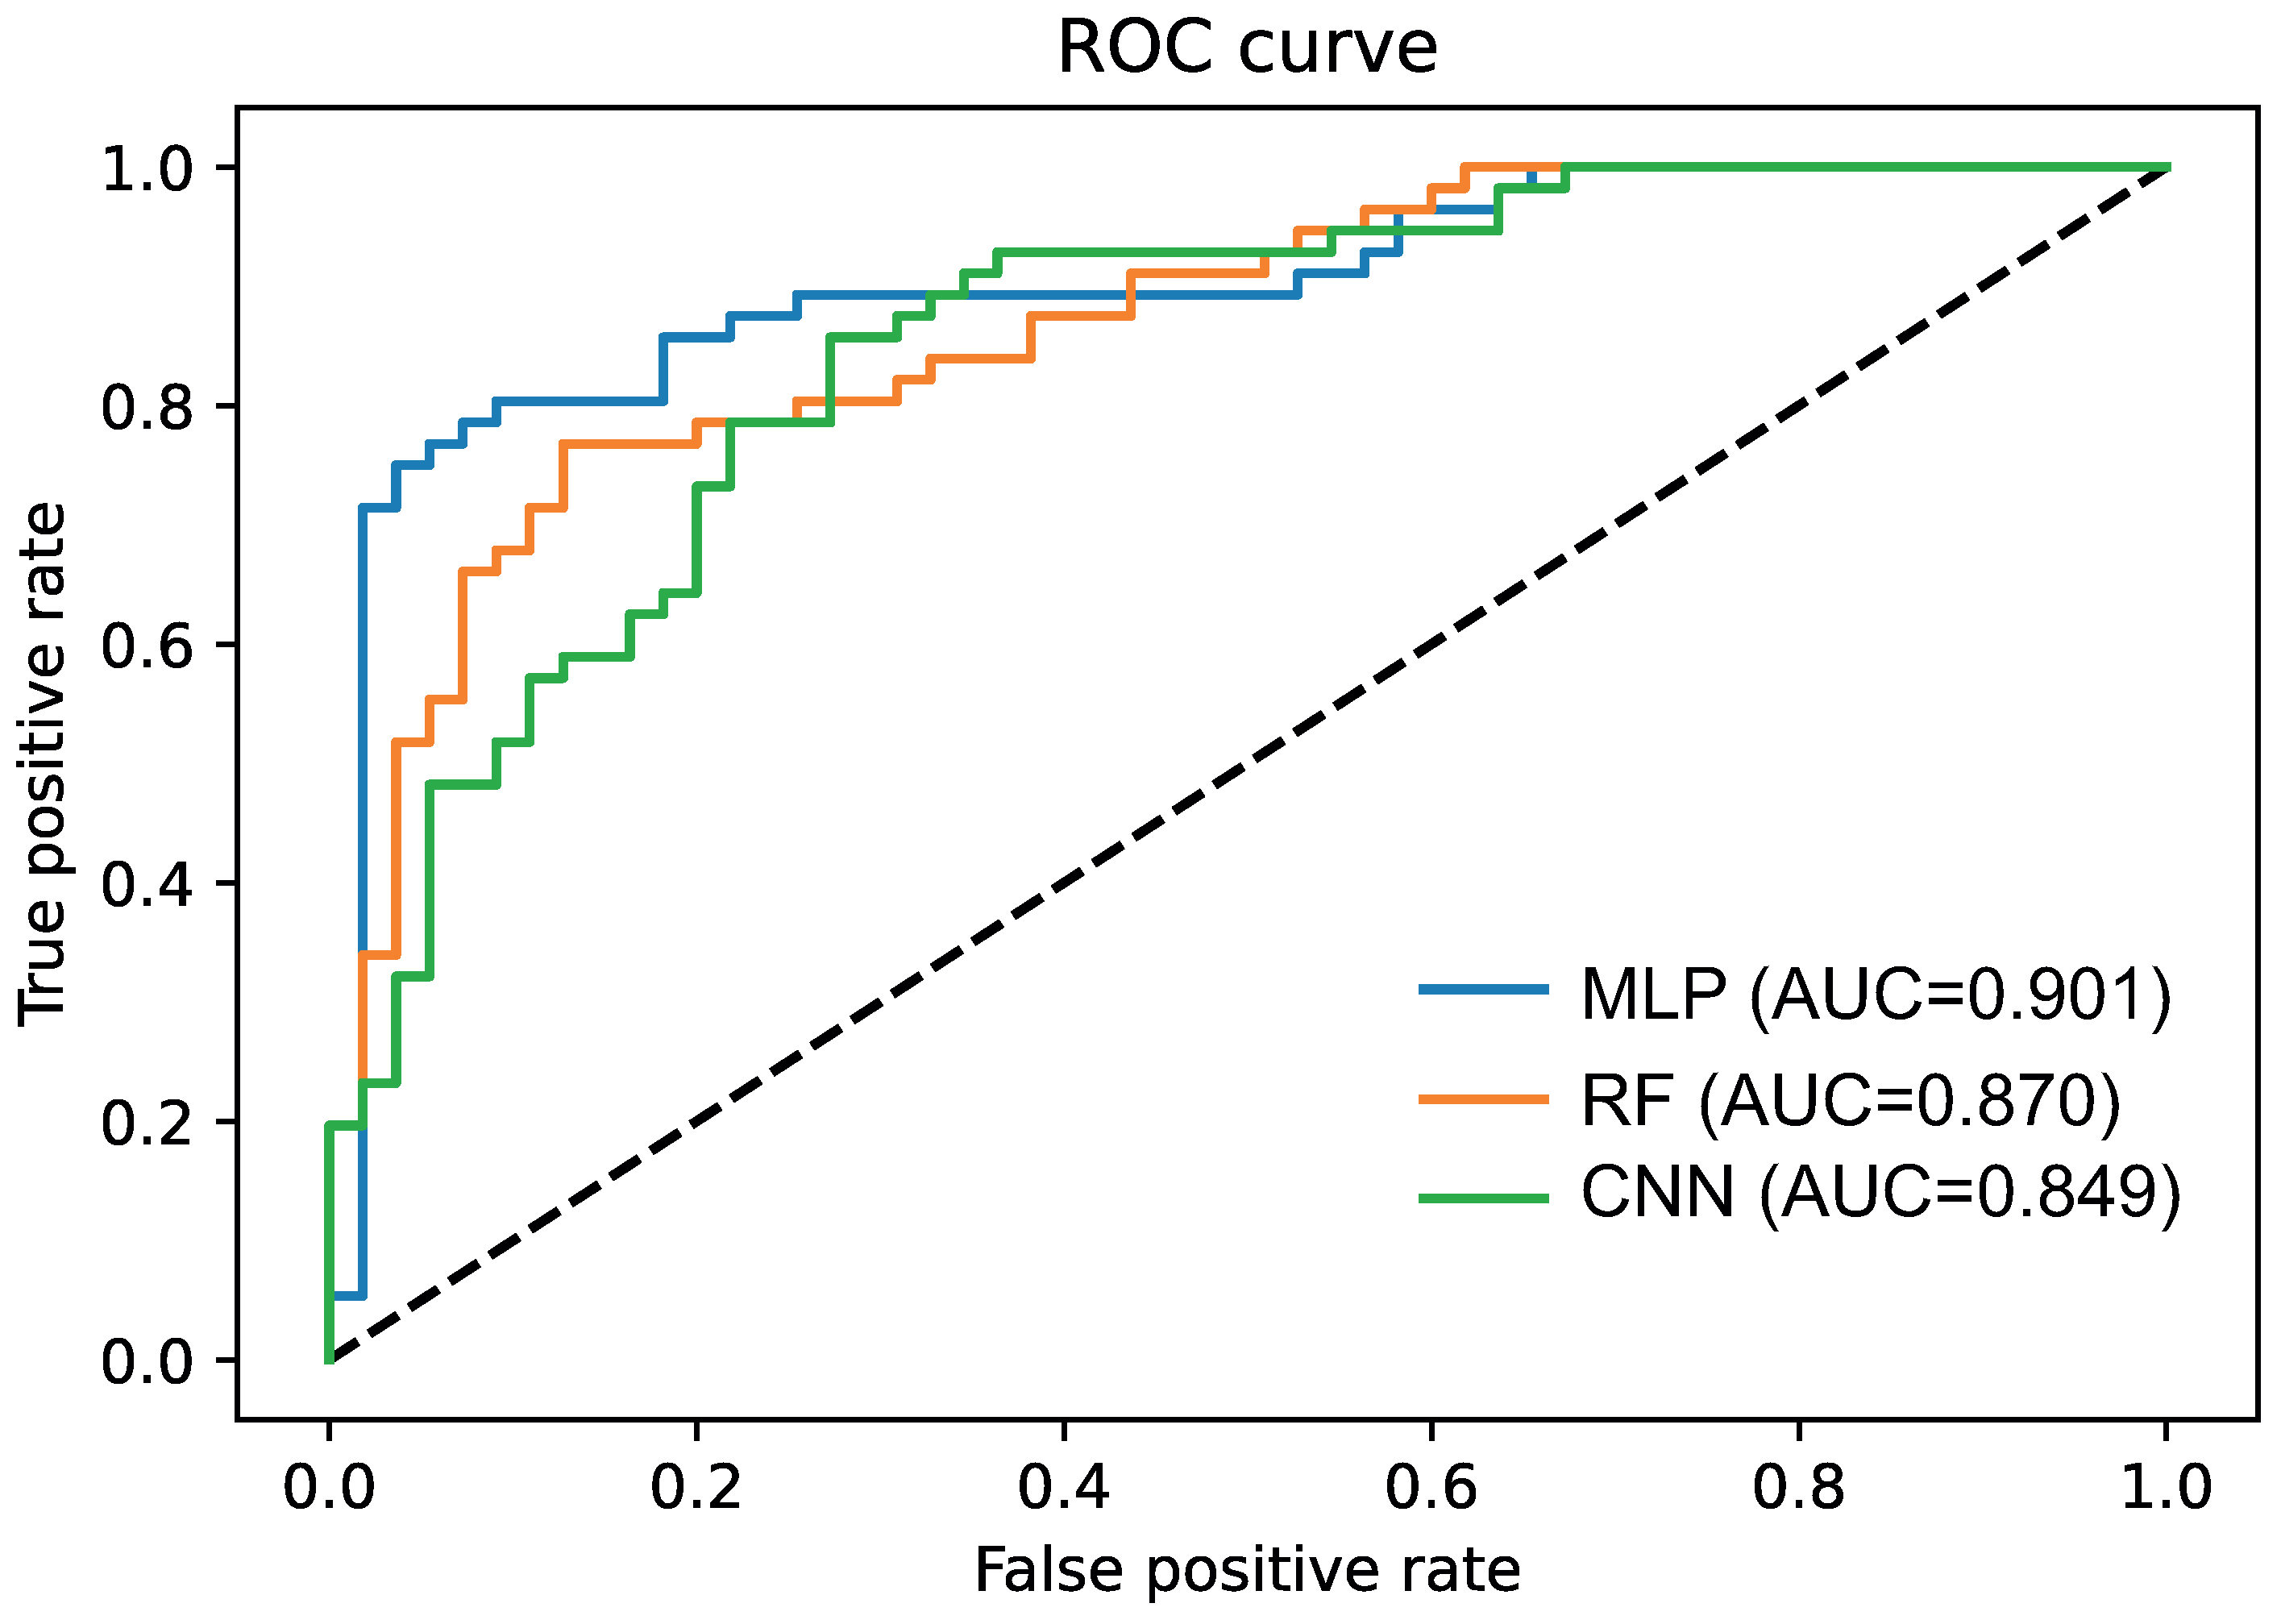
3.3. Deep Learning for the EDISON Classification
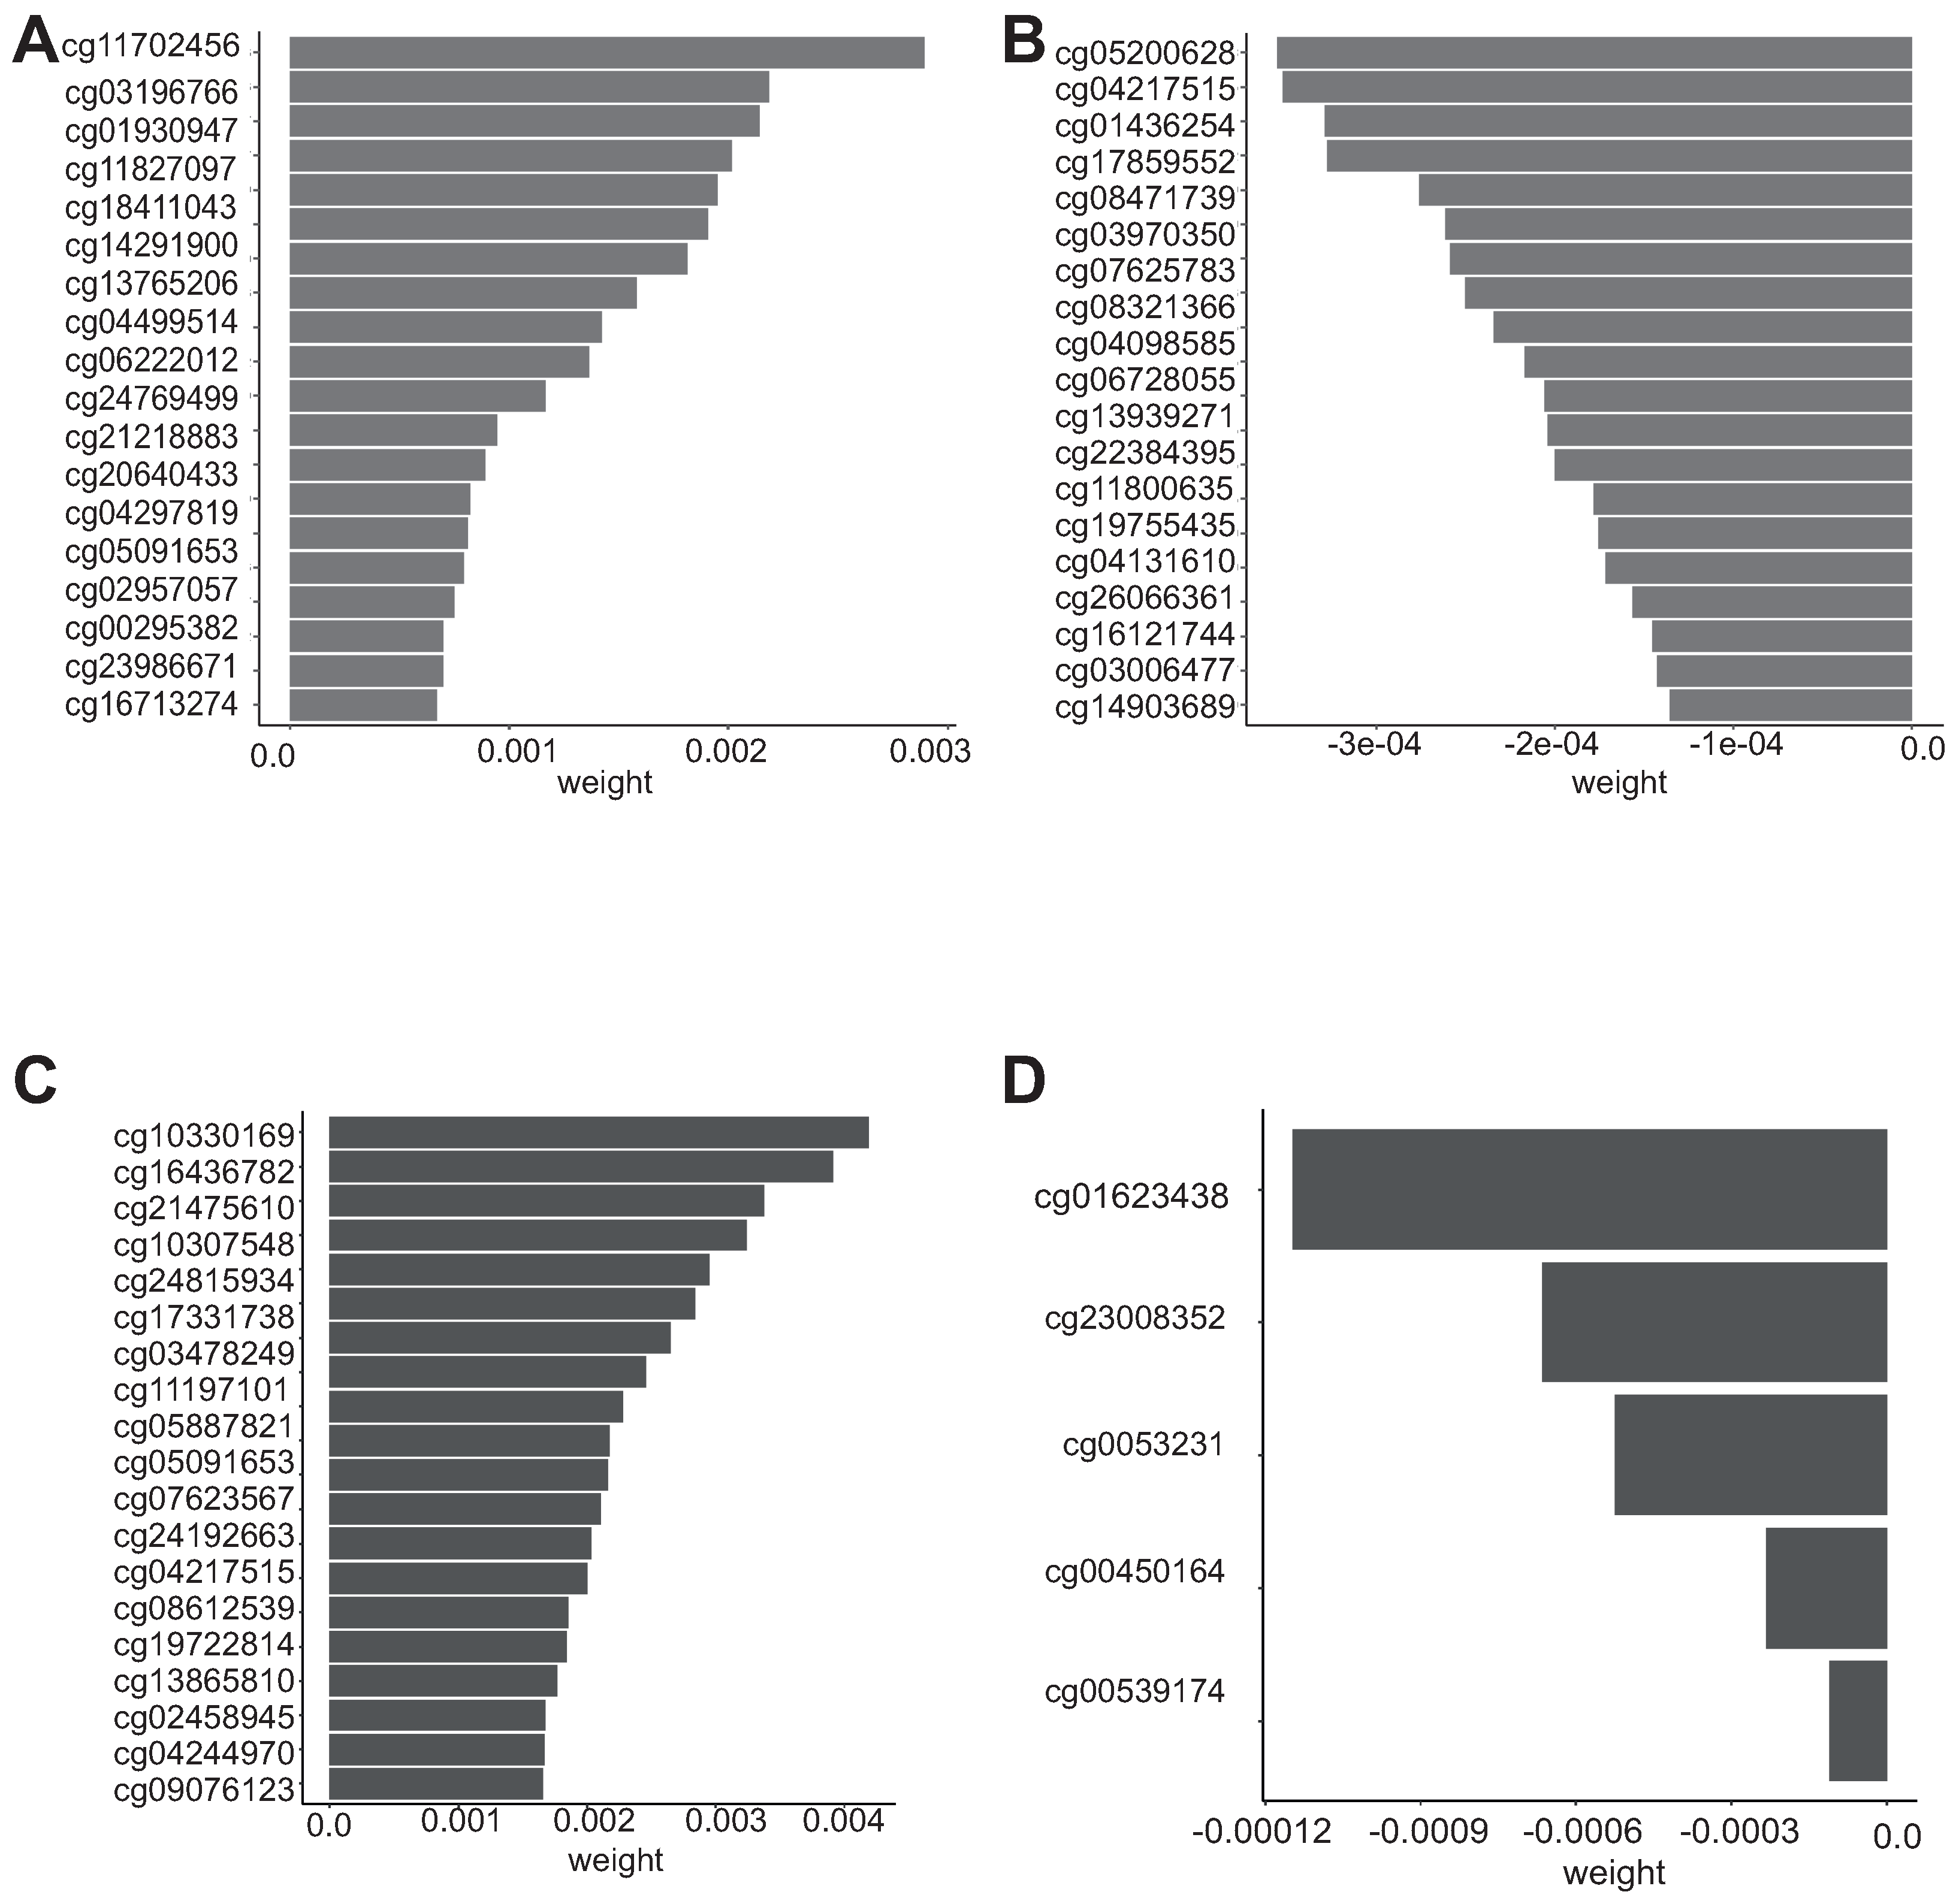
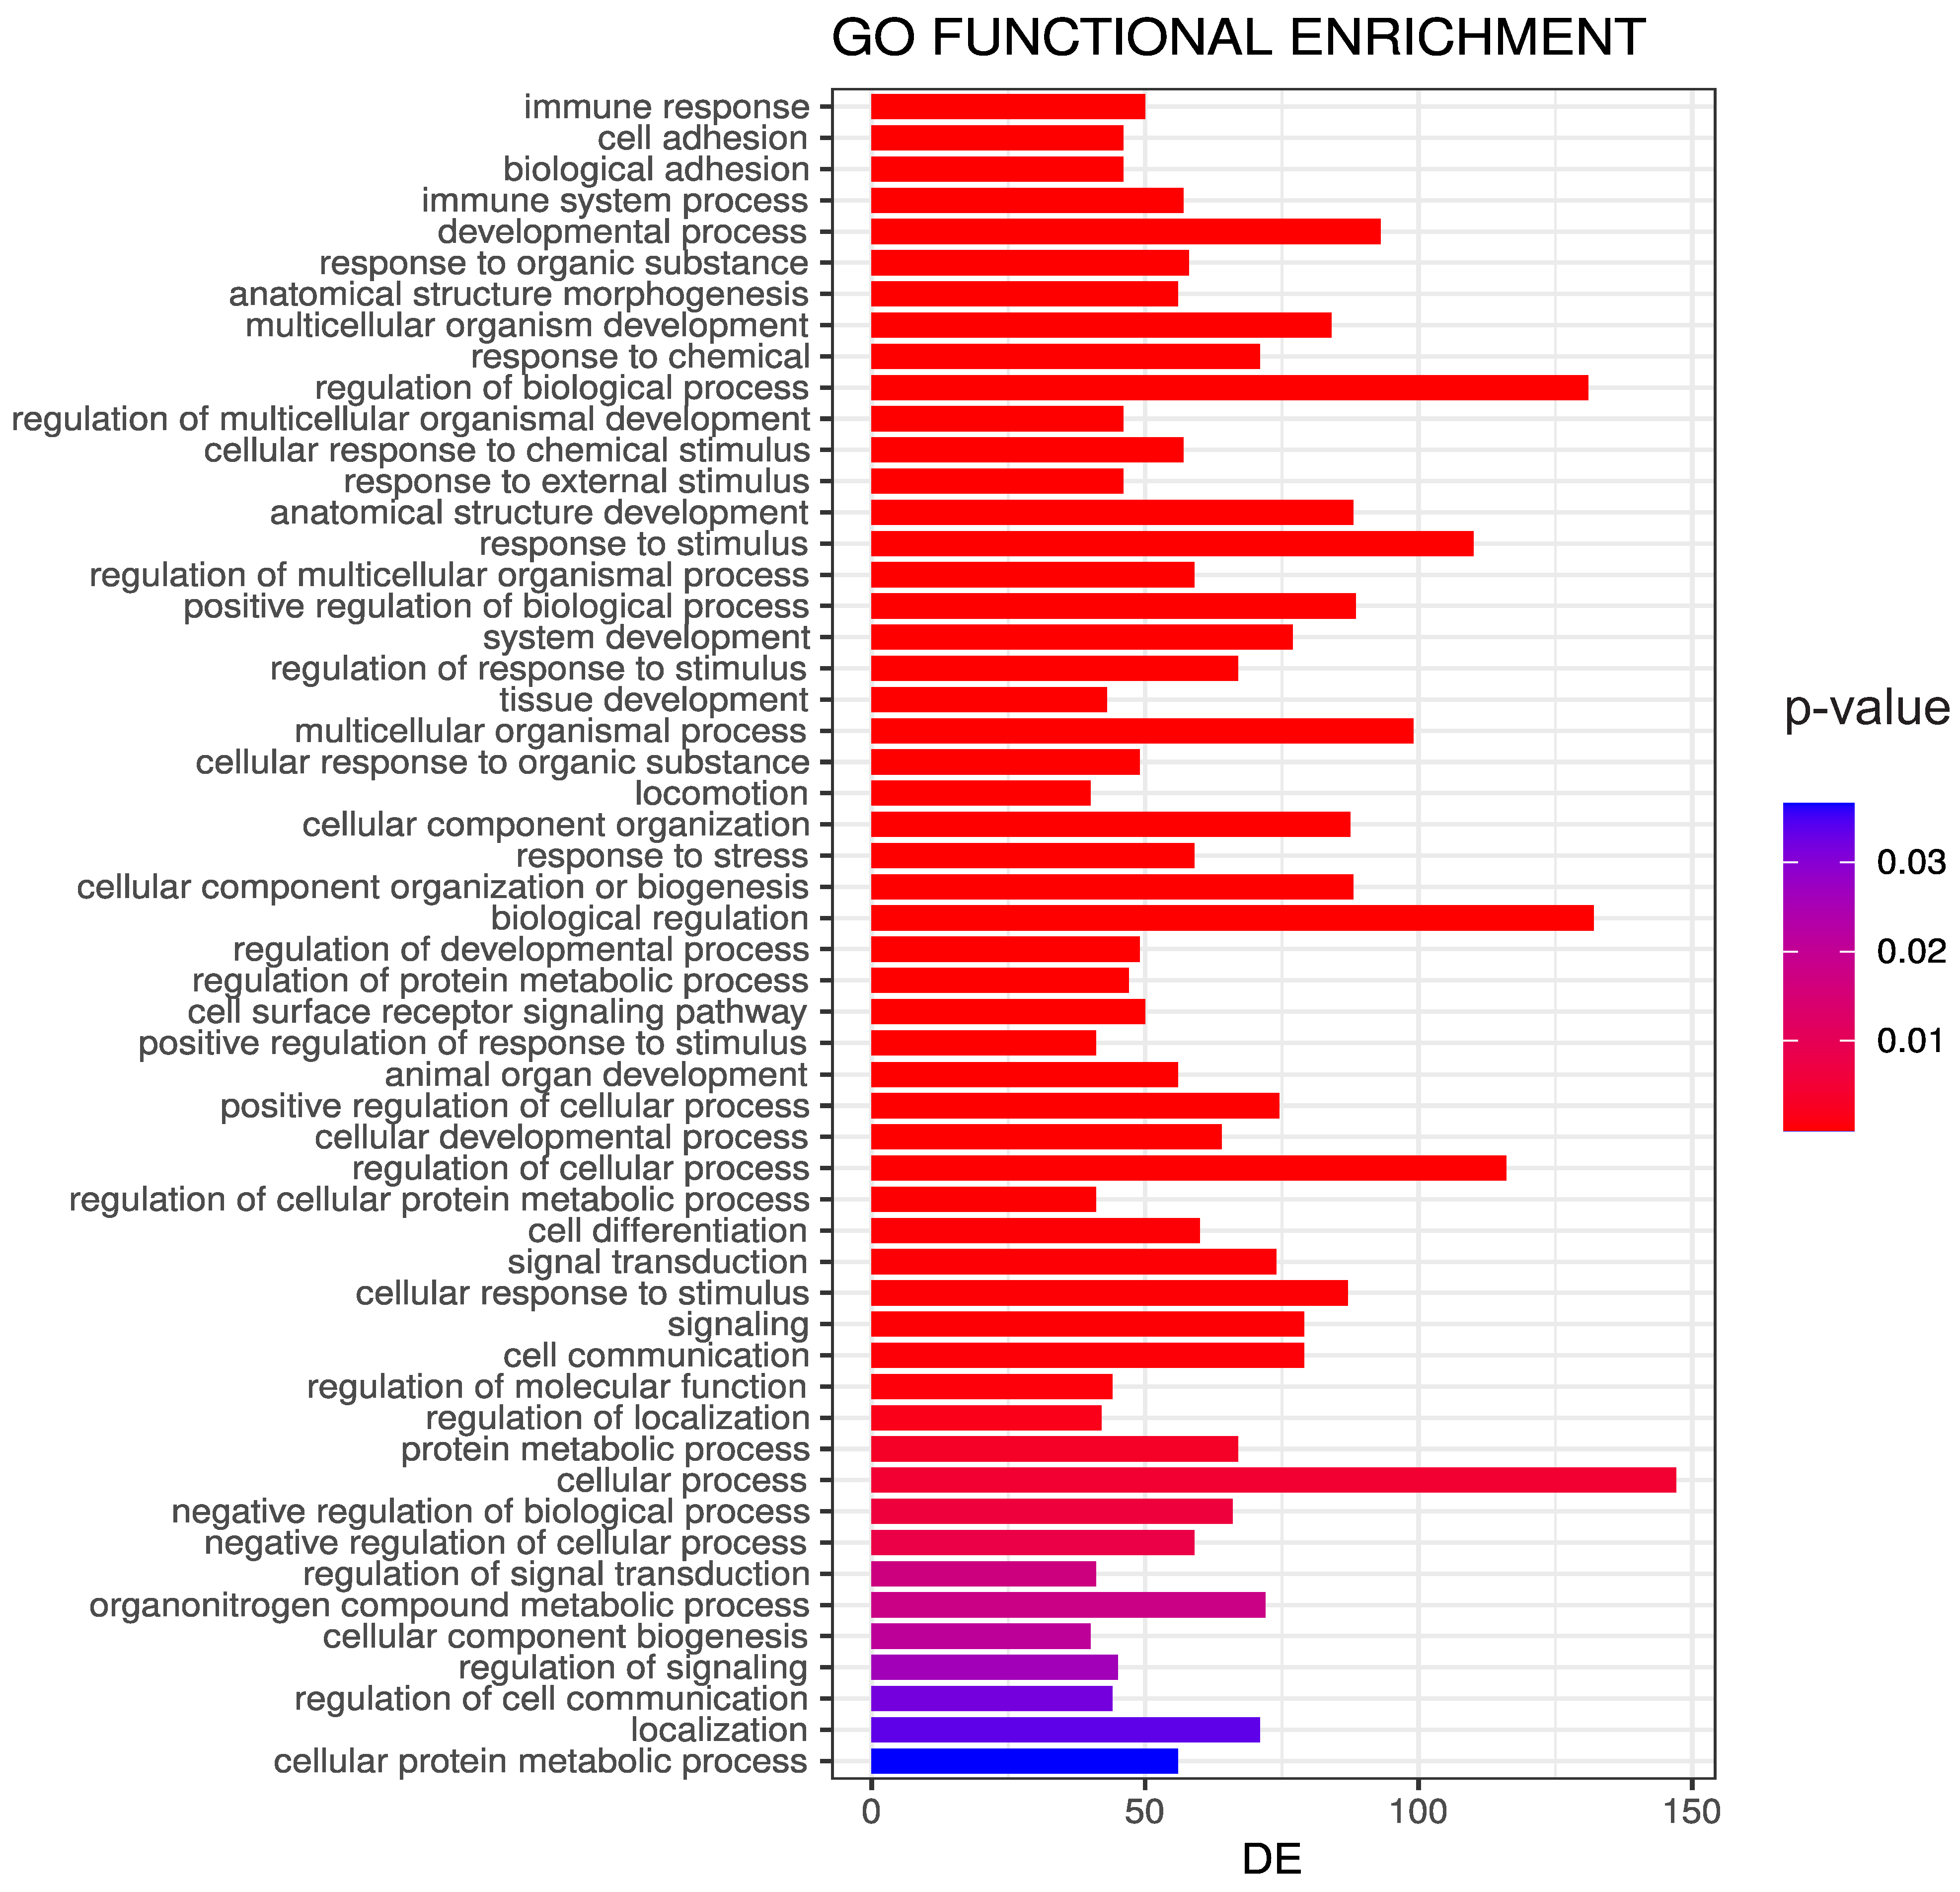
3.4. Biological Significance of the Selected CpG Probes
3.5. Evaluation of the Transferability of the CpG Methylation Signature in Liquid Biopsy Samples
4. Discussion
5. Conclusions
Author Contributions
Funding
Institutional Review Board Statement
Informed Consent Statement
Data Availability Statement
Acknowledgments
Conflicts of Interest
Abbreviations
| MDPI | Multidisciplinary Digital Publishing Institute |
| DOAJ | Directory of open access journals |
| TLA | Three-letter acronym |
| LD | Linear dichroism |
| TME | Tumor microenvironment |
| EDISON | Evade immunosuppresion |
| TCGA | The Cancer Genome Atlas |
| GBM | Glioblastoma |
| LGG | Low-grade glioma |
| CI | Confidence interval |
| MLP | Multi-layer percerptron |
| RF | Random Forest |
| CNN | Convolutional neural network |
| ECM | Extracellular matrix |
| ICIs | Immune checkpoint inhibitors |
| BECon | Blood–Brain Epigenetic Concordance |
| MCC | Matthew correlation coefficient |
| ACC | Accuracy |
| Tregs | T regulatory cells |
| MDSCs | Myeloid-derived suppressor cells |
| TAMs | Tumor-associated macrophages |
Appendix A


| Model | Regions | ACC (CI) | ACC Test | MCC (CI) | MCC Test |
|---|---|---|---|---|---|
| RF | IImmuneAngioICIsMesECM-ISLAND | 0.724 (0.688–0.769) | 0.747 | 0.460 (0.389–0.549) | 0.522 |
| RF | ImmuneAngioICIsMesECM-OPENSEA | 0.725 (0.689–0.762) | 0.691 | 0.456 (0.386–0.533) | 0.469 |
| RF | ImmuneAngioICIsMesECM-SHORE | 0.749 (0.705–0.790) | 0.774 | 0.501 (0.417–0.583) | 0.553 |
| RF | ImmuneAngioICIsMesECM-SHELF | 0.758 (0.722–0.789) | 0.747 | 0.529 (0.459–0.593) | 0.510 |
| RF | ImmuneAngioICIs-ISLAND | 0.756 (0.716–0.792) | 0.758 | 0.514 (0.439–0.587) | 0.518 |
| RF | ImmuneAngioICIs-SHORE | 0.753 (0.710–0.798) | 0.734 | 0.509 (0.422–0.598) | 0.536 |
| RF | ImmuneAngioICIs- OPENSEA | 0.729 (0.757–0.700) | 0.738 | 0.463 (0.406–0.520) | 0.490 |
| RF | ImmuneAngioICIs-SHELF | 0.725 (0.685–0.763) | 0.720 | 0.457 (0.373–0.537) | 0.543 |
| CpG | Gene |
|---|---|
| cg01681098 | SENCR, FLI1 |
| cg24457026 | GRN |
| cg13909178 | RP11-744N12.3 FLI1 |
| cg03531211 | XXbac-BPG181M17.5, HLA-DMA |
| cg04917472 | CTSZ |
| cg21012874 | MMRN2, SNCG |
| cg13662634 | RALGPS1, ANGPTL2 |
| cg17054708 | FBLN2 |
| cg10453850 | AL645941.1, HLA-DMB, XXbac-BPG181M17.5 |
| cg23008352 | COL4A1 |
| cg24421410 | XXbac-BPG181M17.5, HLA-DMA |
| cg07852825 | GHSR |
| cg04499514 | C3AR1 |
| cg16436782 | RP11-212E4.1, COL4A1 |
| cg03677069 | MMRN2, SNCG |
| cg00215182 | C1QB |
| cg13353679 | AFF3, AC092667.2 |
| cg14082886 | CD44 |
| cg09552892 | MMRN2, SNCG |
| cg04275881 | SLAMF8 |
| cg02072495 | ANXA2 |
| cg00338116 | EPSTI1 |
| cg10762214 | INPP5A |
| cg10070185 | SERPINA1 |
| cg13810673 | GPR65 |
| cg07857225 | PLXND1 |
| cg11037750 | TGFB1 |
| cg07450037 | HOTAIRM1, HOXA1, HOTAIRM1_1 |
| cg22568423 | MYO1F |
| cg01436254 | CD86 |
| cg17451419 | CYR61 |
| cg18273417 | S100A4 |
| cg18837947 | CCNG2 |
| cg27565899 | AMPD2 |
| cg07625783 | SLAMF8 |
| cg13371976 | PRELP |
| cg24815934 | ITGB2 |
| cg17599241 | VCAN-AS1, VCAN |
| cg10518264 | HLA-DMB, XXbac-BPG181M17.5 |
| cg11800635 | DOK1, LOXL3 |
| cg26357596 | GZMA |
| cg09456094 | SP100 |
| cg11827097 | SP100 |
| cg04131610 | CCR5, RP11-24F11.2 |
| cg00609834 | SPON1 |
| cg08076018 | RALGPS1, ANGPTL2 |
| cg06746774 | KIAA1522 |
| cg13700051 | TTC33 |
| cg17928895 | CTSZ |
| cg15550100 | ATG4B |
| cg07251141 | ADAM12 |
| cg26969179 | ADAM12 |
| cg18245281 | CTSZ |
| cg00539174 | CTSZ |
| cg17571335 | FLI1 |
| cg25428929 | ATG4B |
| cg01536987 | EPSTI1 |
| cg20694619 | TRAF3IP3 |
| cg03970350 | PES1, TCN2 |
| cg13765206 | EMILIN2 |
| cg04217515 | ITGB2 |
| cg14994258 | PXDN |
| cg11029367 | HEG1 |
| cg00765737 | COL4A2 |
| cg07464217 | CTSZ |
| cg03075156 | PRKCE |
| cg08655071 | TRAF3IP3 |
| cg00295382 | MYCL |
| cg14903689 | COL18A1 |
| cg19408145 | CD48 |
| cg17420036 | HSPG2 |
| cg18274749 | HSPG2 |
| cg07436701 | MMRN2, SNCG |
| cg02744249 | CTSZ |
| cg22116670 | CTB-113P19.1, SPARC |
| cg24192663 | HSPA6, RP11-25K21.6, FCGR2A |
| cg13785221 | ANXA2 |
| cg17801352 | PXDN |
| cg05887821 | INPP5A |
| cg18411043 | LAPTM5 |
| cg03478249 | EPSTI1 |
| cg21936552 | BAHCC1 |
| cg05200628 | CD48 |
| cg01930947 | C1orf111, RP11-565P22.6, C1orf226 |
| cg10330169 | DIS3L2 |
| cg10587741 | LGALS1 |
| cg24539923 | SERPINE1 |
| cg10768321 | CTC-301O7.4, CD37 |
| cg09538921 | IL27RA, CTB-55O6.4 |
| cg18968623 | INPP5A |
| cg08064683 | FAT1 |
| cg06330722 | PCOLCE, PCOLCE-AS1 |
| cg10307548 | SOD3 |
| cg09707038 | CALM2, RP11-761B3.1 |
| cg16024530 | FLI1 |
| cg13790288 | CD28 |
| cg08139855 | CSF1 |
| cg19919590 | LAPTM5 |
| cg20600379 | HLA-DMB, XXbac-BPG181M17.5 |
| cg24375627 | S100A6 |
| cg12339920 | TGFBI |
| cg27617132 | INPP5A |
| cg03682712 | LOXL1, LOXL1-AS1 |
| cg21746573 | PRKCE |
| cg19506628 | CEP72 |
| cg17319576 | CYR61 |
| cg17911539 | C3orf22, CHST13 |
| cg04232128 | TMEM173 |
| cg05360958 | C12orf60, MGP |
| cg04755674 | IL27RA, CTB-55O6.4 |
| cg03013554 | ITGB2 |
| cg04297819 | HSPG2 |
| cg00799121 | ADAMTS2 |
| cg08321366 | MMP14 |
| cg19722814 | SERPINE1 |
| cg14943796 | BAHCC1 |
| cg04771838 | COL4A2 |
| cg11581627 | CD33 |
| cg14991595 | MB21D2 |
| cg15347156 | MMRN2 |
| cg04153551 | FBLN5 |
| cg06222012 | AC078941.1, AC023115.2 |
| cg04244970 | SLAMF7 |
| cg22704788 | PRELP |
| cg21043746 | ADAMTS2 |
| cg26532826 | PES1, TCN2 |
| cg13962321 | HIST2H2BB, RP5-998N21.7, RP5-998N21.10 |
| cg11702456 | SP100 |
| cg09076123 | NCF2, SMG7 |
| cg08825225 | FLI1 |
| cg17713010 | LAIR1 |
| cg15522984 | LAMC1 |
| cg08682341 | INPP5A |
| cg03813885 | CFAP97, SNX25 |
| cg10845380 | SLC7A7 |
| cg12613839 | ADAMTS2 |
| cg02588309 | TTC33 |
| cg02189760 | CTC-301O7.4, CD37 |
| cg16925003 | PXDN |
| cg07947930 | PRELP |
| cg06410158 | INPP5A |
| cg24644113 | TADA1 |
| cg27547543 | POU5F1 |
| cg21860679 | DUSP6, RP11-823E8.3 |
| cg27329371 | ALDH3A1 |
| cg00771084 | ATG4B |
| cg11594010 | INPP5A |
| cg11301254 | TTC33 |
| cg09926389 | TGFB1 |
| cg03982087 | RAB31 |
| cg02286081 | HLA-DPA1, HLA-DPB1 |
| cg26025068 | PPP1R8 |
| cg00078334 | MMP2 |
| cg23638686 | INPP5A |
| cg19755435 | GPR65 |
| cg08530414 | RP4-607I7.1, CD44 |
| cg15999547 | TMEM54, HPCA |
| cg26214645 | SECTM1 |
| cg25206536 | MIR572 |
| cg20502977 | COL6A3 |
| cg23659056 | FOXD2, FOXD2-AS1 |
| cg23986671 | ADAMTS5 |
| cg26138144 | LGALS1 |
| cg07855465 | BAHCC1 |
| cg03196766 | THBS1 |
| cg17859552 | INPP5A |
| cg18900669 | RP11-186B7.4, CD68 |
| cg19915711 | EPSTI1 |
| cg10974980 | LOXL1 |
| cg08612539 | CTA-833B7.2, NCF4 |
| cg18397405 | GPC6 |
| cg00450164 | TRAF3IP3 |
| cg26650846 | ADAMTS2 |
| cg04098585 | CD28 |
| cg16826739 | INPP5A |
| cg24767336 | TGFB1, CTC-435M10.3, TMEM91 |
| cg03006477 | CD109 |
| cg16713274 | COL18A1, LL21NC02-21A1.1 |
| cg25450450 | CTB-118N6.2, SEMA6A |
| cg09277376 | FOXD2-AS1 |
| cg03440588 | FOXD2, FOXD2-AS1 |
| cg24129356 | XXbac-BPG181M17.5, HLA-DMA |
| cg16121744 | COL18A1 |
| cg14139008 | DNM1 |
| cg24226528 | TMEM37 |
| cg11875119 | PES1, TCN2 |
| cg01508380 | MMP14 |
| cg09280946 | CTSC |
| cg02543462 | IL1RN |
| cg00142150 | LGALS1 |
| cg21005525 | ARF1 |
| cg07697770 | TGFBI |
| cg03930369 | COL4A2 |
| cg06671298 | BAHCC1 |
| cg15254671 | MYO1F |
| cg00292662 | LGALS1 |
| cg21236655 | TNC |
| cg07724259 | EMILIN2 |
| cg23865240 | HOTAIRM1, HOXA1 |
| cg09321817 | HLA-DPA1 |
| cg18595867 | FOXD2-AS1 |
| cg22158252 | BMP8A |
| cg27438456 | INPP5A |
| cg07085815 | SERPINE2 |
| cg18644834 | ANKRA2, UTP15 |
| cg24287218 | HLA-DPA1 |
| cg24707889 | ITGB2, ITGB2-AS1 |
| cg09269866 | FOXD2, FOXD2-AS1 |
| cg03753191 | EPSTI1 |
| cg22716262 | MPP7 |
| cg22595235 | SUMF1, LRRN1 |
| cg19575208 | HLA-DRB1 |
| cg06507307 | INPP5A |
| cg13939271 | DNM1 |
| cg23225572 | RP11-565P22.6, NOS1AP, C1orf226 |
| cg11197101 | KIAA1522 |
| cg21869219 | ARHGAP31 |
| cg10954654 | CTSS |
| cg20481110 | SECTM1 |
| cg11804789 | CST7 |
| cg25214684 | AKIRIN1 |
| cg15114672 | VCAN |
| cg00516966 | ALDH3A1 |
| cg14791054 | RP11-66B24.4, ALDH1A3 |
| cg00816609 | FBLN2 |
| cg03055440 | MS4A6A |
| cg21218883 | PRKCE |
| cg02458945 | MMP2 |
| cg22118297 | ADAMTS9, ADAMTS9-AS1 |
| cg20640433 | LAMA2 |
| cg12689670 | LAMC1 |
| cg03573861 | BAHCC1 |
| cg07438421 | SERPINF1 |
| cg05822532 | ELN |
| cg15849060 | ALDH3A1 |
| cg02784696 | C2orf44, MFSD2B |
| cg26399819 | MIER3 |
| cg18832223 | CEP72 |
| cg09777237 | ELN |
| cg15504747 | PLXND1 |
| cg01338658 | LAMC1 |
| cg00894134 | DNM1 |
| cg25306579 | INPP5A |
| cg00532319 | RPN1 |
| cg07906179 | BAHCC1 |
| cg24493834 | LAMA2, MESTP1 |
| cg22136020 | CSPG4 |
| cg01320433 | XXyac-YX65C7_A.2, THBS2 |
| cg10989879 | CFAP97, SNX25 |
| cg15459165 | LAPTM5 |
| cg01623438 | CTSZ |
| cg12253414 | ITGB5 |
| cg00777079 | SERPINF1 |
| cg08638320 | FOXD2, FOXD2-AS1 |
| cg05831823 | CR2 |
| cg12630520 | SPARCL1 |
| cg23446438 | MYO1F |
| cg06728055 | WWTR1 |
| cg05492532 | INPP5A |
| cg09545579 | BAHCC1 |
| cg26204079 | RP11-400N9.1, DGKD |
| cg14291900 | SLC7A7 |
| cg21475610 | CCNG2 |
| cg07575373 | CTC-301O7.4, CD37 |
| cg05658236 | FOXD2-AS1 |
| cg15046675 | CTC-301O7.4, CD37 |
| cg22216491 | CASP6 |
| cg05091653 | SP100 |
| cg11076970 | HLA-DOA |
| cg26262232 | XXbac-BPG181M17.5, HLA-DMA |
| cg25645491 | HLA-DRA |
| cg23173573 | DUSP10 |
| cg14880894 | CNOT6L |
| cg02316283 | MMP14 |
| cg05041061 | BAHCC1 |
| cg12937501 | AC106875.1, LPIN1 |
| cg26034531 | LPPR5, RP5-896L10.1 |
| cg06390079 | ALDH3A1 |
| cg01120369 | PLXND1 |
| cg18764513 | SLC7A7 |
| cg05830842 | COL14A1 |
| cg11728145 | PXDN |
| cg07659054 | HOTAIRM1, HOXA1 |
| cg13802966 | CASP1 |
| cg13865810 | COL15A1, RP11-92C4.6 |
| cg07623567 | HLA-DMB, XXbac-BPG181M17.5 |
| cg11912272 | SPATS2L |
| cg17016011 | INPP5A |
| cg00416645 | AC007563.5, IGFBP5 |
| cg01997629 | TRAF3IP3 |
| cg10928302 | RBM6, RBM5 |
| cg02957057 | NID1 |
| cg17081489 | RP4-798P15.3, SEC16B |
| cg10001720 | LAPTM5 |
| cg20407868 | INPP5A |
| cg24769499 | TMEM37 |
| cg26350754 | HLA-DPA1, HLA-DPB1 |
| cg10949632 | GPC6 |
| cg22905097 | EPSTI1 |
| cg26066361 | CLEC7A |
| cg09099927 | RP11-333E13.4 |
| cg17611512 | COL18A1, COL18A1-AS1 |
| cg13477614 | BAHCC1 |
| cg25913233 | CTB-113P19.1, SPARC |
| cg07616471 | CCR5, RP11-24F11.2 |
| cg04654716 | CTD-2377O17.1, FAM169A |
| cg08471739 | PLXND1 |
| cg27297192 | INPP5A |
| cg04851268 | GHSR |
| cg24931346 | C1QB |
| cg21784272 | FAT1 |
| cg22987448 | MYO1F |
| cg22164238 | AMPD2, GNAT2 |
| cg08288016 | FAT1 |
| cg21398469 | CCNG2 |
| cg22384395 | RP11-66B24.9, ALDH1A3 |
| cg05710142 | KIAA1522 |
| cg21904489 | ARHGAP31 |
| cg01975495 | SERPINE1 |
| cg12917072 | ADAMTS12 |
| cg03393607 | AFF3, AC092667.2 |
| cg01821226 | PXDN |
| cg05955301 | PRELP |
| cg27470554 | FCGR2A |
| cg06238491 | LAIR1 |
| cg22695532 | RP11-475O6.1 |
| cg00742851 | SUMF1, LRRN1 |
| cg27553626 | PPP1R8 |
| cg25394505 | INPP5A |
| cg08735211 | XXbacBPG181M17.5, HLA-DMA |
| cg09983885 | TRIM21 |
| cg26514080 | KIAA1522 |
| cg05886789 | PLXDC2 |
| cg05826823 | CIZ1, DNM1 |
| cg20367923 | XXyac-YX65C7_A.2, THBS2 |
| cg24023498 | NR4A2 |
| cg16239257 | LTBP2 |
| cg17331738 | NES |
| Feature | Weight | std | Gene | Direction |
|---|---|---|---|---|
| cg02458945 | 0.00167149 | 0.0004095 | MMP2 | Positive |
| cg03478249 | 0.00245778 | 0.00088256 | EPSTI1 | Positive |
| cg04131610 | 0.00323843 | 0.00146985 | CCR5, RP11-24F11.2 | Positive |
| cg04217515 | 0.00200311 | 0.00073152 | ITGB2 | Positive |
| cg04244970 | 0.00166519 | 0.00067762 | SLAMF7 | Positive |
| cg05091653 | 0.00216262 | 0.00032063 | SP100 | Positive |
| cg05887821 | 0.00216972 | 0.00032553 | INPP5A | Positive |
| cg07623567 | 0.00210498 | 0.00037064 | HLA-DMB, XXbac-BPG181M17.5 | Positive |
| cg08612539 | 0.00185325 | 0.00028535 | CTA-833B7.2, NCF4 | Positive |
| cg09076123 | 0.00165326 | 0.0007419 | NCF2, SMG7 | Positive |
| cg10307548 | 0.00294971 | 0.00098171 | SOD3 | Positive |
| cg10330169 | 0.00418932 | 0.00097532 | DIS3L2 | Positive |
| cg11197101 | 0.00227763 | 0.00036055 | KIAA1522 | Positive |
| cg13865810 | 0.00176505 | 0.00045972 | COL15A1, RP11-92C4.6 | Positive |
| cg16436782 | 0.00390891 | 0.00123599 | RP11-212E4.1, COL4A1 | Positive |
| cg17331738 | 0.00264999 | 0.00031466 | NES | Positive |
| cg19722814 | 0.00184012 | 0.00034522 | SERPINE1 | Positive |
| cg21475610 | 0.00337569 | 0.00100237 | CCNG2 | Positive |
| cg24192663 | 0.00203206 | 0.00052522 | HSPA6, RP11-25K21.6, FCGR2A | Positive |
| cg24815934 | 0.00283711 | 0.00098436 | ITGB2 | Positive |
| cg00450164 | −2.33 | 0.00011302 | TRAF3IP3 | Negative |
| cg00532319 | −5.25 | 9.97 | RPN1 | Negative |
| cg00539174 | −1.10 | 0.0001254 | CTSZ | Negative |
| cg01623438 | −0.0001147 | 0.00016634 | CTSZ | Negative |
| cg23008352 | −6.65 | 0.00011621 | COL4A1 | Negative |
| Feature | Weight | std | Gene | Direction |
|---|---|---|---|---|
| cg01436254 | −0.0003291 | 0.00023658 | CD86 | Negative |
| cg03006477 | −0.000143 | 0.00015906 | CD109 | Negative |
| cg03970350 | −0.0002618 | 0.0001385 | PES1, TCN2 | Negative |
| cg04098585 | −0.0002341 | 8.09 | CD28 | Negative |
| cg04131610 | −0.0001756 | 0.00013193 | CCR5, RP11-24F11.2 | Negative |
| cg04217515 | −0.0003524 | 0.00027475 | ITGB2 | Negative |
| cg05200628 | −0.0003555 | 0.00013671 | CD48 | Negative |
| cg06728055 | −0.0002169 | 0.00021168 | WWTR1 | Negative |
| cg07625783 | −0.0002587 | 8.14 | SLAMF8 | Negative |
| cg08321366 | −0.0002504 | 0.0001037 | MMP14 | Negative |
| cg08471739 | −0.0002763 | 0.00018392 | PLXND1 | Negative |
| cg11800635 | −0.0001998 | 0.00016978 | DOK1, LOXL3 | Negative |
| cg13939271 | −0.0002059 | 0.00018542 | DNM1 | Negative |
| cg14903689 | −0.0001355 | 0.00015751 | COL18A1 | Negative |
| cg16121744 | −0.0001452 | 0.00012391 | COL18A1 | Negative |
| cg17859552 | −0.0003278 | 0.00012804 | INPP5A | Negative |
| cg19755435 | −0.0001786 | 0.00014323 | GPR65 | Negative |
| cg22384395 | −0.0002037 | 0.00018963 | RP11-66B24.9, ALDH1A3 | Negative |
| cg24421410 | −0.0001716 | 6.39 | XXbac-BPG181M17.5, HLA-DMA | Negative |
| cg26066361 | −0.0001566 | 0.00031627 | CLEC7A | Negative |
| cg00295382 | 0.00069785 | 0.00031361 | MYCL | Positive |
| cg00777079 | 0.00194878 | 0.00093506 | SERPINF1 | Positive |
| cg01930947 | 0.00214195 | 0.00092059 | C1orf111, RP11-565P22.6, C1orf226 | Positive |
| cg02957057 | 0.00074669 | 0.00018464 | NID1 | Positive |
| cg03196766 | 0.00218507 | 0.00059328 | THBS1 | Positive |
| cg04297819 | 0.00081885 | 0.00047748 | HSPG2 | Positive |
| cg04499514 | 0.00142254 | 0.00078907 | C3AR1 | Positive |
| cg05091653 | 0.00080697 | 0.00048847 | SP100 | Positive |
| cg06222012 | 0.00135962 | 0.00059195 | AC078941.1, AC023115.2 | Positive |
| cg11702456 | 0.0028937 | 0.00103411 | SP100 | Positive |
| cg11827097 | 0.00201346 | 0.00095397 | SP100 | Positive |
| cg13765206 | 0.00158138 | 0.00079435 | EMILIN2 | Positive |
| cg14082886 | 0.00079245 | 0.00050107 | CD44 | Positive |
| cg14291900 | 0.00181238 | 0.00080766 | SLC7A7 | Positive |
| cg16713274 | 0.00066793 | 0.00025659 | COL18A1, LL21NC02-21A1.1 | Positive |
| cg18411043 | 0.0019083 | 0.00079707 | LAPTM5 | Positive |
| cg20640433 | 0.00088705 | 0.00032218 | LAMA2 | Positive |
| cg21218883 | 0.00094513 | 0.00049267 | PRKCE | Positive |
| cg23986671 | 0.00069697 | 0.00025722 | ADAMTS5 | Positive |
| cg24769499 | 0.00116293 | 0.00021175 | TMEM37 | Positive |
| Source | Term_NAME | Term_id | Adjusted_p_Value | Negative_log10_of _Adjusted_p_Value | Direction Coefficient |
|---|---|---|---|---|---|
| GO:MF | glycosaminoglycan binding | GO:0005539 | 0.008788287085578 | 2.05609576449095 | Negative |
| GO:CC | collagen-containing extracellular matrix | GO:0062023 | 0.048474322092945 | 1.31448825575832 | Negative |
| KEGG | ECM-receptor interaction | KEGG:04512 | 0.037233188408127 | 1.42906977203396 | Negative |
| CORUM | CD44-LRP1 complex | CORUM:7535 | 0.049698019554143 | 1.30366091738024 | Negative |
| GO:MF | growth hormone secretagogue receptor activity | GO:0001616 | 0.049775611543161 | 1.3029833955258 | Positive |
| GO:BP | regulation of neurotransmitter receptor localization to postsynaptic specialization membrane | GO:0098696 | 0.000167004924934 | 3.77727072142761 | Positive |
| GO:BP | regulation of receptor localization to synapse | GO:1902683 | 0.001168645063196 | 2.93231737121765 | Positive |
| GO:BP | protein localization to postsynaptic specialization membrane | GO:0099633 | 0.001335544908879 | 2.8743415038609 | Positive |
| GO:BP | neurotransmitter receptor localization to postsynaptic specialization membrane | GO:0099645 | 0.001335544908879 | 2.8743415038609 | Positive |
| GO:BP | regulation of protein localization to synapse | GO:1902473 | 0.003070843427737 | 2.51274232624767 | Positive |
| GO:BP | protein localization to postsynaptic membrane | GO:1903539 | 0.007006418620425 | 2.15450391795907 | Positive |
| GO:BP | protein localization to postsynapse | GO:0062237 | 0.009117775996435 | 2.04011108165666 | Positive |
| GO:BP | response to dexamethasone | GO:0071548 | 0.009117775996435 | 2.04011108165666 | Positive |
| GO:BP | regulation of postsynaptic membrane neurotransmitter receptor levels | GO:0099072 | 0.013616524667261 | 1.86593372285098 | Positive |
| GO:BP | receptor localization to synapse | GO:0097120 | 0.013616524667261 | 1.86593372285098 | Positive |
| GO:BP | protein localization to synapse | GO:0035418 | 0.033345288657273 | 1.47696551870962 | Positive |


| CpG | COEFFICIENT | GENE | INTERVAL |
|---|---|---|---|
| cg01320433 | −0.1592041 | XXyac-YX65C7_A.2, THBS2 | PFS |
| cg01508380 | −0.33756425 | MMP14 | PFS |
| cg06222012 | −0.5359208 | AC078941.1, AC023115.2 | PFS |
| cg06728055 | −0.07162224 | WWTR1 | PFS |
| cg11029367 | −0.30043008 | HEG1 | PFS |
| cg13371976 | −1.39825624 | PRELP | PFS |
| cg22716262 | −0.04181589 | MPP7 | PFS |
| cg26066361 | −0.17464321 | CLEC7A | PFS |
| cg01320433 | −0.37578276 | XXyac-YX65C7_A.2, THBS2 | OS |
| cg02744249 | −0.5024627 | CTSZ | OS |
| cg04244970 | −0.11253157 | SLAMF7 | OS |
| cg04851268 | 0.96144542 | GHSR | OS |
| cg06222012 | −1.06780331 | AC078941.1, AC023115.2 | OS |
| cg07438421 | 0.31295409 | SERPINF1 | OS |
| cg08612539 | −0.90719367 | CTA-833B7.2, NCF4 | OS |
| cg08655071 | −0.10973404 | TRAF3IP3 | OS |
| cg10949632 | 0.5123932 | GPC6 | OS |
| cg13371976 | −1.01620416 | PRELP | OS |
| cg14082886 | −1.13578356 | CD44 | OS |
| cg14943796 | 0.65287911 | BAHCC1 | OS |
| cg18595867 | 0.93613126 | FOXD2-AS1 | OS |
| cg20367923 | −0.03248293 | XXyac-YX65C7_A.2, THBS2 | OS |
| cg22116670 | −0.75216037 | CTB-113P19.1, SPARC | OS |
| cg22695532 | −0.67502749 | RP11-475O6.1 | OS |
| cg26066361 | −1.14858784 | CLEC7A | OS |
| cg26350754 | 0.88852671 | HLA-DPA1, HLA-DPB1 | OS |
| CpG | geneCpG | Gene | rho | p Value | Correlation Strength |
|---|---|---|---|---|---|
| cg13353679 | AFF3, AC092667.2 | HAVCR2 | 0.67520241 | 2.65 | high |
| cg13353679 | AFF3, AC092667.2 | CCR4 | 0.62698564 | 3.13 | high |
| cg13353679 | AFF3, AC092667.2 | TGFB1 | 0.72533605 | 1.19 | high |
| cg13353679 | AFF3, AC092667.2 | IL10 | 0.75708106 | 1.14 | high |
| cg22568423 | MYO1F | HAVCR2 | 0.6391164 | 1.75 | high |
| cg22568423 | MYO1F | TGFB1 | 0.61936567 | 4.45 | high |
| cg22568423 | MYO1F | IL10 | 0.65815888 | 6.66 | high |
| cg17599241 | VCAN-AS1, VCAN | HAVCR2 | 0.6225838 | 3.84 | high |
| cg17599241 | VCAN-AS1, VCAN | TGFB1 | 0.66056385 | 5.87 | high |
| cg17599241 | VCAN-AS1, VCAN | IL10 | 0.71015235 | 3.25 | high |
| cg08064683 | FAT1 | CCR4 | 0.60946563 | 6.94 | high |
| cg08064683 | FAT1 | TGFB1 | 0.7482646 | 2.26 | high |
| cg08064683 | FAT1 | IL10 | 0.66059345 | 5.86 | high |
| cg00799121 | ADAMTS2 | HAVCR2 | 0.6833261 | 1.67 | high |
| cg00799121 | ADAMTS2 | TGFB1 | 0.69708683 | 7.37 | high |
| cg00799121 | ADAMTS2 | IL10 | 0.71008968 | 3.26 | high |
| cg04153551 | FBLN5 | HAVCR2 | 0.6642975 | 4.81 | high |
| cg04153551 | FBLN5 | CCR4 | 0.63922606 | 1.74 | high |
| cg04153551 | FBLN5 | TGFB1 | 0.64462765 | 1.33 | high |
| cg04153551 | FBLN5 | IL10 | 0.75654189 | 1.19 | high |
| cg22704788 | PRELP | HAVCR2 | 0.66998995 | 3.53 | high |
| cg22704788 | PRELP | TGFB1 | 0.64874971 | 1.08 | high |
| cg22704788 | PRELP | IL10 | 0.71501411 | 2.37 | high |
| cg12613839 | ADAMTS2 | HAVCR2 | 0.70546862 | 4.38 | high |
| cg12613839 | ADAMTS2 | TGFB1 | 0.70966683 | 3.35 | high |
| cg12613839 | ADAMTS2 | PDCD1LG2 | 0.60313469 | 9.15 | high |
| cg12613839 | ADAMTS2 | IL10 | 0.7323874 | 7.25 | high |
| cg02189760 | CTC-301O7.4, CD37 | HAVCR2 | 0.64276143 | 1.46 | high |
| cg02189760 | CTC-301O7.4, CD37 | TGFB1 | 0.65060293 | 9.85 | high |
| cg02189760 | CTC-301O7.4, CD37 | IL10 | 0.68557785 | 1.46 | high |
| cg07947930 | PRELP | HAVCR2 | 0.66424332 | 4.82 | high |
| cg07947930 | PRELP | TGFB1 | 0.68739449 | 1.32 | high |
| cg07947930 | PRELP | PDCD1LG2 | 0.62213951 | 3.92 | high |
| cg07947930 | PRELP | IL10 | 0.6692665 | 3.68 | high |
| cg27329371 | ALDH3A1 | HAVCR2 | 0.63023007 | 2.68 | high |
| cg27329371 | ALDH3A1 | TGFB1 | 0.666298 | 4.32 | high |
| cg27329371 | ALDH3A1 | PDCD1LG2 | 0.6318309 | 2.49 | high |
| cg27329371 | ALDH3A1 | IL10 | 0.69220582 | 9.90 | high |
| cg25206536 | MIR572 | HAVCR2 | 0.65967075 | 6.15 | high |
| cg25206536 | MIR572 | TGFB1 | 0.65401204 | 8.27 | high |
| cg25206536 | MIR572 | IL10 | 0.71059003 | 3.16 | high |
| cg20502977 | COL6A3 | IL10 | 0.66111585 | 5.70 | high |
| cg18397405 | GPC6 | CTLA4 | 0.62938967 | 2.79 | high |
| cg18397405 | GPC6 | HAVCR2 | 0.64510535 | 1.30 | high |
| cg18397405 | GPC6 | CCR4 | 0.65623064 | 7.37 | high |
| cg18397405 | GPC6 | TGFB1 | 0.75578234 | 1.26 | high |
| cg18397405 | GPC6 | IL10 | 0.76613612 | 5.48 | high |
| cg16121744 | COL18A1 | HAVCR2 | 0.76562289 | 5.72 | high |
| cg16121744 | COL18A1 | TGFB1 | 0.72925722 | 9.04 | high |
| cg16121744 | COL18A1 | IL10 | 0.77214535 | 3.31 | high |
| cg15254671 | MYO1F | HAVCR2 | 0.73827055 | 4.76 | high |
| cg15254671 | MYO1F | IL10 | 0.70599224 | 4.24 | high |
| cg22595235 | SUMF1, LRRN1 | CTLA4 | 0.61078204 | 6.55 | high |
| cg09777237 | ELN | HAVCR2 | 0.67250205 | 3.08 | high |
| cg09777237 | ELN | TGFB1 | 0.61588628 | 5.21 | high |
| cg09777237 | ELN | IL10 | 0.68055003 | 1.96 | high |
| cg21475610 | CCNG2 | TGFB1 | 0.68792815 | 1.28 | high |
| cg21475610 | CCNG2 | IL10 | 0.6470373 | 1.18 | high |
| cg11076970 | HLA-DOA | CCL22 | 0.68567625 | 1.46 | high |
| cg17611512 | COL18A1, COL18A1-AS1 | HAVCR2 | 0.67446387 | 2.76 | high |
| cg17611512 | COL18A1, COL18A1-AS1 | TGFB1 | 0.75562488 | 1.28 | high |
| cg17611512 | COL18A1, COL18A1-AS1 | IL10 | 0.76622066 | 5.44 | high |
| cg22987448 | MYO1F | HAVCR2 | 0.70835256 | 3.65 | high |
| cg22987448 | MYO1F | TGFB1 | 0.63248797 | 2.41 | high |
| cg22987448 | MYO1F | IL10 | 0.70835142 | 3.65 | high |
| cg21398469 | CCNG2 | TGFB1 | 0.61126793 | 6.41 | high |
| cg05955301 | PRELP | HAVCR2 | 0.64915158 | 1.06 | high |
| cg05955301 | PRELP | TGFB1 | 0.658497 | 6.55 | high |
| cg05955301 | PRELP | IL10 | 0.69042987 | 1.10 | high |
| cg00742851 | SUMF1, LRRN1 | HAVCR2 | 0.64108721 | 1.59 | high |
| cg00742851 | SUMF1, LRRN1 | CCR4 | 0.65102622 | 9.64 | high |
| cg00742851 | SUMF1, LRRN1 | TGFB1 | 0.73293612 | 6.98 | high |
| cg00742851 | SUMF1, LRRN1 | IL10 | 0.75167928 | 1.74 | high |
| CpG | Gene | rho | p Value | CpGgene | Magnitude |
|---|---|---|---|---|---|
| cg02957057 | DEFB126 | 0.99984824 | NID1 | high | |
| cg20640433 | LRRIQ4 | −0.8429582 | LAMA2 | high | |
| cg02957057 | ZDHHC8P1 | −0.8399142 | NID1 | high | |
| cg23986671 | KRTAP6-3 | 0.83840023 | ADAMTS5 | high | |
| cg20640433 | TXK | −0.8184023 | LAMA2 | high | |
| cg20640433 | NLRP14 | −0.8100527 | LAMA2 | high | |
| cg20640433 | DEFB126 | 0.80488085 | LAMA2 | high | |
| cg16713274 | OR56A5 | 0.79052422 | COL18A1 | high | |
| cg02957057 | RFESD | −0.7883283 | NID1 | high | |
| cg02957057 | MMACHC | −0.7871875 | NID1 | high | |
| cg20640433 | GRP | −0.7852917 | LAMA2 | high | |
| cg02957057 | ISPD | −0.7804697 | NID1 | high | |
| cg02957057 | OSBPL9 | −0.7789042 | NID1 | high | |
| cg20640433 | FBXO17 | −0.7746792 | LAMA2 | high | |
| cg16121744 | IL10 | 0.77214535 | COL18A1 | high | |
| cg18397405 | CCR5 | 0.76767048 | GPC6 | high | |
| cg18397405 | CD96 | 0.7668386 | GPC6 | high | |
| cg17611512 | IL10 | 0.76622066 | COL18A1 | high | |
| cg18397405 | IL10 | 0.76613612 | GPC6 | high | |
| cg16121744 | HAVCR2 | 0.76562289 | COL18A1 | high | |
| cg02957057 | PCGEM1 | 0.76170335 | NID1 | high | |
| cg02957057 | ANKRD7 | −0.7606609 | NID1 | high | |
| cg13353679 | IL10 | 0.75708106 | AFF3, AC092667.2 | high | |
| cg04153551 | IL10 | 0.75654189 | FBLN5 | high | |
| cg18397405 | TGFB1 | 0.75578234 | GPC6 | high | |
| cg17611512 | TGFB1 | 0.75562488 | COL18A1, COL18A1-AS1 | high | |
| cg18397405 | ITGB2 | 0.75480536 | GPC6 | high | |
| cg20640433 | FAHD2B | −0.7544591 | LAMA2 | high | |
| cg00742851 | IL10 | 0.75167928 | SUMF1, LRRN1 | high | |
| cg23986671 | TAF1L | −0.7511669 | ADAMTS5 | high | |
| cg08064683 | TGFB1 | 0.7482646 | FAT1 | high | |
| cg20640433 | IL22RA1 | −0.7447273 | LAMA2 | high | |
| cg18411043 | GIMAP5 | 0.74431857 | LAPTM5 | high | |
| cg02957057 | FRMPD2 | −0.7389076 | NID1 | high | |
| cg02957057 | FAHD2B | −0.7387551 | NID1 | high | |
| cg15254671 | HAVCR2 | 0.73827055 | MYO1F | high | |
| cg18397405 | CD163 | 0.73748155 | GPC6 | high | |
| cg16713274 | C6orf132 | −0.7366047 | COL18A1 | high | |
| cg20640433 | ZDHHC8P1 | −0.7353041 | LAMA2 | high | |
| cg02957057 | MAP1LC3A | −0.7341328 | NID1 | high | |
| cg00742851 | TGFB1 | 0.73293612 | SUMF1, LRRN1 | high | |
| cg12613839 | IL10 | 0.7323874 | ADAMTS2 | high | |
| cg18411043 | WDR76 | −0.7298891 | LAPTM5 | high | |
| cg16121744 | TGFB1 | 0.72925722 | COL18A1 | high | |
| cg18411043 | SALL3 | −0.7280974 | LAPTM5 | high | |
| cg20640433 | GUCY2D | −0.7279513 | LAMA2 | high | |
| cg20640433 | ALDH7A1 | −0.7273038 | LAMA2 | high | |
| cg13353679 | TGFB1 | 0.72533605 | AFF3, AC092667.2 | high | |
| cg18397405 | CD74 | 0.72520583 | GPC6 | high | |
| cg14291900 | SFMBT2 | 0.72226357 | SLC7A7 | high | |
| cg22704788 | IL10 | 0.71501411 | PRELP | high | |
| cg02957057 | DPEP3 | −0.7149296 | NID1 | high | |
| cg20640433 | C17orf82 | −0.7134266 | LAMA2 | high | |
| cg18411043 | KCNK6 | 0.71200028 | LAPTM5 | high | |
| cg02957057 | N6AMT2 | −0.7119956 | NID1 | high | |
| cg02957057 | SLC25A20 | −0.7113793 | NID1 | high | |
| cg18397405 | CD14 | 0.71124306 | GPC6 | high | |
| cg25206536 | IL10 | 0.71059003 | MIR572 | high | |
| cg02957057 | ITPRIPL1 | −0.7102111 | NID1 | high | |
| cg17599241 | IL10 | 0.71015235 | VCAN-AS1, VCAN | high | |
| cg00799121 | IL10 | 0.71008968 | ADAMTS2 | high | |
| cg20640433 | SVOPL | −0.7100842 | LAMA2 | high | |
| cg12613839 | TGFB1 | 0.70966683 | ADAMTS2 | high | |
| cg22987448 | HAVCR2 | 0.70835256 | MYO1F | high | |
| cg22987448 | IL10 | 0.70835142 | MYO1F | high | |
| cg18397405 | CD68 | 0.70783649 | GPC6 | high | |
| cg18411043 | TGFBR2 | 0.70621641 | LAPTM5 | high | |
| cg15254671 | IL10 | 0.70599224 | MYO1F | high | |
| cg12613839 | HAVCR2 | 0.70546862 | ADAMTS2 | high | |
| cg04499514 | PDIA6 | −0.7048045 | C3AR1 | high | |
| cg20640433 | C9orf64 | −0.7042363 | LAMA2 | high | |
| cg02957057 | SLC35F3 | −0.7035707 | NID1 | high | |
| cg02957057 | POTEA | 0.70296616 | NID1 | high | |
| cg18411043 | IGFBP6 | 0.70161792 | LAPTM5 | high | |
| cg23986671 | TWIST2 | −0.7011775 | ADAMTS5 | high | |
| cg02957057 | OR10G7 | 0.70091288 | NID1 | high | |
| cg14291900 | FGD3 | 0.70047149 | SLC7A7 | high | |
| cg18397405 | GPR65 | 0.70013203 | GPC6 | high | |
| cg23986671 | MYOZ2 | −0.6993028 | ADAMTS5 | high | |
| cg23986671 | PDE6C | −0.6980551 | ADAMTS5 | high | |
| cg00799121 | TGFB1 | 0.69708683 | ADAMTS2 | high | |
| cg20640433 | AREG | −0.6964744 | LAMA2 | high | |
| cg20640433 | NMNAT3 | −0.6951494 | LAMA2 | high | |
| cg20640433 | XKR8 | −0.6950749 | LAMA2 | high | |
| cg20640433 | SLC25A44 | 0.69436599 | LAMA2 | high | |
| cg02957057 | ANKK1 | −0.6934215 | NID1 | high | |
| cg18397405 | GRN | 0.69317267 | GPC6 | high | |
| cg18411043 | TNFRSF10D | 0.6931024 | LAPTM5 | high | |
| cg18411043 | KIF22 | −0.6926606 | LAPTM5 | high | |
| cg20640433 | HDHD3 | −0.6922066 | LAMA2 | high | |
| cg27329371 | IL10 | 0.69220582 | ALDH3A1 | high | |
| cg18411043 | C19orf57 | −0.6912927 | LAPTM5 | high | |
| cg18411043 | SERPINB9 | 0.69077738 | LAPTM5 | high | |
| cg05955301 | IL10 | 0.69042987 | PRELP | high | |
| cg18411043 | CACNA2D4 | 0.6878496 | LAPTM5 | high | |
| cg21475610 | TGFB1 | 0.68792815 | CCNG2 | high | |
| cg20640433 | SSH3 | −0.6876975 | LAMA2 | high | |
| cg07947930 | TGFB1 | 0.68739449 | PRELP | high | |
| cg18411043 | CLDN23 | 0.68678752 | LAPTM5 | high | |
| cg02957057 | ZNF683 | −0.6867046 | NID1 | high | |
| cg02189760 | IL10 | 0.68557785 | CTC-301O7.4, CD37 | high | |
| cg11076970 | CCL22 | 0.68567625 | HLA-DOA | high | |
| cg13765206 | AMN | −0.6852093 | EMILIN2 | high | |
| cg02957057 | ISG20L2 | 0.68458461 | NID1 | high | |
| cg20640433 | MAP1LC3A | −0.683593 | LAMA2 | high | |
| cg18397405 | CCL5 | 0.68360635 | GPC6 | high | |
| cg00799121 | HAVCR2 | 0.6833261 | ADAMTS2 | high | |
| cg18411043 | MKS1 | −0.6816571 | LAPTM5 | high | |
| cg18411043 | IL4R | 0.68111791 | LAPTM5 | high | |
| cg09777237 | IL10 | 0.68055003 | ELN | high | |
| cg18411043 | GIMAP6 | 0.68005964 | LAPTM5 | high | |
| cg02957057 | STK33 | −0.6799005 | NID1 | high | |
| cg02957057 | PYDC2 | 0.67988313 | NID1 | high | |
| cg20640433 | MYD88 | −0.6798431 | LAMA2 | high | |
| cg14291900 | PIK3IP1 | 0.6795888 | 2.07 | SLC7A7 | high |
| cg18411043 | NUSAP1 | −0.6794355 | 2.08 | LAPTM5 | high |
| cg23986671 | RFPL3S | −0.6794146 | 2.09 | ADAMTS5 | high |
| cg20640433 | HEBP1 | −0.6789805 | 2.14 | LAMA2 | high |
| cg04499514 | RUNX1 | −0.6782038 | 2.23 | C3AR1 | high |
| cg18397405 | GZMA | 0.67785253 | 2.28 | GPC6 | high |
| cg02957057 | FAM19A1 | −0.6772002 | 2.37 | NID1 | high |
| cg02957057 | SPRR1A | 0.67668058 | 2.44 | NID1 | high |
| cg20640433 | MSN | −0.6761721 | 2.51 | LAMA2 | high |
| cg11827097 | PTK6 | 0.67530072 | 2.63 | SP100 | high |
| cg13353679 | HAVCR2 | 0.67520241 | 2.65 | AFF3, AC092667.2 | high |
| cg20640433 | SH3RF2 | −0.6749581 | 2.68 | LAMA2 | high |
| cg17611512 | HAVCR2 | 0.67446387 | 2.76 | COL18A1, COL18A1-AS1 | high |
| cg20640433 | PACSIN3 | −0.6738627 | 2.85 | LAMA2 | high |
| cg02957057 | CMBL | −0.673238 | 2.95 | NID1 | high |
| cg18411043 | MCTP2 | 0.67300302 | 2.99 | LAPTM5 | high |
| cg07436701 | CD74 | −0.6729908 | 2.99 | MMRN2, SNCG | high |
| cg14082886 | PPP1R15A | −0.6727144 | 3.04 | CD44 | high |
| cg18411043 | NCAPD3 | −0.6726225 | 3.06 | LAPTM5 | high |
| cg09777237 | HAVCR2 | 0.67250205 | 3.08 | ELN | high |
| cg02957057 | TYSND1 | −0.6716086 | 3.23 | NID1 | high |
| cg04499514 | TSPO | −0.6709273 | 3.35 | C3AR1 | high |
| cg18411043 | TMEM87B | 0.67084118 | 3.37 | LAPTM5 | high |
| cg23986671 | ZBTB32 | −0.6707326 | 3.39 | ADAMTS5 | high |
| cg14291900 | ZNF71 | −0.669991 | 3.53 | SLC7A7 | high |
| cg22704788 | HAVCR2 | 0.66998995 | 3.53 | PRELP | high |
| cg18411043 | B3GNT2 | 0.66993926 | 3.54 | LAPTM5 | high |
| cg07947930 | IL10 | 0.6692665 | 3.68 | PRELP | high |
| cg18411043 | MAPK13 | 0.66886709 | 3.76 | LAPTM5 | high |
| cg20640433 | SHROOM1 | −0.6687824 | 3.77 | LAMA2 | high |
| cg14291900 | ZNF134 | −0.6665228 | 4.27 | SLC7A7 | high |
| cg27329371 | TGFB1 | 0.666298 | 4.32 | ALDH3A1 | high |
| cg07436701 | CCR5 | −0.6662434 | 4.33 | MMRN2, SNCG | high |
| cg18411043 | CYP1B1 | 0.66507974 | 4.61 | LAPTM5 | high |
| cg18411043 | EMB | 0.66449718 | 4.76 | LAPTM5 | high |
| cg04153551 | HAVCR2 | 0.6642975 | 4.81 | FBLN5 | high |
| cg07947930 | HAVCR2 | 0.66424332 | 4.82 | PRELP | high |
| cg04499514 | MAPT | 0.66400429 | 4.89 | C3AR1 | high |
| cg13765206 | ITCH | 0.66292628 | 5.18 | EMILIN2 | high |
| cg20640433 | RFESD | −0.6627852 | 5.22 | LAMA2 | high |
| cg14082886 | CLVS2 | 0.66221087 | 5.38 | CD44 | high |
| cg18411043 | CHEK1 | −0.6614723 | LAPTM5 | high | |
| cg11702456 | TAGLN2 | −0.6614648 | SP100 | high | |
| cg18397405 | CD244 | 0.66144045 | GPC6 | high | |
| cg20502977 | IL10 | 0.66111585 | COL6A3 | high | |
| cg18411043 | PAPSS2 | 0.66103523 | LAPTM5 | high | |
| cg00295382 | MKRN3 | −0.6607885 | MYCL | high | |
| cg08064683 | IL10 | 0.66059345 | FAT1 | high | |
| cg17599241 | TGFB1 | 0.66056385 | VCAN-AS1, VCAN | high | |
| cg23986671 | GCOM1 | −0.660442 | ADAMTS5 | high | |
| cg18411043 | LYVE1 | 0.6597996 | LAPTM5 | high | |
| cg25206536 | HAVCR2 | 0.65967075 | MIR572 | high | |
| cg14082886 | RGS9 | 0.65942308 | CD44 | high | |
| cg14082886 | NEK6 | −0.6591273 | CD44 | high | |
| cg18411043 | NUMB | 0.65897549 | LAPTM5 | high | |
| cg20640433 | SLC43A3 | −0.6588459 | LAMA2 | high | |
| cg23986671 | VTCN1 | −0.6588003 | ADAMTS5 | high | |
| cg20640433 | RFPL2 | −0.6584724 | LAMA2 | high | |
| cg05955301 | TGFB1 | 0.658497 | PRELP | high | |
| cg22568423 | IL10 | 0.65815888 | MYO1F | high | |
| cg18397405 | CCR4 | 0.65623064 | GPC6 | high | |
| cg18397405 | CCR4 | 0.65623064 | GPC6 | high | |
| cg14291900 | YPEL2 | 0.65585997 | SLC7A7 | high | |
| cg20640433 | ZDHHC1 | −0.6557248 | LAMA2 | high | |
| cg18411043 | MAP3K8 | 0.6551703 | LAPTM5 | high | |
| cg02957057 | HSD17B7 | −0.6541632 | NID1 | high | |
| cg25206536 | TGFB1 | 0.65401204 | MIR572 | high | |
| cg18411043 | GAB1 | −0.6539384 | LAPTM5 | high | |
| cg18411043 | OIP5 | −0.6532665 | LAPTM5 | high | |
| cg04499514 | LGALS1 | −0.6531144 | C3AR1 | high | |
| cg23986671 | HYALP1 | 0.65295592 | ADAMTS5 | high | |
| cg02957057 | SCAMP3 | 0.65296148 | NID1 | high | |
| cg20640433 | DYNLT3 | −0.6527851 | LAMA2 | high | |
| cg04499514 | CD63 | −0.6526897 | C3AR1 | high | |
| cg04499514 | CD63 | −0.6526897 | C3AR1 | high | |
| cg18411043 | HIST1H4A | −0.652456 | LAPTM5 | high | |
| cg18397405 | IGF1 | 0.65236854 | GPC6 | high | |
| cg14291900 | ZNF787 | −0.6523244 | SLC7A7 | high | |
| cg20640433 | SH2D4A | −0.6513244 | LAMA2 | high | |
| cg23986671 | MMP1 | −0.6510743 | ADAMTS5 | high | |
| cg07436701 | ITGB2 | −0.6510564 | MMRN2, SNCG | high | |
| cg00742851 | CCR4 | 0.65102622 | SUMF1, LRRN1 | high | |
| cg04499514 | RPS6KA5 | 0.65061879 | C3AR1 | high | |
| cg02189760 | TGFB1 | 0.65060293 | CTC-301O7.4, CD37 | high | |
| cg18411043 | CD59 | 0.65051987 | LAPTM5 | high | |
| cg18411043 | ST3GAL1 | 0.64986187 | LAPTM5 | high | |
| cg18411043 | ZNF620 | −0.6492829 | LAPTM5 | high | |
| cg04499514 | CRELD2 | −0.6492545 | C3AR1 | high | |
| cg05955301 | HAVCR2 | 0.64915158 | PRELP | high | |
| cg20640433 | ACSF2 | −0.6487996 | LAMA2 | high | |
| cg02957057 | PARVA | −0.6487478 | NID1 | high | |
| cg22704788 | TGFB1 | 0.64874971 | PRELP | high | |
| cg16713274 | BCL2L10 | −0.6485899 | COL18A1 | high | |
| cg20640433 | SLC35F3 | −0.6482366 | LAMA2 | high | |
| cg14291900 | KLHL32 | 0.6481981 | SLC7A7 | high | |
| cg11702456 | RIPK1 | −0.6478933 | SP100 | high | |
| cg11702456 | PTK6 | 0.64795892 | SP100 | high | |
| cg14291900 | ZNF473 | −0.6477937 | SLC7A7 | high | |
| cg13765206 | CRNKL1 | 0.64734872 | EMILIN2 | high | |
| cg14291900 | AKAP8 | −0.6473027 | SLC7A7 | high | |
| cg18411043 | PSTPIP2 | 0.64723289 | LAPTM5 | high | |
| cg21475610 | IL10 | 0.6470373 | CCNG2 | high | |
| cg11702456 | RAB34 | −0.6468892 | SP100 | high | |
| cg02957057 | XKR8 | −0.6468834 | NID1 | high | |
| cg18411043 | LTBP2 | 0.64651112 | LAPTM5 | high | |
| cg18411043 | WHSC1 | −0.6464405 | LAPTM5 | high | |
| cg04499514 | SMAGP | −0.6459406 | C3AR1 | high | |
| cg11827097 | RIPK1 | −0.6456769 | SP100 | high | |
| cg18411043 | B4GALT1 | 0.64554786 | LAPTM5 | high | |
| cg02957057 | UCHL1 | −0.6451568 | NID1 | high | |
| cg18397405 | HAVCR2 | 0.64510535 | GPC6 | high | |
| cg11702456 | EMP3 | −0.6447434 | SP100 | high | |
| cg18411043 | LILRB2 | 0.64470941 | LAPTM5 | high | |
| cg04153551 | TGFB1 | 0.64462765 | FBLN5 | high | |
| cg18411043 | PLK4 | −0.6445754 | LAPTM5 | high | |
| cg18411043 | TNFRSF10A | 0.64435812 | LAPTM5 | high | |
| cg13765206 | HPS1 | −0.6438577 | EMILIN2 | high | |
| cg02957057 | PPP1R3C | −0.6439269 | NID1 | high | |
| cg13765206 | KLHDC7B | −0.643828 | EMILIN2 | high | |
| cg18411043 | GPSM2 | −0.6430751 | LAPTM5 | high | |
| cg18411043 | POLA2 | −0.6428379 | LAPTM5 | high | |
| cg02189760 | HAVCR2 | 0.64276143 | CTC-301O7.4, CD37 | high | |
| cg18411043 | MCM2 | −0.6424966 | LAPTM5 | high | |
| cg04499514 | HSP90B1 | −0.6419106 | C3AR1 | high | |
| cg14291900 | HPN | 0.64190596 | SLC7A7 | high | |
| cg04499514 | EMILIN2 | −0.6416321 | C3AR1 | high | |
| cg04499514 | EMILIN2 | −0.6416321 | C3AR1 | high | |
| cg14082886 | HSPA5 | −0.6412986 | CD44 | high | |
| cg18411043 | ASGR2 | 0.6412585 | LAPTM5 | high | |
| cg18411043 | PRKCD | 0.64119535 | LAPTM5 | high | |
| cg00742851 | HAVCR2 | 0.64108721 | SUMF1, LRRN1 | high | |
| cg18411043 | FAM181B | −0.6409853 | LAPTM5 | high | |
| cg00295382 | ZNF292 | −0.6404944 | MYCL | high | |
| cg11702456 | TSEN34 | −0.6397343 | SP100 | high | |
| cg04153551 | CCR4 | 0.63922606 | FBLN5 | high | |
| cg22568423 | HAVCR2 | 0.6391164 | MYO1F | high | |
| cg04499514 | SPRR2A | 0.63900466 | C3AR1 | high | |
| cg20640433 | CRHR2 | −0.6389645 | LAMA2 | high | |
| cg14291900 | ERMN | 0.63877586 | SLC7A7 | high | |
| cg16713274 | VWDE | −0.6386629 | COL18A1 | high | |
| cg20640433 | SCAMP3 | 0.63863905 | LAMA2 | high | |
| cg02957057 | SMG5 | 0.63832232 | NID1 | high | |
| cg18411043 | CDCA5 | −0.637901 | LAPTM5 | high | |
| cg18411043 | SMC2 | −0.6376489 | LAPTM5 | high | |
| cg23986671 | GPS1 | 0.63753383 | ADAMTS5 | high | |
| cg20640433 | OR10G7 | 0.63739025 | LAMA2 | high | |
| cg20640433 | VNN3 | −0.6368153 | LAMA2 | high | |
| cg18411043 | RNF144B | 0.63671956 | LAPTM5 | high | |
| cg02957057 | NMNAT3 | −0.6360154 | NID1 | high | |
| cg18411043 | FANCC | −0.6359325 | LAPTM5 | high | |
| cg14291900 | SLC46A3 | 0.63593824 | SLC7A7 | high | |
| cg04499514 | TSEN34 | −0.6356583 | C3AR1 | high | |
| cg14082886 | PCYT1A | −0.6351289 | 2.12 | CD44 | high |
| cg18411043 | ARPC1B | 0.63501952 | 2.13 | LAPTM5 | high |
| cg18411043 | GPR132 | 0.63497935 | 2.14 | LAPTM5 | high |
| cg02957057 | ELOVL3 | −0.6344793 | 2.19 | NID1 | high |
| cg13765206 | C2CD4D | −0.6344131 | 2.20 | EMILIN2 | high |
| cg14291900 | SEMA4A | 0.63440849 | 2.20 | SLC7A7 | high |
| cg18411043 | KIF15 | −0.6340036 | 2.24 | LAPTM5 | high |
| cg18411043 | NCF4 | 0.63389721 | 2.25 | LAPTM5 | high |
| cg23986671 | DCST1 | −0.6335087 | 2.30 | ADAMTS5 | high |
| cg00777079 | N4BP2 | −0.6335114 | 2.30 | SERPINF1 | high |
| cg23986671 | CLEC4F | −0.6330094 | 2.35 | ADAMTS5 | high |
| cg04499514 | DUSP4 | −0.632834 | 2.37 | C3AR1 | high |
| cg14291900 | TCF3 | −0.6328327 | 2.37 | SLC7A7 | high |
| cg14291900 | ZNF416 | −0.6328258 | 2.37 | SLC7A7 | high |
| cg18411043 | CD1D | 0.63278019 | 2.38 | LAPTM5 | high |
| cg22987448 | TGFB1 | 0.63248797 | 2.41 | MYO1F | high |
| cg20640433 | GLIS3 | −0.6319628 | 2.47 | LAMA2 | high |
| cg04499514 | SEC24D | −0.631827 | 2.49 | C3AR1 | high |
| cg02957057 | NLRX1 | −0.6317766 | 2.49 | NID1 | high |
| cg27329371 | PDCD1LG2 | 0.6318309 | 2.49 | ALDH3A1 | high |
| cg18411043 | PSMC3IP | −0.631709 | 2.50 | LAPTM5 | high |
| cg23986671 | GOLGA4 | −0.6315958 | 2.52 | ADAMTS5 | high |
| cg14291900 | U2AF2 | −0.6314722 | 2.53 | SLC7A7 | high |
| cg18411043 | CEP72 | −0.6310813 | 2.58 | LAPTM5 | high |
| cg18411043 | NCAPH | −0.6308592 | 2.61 | LAPTM5 | high |
| cg18411043 | TRIM38 | 0.63055942 | 2.64 | LAPTM5 | high |
| cg27329371 | HAVCR2 | 0.63023007 | 2.68 | ALDH3A1 | high |
| cg04499514 | S100A11 | −0.6301523 | 2.69 | C3AR1 | high |
| cg18411043 | GIMAP8 | 0.63012277 | 2.70 | LAPTM5 | high |
| cg18411043 | LMNB1 | −0.6298277 | 2.74 | LAPTM5 | high |
| cg04499514 | SEMA3D | 0.62956973 | 2.77 | C3AR1 | high |
| cg18397405 | CTLA4 | 0.62938967 | 2.79 | GPC6 | high |
| cg14291900 | DOCK5 | 0.62929209 | 2.81 | SLC7A7 | high |
| cg14291900 | ACSM5 | 0.62920997 | 2.82 | SLC7A7 | high |
| cg04499514 | TWF2 | −0.6290565 | 2.84 | C3AR1 | high |
| cg18411043 | MRC1 | 0.62895863 | 2.85 | LAPTM5 | high |
| cg18411043 | TNFRSF1B | 0.62892778 | 2.86 | LAPTM5 | high |
| cg18411043 | MEN1 | −0.6288512 | 2.87 | LAPTM5 | high |
| cg18411043 | RAB11FIP1 | 0.62865829 | 2.89 | LAPTM5 | high |
| cg18411043 | F13A1 | 0.62865476 | 2.89 | LAPTM5 | high |
| cg18411043 | TESC | 0.62858843 | 2.90 | LAPTM5 | high |
| cg14291900 | LGALS9C | 0.62857927 | 2.90 | SLC7A7 | high |
| cg18411043 | GIPC2 | 0.62849757 | 2.91 | LAPTM5 | high |
| cg02957057 | LRRIQ4 | −0.6285485 | 2.91 | NID1 | high |
| cg14291900 | NKAIN2 | 0.6284529 | 2.92 | SLC7A7 | high |
| cg01930947 | TACR1 | 0.62834753 | 2.93 | C1orf111 | high |
| cg14082886 | COL4A3 | 0.62833753 | 2.94 | CD44 | high |
| cg04499514 | RPS6KA3 | −0.6282354 | 2.95 | C3AR1 | high |
| cg14291900 | LHPP | 0.62822146 | 2.95 | SLC7A7 | high |
| cg11702456 | GALNS | −0.6280356 | 2.98 | SP100 | high |
| cg18411043 | AMICA1 | 0.6278709 | 3.00 | LAPTM5 | high |
| cg20640433 | ISG20L2 | 0.62790094 | 3.00 | LAMA2 | high |
| cg13765206 | PLEKHG6 | −0.6278379 | 3.01 | EMILIN2 | high |
| cg04499514 | TTC38 | −0.6274235 | 3.06 | C3AR1 | high |
| cg20640433 | RAB36 | −0.627427 | 3.06 | LAMA2 | high |
| cg20640433 | CST3 | −0.6274226 | 3.06 | LAMA2 | high |
| cg18411043 | MLKL | 0.62716867 | 3.10 | LAPTM5 | high |
| cg02957057 | C9orf64 | −0.627194 | 3.10 | NID1 | high |
| cg11702456 | S100A13 | −0.626989 | 3.13 | SP100 | high |
| cg01930947 | TMEFF2 | 0.62681323 | 3.15 | C1orf111 | high |
| cg18411043 | MAN1A1 | 0.62676193 | 3.16 | LAPTM5 | high |
| cg02957057 | FBXO17 | −0.6267928 | 3.16 | NID1 | high |
| cg02957057 | SH3BP2 | −0.6266051 | 3.18 | NID1 | high |
| cg05091653 | SERPINF2 | −0.6263606 | 3.22 | SP100 | high |
| cg18411043 | TRPM2 | 0.62624593 | 3.24 | LAPTM5 | high |
| cg18411043 | CD33 | 0.62613919 | 3.25 | LAPTM5 | high |
| cg18411043 | CD46 | 0.62591061 | 3.29 | LAPTM5 | high |
| cg14291900 | NR2C2AP | −0.6258545 | 3.30 | SLC7A7 | high |
| cg20640433 | PALM2 | −0.6257442 | 3.32 | LAMA2 | high |
| cg18411043 | P2RY6 | 0.62560017 | 3.34 | LAPTM5 | high |
| cg24769499 | FGF6 | 0.62560159 | 3.34 | TMEM37 | high |
| cg00295382 | UBE4A | −0.6253707 | 3.37 | MYCL | high |
| cg04499514 | FBLIM1 | −0.6251549 | 3.41 | C3AR1 | high |
| cg00777079 | RFWD3 | −0.6250366 | 3.43 | SERPINF1 | high |
| cg18411043 | CTSB | 0.62483558 | 3.46 | LAPTM5 | high |
| cg16713274 | NXPH2 | −0.624851 | 3.46 | COL18A1 | high |
| cg18411043 | INCENP | −0.6247948 | 3.47 | LAPTM5 | high |
| cg14291900 | CDK6 | −0.624404 | 3.53 | SLC7A7 | high |
| cg02957057 | DEFB125 | 0.62421976 | 3.56 | NID1 | high |
| cg18411043 | CSF1R | 0.62400537 | 3.60 | LAPTM5 | high |
| cg18411043 | TIGD3 | −0.6238521 | 3.62 | LAPTM5 | high |
| cg23986671 | ATP6V0D2 | −0.6237079 | 3.65 | ADAMTS5 | high |
| cg20640433 | RIT1 | 0.62363135 | 3.66 | LAMA2 | high |
| cg14082886 | SLCO1A2 | 0.62356807 | 3.67 | CD44 | high |
| cg18411043 | ALOX5 | 0.62349813 | 3.68 | LAPTM5 | high |
| cg18411043 | MSI1 | −0.6234219 | 3.69 | LAPTM5 | high |
| cg23986671 | DBH | −0.6231996 | 3.73 | ADAMTS5 | high |
| cg00295382 | NDUFB2 | 0.62314436 | 3.74 | MYCL | high |
| cg20640433 | EVC2 | −0.6228847 | 3.79 | LAMA2 | high |
| cg17599241 | HAVCR2 | 0.6225838 | 3.84 | VCAN-AS1, VCAN | high |
| cg18411043 | RUNX2 | 0.62236407 | 3.88 | LAPTM5 | high |
| cg13765206 | TCHH | −0.6221834 | 3.91 | EMILIN2 | high |
| cg07947930 | PDCD1LG2 | 0.62213951 | 3.92 | PRELP | high |
| cg18411043 | POLD3 | −0.6218415 | 3.97 | LAPTM5 | high |
| cg04499514 | MFSD5 | −0.621664 | 4.01 | C3AR1 | high |
| cg18411043 | MPP1 | 0.62163839 | 4.01 | LAPTM5 | high |
| cg18411043 | HRH2 | 0.62163838 | 4.01 | LAPTM5 | high |
| cg18411043 | TOP2A | −0.621607 | 4.02 | LAPTM5 | high |
| cg18411043 | IRAK3 | 0.62139951 | 4.06 | LAPTM5 | high |
| cg18397405 | GPC2 | −0.6210758 | 4.12 | GPC6 | high |
| cg18411043 | OAF | 0.62104659 | 4.12 | LAPTM5 | high |
| cg04499514 | SPRY4 | −0.6209967 | 4.13 | C3AR1 | high |
| cg18411043 | C1S | 0.6209673 | 4.14 | LAPTM5 | high |
| cg02957057 | ALDH7A1 | −0.6209514 | 4.14 | NID1 | high |
| cg14291900 | CNOT3 | −0.6209149 | 4.15 | SLC7A7 | high |
| cg02957057 | TXK | −0.6207198 | 4.18 | NID1 | high |
| cg07436701 | IGF1 | −0.6206649 | 4.19 | MMRN2, SNCG | high |
| cg18411043 | KIF18B | −0.6205685 | 4.21 | LAPTM5 | high |
| cg18411043 | ARHGAP30 | 0.6203351 | 4.26 | LAPTM5 | high |
| cg18411043 | AIF1 | 0.62025359 | 4.27 | LAPTM5 | high |
| cg00295382 | TGM2 | 0.62016995 | 4.29 | MYCL | high |
| cg14291900 | SLC26A9 | 0.62000399 | 4.32 | SLC7A7 | high |
| cg23986671 | TMEM52 | −0.6197762 | 4.37 | ADAMTS5 | high |
| cg18411043 | LHFPL2 | 0.61974103 | 4.38 | LAPTM5 | high |
| cg14291900 | SLC1A7 | 0.6196898 | 4.39 | SLC7A7 | high |
| cg04499514 | DUSP6 | −0.619504 | 4.42 | C3AR1 | high |
| cg11702456 | APOBEC3F | −0.6195267 | 4.42 | SP100 | high |
| cg22568423 | TGFB1 | 0.61936567 | 4.45 | MYO1F | high |
| cg14082886 | ADAM22 | 0.61922422 | 4.48 | CD44 | high |
| cg11827097 | TAGLN2 | −0.6185018 | 4.63 | SP100 | high |
| cg02957057 | CSRP1 | −0.6184356 | 4.64 | NID1 | high |
| cg21218883 | HSPBP1 | −0.618324 | 4.67 | PRKCE | high |
| cg00295382 | HGFAC | −0.618239 | 4.69 | MYCL | high |
| cg14291900 | GRWD1 | −0.6179975 | 4.74 | SLC7A7 | high |
| cg18411043 | CMKLR1 | 0.61781132 | 4.78 | LAPTM5 | high |
| cg18411043 | CYTH4 | 0.61755945 | 4.83 | LAPTM5 | high |
| cg02957057 | ACADS | −0.6173054 | 4.89 | NID1 | high |
| cg18411043 | FANCI | −0.6170511 | 4.95 | LAPTM5 | high |
| cg20640433 | LGALS8 | −0.616979 | 4.96 | LAMA2 | high |
| cg04499514 | CD276 | −0.6168248 | 5.00 | C3AR1 | high |
| cg18411043 | TNFSF10 | 0.61660766 | 5.05 | LAPTM5 | high |
| cg18411043 | VENTX | 0.61649043 | 5.07 | LAPTM5 | high |
| cg04499514 | CASC3 | 0.61596213 | 5.20 | C3AR1 | high |
| cg09777237 | TGFB1 | 0.61588628 | 5.21 | ELN | high |
| cg18411043 | SIGLEC10 | 0.61564503 | 5.27 | LAPTM5 | high |
| cg14291900 | FAM124A | 0.61534899 | 5.34 | SLC7A7 | high |
| cg11702456 | APOBEC3C | −0.6153217 | 5.35 | SP100 | high |
| cg20640433 | KHNYN | −0.6151494 | 5.39 | LAMA2 | high |
| cg14291900 | RAB40B | 0.61510576 | 5.40 | SLC7A7 | high |
| cg04499514 | TAGLN2 | −0.6149763 | 5.43 | C3AR1 | high |
| cg18411043 | RAC3 | −0.6149957 | 5.43 | LAPTM5 | high |
| cg14082886 | EMP1 | −0.6149246 | 5.44 | CD44 | high |
| cg14291900 | MRVI1 | 0.61493337 | 5.44 | SLC7A7 | high |
| cg14082886 | TAGLN2 | −0.614913 | 5.45 | CD44 | high |
| cg18411043 | FGD2 | 0.61480269 | 5.47 | LAPTM5 | high |
| cg18411043 | DSE | 0.6147844 | 5.48 | LAPTM5 | high |
| cg23986671 | UBP1 | −0.6147229 | 5.49 | ADAMTS5 | high |
| cg23986671 | XKR5 | −0.6145796 | 5.53 | ADAMTS5 | high |
| cg18411043 | POLD4 | 0.61428878 | 5.60 | LAPTM5 | high |
| cg18411043 | FMNL1 | 0.61431112 | 5.60 | LAPTM5 | high |
| cg04499514 | SPAG9 | 0.61418162 | 5.63 | C3AR1 | high |
| cg18411043 | EZH2 | −0.6141715 | 5.63 | LAPTM5 | high |
| cg14291900 | EFHD1 | 0.61415875 | 5.63 | SLC7A7 | high |
| cg18411043 | TPX2 | −0.6140728 | 5.66 | LAPTM5 | high |
| cg11702456 | EFEMP2 | −0.6138811 | 5.70 | SP100 | high |
| cg04499514 | APBA1 | 0.61375515 | 5.74 | C3AR1 | high |
| cg01930947 | DNM3 | 0.61362978 | 5.77 | C1orf111 | high |
| cg14082886 | DAAM2 | 0.61357396 | 5.78 | CD44 | high |
| cg04499514 | SDF2L1 | −0.6132695 | 5.86 | C3AR1 | high |
| cg02957057 | ACSF2 | −0.6130867 | 5.91 | NID1 | high |
| cg18411043 | TMEM97 | −0.6127385 | 6.00 | LAPTM5 | high |
| cg18411043 | CDC25A | −0.6126424 | 6.03 | LAPTM5 | high |
| cg18411043 | GIMAP7 | 0.61247867 | 6.07 | LAPTM5 | high |
| cg14291900 | ZNF45 | −0.6125104 | 6.07 | SLC7A7 | high |
| cg02957057 | SH2D4A | −0.6123811 | 6.10 | NID1 | high |
| cg04499514 | ATP1A4 | 0.61222663 | 6.14 | C3AR1 | high |
| cg18411043 | KIF2C | −0.6121091 | 6.17 | LAPTM5 | high |
| cg18411043 | SLC20A1 | 0.61194867 | 6.22 | LAPTM5 | high |
| cg20640433 | MMACHC | −0.6119354 | 6.22 | LAMA2 | high |
| cg18411043 | ECM1 | 0.61187776 | 6.24 | LAPTM5 | high |
| cg00295382 | C5orf51 | −0.6118449 | 6.25 | MYCL | high |
| cg18411043 | CMTM7 | 0.61176944 | 6.27 | LAPTM5 | high |
| cg04499514 | EHD4 | −0.611663 | 6.30 | C3AR1 | high |
| cg18411043 | CRISPLD2 | 0.61159373 | 6.32 | LAPTM5 | high |
| cg00295382 | ATF7IP | −0.6113318 | 6.39 | MYCL | high |
| cg07436701 | CD163 | −0.6113281 | 6.39 | MMRN2, SNCG | high |
| cg21398469 | TGFB1 | 0.61126793 | 6.41 | CCNG2 | high |
| cg07436701 | CD244 | −0.6112525 | 6.41 | MMRN2, SNCG | high |
| cg14291900 | ABCG1 | 0.61123795 | 6.42 | SLC7A7 | high |
| cg14291900 | ZNF761 | −0.6110213 | 6.48 | SLC7A7 | high |
| cg18411043 | HHEX | 0.61088519 | 6.52 | LAPTM5 | high |
| cg22595235 | CTLA4 | 0.61078204 | 6.55 | SUMF1, LRRN1 | high |
| cg24769499 | IL22 | 0.61065046 | 6.59 | TMEM37 | high |
| cg18411043 | MNDA | 0.61034153 | 6.68 | LAPTM5 | high |
| cg18411043 | FAH | 0.61025131 | 6.71 | LAPTM5 | high |
| cg11702456 | SP100 | −0.6102275 | 6.71 | SP100 | high |
| cg23986671 | DUOXA1 | −0.6102538 | 6.71 | ADAMTS5 | high |
| cg00295382 | PANK3 | −0.6101989 | 6.72 | MYCL | high |
| cg18411043 | CLEC10A | 0.61013964 | 6.74 | LAPTM5 | high |
| cg18411043 | TRAF3IP3 | 0.61007507 | 6.76 | LAPTM5 | high |
| cg13765206 | CAPN8 | −0.6097062 | 6.87 | EMILIN2 | high |
| cg14291900 | PAQR8 | 0.60959693 | 6.90 | SLC7A7 | high |
| cg02957057 | SDC4 | −0.609594 | 6.90 | NID1 | high |
| cg20640433 | ISPD | −0.6095796 | 6.91 | LAMA2 | high |
| cg08064683 | CCR4 | 0.60946563 | 6.94 | FAT1 | high |
| cg04499514 | AP2S1 | −0.6092851 | 7.00 | C3AR1 | high |
| cg04499514 | ITPRIP | −0.60917 | 7.03 | C3AR1 | high |
| cg04499514 | ADHFE1 | 0.60916978 | 7.03 | C3AR1 | high |
| cg00295382 | ARPC1B | 0.60912481 | 7.05 | MYCL | high |
| cg18411043 | ZNF90 | −0.6090191 | 7.08 | LAPTM5 | high |
| cg00295382 | CREBZF | −0.6089524 | 7.10 | MYCL | high |
| cg14291900 | DPEP2 | 0.60894355 | 7.10 | SLC7A7 | high |
| cg02957057 | CCDC163P | −0.608834 | 7.14 | NID1 | high |
| cg04499514 | AKAP1 | 0.60866034 | 7.19 | C3AR1 | high |
| cg20640433 | SLC2A10 | −0.6085969 | 7.21 | LAMA2 | high |
| cg14291900 | TPD52L1 | 0.60852744 | 7.24 | SLC7A7 | high |
| cg11827097 | PRMT2 | −0.6081478 | 7.36 | SP100 | high |
| cg23986671 | PRPH2 | −0.6081063 | 7.37 | ADAMTS5 | high |
| cg18397405 | ITGB1 | 0.60795654 | 7.42 | GPC6 | high |
| cg02957057 | RRP12 | 0.60790296 | 7.44 | NID1 | high |
| cg18411043 | ADAP2 | 0.60781942 | 7.46 | LAPTM5 | high |
| cg18411043 | CCR1 | 0.60783567 | 7.46 | LAPTM5 | high |
| cg18411043 | IL15RA | 0.60780418 | 7.47 | LAPTM5 | high |
| cg11702456 | CMTM3 | −0.6077214 | 7.50 | SP100 | high |
| cg04499514 | FBXW12 | 0.60765521 | 7.52 | C3AR1 | high |
| cg14291900 | ADRBK2 | 0.60758355 | 7.54 | SLC7A7 | high |
| cg18411043 | WDR34 | −0.6072402 | 7.66 | LAPTM5 | high |
| cg18411043 | LAIR1 | 0.60714771 | 7.69 | LAPTM5 | high |
| cg00295382 | ZBTB44 | −0.6070874 | 7.71 | MYCL | high |
| cg13765206 | NRAP | −0.6067666 | 7.82 | EMILIN2 | high |
| cg14291900 | SLCO1A2 | 0.60635008 | 7.96 | SLC7A7 | high |
| cg16713274 | OLFM3 | −0.6062793 | 7.99 | COL18A1 | high |
| cg00295382 | FAM166A | −0.6061765 | 8.02 | MYCL | high |
| cg02957057 | RAB36 | −0.6061395 | 8.03 | NID1 | high |
| cg14291900 | TMEM86A | 0.60607985 | 8.05 | SLC7A7 | high |
| cg14291900 | EVI2A | 0.60605156 | 8.06 | SLC7A7 | high |
| cg18411043 | CTSZ | 0.60597807 | 8.09 | LAPTM5 | high |
| cg13765206 | NCR3 | −0.6057964 | 8.16 | EMILIN2 | high |
| cg13765206 | KRTAP5-9 | −0.605737 | 8.18 | EMILIN2 | high |
| cg18411043 | HES5 | −0.6056663 | 8.20 | LAPTM5 | high |
| cg11702456 | ARSI | −0.6056573 | 8.20 | SP100 | high |
| cg18411043 | MFSD1 | 0.60562112 | LAPTM5 | high | |
| cg00295382 | ZG16 | −0.6055812 | MYCL | high | |
| cg20640433 | DPEP3 | −0.6054516 | LAMA2 | high | |
| cg18411043 | MAP2 | −0.6053901 | LAPTM5 | high | |
| cg18411043 | ADAMTS14 | 0.60538276 | LAPTM5 | high | |
| cg04499514 | KDELR1 | −0.605255 | C3AR1 | high | |
| cg04499514 | RALGPS1 | 0.60522199 | C3AR1 | high | |
| cg18411043 | BRIP1 | −0.6052277 | LAPTM5 | high | |
| cg14291900 | DLEU7 | 0.60520069 | SLC7A7 | high | |
| cg18411043 | RNF149 | 0.60510698 | LAPTM5 | high | |
| cg18411043 | LEPROT | 0.60482116 | LAPTM5 | high | |
| cg18411043 | GIMAP4 | 0.60467954 | LAPTM5 | high | |
| cg00295382 | RGS19 | 0.60458767 | MYCL | high | |
| cg18411043 | IL10RA | 0.60450736 | LAPTM5 | high | |
| cg18411043 | SLCO2B1 | 0.60445283 | LAPTM5 | high | |
| cg00295382 | TTC38 | 0.60437946 | MYCL | high | |
| cg14291900 | PTBP1 | −0.6043814 | SLC7A7 | high | |
| cg18411043 | IL16 | 0.60434727 | LAPTM5 | high | |
| cg04499514 | PPIB | −0.6040378 | C3AR1 | high | |
| cg18411043 | MAPKAPK2 | 0.60396534 | LAPTM5 | high | |
| cg04499514 | TGFBI | −0.6038334 | C3AR1 | high | |
| cg04499514 | IGFBP2 | −0.6037505 | C3AR1 | high | |
| cg11702456 | SLC2A4 | 0.60343179 | SP100 | high | |
| cg04499514 | IKBIP | −0.603409 | C3AR1 | high | |
| cg04499514 | ETV5 | −0.603302 | C3AR1 | high | |
| cg12613839 | PDCD1LG2 | 0.60313469 | ADAMTS2 | high | |
| cg04499514 | KIAA1324L | 0.60307321 | C3AR1 | high | |
| cg18411043 | FMN1 | 0.60306718 | LAPTM5 | high | |
| cg18411043 | SH3TC1 | 0.6029736 | LAPTM5 | high | |
| cg02957057 | LEKR1 | −0.6029529 | NID1 | high | |
| cg18411043 | GRB2 | 0.60266775 | LAPTM5 | high | |
| cg04499514 | PSD2 | 0.60262221 | C3AR1 | high | |
| cg11702456 | CASP8 | −0.6025684 | SP100 | high | |
| cg04499514 | IFNGR2 | −0.6025283 | C3AR1 | high | |
| cg14082886 | DCAF8 | 0.60237965 | CD44 | high | |
| cg02957057 | C10orf107 | −0.6023697 | NID1 | high | |
| cg04499514 | CKAP4 | -0.6023102 | C3AR1 | high | |
| cg02957057 | RTP2 | 0.60230352 | NID1 | high | |
| cg18411043 | RFC5 | −0.6022106 | LAPTM5 | high | |
| cg11827097 | TSEN34 | −0.6020259 | SP100 | high | |
| cg18411043 | YWHAZ | 0.60194076 | LAPTM5 | high | |
| cg02957057 | TMIE | −0.6019364 | NID1 | high | |
| cg02957057 | GLIS3 | −0.6017402 | NID1 | high | |
| cg00295382 | TRO | −0.60165 | MYCL | high | |
| cg20640433 | FAM19A1 | −0.6014471 | LAMA2 | high | |
| cg18411043 | LCORL | −0.6013862 | LAPTM5 | high | |
| cg20640433 | PAOX | −0.6011955 | LAMA2 | high | |
| cg14291900 | SAE1 | −0.6011065 | SLC7A7 | high | |
| cg18411043 | DENND1C | 0.60107737 | LAPTM5 | high | |
| cg00295382 | ZNF510 | −0.6009576 | 1.01 | MYCL | high |
| cg18411043 | MED24 | −0.6008814 | 1.01 | LAPTM5 | high |
| cg14082886 | ATP8A1 | 0.60058342 | 1.02 | CD44 | high |
| cg18411043 | RAD54L | −0.600678 | 1.02 | LAPTM5 | high |
| cg18411043 | SP4 | −0.6005993 | 1.02 | LAPTM5 | high |
| cg04499514 | TIMP1 | −0.6001084 | 1.04 | C3AR1 | high |
| cg14291900 | RASGEF1B | 0.60012159 | 1.04 | SLC7A7 | high |
| cg02957057 | ZDHHC1 | −0.6000678 | 1.04 | NID1 | high |
| cg02957057 | HRASLS5 | −0.6000243 | 1.05 | NID1 | high |
| cg07436701 | CD96 | −0.5993043 | 1.08 | MMRN2, SNCG | high |
| cg07436701 | CCR4 | −0.5972957 | 1.18 | MMRN2, SNCG | high |
| cg18397405 | ITGA4 | 0.59418147 | 1.34 | GPC6 | high |
| cg03677069 | CD74 | 0.59295197 | MMRN2, SNCG | high | |
| cg07436701 | GPR65 | −0.5925407 | MMRN2, SNCG | high | |
| cg18397405 | CDC34 | −0.590695 | GPC6 | high | |
| cg07436701 | FLT3 | −0.5827163 | MMRN2, SNCG | high | |
| cg07436701 | GPC2 | 0.5754121 | MMRN2, SNCG | high | |
| cg07436701 | E2F2 | 0.5728996 | MMRN2, SNCG | high | |
| cg07436701 | CD14 | −0.568245 | MMRN2, SNCG | high | |
| cg18397405 | EZH2 | −0.5582639 | GPC6 | high | |
| cg18397405 | CDKN1B | −0.5581881 | GPC6 | high | |
| cg07436701 | CDC34 | 0.55769852 | MMRN2, SNCG | high | |
| cg07436701 | CD68 | −0.5556475 | MMRN2, SNCG | high | |
| cg26350754 | EMILIN2 | −0.554466 | HLA-DPA1, HLA-DPB1 | high | |
| cg14082886 | MRC2 | −0.5539332 | CD44 | high | |
| cg18397405 | E2F2 | −0.5518593 | GPC6 | high | |
| cg18397405 | FLT3 | 0.54987539 | GPC6 | high | |
| cg10949632 | GPC6 | 0.54286496 | GPC6 | high | |
| cg03677069 | GPR65 | 0.54188941 | 0.00010045 | MMRN2, SNCG | high |
| cg14082886 | FGFR2 | 0.5340032 | 0.00013232 | CD44 | high |
| cg16713274 | GPC6 | −0.5317779 | 0.00014285 | COL18A1, LL21NC02-21A1.1 | high |
| cg03677069 | CD163 | 0.52832557 | 0.00016069 | MMRN2, SNCG | high |
| cg21012874 | CD74 | 0.52760147 | 0.00016467 | MMRN2, SNCG | high |
| cg09552892 | CD74 | 0.52237375 | 0.00019625 | MMRN2, SNCG | high |
| cg04499514 | EZH1 | 0.5201497 | 0.00021127 | C3AR1 | high |
| cg07436701 | EZH2 | 0.51876207 | 0.00022116 | MMRN2, SNCG | high |
| cg14082886 | CD63 | −0.5173898 | 0.00023136 | CD44 | high |
| cg04098585 | EMILIN2 | −0.5123153 | 0.00027286 | CD28 | high |
| cg07436701 | GZMA | −0.5121674 | 0.00027417 | MMRN2, SNCG | high |
| cg03677069 | ITGB2 | 0.5110316 | 0.00028438 | MMRN2, SNCG | high |
| cg07436701 | CCL5 | −0.5105968 | 0.00028837 | MMRN2, SNCG | high |
| cg03677069 | E2F2 | −0.5095174 | 0.00029852 | MMRN2, SNCG | high |
| cg03677069 | CD14 | 0.50607605 | 0.00033306 | MMRN2, SNCG | high |
| cg04499514 | FGFR1 | −0.5048488 | 0.00034622 | C3AR1 | high |
| cg07436701 | GRN | −0.5045134 | 0.0003499 | MMRN2, SNCG | high |
| cg18397405 | CD63 | 0.50108656 | 0.00038956 | GPC6 | high |
References
- Stupp, R.; Mason, W.P.; van den Bent, M.J.; Weller, M.; Fisher, B.; Taphoorn, M.J.; Belanger, K.; Brandes, A.A.; Marosi, C.; Bogdahn, U.; et al. Radiotherapy plus Concomitant and Adjuvant Temozolomide for Glioblastoma. N. Engl. J. Med. 2005, 352, 987–996. [Google Scholar] [CrossRef] [PubMed]
- Cloughesy, T.F.; Mochizuki, A.Y.; Orpilla, J.R.; Hugo, W.; Lee, A.H.; Davidson, T.B.; Wang, A.C.; Ellingson, B.M.; Rytlewski, J.A.; Sanders, C.M.; et al. Neoadjuvant anti-PD-1 immunotherapy promotes a survival benefit with intratumoral and systemic immune responses in recurrent glioblastoma. Nat. Med. 2019, 25, 477–486. [Google Scholar] [CrossRef]
- Bagley, S.J.; Desai, A.S.; Nasrallah, M.P.; O’Rourke, D.M. Immunotherapy and Response Assessment in Malignant Glioma: Neuro-oncology Perspective. Top. Magnetic Resonance Imag. TMRI 2020, 29, 95–102. [Google Scholar] [CrossRef]
- Schalper, K.A.; Rodriguez-Ruiz, M.E.; Diez-Valle, R.; López-Janeiro, A.; Porciuncula, A.; Idoate, M.A.; Inogés, S.; de Andrea, C.; López-Diaz de Cerio, A.; Tejada, S.; et al. Neoadjuvant nivolumab modifies the tumor immune microenvironment in resectable glioblastoma. Nat. Med. 2019, 25, 470–476. [Google Scholar] [CrossRef]
- Gieryng, A.; Pszczolkowska, D.; Walentynowicz, K.A.; Rajan, W.D.; Kaminska, B. Immune microenvironment of gliomas. Lab. Investig. 2017, 97, 498–518. [Google Scholar] [CrossRef] [Green Version]
- Glass, R.; Synowitz, M. CNS macrophages and peripheral myeloid cells in brain tumours. Acta Neuropathol. 2014, 128, 347–362. [Google Scholar] [CrossRef] [Green Version]
- Zhao, B.; Wang, Y.; Wang, Y.; Chen, W.; Liu, P.H.; Kong, Z.; Dai, C.; Wang, Y.; Ma, W. Systematic identification, development, and validation of prognostic biomarkers involving the tumor-immune microenvironment for glioblastoma. J. Cell. Physiol. 2020. [Google Scholar] [CrossRef]
- Wainwright, D.A.; Dey, M.; Chang, A.; Lesniak, M.S. Targeting Tregs in Malignant Brain Cancer: Overcoming IDO. Front. Immunol. 2013, 4. [Google Scholar] [CrossRef] [Green Version]
- Ye, X.Z.; Xu, S.L.; Xin, Y.H.; Yu, S.C.; Ping, Y.F.; Chen, L.; Xiao, H.L.; Wang, B.; Yi, L.; Wang, Q.L.; et al. Tumor-associated microglia/macrophages enhance the invasion of glioma stem-like cells via TGFBETA1 signaling pathway. J. Immunol. 2012, 189, 444–453. [Google Scholar] [CrossRef] [PubMed] [Green Version]
- Graeber, M.B.; Scheithauer, B.W.; Kreutzberg, G.W. Microglia in brain tumors. Glia 2002, 40, 252–259. [Google Scholar] [CrossRef] [PubMed]
- Grabowski, M.M.; Sankey, E.W.; Ryan, K.J.; Chongsathidkiet, P.; Lorrey, S.J.; Wilkinson, D.S.; Fecci, P.E. Immune suppression in gliomas. J. Neuro-Oncol. 2020. [Google Scholar] [CrossRef]
- Hambardzumyan, D.; Gutmann, D.H.; Kettenmann, H. The role of microglia and macrophages in glioma maintenance and progression. Nat. Neurosci. 2016, 19, 20–27. [Google Scholar] [CrossRef] [Green Version]
- Skytthe, M.K.; Graversen, J.H.; Moestrup, S.K. Targeting of CD163+ Macrophages in Inflammatory and Malignant Diseases. Int. J. Mol. Sci. 2020, 21, 5497. [Google Scholar] [CrossRef]
- Liu, S.; Zhang, C.; Maimela, N.R.; Yang, L.; Zhang, Z.; Ping, Y.; Huang, L.; Zhang, Y. Molecular and clinical characterization of CD163 expression via large-scale analysis in glioma. Oncoimmunology 2019, 8. [Google Scholar] [CrossRef]
- Ostuni, R.; Kratochvill, F.; Murray, P.J.; Natoli, G. Macrophages and cancer: From mechanisms to therapeutic implications. Trends Immunol. 2015, 36, 229–239. [Google Scholar] [CrossRef]
- Yang, L.; Zhang, Y. Tumor-associated macrophages: From basic research to clinical application. J. Hematol. Oncol. 2017, 10, 58. [Google Scholar] [CrossRef] [PubMed] [Green Version]
- Ferrer, V.P.; Moura Neto, V.; Mentlein, R. Glioma infiltration and extracellular matrix: Key players and modulators. Glia 2018, 66, 1542–1565. [Google Scholar] [CrossRef]
- Thorsson, V.; Gibbs, D.L.; Brown, S.D.; Wolf, D.; Bortone, D.S.; Ou Yang, T.H.; Porta-Pardo, E.; Gao, G.F.; Plaisier, C.L.; Eddy, J.A.; et al. The Immune Landscape of Cancer. Immunity 2018, 48, 812–830.e14. [Google Scholar] [CrossRef] [Green Version]
- Houseman, E.A.; Accomando, W.P.; Koestler, D.C.; Christensen, B.C.; Marsit, C.J.; Nelson, H.H.; Wiencke, J.K.; Kelsey, K.T. DNA methylation arrays as surrogate measures of cell mixture distribution. BMC Bioinf. 2012, 13, 86. [Google Scholar] [CrossRef] [Green Version]
- Moss, J.; Magenheim, J.; Neiman, D.; Zemmour, H.; Loyfer, N.; Korach, A.; Samet, Y.; Maoz, M.; Druid, H.; Arner, P.; et al. Comprehensive human cell-type methylation atlas reveals origins of circulating cell-free DNA in health and disease. Nat. Commun. 2018, 9, 5068. [Google Scholar] [CrossRef] [PubMed] [Green Version]
- Liu, B.; Liu, Y.; Pan, X.; Li, M.; Yang, S.; Li, S.C. DNA Methylation Markers for Pan-Cancer Prediction by Deep Learning. Genes 2019, 10, 778. [Google Scholar] [CrossRef] [Green Version]
- Noushmehr, H.; Sabedot, T.S.; Malta, T.M.; Nelson, K.; Snyder, J.; Wells, M.; deCarvalho, A.; Mukherjee, A.; Chitale, D.; Mosella, M.; et al. Detection of glioma and prognostic subtypes by non-invasive circulating cell-free DNA methylation markers. bioRxiv 2019, 601245. [Google Scholar] [CrossRef]
- Capper, D.; Jones, D.T.W.; Sill, M.; Hovestadt, V.; Schrimpf, D.; Sturm, D.; Koelsche, C.; Sahm, F.; Chavez, L.; Reuss, D.E.; et al. DNA methylation-based classification of central nervous system tumours. Nature 2018, 555, 469–474. [Google Scholar] [CrossRef]
- Rivera, A.L.; Pelloski, C.E.; Gilbert, M.R.; Colman, H.; De La Cruz, C.; Sulman, E.P.; Bekele, B.N.; Aldape, K.D. MGMT promoter methylation is predictive of response to radiotherapy and prognostic in the absence of adjuvant alkylating chemotherapy for glioblastoma. Neuro-Oncology 2010, 12, 116–121. [Google Scholar] [CrossRef]
- Oldrini, B.; Vaquero-Siguero, N.; Mu, Q.; Kroon, P.; Zhang, Y.; Galán-Ganga, M.; Bao, Z.; Wang, Z.; Liu, H.; Sa, J.K.; et al. MGMT genomic rearrangements contribute to chemotherapy resistance in gliomas. Nat. Commun. 2020, 11, 3883. [Google Scholar] [CrossRef] [PubMed]
- Zhang, M.W.; Fujiwara, K.; Che, X.; Zheng, S.; Zheng, L. DNA methylation in the tumor microenvironment. J. Zhejiang Univ. Sci. B 2017, 18, 365–372. [Google Scholar] [CrossRef] [PubMed] [Green Version]
- Cui, X.; Ma, C.; Vasudevaraja, V.; Serrano, J.; Tong, J.; Peng, Y.; Delorenzo, M.; Shen, G.; Frenster, J.; Morales, R.T.T.; et al. Dissecting the immunosuppressive tumor microenvironments in Glioblastoma-on-a-Chip for optimized PD-1 immunotherapy. eLife 2020, 9. [Google Scholar] [CrossRef] [PubMed]
- Dejaegher, J.; Solie, L.; Hunin, Z.; Sciot, R.; Capper, D.; Siewert, C.; Van Cauter, S.; Wilms, G.; van Loon, J.; Ectors, N.; et al. DNA methylation based glioblastoma subclassification is related to tumoral T-cell infiltration and patient survival. Neuro-Oncology 2020. [Google Scholar] [CrossRef]
- D’Angelo, F.; Ceccarelli, M.; Tala, N.; Garofano, L.; Zhang, J.; Frattini, V.; Caruso, F.P.; Lewis, G.; Alfaro, K.D.; Bauchet, L.; et al. The molecular landscape of glioma in patients with Neurofibromatosis 1. Nat. Med. 2019, 25, 176–187. [Google Scholar] [CrossRef]
- Bourgon, R.; Gentleman, R.; Huber, W. Independent filtering increases detection power for high-throughput experiments. Proc. Natl. Acad. Sci. USA 2010, 107, 9546–9551. [Google Scholar] [CrossRef] [Green Version]
- Sturm, G.; Finotello, F.; Petitprez, F.; Zhang, J.D.; Baumbach, J.; Fridman, W.H.; List, M.; Aneichyk, T. Comprehensive evaluation of transcriptome-based cell-type quantification methods for immuno-oncology. Bioinformatics (Oxford, England) 2019, 35, i436–i445. [Google Scholar] [CrossRef]
- Finotello, F.; Mayer, C.; Plattner, C.; Laschober, G.; Rieder, D.; Hackl, H.; Krogsdam, A.; Loncova, Z.; Posch, W.; Wilflingseder, D.; et al. Molecular and pharmacological modulators of the tumor immune contexture revealed by deconvolution of RNA-seq data. Genome Med. 2019, 11, 34. [Google Scholar] [CrossRef] [PubMed] [Green Version]
- Aran, D.; Hu, Z.; Butte, A.J. xCell: Digitally portraying the tissue cellular heterogeneity landscape. Genome Biol. 2017, 18, 1–14. [Google Scholar] [CrossRef] [PubMed] [Green Version]
- ImmuneSubtypeClassifier. Available online: https://github.com/CRI-iAtlas/ImmuneSubtypeClassifier (accessed on 27 July 2020).
- Polano, M.; Chierici, M.; Dal Bo, M.; Gentilini, D.; Di Cintio, F.; Baboci, L.; Gibbs, D.L.; Furlanello, C.; Toffoli, G. A Pan-Cancer Approach to Predict Responsiveness to Immune Checkpoint Inhibitors by Machine Learning. Cancers 2019, 11, 1562. [Google Scholar] [CrossRef] [Green Version]
- Langlois, B.; Saupe, F.; Rupp, T.; Arnold, C.; van der Heyden, M.; Orend, G.; Hussenet, T. AngioMatrix, a signature of the tumor angiogenic switch-specific matrisome, correlates with poor prognosis for glioma and colorectal cancer patients. Oncotarget 2014, 5, 10529–10545. [Google Scholar] [CrossRef] [PubMed] [Green Version]
- Zhao, J.; Chen, A.X.; Gartrell, R.D.; Silverman, A.M.; Aparicio, L.; Chu, T.; Bordbar, D.; Shan, D.; Samanamud, J.; Mahajan, A.; et al. Immune and genomic correlates of response to anti-PD-1 immunotherapy in glioblastoma. Nat. Med. 2019, 25, 462–469. [Google Scholar] [CrossRef] [PubMed]
- Hassn Mesrati, M.; Behrooz, A.B.; Y Abuhamad, A.; Syahir, A. Understanding Glioblastoma Biomarkers: Knocking a Mountain with a Hammer. Cells 2020, 9, 1236. [Google Scholar] [CrossRef]
- Zhao, Y.; Zhang, X.; Yao, J.; Jin, Z.; Liu, C. Expression patterns and the prognostic value of the EMILIN/Multimerin family members in low-grade glioma. PeerJ 2020, 8. [Google Scholar] [CrossRef]
- Degenhardt, F.; Seifert, S.; Szymczak, S. Evaluation of variable selection methods for random forests and omics data sets. Brief. Bioinf. 2017, 20, 492–503. [Google Scholar] [CrossRef] [Green Version]
- Vabalas, A.; Gowen, E.; Poliakoff, E.; Casson, A.J. Machine learning algorithm validation with a limited sample size. PLoS ONE 2019, 14, e0224365. [Google Scholar] [CrossRef]
- Matthews, B.W. Comparison of the predicted and observed secondary structure of T4 phage lysozyme. Bioch. Biophys. Acta 1975, 405, 442–451. [Google Scholar] [CrossRef]
- Shi, L.; Campbell, G.; Jones, W.D.; Campagne, F.; Wen, Z.; Walker, S.J.; Su, Z.; Chu, T.M.; Goodsaid, F.M.; Pusztai, L.; et al. The MicroArray Quality Control (MAQC)-II study of common practices for the development and validation of microarray-based predictive models. Nat. Biotechnol. 2010, 28, 827–838. [Google Scholar] [CrossRef]
- Boughorbel, S.; Jarray, F.; El-Anbari, M. Optimal classifier for imbalanced data using Matthews Correlation Coefficient metric. PLoS ONE 2017, 12, e0177678. [Google Scholar] [CrossRef]
- Sundjaja, J.H.; Shrestha, R.; Krishan, K. McNemar And Mann-Whitney U Tests. In StatPearls; Treasure Island: London, UK, 2020. [Google Scholar]
- Wang, H.; Li, G. A Selective Review on Random Survival Forests for High Dimensional Data. Quant. Bio-Sci. 2017, 36, 85–96. [Google Scholar] [CrossRef]
- Chai, R.C.; Zhang, K.N.; Chang, Y.Z.; Wu, F.; Liu, Y.Q.; Zhao, Z.; Wang, K.Y.; Chang, Y.H.; Jiang, T.; Wang, Y.Z. Systematically characterize the clinical and biological significances of 1p19q genes in 1p/19q non-codeletion glioma. Carcinogenesis 2019, 40, 1229–1239. [Google Scholar] [CrossRef]
- Chai, R.C.; Chang, Y.Z.; Wang, Q.W.; Zhang, K.N.; Li, J.J.; Huang, H.; Wu, F.; Liu, Y.Q.; Wang, Y.Z. A Novel DNA Methylation-Based Signature Can Predict the Responses of MGMT Promoter Unmethylated Glioblastomas to Temozolomide. Front. Genet. 2019, 10. [Google Scholar] [CrossRef] [PubMed] [Green Version]
- STRING v10: Protein-protein interaction networks, integrated over the tree of life. Nucleic Acids Res. 2015, 43, 1362–4962.
- Shannon, P.; Markiel, A.; Ozier, O.; Baliga, N.S.; Wang, J.T.; Ramage, D.; Amin, N.; Schwikowski, B.; Ideker, T. Cytoscape: A software environment for integrated models of biomolecular interaction networks. Genome Res. 2003, 13, 2498–2504. [Google Scholar] [CrossRef] [PubMed]
- Pedregosa, F.; Varoquaux, G.; Gramfort, A.; Michel, V.; Thirion, B.; Grisel, O.; Blondel, M.; Prettenhofer, P.; Weiss, R.; Dubourg, V.; et al. Scikit-learn: Machine Learning in Python. J. Mach. Learn. Res. 2011, 12, 2825–2830. [Google Scholar]
- Amankulor, N.M.; Kim, Y.; Arora, S.; Kargl, J.; Szulzewsky, F.; Hanke, M.; Margineantu, D.H.; Rao, A.; Bolouri, H.; Delrow, J.; et al. Mutant IDH1 regulates the tumor-associated immune system in gliomas. Genes Devel. 2017, 31, 774–786. [Google Scholar] [CrossRef] [Green Version]
- Jin, M.Z.; Jin, W.L. The updated landscape of tumor microenvironment and drug repurposing. Signal Transd. Target. Ther. 2020, 5, 1–16. [Google Scholar] [CrossRef] [PubMed]
- Vidyarthi, A.; Agnihotri, T.; Khan, N.; Singh, S.; Tewari, M.K.; Radotra, B.D.; Chatterjee, D.; Agrewala, J.N. Predominance of M2 macrophages in gliomas leads to the suppression of local and systemic immunity. Cancer Immunol. Immunother. CII 2019, 68, 1995–2004. [Google Scholar] [CrossRef] [PubMed]
- Razavi, S.M.; Lee, K.E.; Jin, B.E.; Aujla, P.S.; Gholamin, S.; Li, G. Immune Evasion Strategies of Glioblastoma. Front. Surg. 2016, 3. [Google Scholar] [CrossRef]
- Sonabend, A.M.; Rolle, C.E.; Lesniak, M.S. The role of regulatory T cells in malignant glioma. Anticancer Res. 2008, 28, 1143–1150. [Google Scholar]
- Pitroda, S.P.; Zhou, T.; Sweis, R.F.; Filippo, M.; Labay, E.; Beckett, M.A.; Mauceri, H.J.; Liang, H.; Darga, T.E.; Perakis, S.; et al. Tumor endothelial inflammation predicts clinical outcome in diverse human cancers. PLoS ONE 2012, 7, e46104. [Google Scholar] [CrossRef]
- Zhao, C.; Gomez, G.A.; Zhao, Y.; Yang, Y.; Cao, D.; Lu, J.; Yang, H.; Lin, S. ETV2 mediates endothelial transdifferentiation of glioblastoma. Signal Transd. Target. Ther. 2018, 3, 4. [Google Scholar] [CrossRef]
- Tormoen, G.W.; Crittenden, M.R.; Gough, M.J. Role of the immunosuppressive microenvironment in immunotherapy. Adv. Rad. Oncol. 2018, 3, 520–526. [Google Scholar] [CrossRef] [PubMed] [Green Version]
- Wiencke, J.K.; Koestler, D.C.; Salas, L.A.; Wiemels, J.L.; Roy, R.P.; Hansen, H.M.; Rice, T.; McCoy, L.S.; Bracci, P.M.; Molinaro, A.M.; et al. Immunomethylomic approach to explore the blood neutrophil lymphocyte ratio (NLR) in glioma survival. Clin. Epigenetics 2017, 9, 10. [Google Scholar] [CrossRef] [Green Version]
- Zou, J.P.; Morford, L.A.; Chougnet, C.; Dix, A.R.; Brooks, A.G.; Torres, N.; Shuman, J.D.; Coligan, J.E.; Brooks, W.H.; Roszman, T.L.; et al. Human Glioma-Induced Immunosuppression Involves Soluble Factor(s) That Alters Monocyte Cytokine Profile and Surface Markers. J. Immunol. 1999, 162, 4882–4892. [Google Scholar]
- Zhang, L.; Xu, Y.; Sun, J.; Chen, W.; Zhao, L.; Ma, C.; Wang, Q.; Sun, J.; Huang, B.; Zhang, Y.; et al. M2-like tumor-associated macrophages drive vasculogenic mimicry through amplification of IL-6 expression in glioma cells. Oncotarget 2016, 8, 819–832. [Google Scholar] [CrossRef] [Green Version]
- Hanaei, S.; Afshari, K.; Hirbod-Mobarakeh, A.; Mohajer, B.; Amir Dastmalchi, D.; Rezaei, N. Therapeutic efficacy of specific immunotherapy for glioma: A systematic review and meta-analysis. Rev. Neurosci. 2018, 29, 443–461. [Google Scholar] [CrossRef]
- Raudvere, U.; Kolberg, L.; Kuzmin, I.; Arak, T.; Adler, P.; Peterson, H.; Vilo, J. g:Profiler: A web server for functional enrichment analysis and conversions of gene lists (2019 update). Nucleic Acids Res. 2019, 47, W191–W198. [Google Scholar] [CrossRef] [PubMed] [Green Version]
- Weller, M.; Wick, W.; Aldape, K.; Brada, M.; Berger, M.; Pfister, S.M.; Nishikawa, R.; Rosenthal, M.; Wen, P.Y.; Stupp, R.; et al. Glioma. Nat. Rev. Disease Primers 2015, 1, 1–18. [Google Scholar] [CrossRef]
- Lombardi, G.; Barresi, V.; Castellano, A.; Tabouret, E.; Pasqualetti, F.; Salvalaggio, A.; Cerretti, G.; Caccese, M.; Padovan, M.; Zagonel, V.; et al. Clinical Management of Diffuse Low-Grade Gliomas. Cancers 2020, 12, 3008. [Google Scholar] [CrossRef] [PubMed]
- Roesch, S.; Rapp, C.; Dettling, S.; Herold-Mende, C. When Immune Cells Turn Bad-Tumor-Associated Microglia/Macrophages in Glioma. Int. J. Mol. Sci. 2018, 19, 436. [Google Scholar] [CrossRef] [PubMed] [Green Version]
- Quail, D.F.; Joyce, J.A. The Microenvironmental Landscape of Brain Tumors. Cancer Cell 2017, 31, 326–341. [Google Scholar] [CrossRef] [PubMed] [Green Version]
- Tang, Y.; Le, W. Differential Roles of M1 and M2 Microglia in Neurodegenerative Diseases. Mol. Neurobiol. 2016, 53, 1181–1194. [Google Scholar] [CrossRef]
- Prosniak, M.; Harshyne, L.A.; Andrews, D.W.; Kenyon, L.C.; Bedelbaeva, K.; Apanasovich, T.V.; Heber-Katz, E.; Curtis, M.T.; Cotzia, P.; Hooper, D.C. Glioma Grade Is Associated with the Accumulation and Activity of Cells Bearing M2 Monocyte Markers. Clin. Cancer Res. 2013, 19, 3776–3786. [Google Scholar] [CrossRef] [Green Version]
- Shabo, I.; Olsson, H.; Sun, X.F.; Svanvik, J. Expression of the macrophage antigen CD163 in rectal cancer cells is associated with early local recurrence and reduced survival time. Int. J. Cancer 2009, 125, 1826–1831. [Google Scholar] [CrossRef]
- Zheng, C.; Xu, R. Predicting cancer origins with a DNA methylation-based deep neural network model. PLoS ONE 2020, 15, e0226461. [Google Scholar] [CrossRef]


| Cohort | Cancer Type | Cases | Cases Flagged as EDISON Positive |
|---|---|---|---|
| LGG | Brain lower grade glioma | 506 | 271 |
| GBM | Glioblastoma multiforme | 47 | 10 |
| Dataset | CpG Count |
|---|---|
| AllCpGs | 355,314 |
| ImmuneAngioICIs | 6368 |
| ImmuneAngioICIsMesECM | 6754 |
| AllCpGs + BORUTA | 3554 |
| ImmuneAngioICIs + BORUTA | 512 |
| ImmuneAngioICIsMesECM + BORUTA | 338 |
| Endpoint | Status | Number of Samples | HR | 95% CI for HR | p Value |
|---|---|---|---|---|---|
| OS | EDISON+ | n = 553 | 0.55 | 0.39–0.77 | <0.01 |
| PFI | EDISON+ | n = 553 | 0.57 | 0.43–0.75 | <0.01 |
| Dataset | ACC CV (CI) | ACC Test | MCC CV (CI) | MCC Test |
|---|---|---|---|---|
| AllCpGs | 0.713 (0.676–0.747) | 0.756 | 0.435 (0.359–0.502) | 0.538 |
| ImmuneAngioICIs | 0.7155 (0.679–0.754) | 0.716 | 0.436 (0.368–0.512) | 0.523 |
| ImmuneAngioICIsMesECM | 0.710 (0.674–0.748) | 0.739 | 0.429 (0.354–0.504) | 0.490 |
| AllCpGs + BORUTA | 0.736 (0.699–0.770) | 0.755 | 0.478 (0.404–0.547) | 0.532 |
| ImmuneAngioICIs + BORUTA | 0.717 (0.681–0.752) | 0.729 | 0.443 (0.373–0.511) | 0.469 |
| ImmuneAngioICIsMesECM + BORUTA | 0.747 (0.713–0.780) | 0.793 | 0.498 (0.432–0.563) | 0.589 |
| Model | ACC CV (CI) | ACC Test | MCC CV (CI) | MCC Test |
|---|---|---|---|---|
| RF | 0.747 (0.713–0.780) | 0.793 | 0.498 (0.432–0.563) | 0.589 |
| MLP | 0.807 (0.795–0.819) | 0.828 | 0.625 (0.601–0.647) | 0.657 |
| #Term ID | Term Description | Observed Gene Count | Background Gene Count | Strength | False Discovery Rate |
|---|---|---|---|---|---|
| GO:0030198 | extracellular matrix organization | 31 | 296 | 1.14 | |
| GO:0006955 | immune response | 43 | 1560 | 0.56 | |
| GO:0002376 | immune system process | 49 | 2370 | 0.43 | |
| GO:0030155 | regulation of cell adhesion | 23 | 623 | 0.68 | |
| GO:0048514 | blood vessel morphogenesis | 18 | 381 | 0.79 | |
| GO:0001568 | blood vessel development | 19 | 464 | 0.73 | |
| GO:0007155 | cell adhesion | 25 | 843 | 0.59 | |
| GO:0009653 | anatomical structure morphogenesis | 40 | 1992 | 0.42 | |
| GO:0001525 | angiogenesis | 15 | 297 | 0.82 | |
| GO:0035239 | tube morphogenesis | 21 | 615 | 0.65 | |
| GO:0048583 | regulation of response to stimulus | 59 | 3882 | 0.3 | |
| GO:0010033 | response to organic substance | 48 | 2815 | 0.35 | |
| GO:0035295 | tube development | 23 | 793 | 0.58 | |
| GO:0002684 | positive regulation of immune system process | 24 | 882 | 0.55 | |
| GO:0071310 | cellular response to organic substance | 40 | 2219 | 0.37 | |
| GO:2000026 | regulation of multicellular organismal development | 36 | 1876 | 0.4 | |
| GO:0007492 | endoderm development | 8 | 76 | 1.14 | |
| GO:0050896 | response to stimulus | 91 | 7824 | 0.18 | |
| GO:0050776 | regulation of immune response | 23 | 873 | 0.54 | |
| GO:0045765 | regulation of angiogenesis | 13 | 277 | 0.79 | |
| GO:0045321 | leukocyte activation | 23 | 894 | 0.53 | |
| GO:0002443 | leukocyte mediated immunity | 19 | 632 | 0.59 | |
| GO:0070887 | cellular response to chemical stimulus | 44 | 2672 | 0.33 | |
| GO:0002274 | myeloid leukocyte activation | 18 | 574 | 0.61 | |
| GO:0010757 | negative regulation of plasminogen activation | 4 | 6 | 1.94 | |
| GO:0051239 | regulation of multicellular organismal process | 45 | 2788 | 0.32 | |
| GO:0002682 | regulation of immune system process | 29 | 1391 | 0.43 | |
| GO:0006027 | glycosaminoglycan catabolic process | 7 | 62 | 1.17 | |
| GO:0050778 | positive regulation of immune response | 18 | 589 | 0.6 |
Publisher’s Note: MDPI stays neutral with regard to jurisdictional claims in published maps and institutional affiliations. |
© 2021 by the authors. Licensee MDPI, Basel, Switzerland. This article is an open access article distributed under the terms and conditions of the Creative Commons Attribution (CC BY) license (http://creativecommons.org/licenses/by/4.0/).
Share and Cite
Polano, M.; Fabbiani, E.; Andreuzzi, E.; Cintio, F.D.; Bedon, L.; Gentilini, D.; Mongiat, M.; Ius, T.; Arcicasa, M.; Skrap, M.; et al. A New Epigenetic Model to Stratify Glioma Patients According to Their Immunosuppressive State. Cells 2021, 10, 576. https://0-doi-org.brum.beds.ac.uk/10.3390/cells10030576
Polano M, Fabbiani E, Andreuzzi E, Cintio FD, Bedon L, Gentilini D, Mongiat M, Ius T, Arcicasa M, Skrap M, et al. A New Epigenetic Model to Stratify Glioma Patients According to Their Immunosuppressive State. Cells. 2021; 10(3):576. https://0-doi-org.brum.beds.ac.uk/10.3390/cells10030576
Chicago/Turabian StylePolano, Maurizio, Emanuele Fabbiani, Eva Andreuzzi, Federica Di Cintio, Luca Bedon, Davide Gentilini, Maurizio Mongiat, Tamara Ius, Mauro Arcicasa, Miran Skrap, and et al. 2021. "A New Epigenetic Model to Stratify Glioma Patients According to Their Immunosuppressive State" Cells 10, no. 3: 576. https://0-doi-org.brum.beds.ac.uk/10.3390/cells10030576