
Long Non-Coding RNAs Involved in Progression of Non-Alcoholic Fatty Liver Disease to Steatohepatitis

 , , and
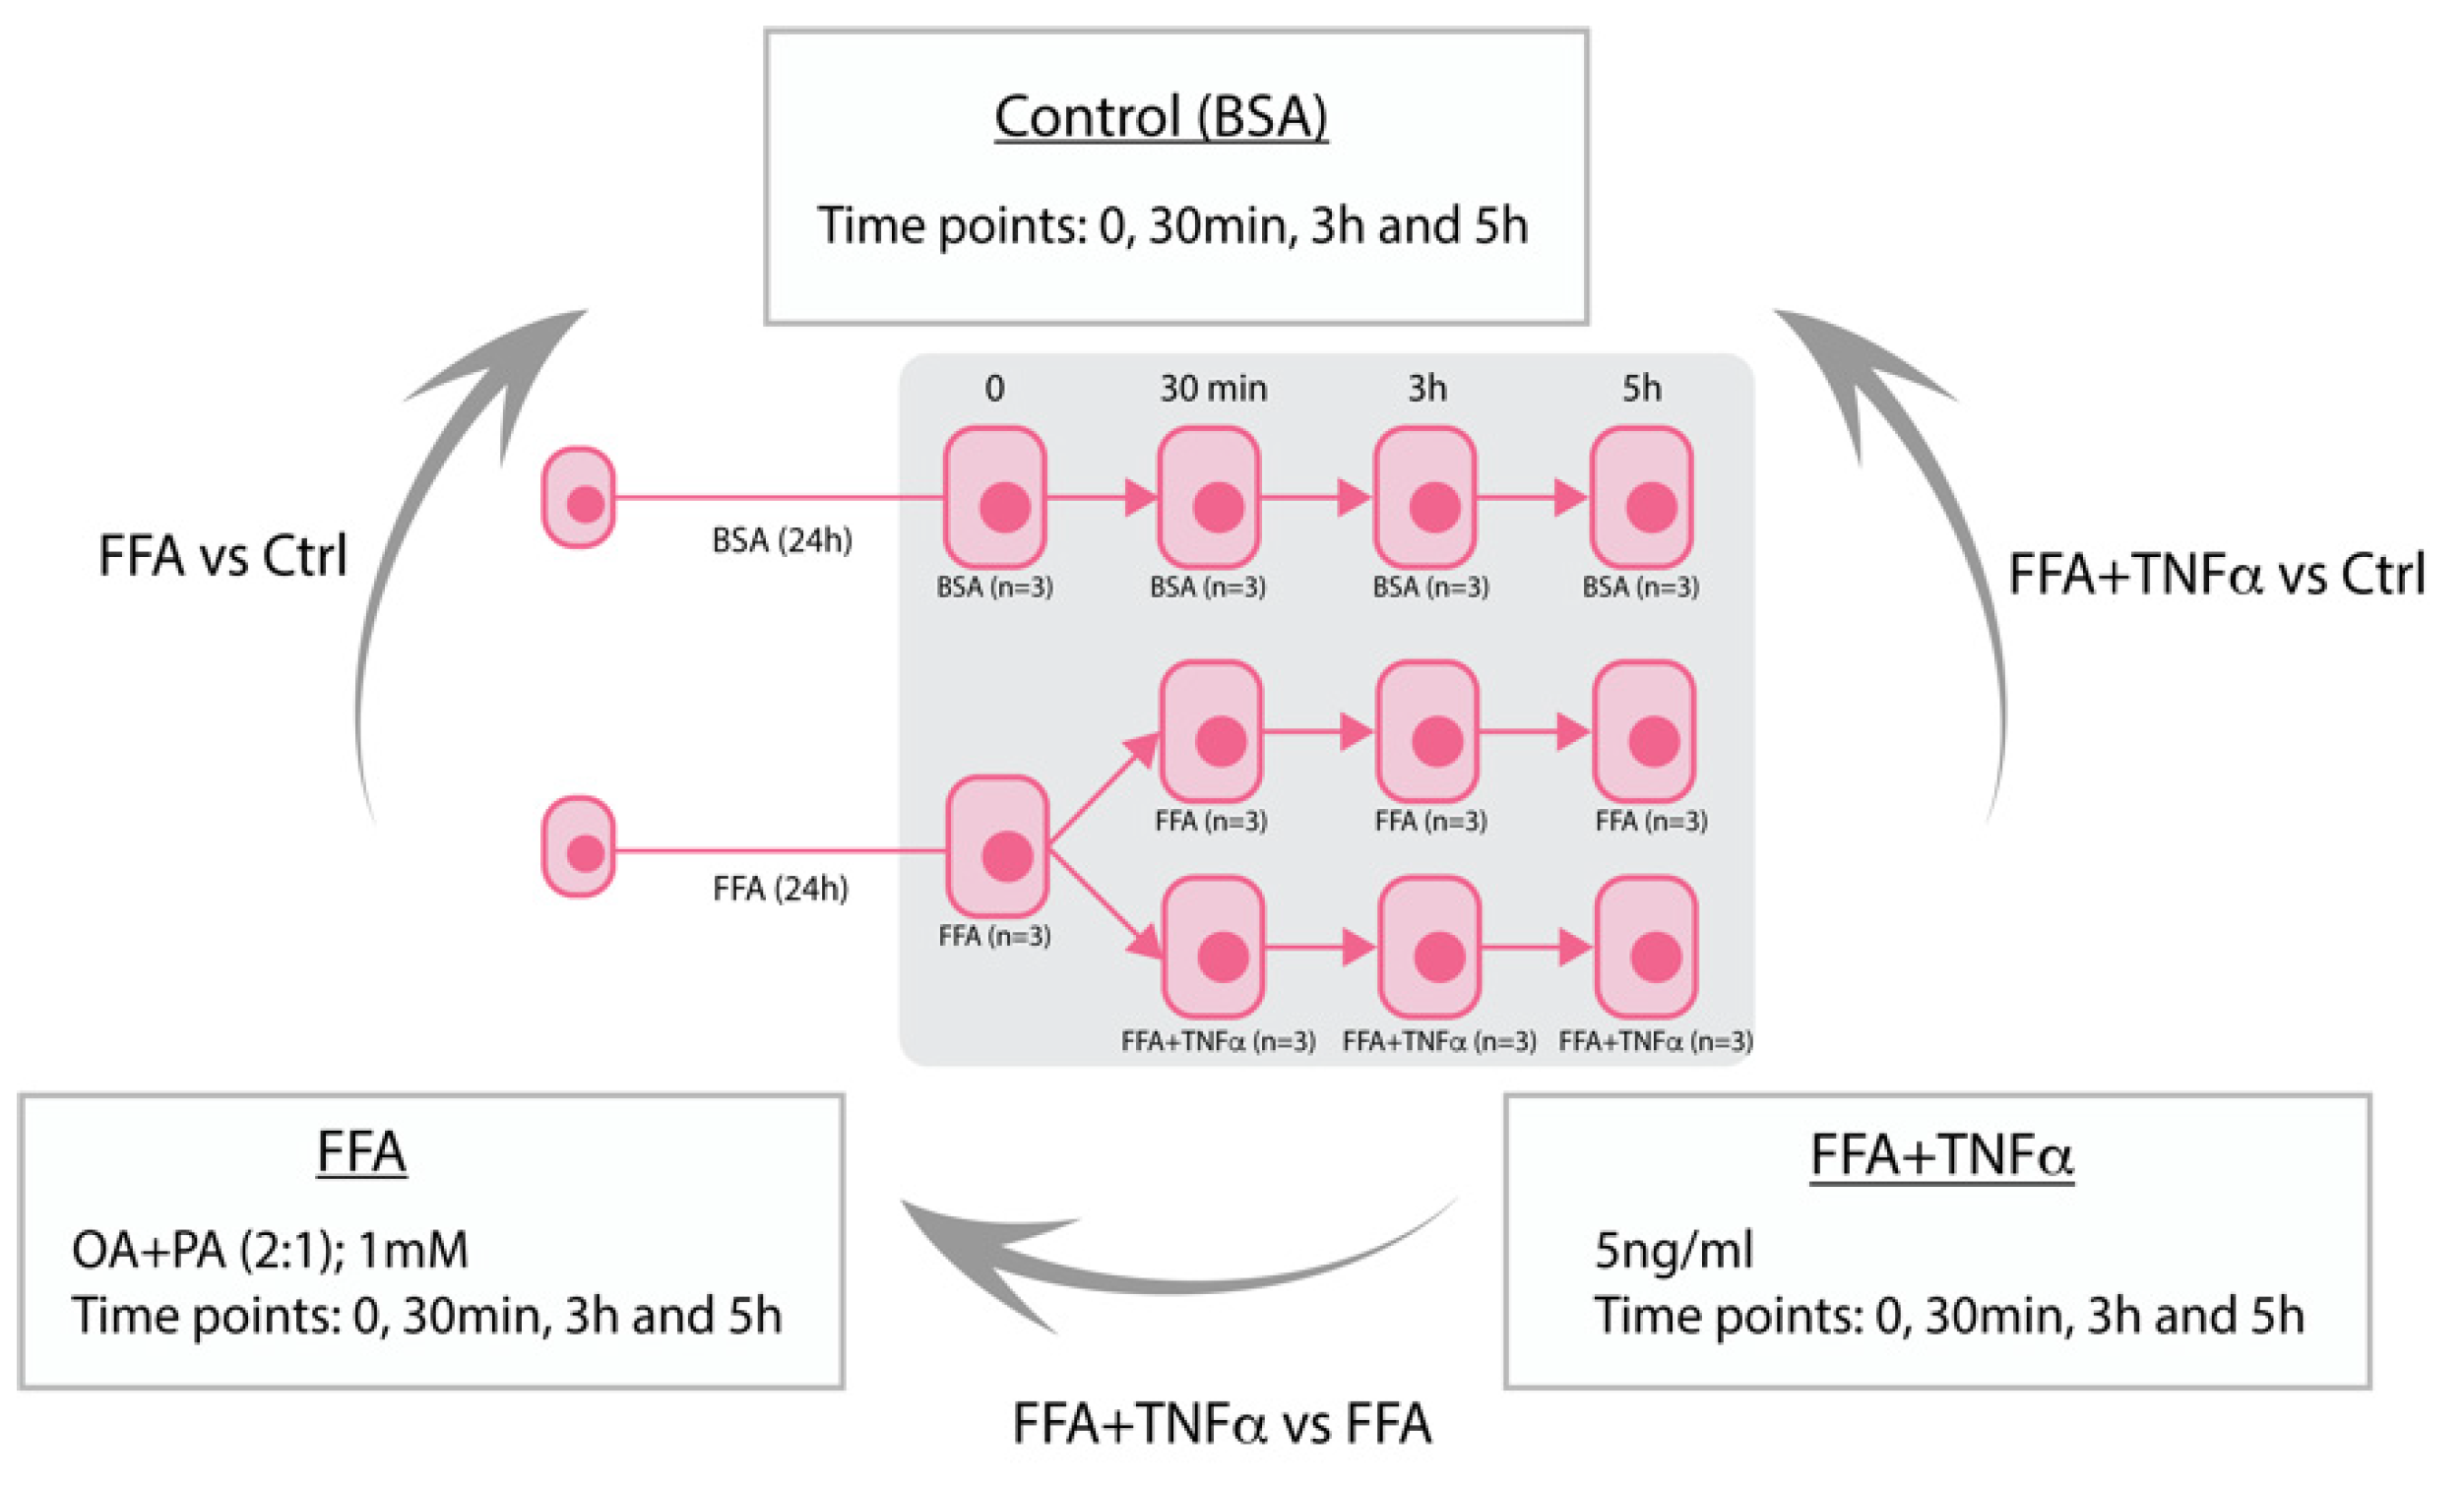
Abstract
:1. Introduction
2. Materials and Methods
2.1. Cell Culture and Stimulation Experiments
2.2. Oil Red O Staining
2.3. RNA Sequencing of Hepatocyte Cell Lines
2.4. RNA Sequencing of Human Liver Samples
2.5. Correlation of lncRNA Expression Profiles with NASH Phenotypes
2.6. Recombinant Adenovirus Ad5IκB and Viral Infection
2.7. lncTNF Knockdown
2.8. Cytoplasmic/Nuclear Fractionation
2.9. RNA Isolation, cDNA Generation, and qRT-PCR Experiments
2.10. Dual Luciferase Reporter Assay for Measurement of NF-κB Activity
3. Results
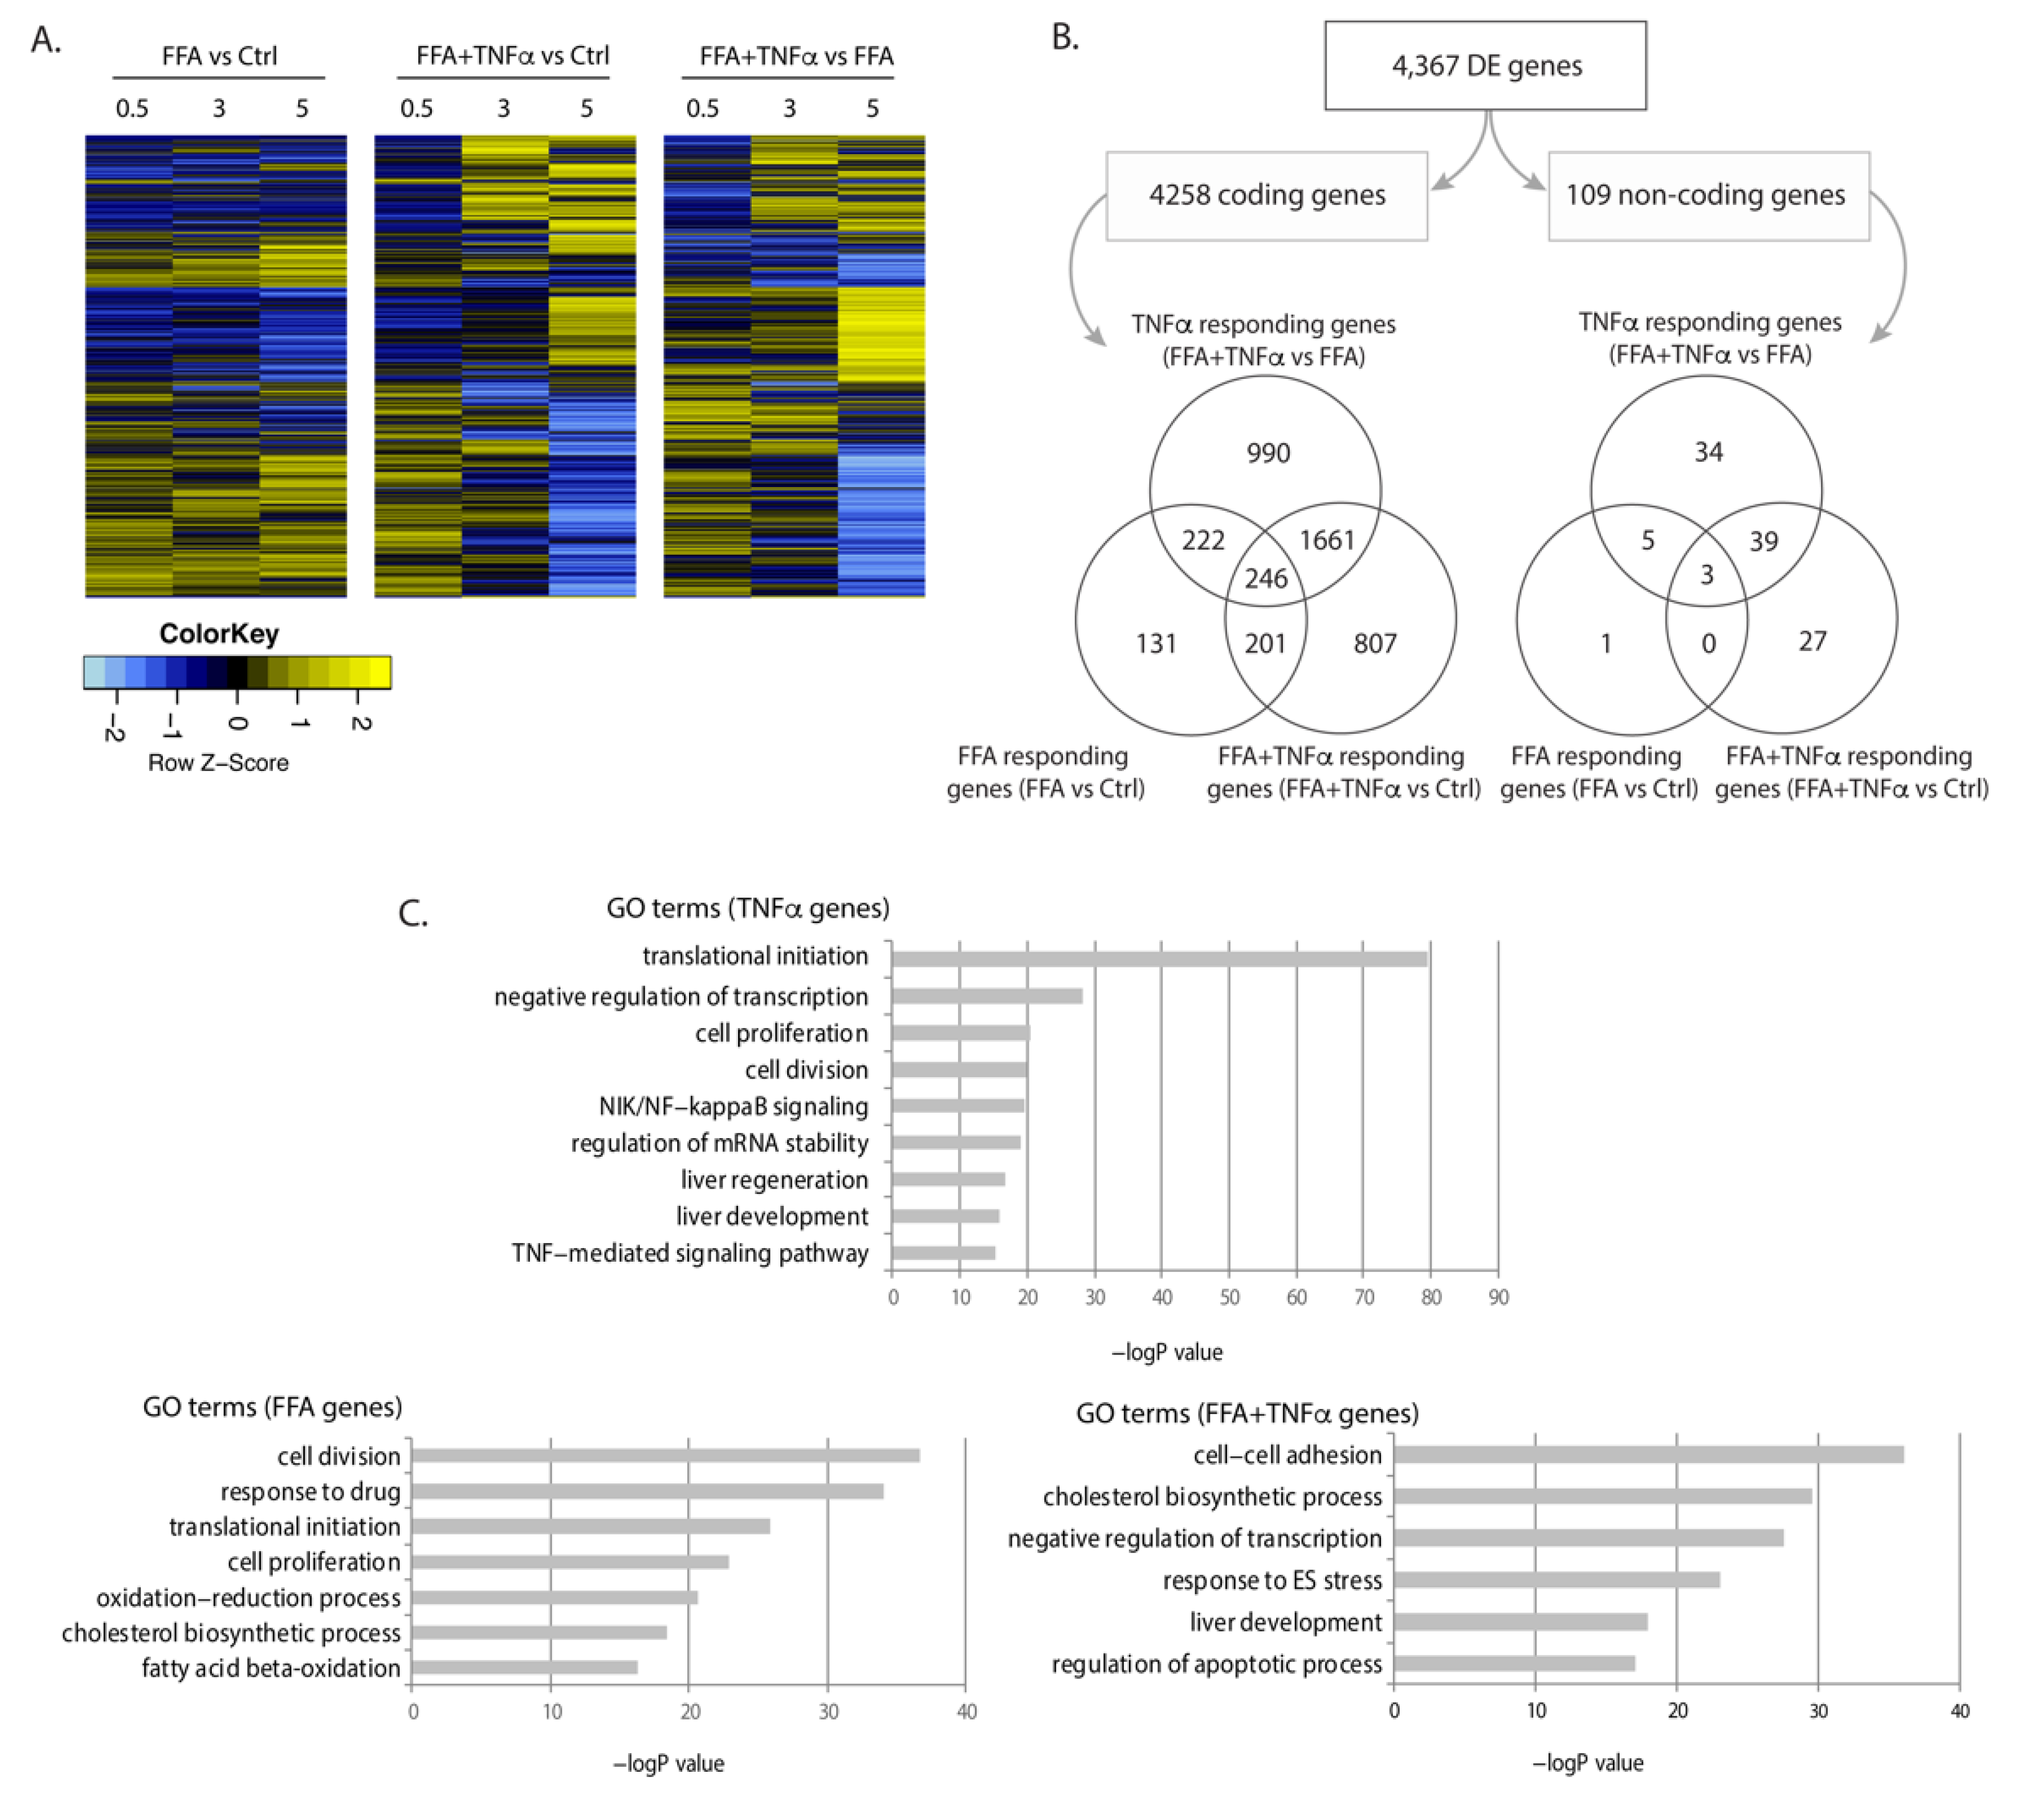
3.1. Identification of Differentially Expressed Genes and lncRNAs in Stimulated Conditions
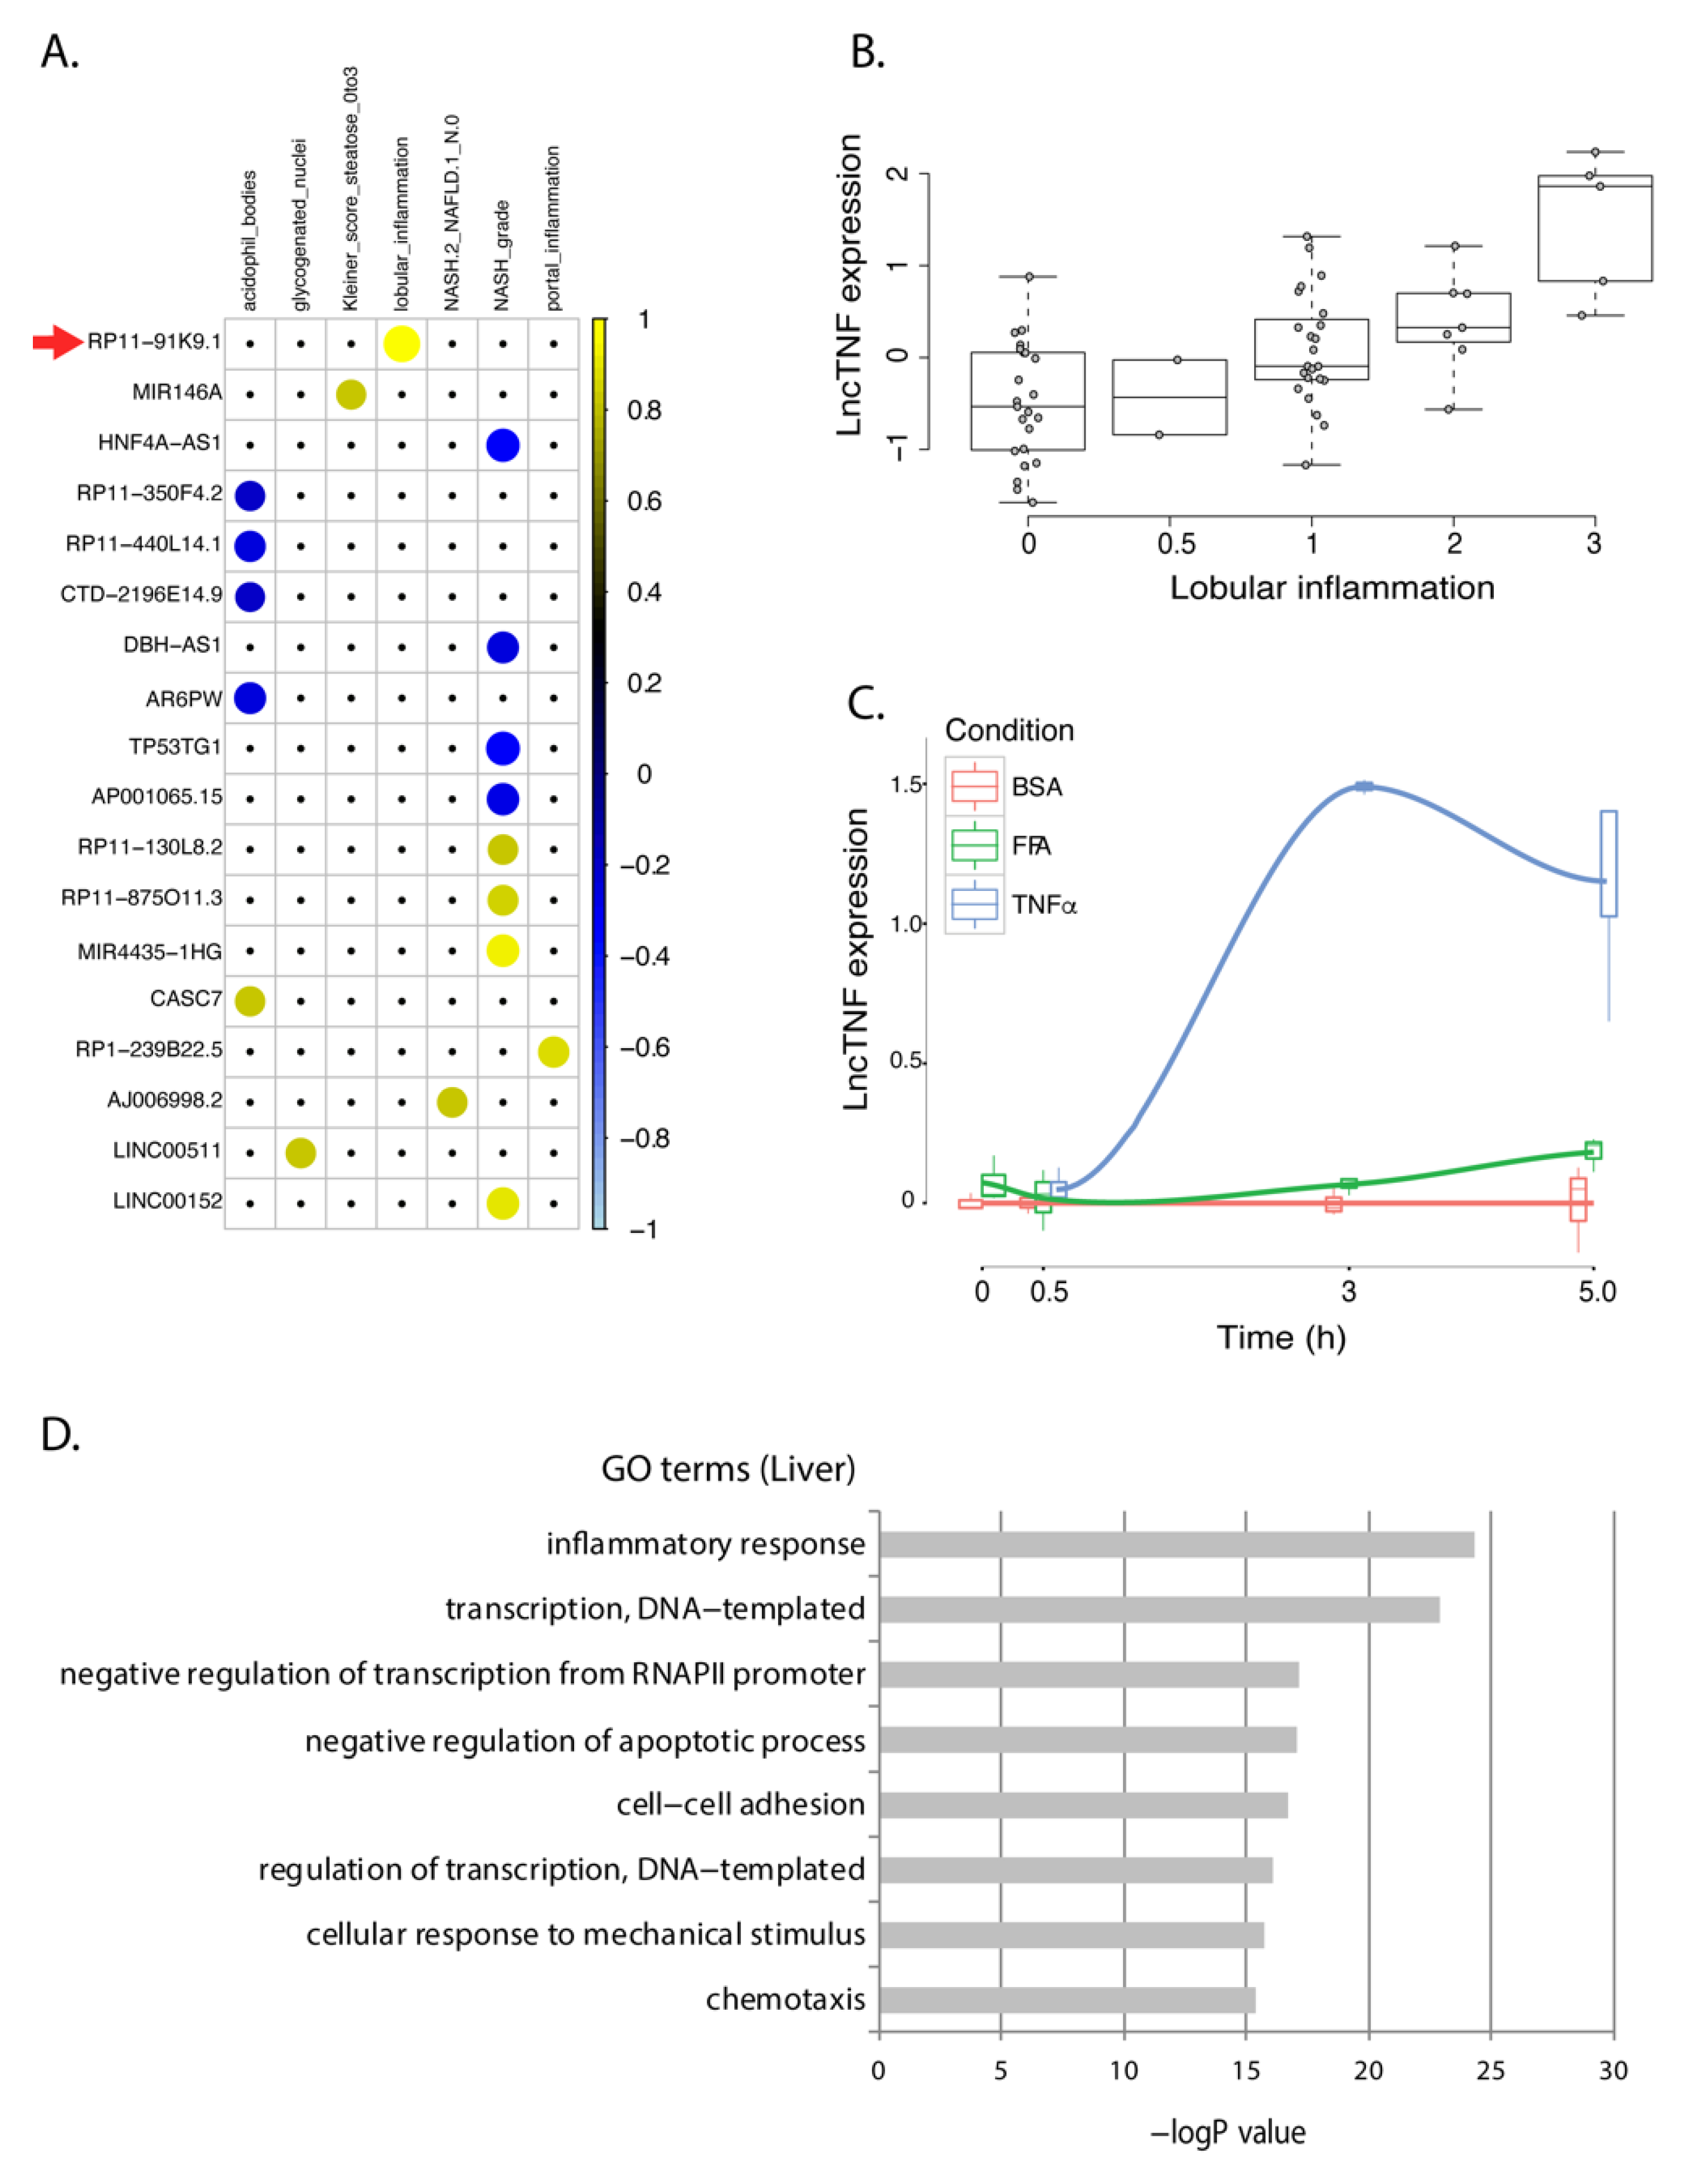
3.2. Association of Differentially Expressed Genes with Human NASH
3.3. lncTNF: A Novel lncRNA Involved in Liver Inflammation
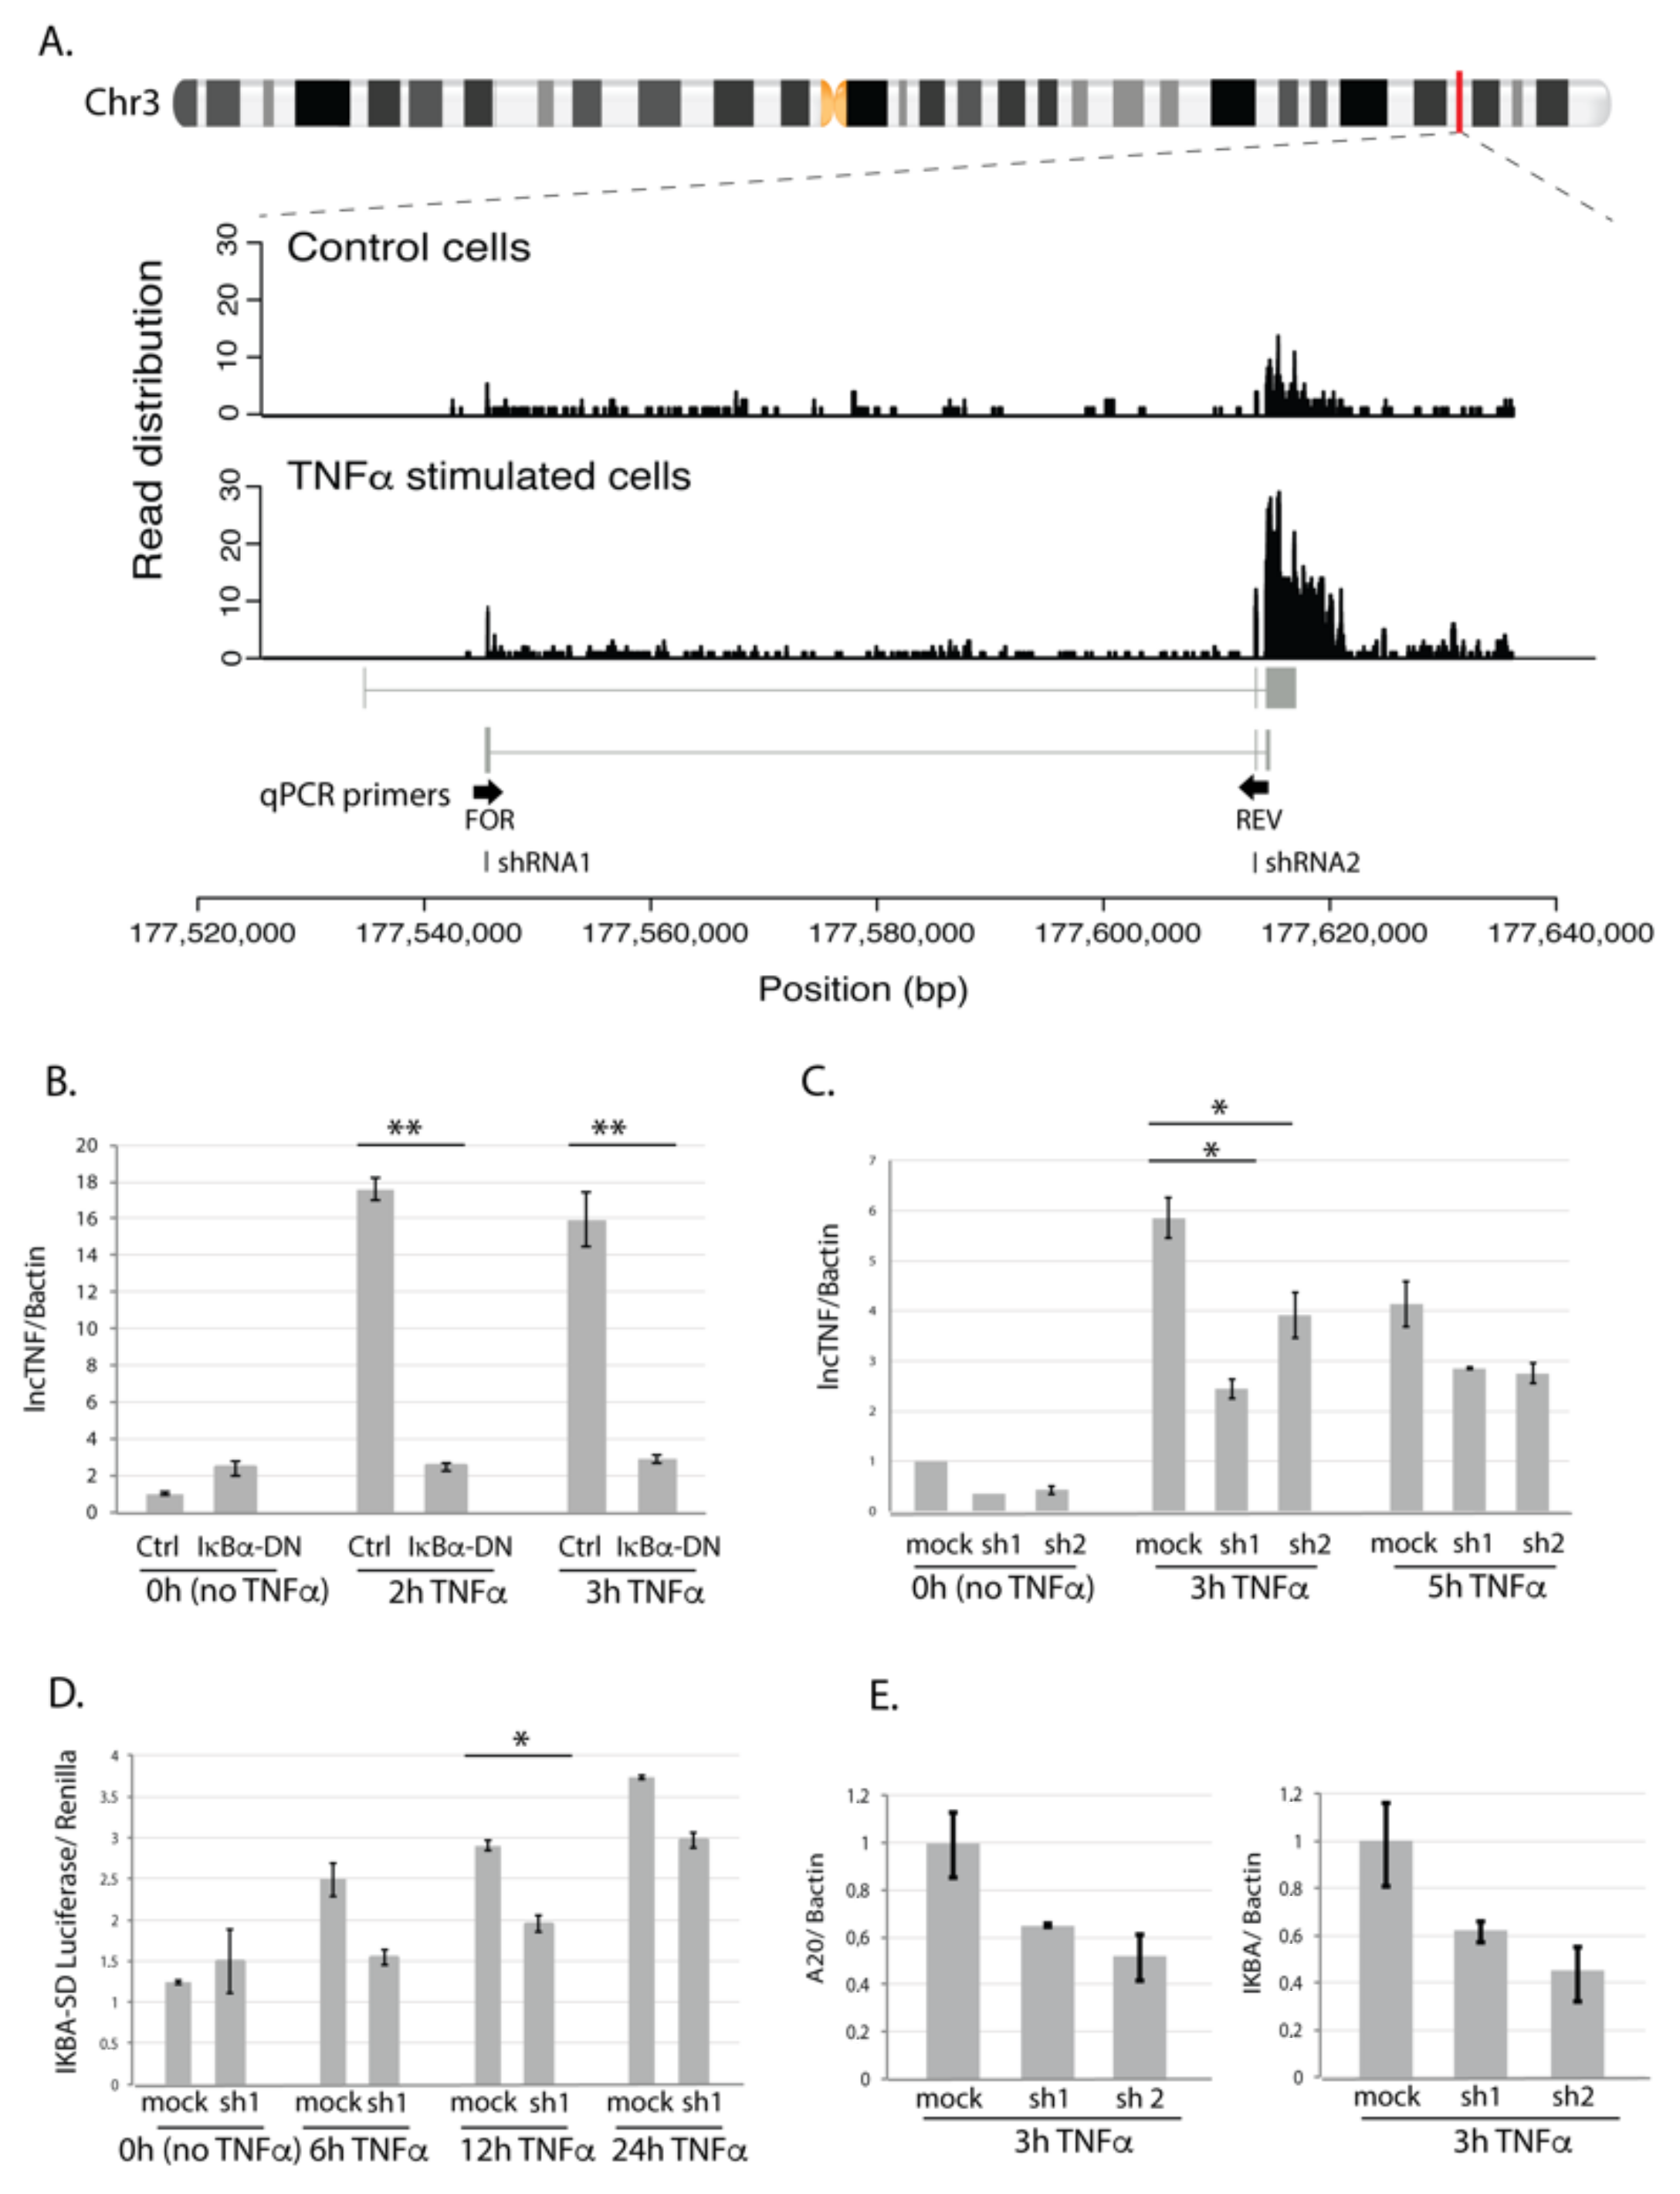
3.4. lncTNF Is Activated by NF-κB
4. Discussion
5. Conclusions
Supplementary Materials
Author Contributions
Funding
Institutional Review Board Statement
Informed Consent Statement
Data Availability Statement
Acknowledgments
Conflicts of Interest
References
- Day, C.P.; James, O.F.W. Steatohepatitis: A tale of two “hits”? Gastroenterology 1998, 842–845. [Google Scholar] [CrossRef]
- Yeh, M.M.; Brunt, E.M. Pathology of Nonalcoholic Fatty Liver Disease. Am. J. Clin. Pathol. 2007, 128, 837–847. [Google Scholar] [CrossRef] [PubMed]
- Alkhouri, N.; Dixon, L.J.; Feldstein, A.E. Lipotoxicity in Nonalcoholic Fatty Liver Disease: Not All Lipids Are Created Equal. Expert Rev. Gastroenterol. Hepatol. 2009, 3, 445–451. [Google Scholar] [CrossRef] [PubMed] [Green Version]
- Neuschwander-Tetri, B.A. Hepatic Lipotoxicity and the Pathogenesis of Nonalcoholic Steatohepatitis: The Central Role of Nontriglyceride Fatty Acid Metabolites. Hepatology 2010, 52, 774–788. [Google Scholar] [CrossRef] [PubMed]
- Haybaeck, J.; Zeller, N.; Wolf, M.J.; Weber, A.; Wagner, U.; Kurrer, M.O.; Bremer, J.; Iezzi, G.; Graf, R.; Clavien, P.-A.; et al. A Lymphotoxin-Driven Pathway to Hepatocellular Carcinoma. Cancer Cell 2009, 16, 295–308. [Google Scholar] [CrossRef] [PubMed] [Green Version]
- Lebensztejn, D.M.; Flisiak-Jackiewicz, M.; Bialokoz-Kalinowska, I.; Bobrus-Chociej, A.; Kowalska, I. Hepatokines and Non-Alcoholic Fatty Liver Disease. Acta Biochim. Pol. 2016, 63, 459–467. [Google Scholar] [CrossRef] [Green Version]
- Maher, J.J.; Leon, P.; Ryan, J.C. Beyond Insulin Resistance: Innate Immunity in Nonalcoholic Steatohepatitis. Hepatol. (Baltim. Md.) 2008, 48, 670–678. [Google Scholar] [CrossRef] [Green Version]
- Bertot, L.C.; Adams, L.A. The Natural Course of Non-Alcoholic Fatty Liver Disease. Int. J. Mol. Sci. 2016, 17, 774. [Google Scholar] [CrossRef] [Green Version]
- Bussotti, G.; Notredame, C.; Enright, A.J. Detecting and Comparing Non-Coding RNAs in the High-Throughput Era. Int. J. Mol. Sci. 2013, 14, 15423–15458. [Google Scholar] [CrossRef] [PubMed] [Green Version]
- Derrien, T.; Johnson, R.; Bussotti, G.; Tanzer, A.; Djebali, S.; Tilgner, H.; Guernec, G.; Merkel, A.; Gonzalez, D.; Lagarde, J.; et al. The GENCODE v7 Catalogue of Human Long Non-Coding RNAs: Analysis of Their Structure, Evolution and Expression. Genome Res. 2012, 22, 1775–1789. [Google Scholar] [CrossRef] [Green Version]
- Zhao, Y.; Wu, J.; Liangpunsakul, S.; Wang, L. Long Non-Coding RNA in Liver Metabolism and Disease: Current Status. Liver Res. 2017, 136, 629–641. [Google Scholar] [CrossRef]
- Atanasovska, B.; Rensen, S.S.; van der Sijde, M.R.; Marsman, G.; Kumar, V.; Jonkers, I.; Withoff, S.; Shiri-Sverdlov, R.; Greve, J.W.M.; Faber, K.N.; et al. A Liver-Specific Long Non-Coding RNA with a Role in Cell Viability Is Elevated in Human Non-Alcoholic Steatohepatitis. Hepatol. (Baltim. Md.) 2017, 34, 67–79. [Google Scholar] [CrossRef]
- Dobin, A.; Davis, C.A.; Schlesinger, F.; Drenkow, J.; Zaleski, C.; Jha, S.; Batut, P.; Chaisson, M.; Gingeras, T.R. STAR: Ultrafast Universal RNA-Seq Aligner. Bioinformatics 2013, 29, 15–21. [Google Scholar] [CrossRef] [PubMed]
- Love, M.I.; Huber, W.; Anders, S. Moderated Estimation of Fold Change and Dispersion for RNA-Seq Data with DESeq2. Genome Biol. 2014, 15. [Google Scholar] [CrossRef] [PubMed] [Green Version]
- Huang, D.W.; Lempicki, R.A.; Sherman, B.T. Systematic and Integrative Analysis of Large Gene Lists Using DAVID Bioinformatics Resources. Nat. Protoc. 2009, 4, 44–57. [Google Scholar] [CrossRef]
- Fu, J.; Wolfs, M.G.M.; Deelen, P.; Westra, H.-J.; Fehrmann, R.S.N.; te Meerman, G.J.; Buurman, W.A.; Rensen, S.S.M.; Groen, H.J.M.; Weersma, R.K.; et al. Unraveling the Regulatory Mechanisms Underlying Tissue-Dependent Genetic Variation of Gene Expression. PLoS Genet. 2012, 8, e1002431. [Google Scholar] [CrossRef] [PubMed] [Green Version]
- Wolfs, M.G.M.; Rensen, S.S.; Bruin-Van Dijk, E.J.; Verdam, F.J.; Greve, J.-W.; Sanjabi, B.; Bruinenberg, M.; Wijmenga, C.; van Haeften, T.W.; Buurman, W.A.; et al. Co-Expressed Immune and Metabolic Genes in Visceral and Subcutaneous Adipose Tissue from Severely Obese Individuals Are Associated with Plasma HDL and Glucose Levels: A Microarray Study. BMC Med. Genom. 2010, 3, 34. [Google Scholar] [CrossRef] [PubMed] [Green Version]
- Kim, D.; Pertea, G.; Trapnell, C.; Pimentel, H.; Kelley, R.; Salzberg, S.L. TopHat2: Accurate Alignment of Transcriptomes in the Presence of Insertions, Deletions and Gene Fusions. Genome Biol. 2013, 14. [Google Scholar] [CrossRef] [PubMed] [Green Version]
- Iimuro, Y.; Nishiura, T.; Hellerbrand, C.; Behrns, K.E.; Schoonhoven, R.; Grisham, J.W.; Brenner, D.A. NFkappaB Prevents Apoptosis and Liver Dysfunction during Liver Regeneration. J. Clin. Investig. 1998, 101, 802–811. [Google Scholar] [CrossRef] [PubMed] [Green Version]
- Available online: http://sirna.wi.mit.edu (accessed on 15 February 2017).
- Moffat, J.; Grueneberg, D.A.; Yang, X.; Kim, S.Y.; Kloepfer, A.M.; Hinkle, G.; Piqani, B.; Eisenhaure, T.M.; Luo, B.; Grenier, J.K.; et al. A Lentiviral RNAi Library for Human and Mouse Genes Applied to an Arrayed Viral High-Content Screen. Cell 2006, 124, 1283–1298. [Google Scholar] [CrossRef] [PubMed] [Green Version]
- Duckett, C.S.; Gedrich, R.W.; Gilfillan, M.C.; Thompson, C.B. Induction of Nuclear Factor KB by the CD30 Receptor Is Mediated by TRAF1 and TRAF2. Mol. Cell Biol 1997, 17, 1535–1542. [Google Scholar] [CrossRef] [PubMed] [Green Version]
- Silva, A.K.S.; Peixoto, C.A. Role of Peroxisome Proliferator-Activated Receptors in Non-Alcoholic Fatty Liver Disease Inflammation. Cell. Mol. Life Sci. 2018, 75, 2951–2961. [Google Scholar] [CrossRef] [PubMed]
- Abdelmegeed, M.A.; Yoo, S.-H.; Henderson, L.E.; Gonzalez, F.J.; Woodcroft, K.J.; Song, B.-J. PPAR Expression Protects Male Mice from High Fat-Induced Nonalcoholic Fatty Liver. J. Nutr. 2011, 141, 603–610. [Google Scholar] [CrossRef]
- Naik, A.; Košir, R.; Rozman, D. Genomic Aspects of NAFLD Pathogenesis. Genomics 2013, 102, 84–95. [Google Scholar] [CrossRef] [Green Version]
- Ryaboshapkina, M.; Hammar, M. Human Hepatic Gene Expression Signature of Non-Alcoholic Fatty Liver Disease Progression, a Meta-Analysis. Sci. Rep. 2017, 7. [Google Scholar] [CrossRef]
- Deelen, P.; van Dam, S.; Herkert, J.C.; Karjalainen, J.M.; Brugge, H.; Abbott, K.M.; van Diemen, C.C.; van der Zwaag, P.A.; Gerkes, E.H.; Folkertsma, P.; et al. Improving the Diagnostic Yield of Exome-Sequencing, by Predicting Gene-Phenotype Associations Using Large-Scale Gene Expression Analysis. bioRxiv 2018, 375766. [Google Scholar] [CrossRef] [Green Version]
- Ju, U.-I.; Jeong, D.-W.; Seo, J.; Park, J.B.; Park, J.-W.; Suh, K.-S.; Kim, J.B.; Chun, Y.-S. Neddylation of Sterol Regulatory Element-Binding Protein 1c Is a Potential Therapeutic Target for Nonalcoholic Fatty Liver Treatment. Cell Death Dis. 2020, 11, 283. [Google Scholar] [CrossRef] [Green Version]
- Hirsova, P.; Gores, G.J. Death Receptor-Mediated Cell Death and Proinflammatory Signaling in Nonalcoholic Steatohepatitis. Cell. Mol. Gastroenterol. Hepatol. 2015, 1, 17–27. [Google Scholar] [CrossRef] [PubMed] [Green Version]
- Liu, J.; Han, L.; Zhu, L.; Yu, Y. Free Fatty Acids, Not Triglycerides, Are Associated with Non-Alcoholic Liver Injury Progression in High Fat Diet Induced Obese Rats. Lipids Health Dis. 2016, 15. [Google Scholar] [CrossRef] [PubMed] [Green Version]
- Magee, N.; Zou, A.; Zhang, Y. Pathogenesis of Nonalcoholic Steatohepatitis: Interactions between Liver Parenchymal and Nonparenchymal Cells. BioMed Res. Int. 2016, 2016, 5170402. [Google Scholar] [CrossRef] [PubMed] [Green Version]
- Zhang, X.-Q.; Xu, C.-F.; Yu, C.-H.; Chen, W.-X.; Li, Y.-M. Role of Endoplasmic Reticulum Stress in the Pathogenesis of Nonalcoholic Fatty Liver Disease. World J. Gastroenterol. 2014, 20, 1768–1776. [Google Scholar] [CrossRef] [PubMed]
- Lake, A.D.; Novak, P.; Hardwick, R.N.; Flores-Keown, B.; Zhao, F.; Klimecki, W.T.; Cherrington, N.J. The Adaptive Endoplasmic Reticulum Stress Response to Lipotoxicity in Progressive Human Nonalcoholic Fatty Liver Disease. Toxicol. Sci. 2014, 137, 26–35. [Google Scholar] [CrossRef] [PubMed] [Green Version]
- Sutti, S.; Jindal, A.; Locatelli, I.; Vacchiano, M.; Gigliotti, L.; Bozzola, C.; Albano, E. Adaptive Immune Responses Triggered by Oxidative Stress Contribute to Hepatic Inflammation in NASH. Hepatology 2014, 59, 886–897. [Google Scholar] [CrossRef]
- Ganz, M.; Szabo, G. Immune and Inflammatory Pathways in NASH. Hepatol. Int. 2013, 7, S771–S781. [Google Scholar] [CrossRef] [Green Version]
- Vonghia, L.; Michielsen, P.; Francque, S. Immunological Mechanisms in the Pathophysiology of Non-Alcoholic Steatohepatitis. Int. J. Mol. Sci. 2013, 14, 19867–19890. [Google Scholar] [CrossRef] [Green Version]
- Haas, J.T.; Francque, S.M.; Staels, B. Pathophysiology and Mechanisms of Nonalcoholic Fatty Liver Disease. Annu. Rev. Physiol. 2016, 78, 181–205. [Google Scholar] [CrossRef]
- Ballantyne, M.D.; Pinel, K.; Dakin, R.; Vesey, A.T.; Diver, L.; Mackenzie, R.; Garcia, R.; Welsh, P.; Sattar, N.; Hamilton, G.; et al. Smooth Muscle Enriched Long Noncoding RNA (SMILR) Regulates Cell Proliferation. Circulation 2016, 133, 2050–2065. [Google Scholar] [CrossRef] [PubMed]
- Dela Peña, A.; Leclercq, I.; Field, J.; George, J.; Jones, B.; Farrell, G.; Brunt, E.M.; Tilg, H.; Diehl, A.M.; Crespo, J.; et al. NF-KappaB Activation, Rather than TNF, Mediates Hepatic Inflammation in a Murine Dietary Model of Steatohepatitis. Gastroenterology 2005, 129, 1663–1674. [Google Scholar] [CrossRef] [PubMed]
- Lawrence, T. The Nuclear Factor NF-ΚB Pathway in Inflammation. About Cold Spring Harb. Perspect. Biol. 2009, 1, 1–10. [Google Scholar]
- Rahman, S.M.; Janssen, R.C.; Choudhury, M.; Baquero, K.C.; Aikens, R.M.; De La Houssaye, B.A.; Friedman, J.E. CCAAT/Enhancer-Binding Protein Beta (C/EBPbeta) Expression Regulates Dietary-Induced Inflammation in Macrophages and Adipose Tissue in Mice. J. Biol. Chem. 2012, 287, 34349–34360. [Google Scholar] [CrossRef] [Green Version]
- Vallabhapurapu, S.; Karin, M. Regulation and Function of NF-ΚB Transcription Factors in the Immune System. Annu. Rev. Immunol. 2009, 27, 693–733. [Google Scholar] [CrossRef] [PubMed]
- Hoffmann, A.; Levchenko, A.; Scott, M.L.; Baltimore, D. The IκB-NF-ΚB Signaling Module: Temporal Control and Selective Gene Activation. Science 2002, 298, 1241–1245. [Google Scholar] [CrossRef] [PubMed] [Green Version]
- Simeonidis, S.; Stauber, D.; Chen, G.; Hendrickson, W.A.; Thanos, D. Mechanisms by Which IkappaB Proteins Control NF-KappaB Activity. Proc. Natl. Acad. Sci. USA 1999, 96, 49–54. [Google Scholar] [CrossRef] [PubMed] [Green Version]
- Hymowitz, S.G.; Wertz, I.E. A20: From Ubiquitin Editing to Tumour Suppression. Nat. Rev. Cancer 2010, 10, 332–341. [Google Scholar] [CrossRef]


Publisher’s Note: MDPI stays neutral with regard to jurisdictional claims in published maps and institutional affiliations. |
© 2021 by the authors. Licensee MDPI, Basel, Switzerland. This article is an open access article distributed under the terms and conditions of the Creative Commons Attribution (CC BY) license (https://creativecommons.org/licenses/by/4.0/).
Share and Cite
Atanasovska, B.; Rensen, S.S.; Marsman, G.; Shiri-Sverdlov, R.; Withoff, S.; Kuipers, F.; Wijmenga, C.; van de Sluis, B.; Fu, J. Long Non-Coding RNAs Involved in Progression of Non-Alcoholic Fatty Liver Disease to Steatohepatitis. Cells 2021, 10, 1883. https://0-doi-org.brum.beds.ac.uk/10.3390/cells10081883
Atanasovska B, Rensen SS, Marsman G, Shiri-Sverdlov R, Withoff S, Kuipers F, Wijmenga C, van de Sluis B, Fu J. Long Non-Coding RNAs Involved in Progression of Non-Alcoholic Fatty Liver Disease to Steatohepatitis. Cells. 2021; 10(8):1883. https://0-doi-org.brum.beds.ac.uk/10.3390/cells10081883
Chicago/Turabian StyleAtanasovska, Biljana, Sander S. Rensen, Glenn Marsman, Ronit Shiri-Sverdlov, Sebo Withoff, Folkert Kuipers, Cisca Wijmenga, Bart van de Sluis, and Jingyuan Fu. 2021. "Long Non-Coding RNAs Involved in Progression of Non-Alcoholic Fatty Liver Disease to Steatohepatitis" Cells 10, no. 8: 1883. https://0-doi-org.brum.beds.ac.uk/10.3390/cells10081883