
The Anti-Acne Potential and Chemical Composition of Two Cultivated Cotoneaster Species

 , ,
, ,  , , and
Abstract
:1. Introduction
2. Materials and Methods
2.1. Chemicals and Reagents
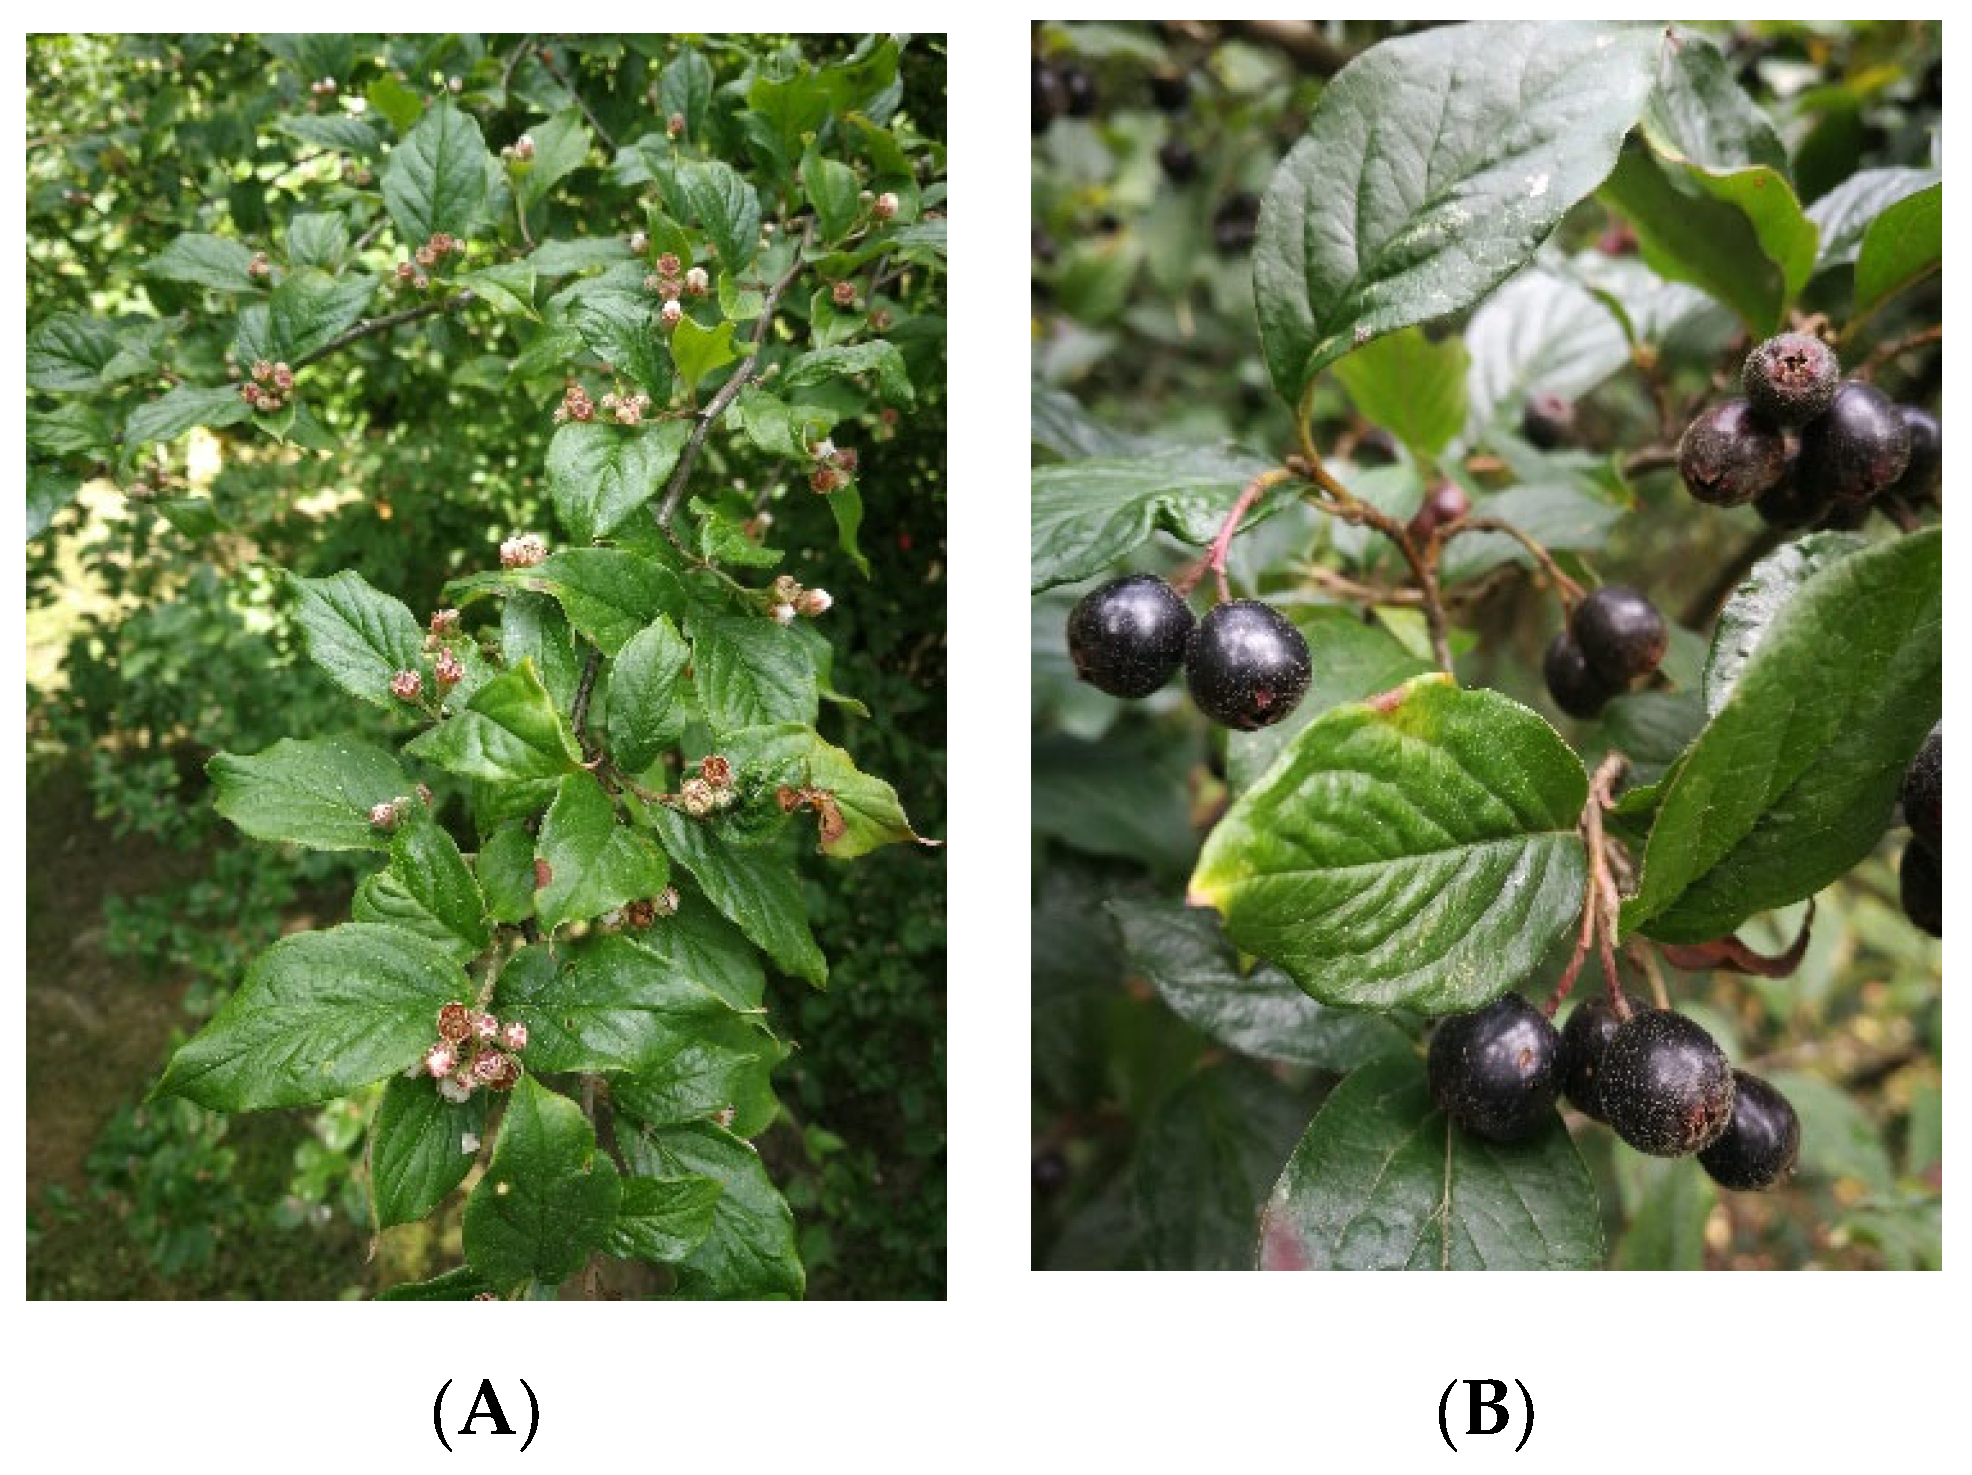
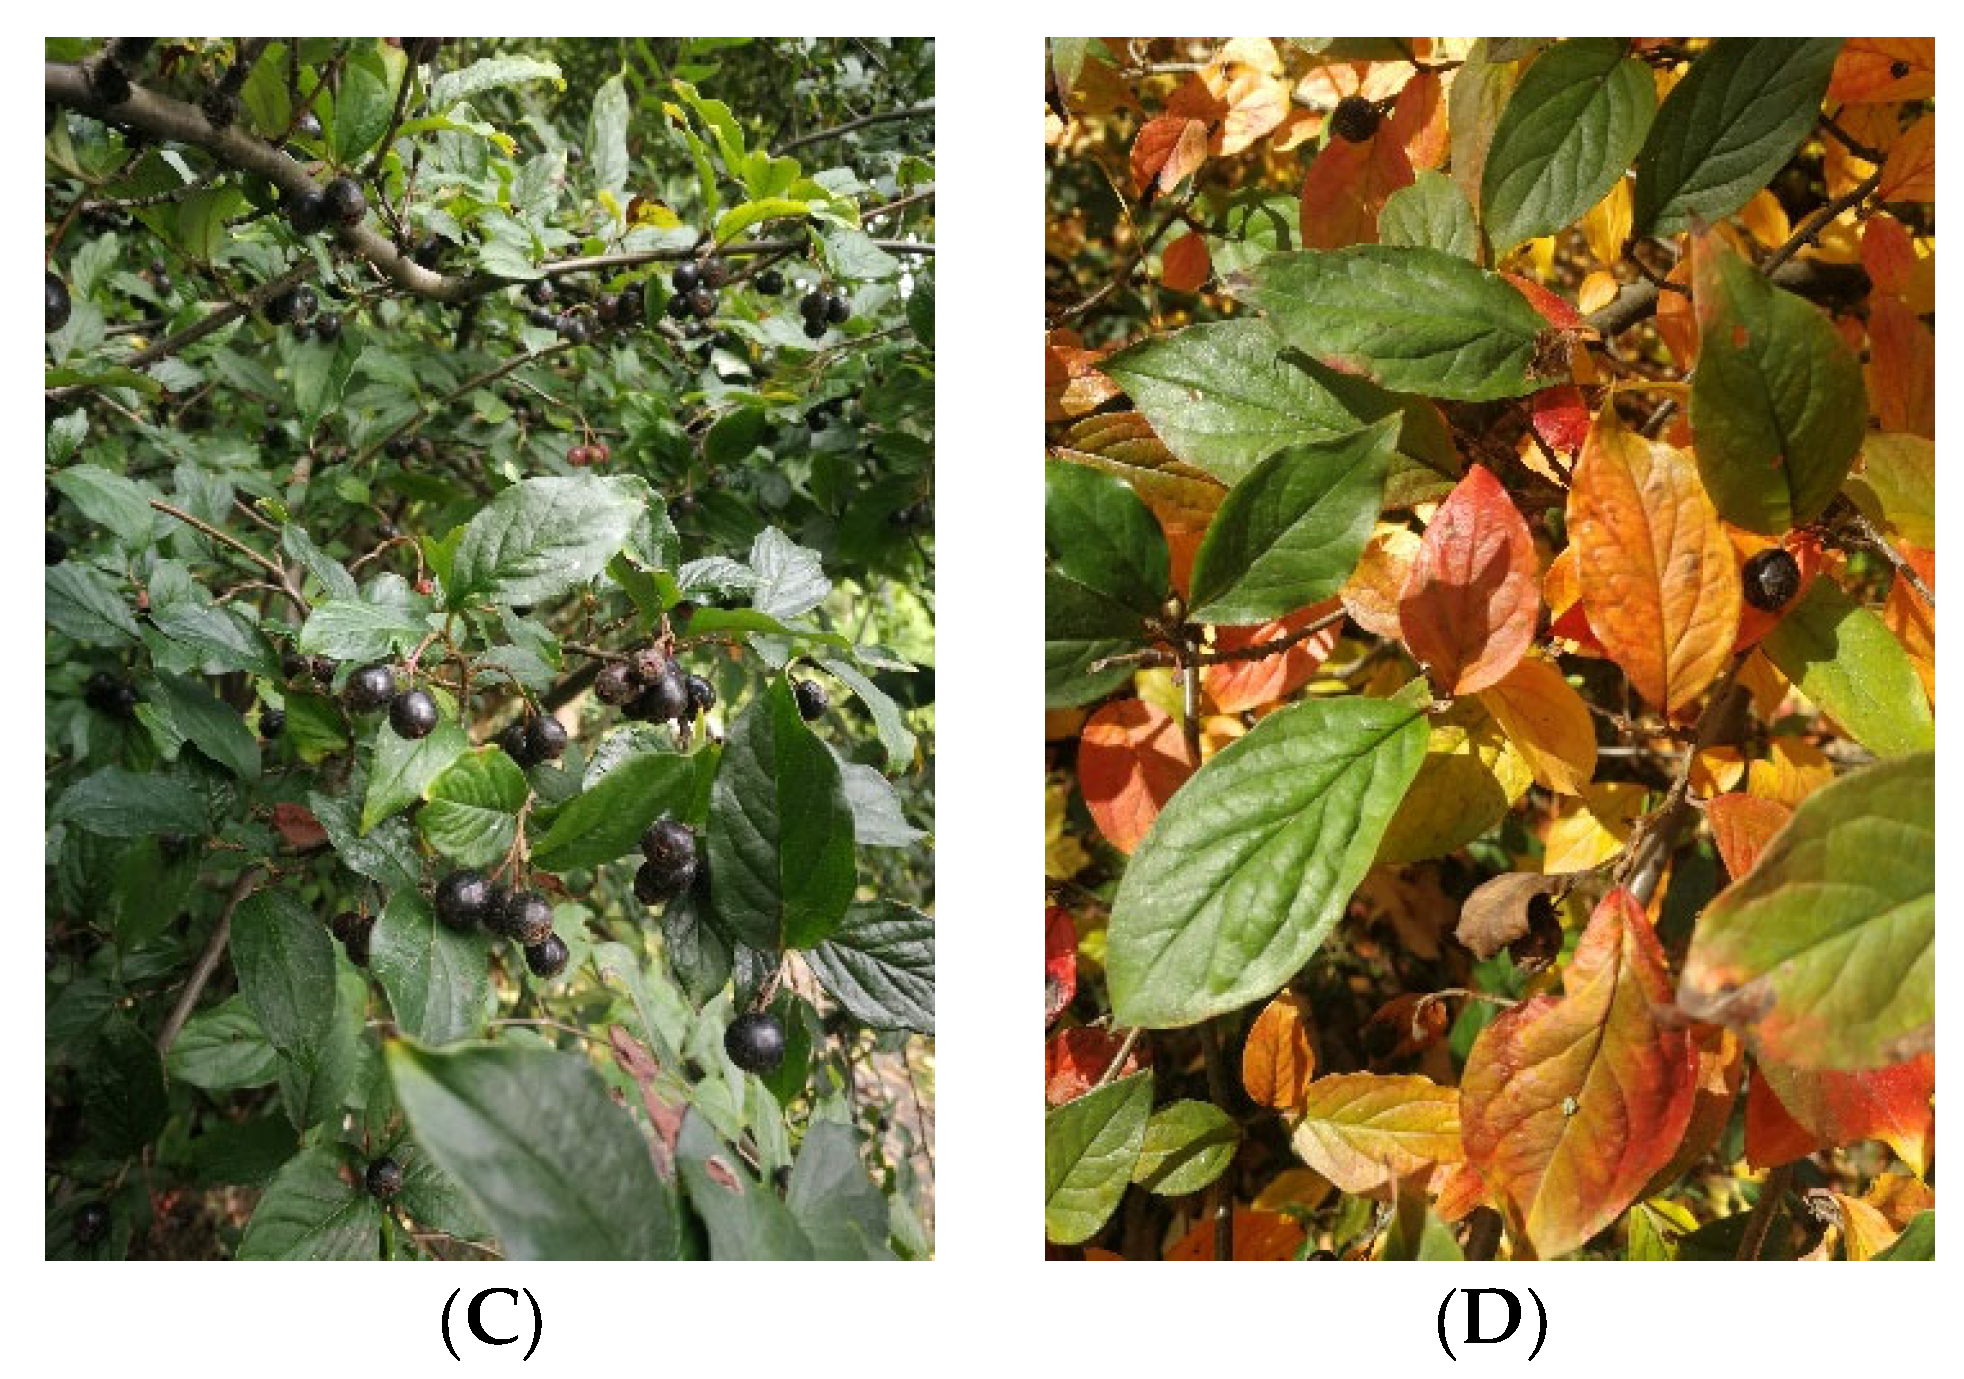
2.2. Plant Material
2.3. Preparation of the Extracts
2.4. Total Flavonoid, Phenolic, and Phenolic Acids Content
2.5. LC-MS Analysis
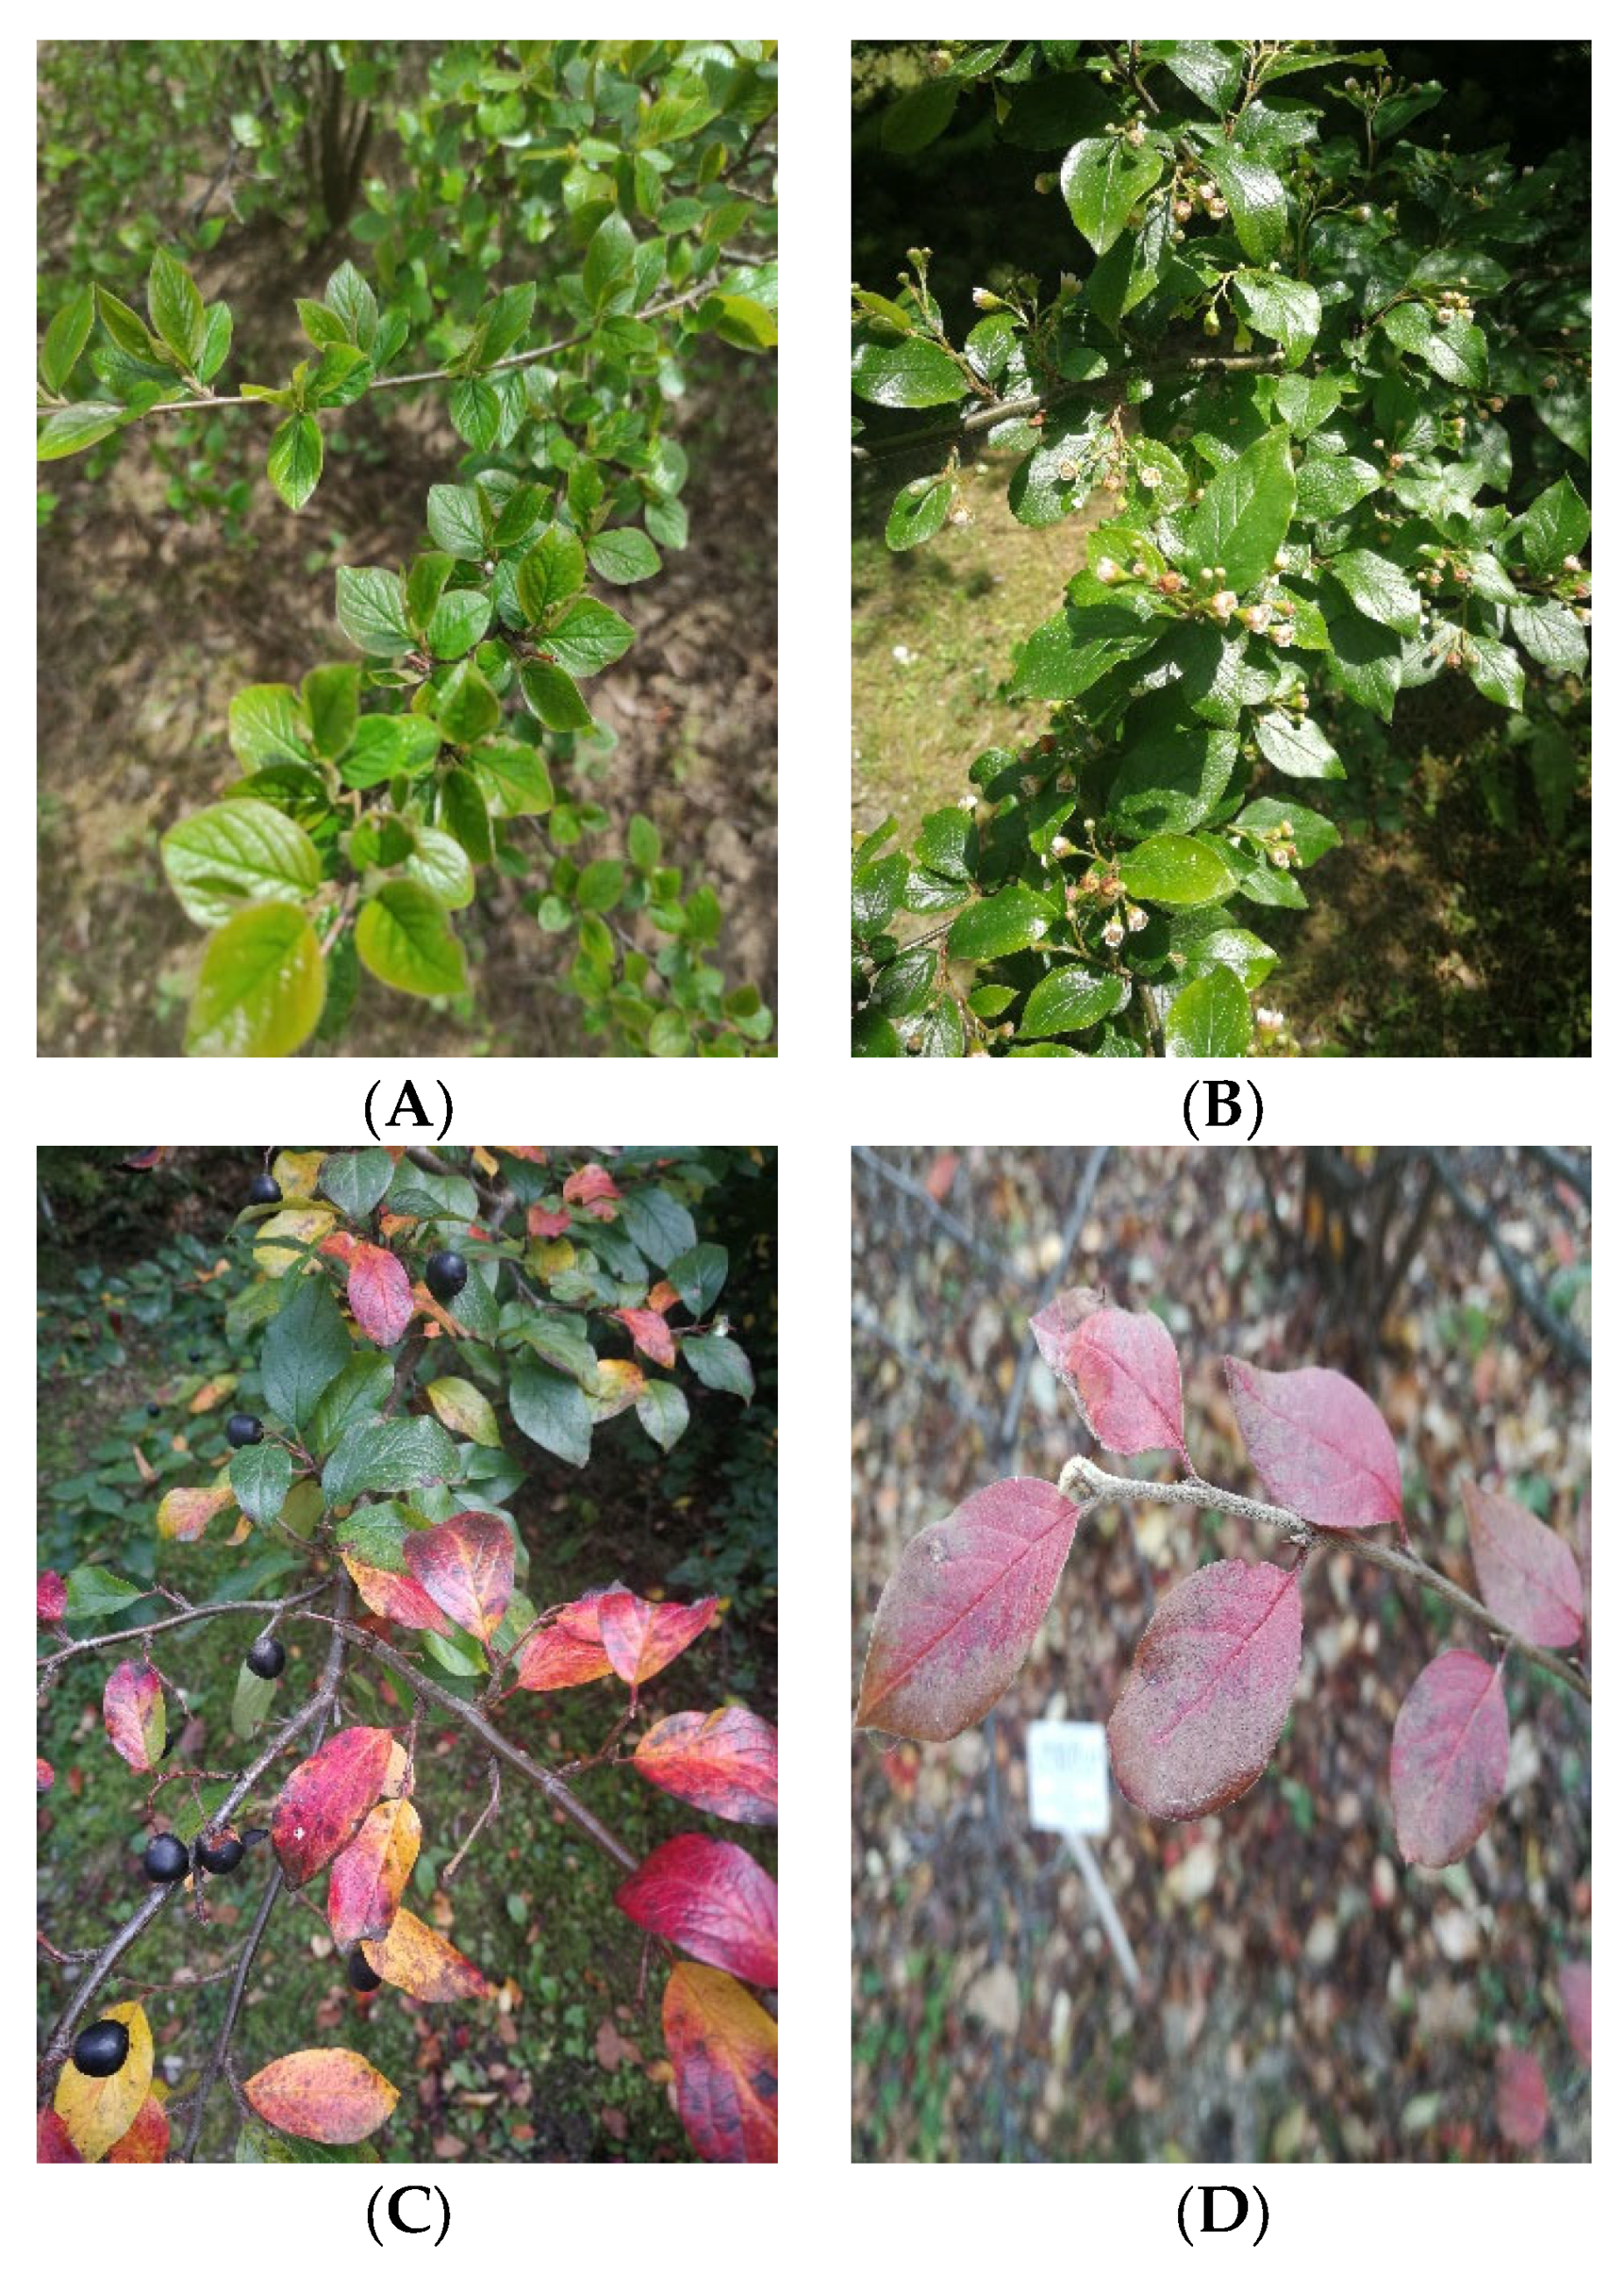
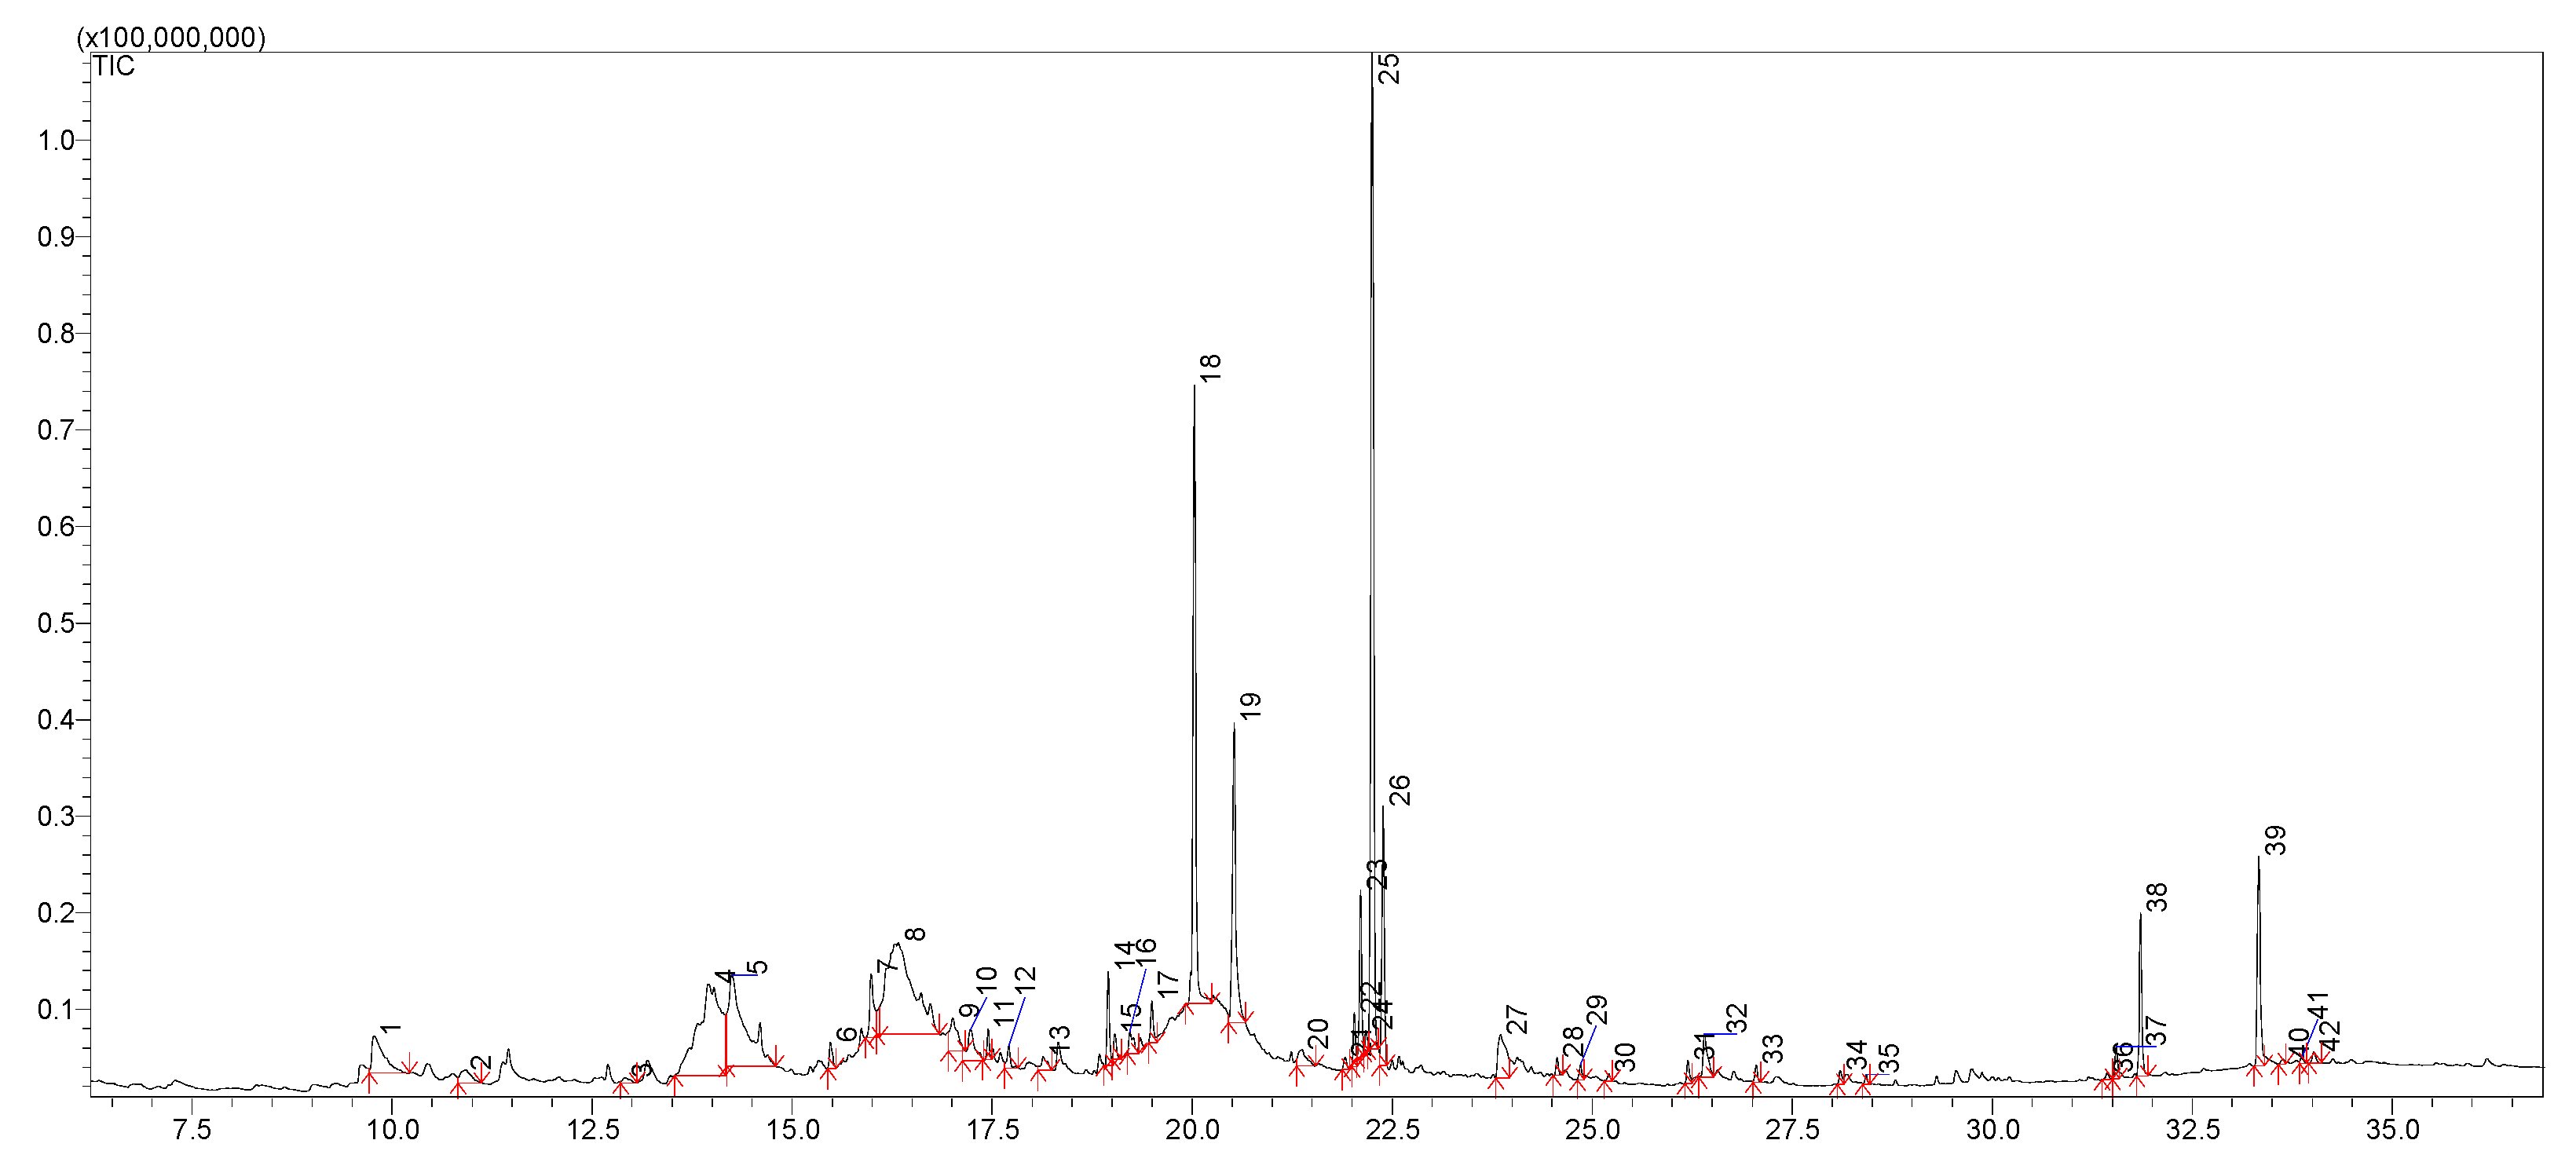
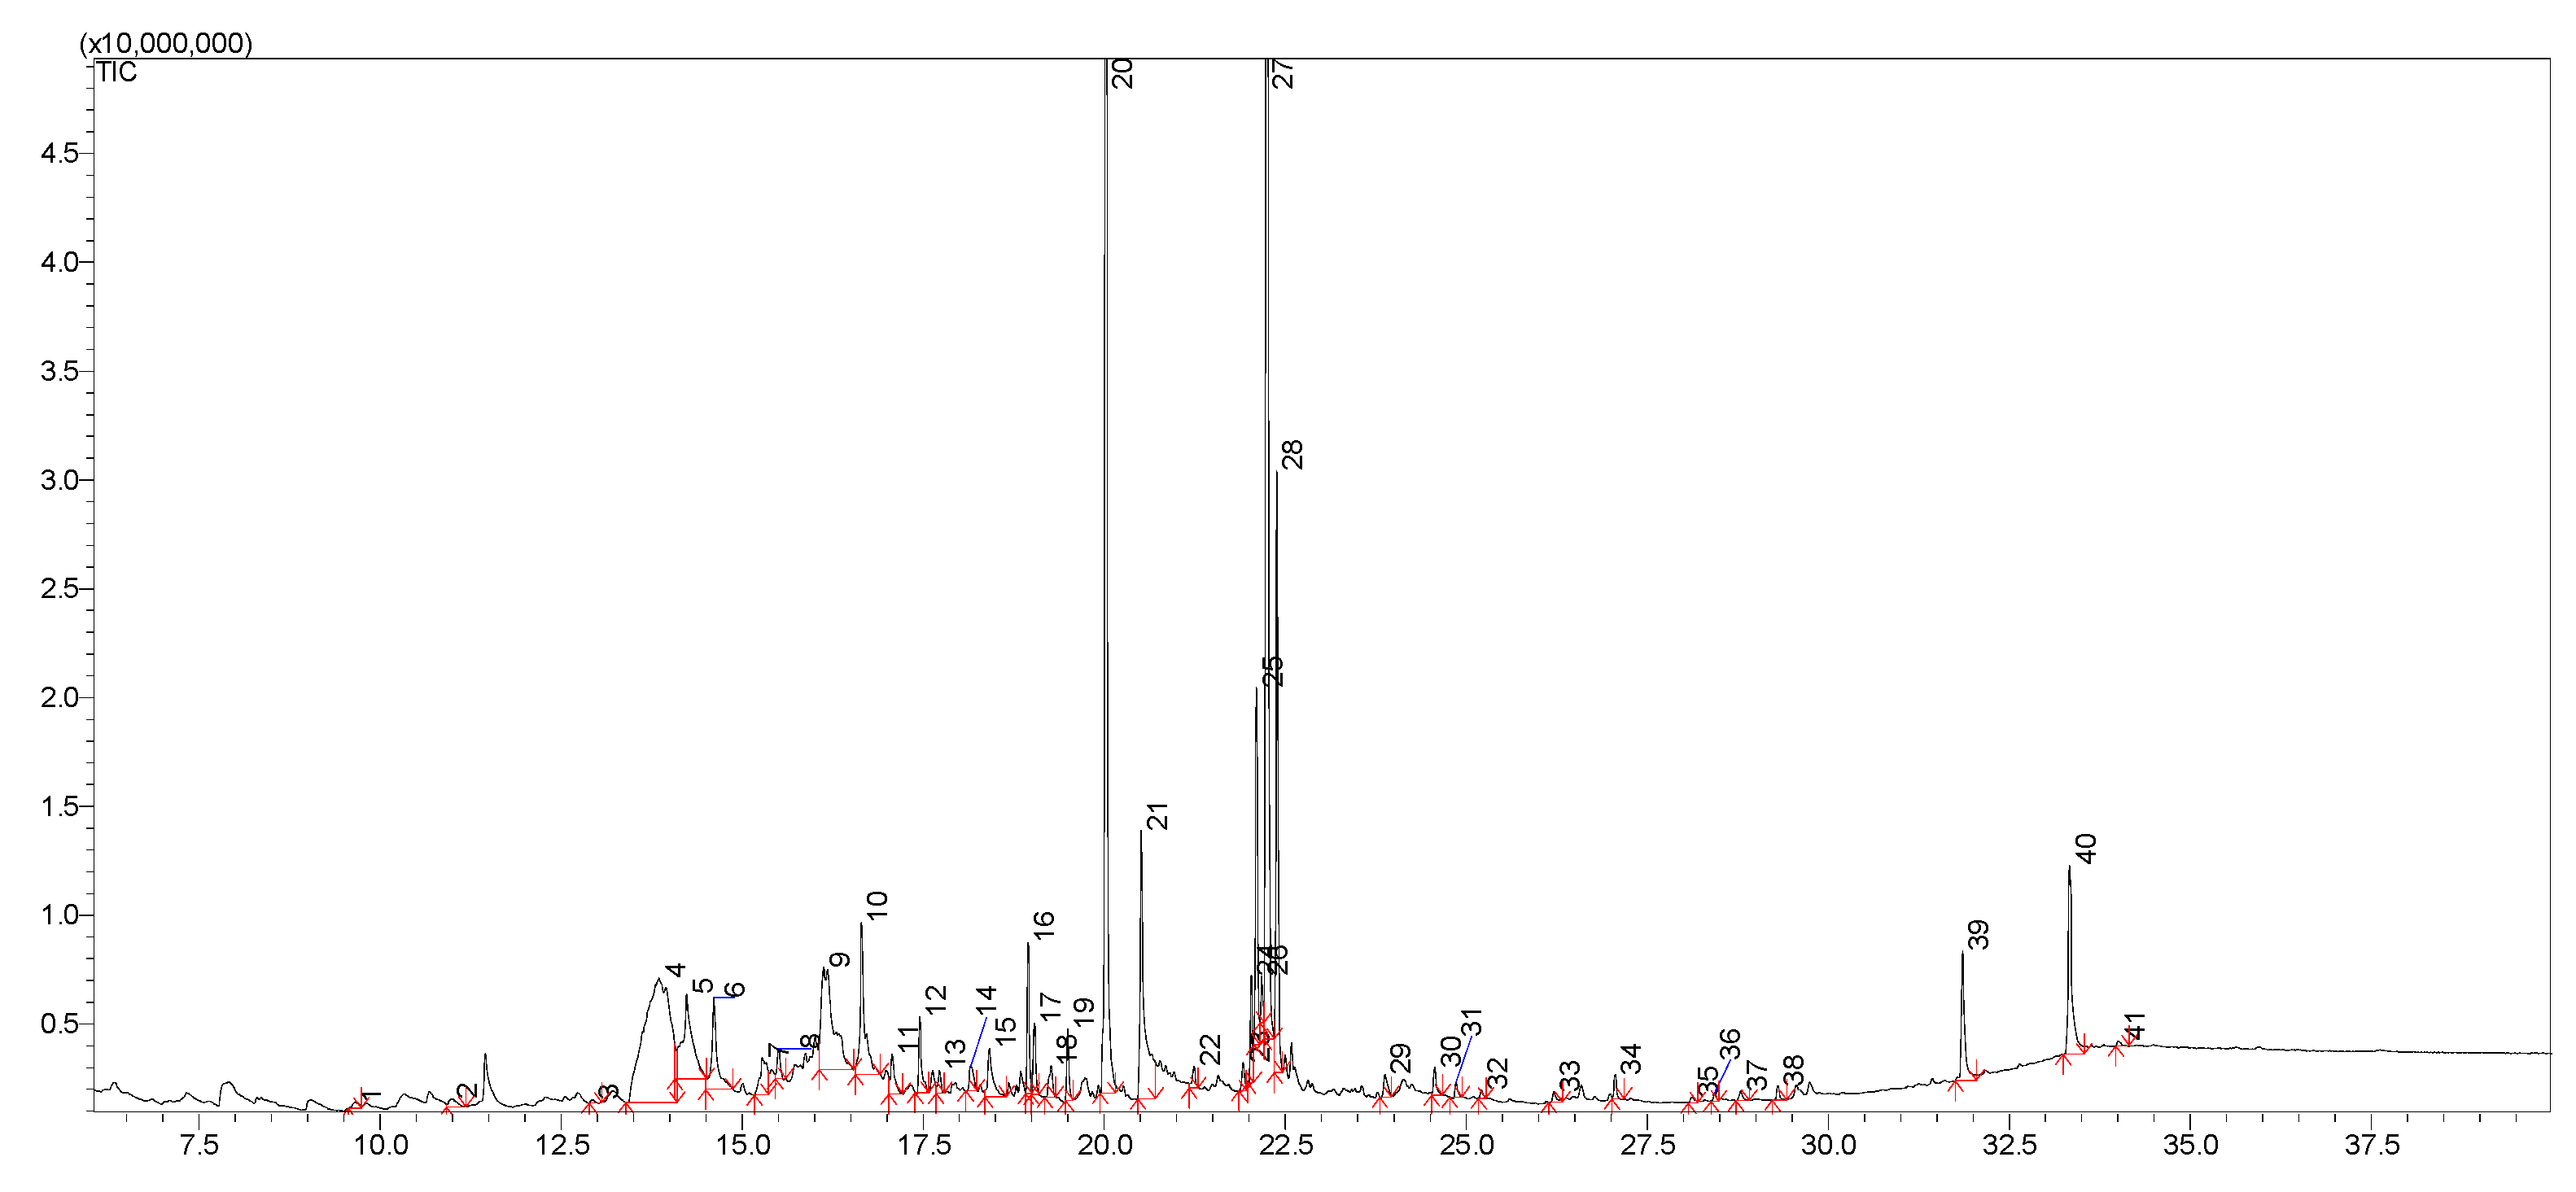
2.6. GC-MS Analysis
2.7. Antioxidant Activity
2.7.1. DPPH• Assay
2.7.2. ABTS•+ Assay
2.7.3. Metal Chelating Activity (CHEL)
2.8. Enzyme Inhibitory Activity
2.8.1. Cyclooxygenase-1 (COX-1) and Cyclooxygenase-2 (COX-2) Inhibitory Activity
2.8.2. Lipoxygenase Inhibitory Activity
2.8.3. Hyaluronidase Inhibitory Activity
2.9. Bacterial Strains
2.10. Disc Diffusion Assay
2.11. Minimum Inhibitory Concentration (MIC) and Minimum Bactericidal Concentration (MBC) Determination
2.12. Cytotoxic Activity
2.13. Statistical Analysis
3. Results
3.1. Phytochemical Analysis
3.2. Biological Activity
3.2.1. Antioxidant Activity
3.2.2. Enzyme Inhibitory Activity
3.2.3. Antibacterial Activity
Diffusion Test in Solid Medium
Results of MIC and MBC Determination
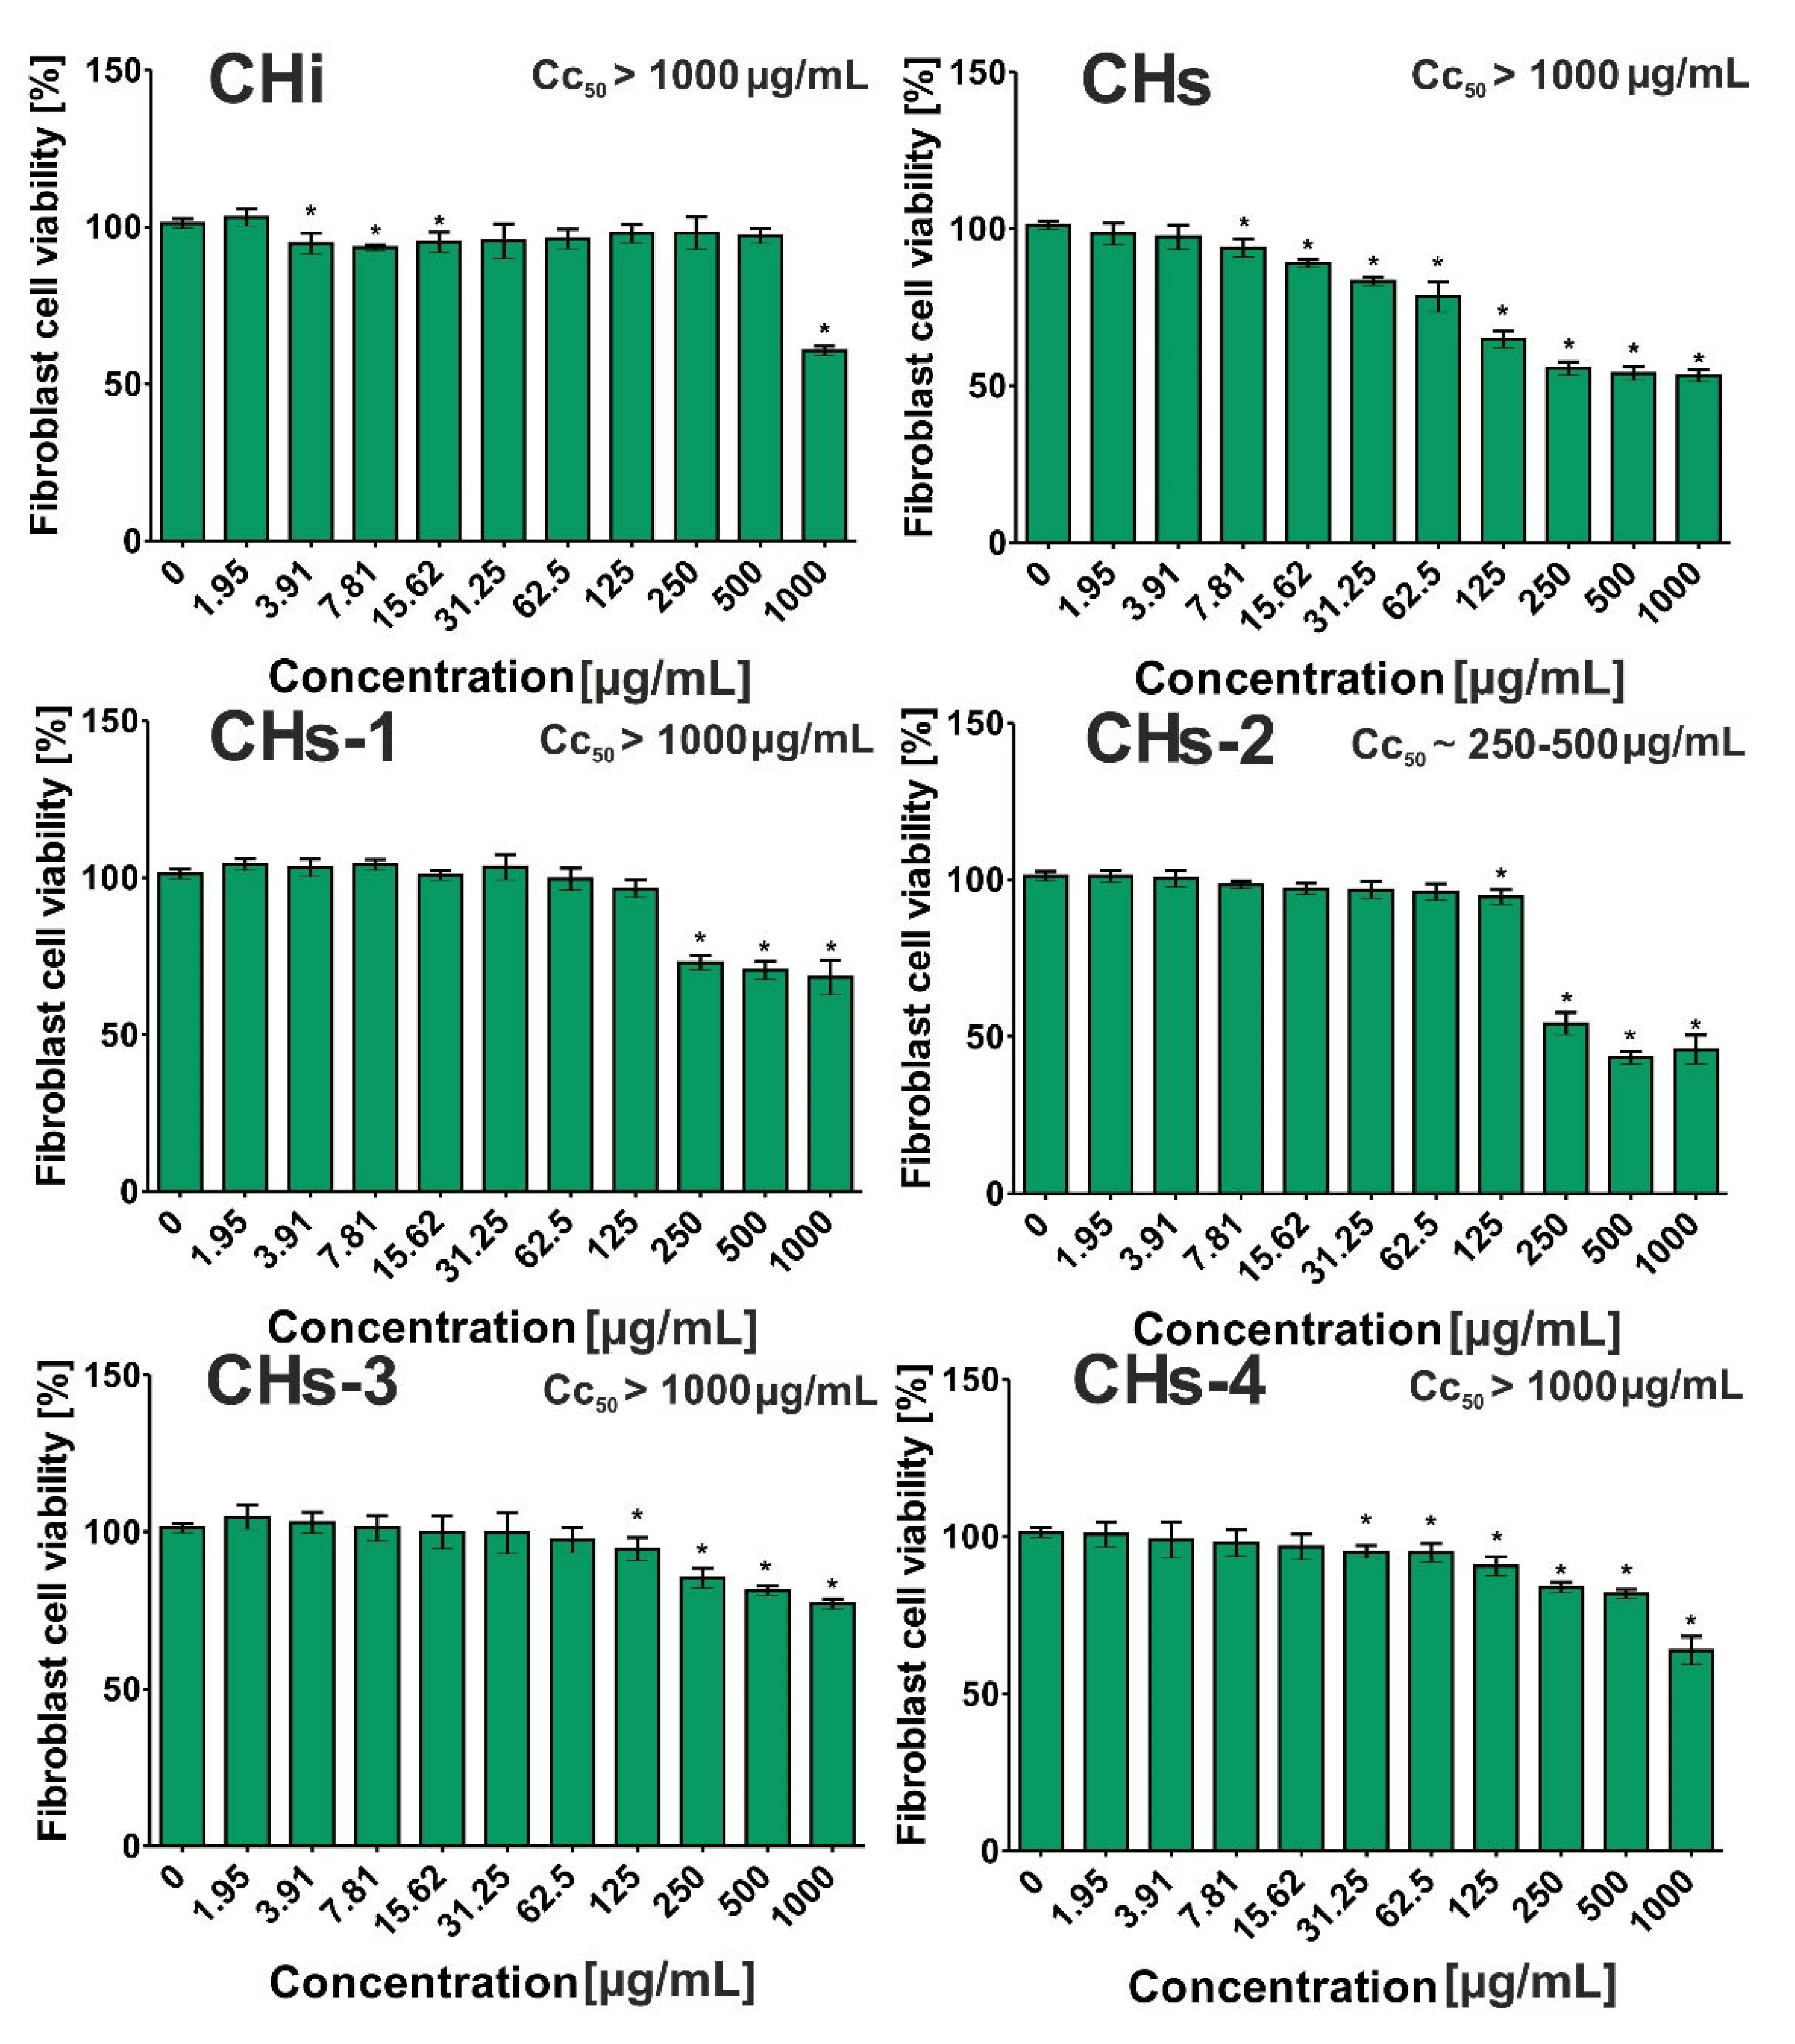
3.2.4. Cytotoxic Activity
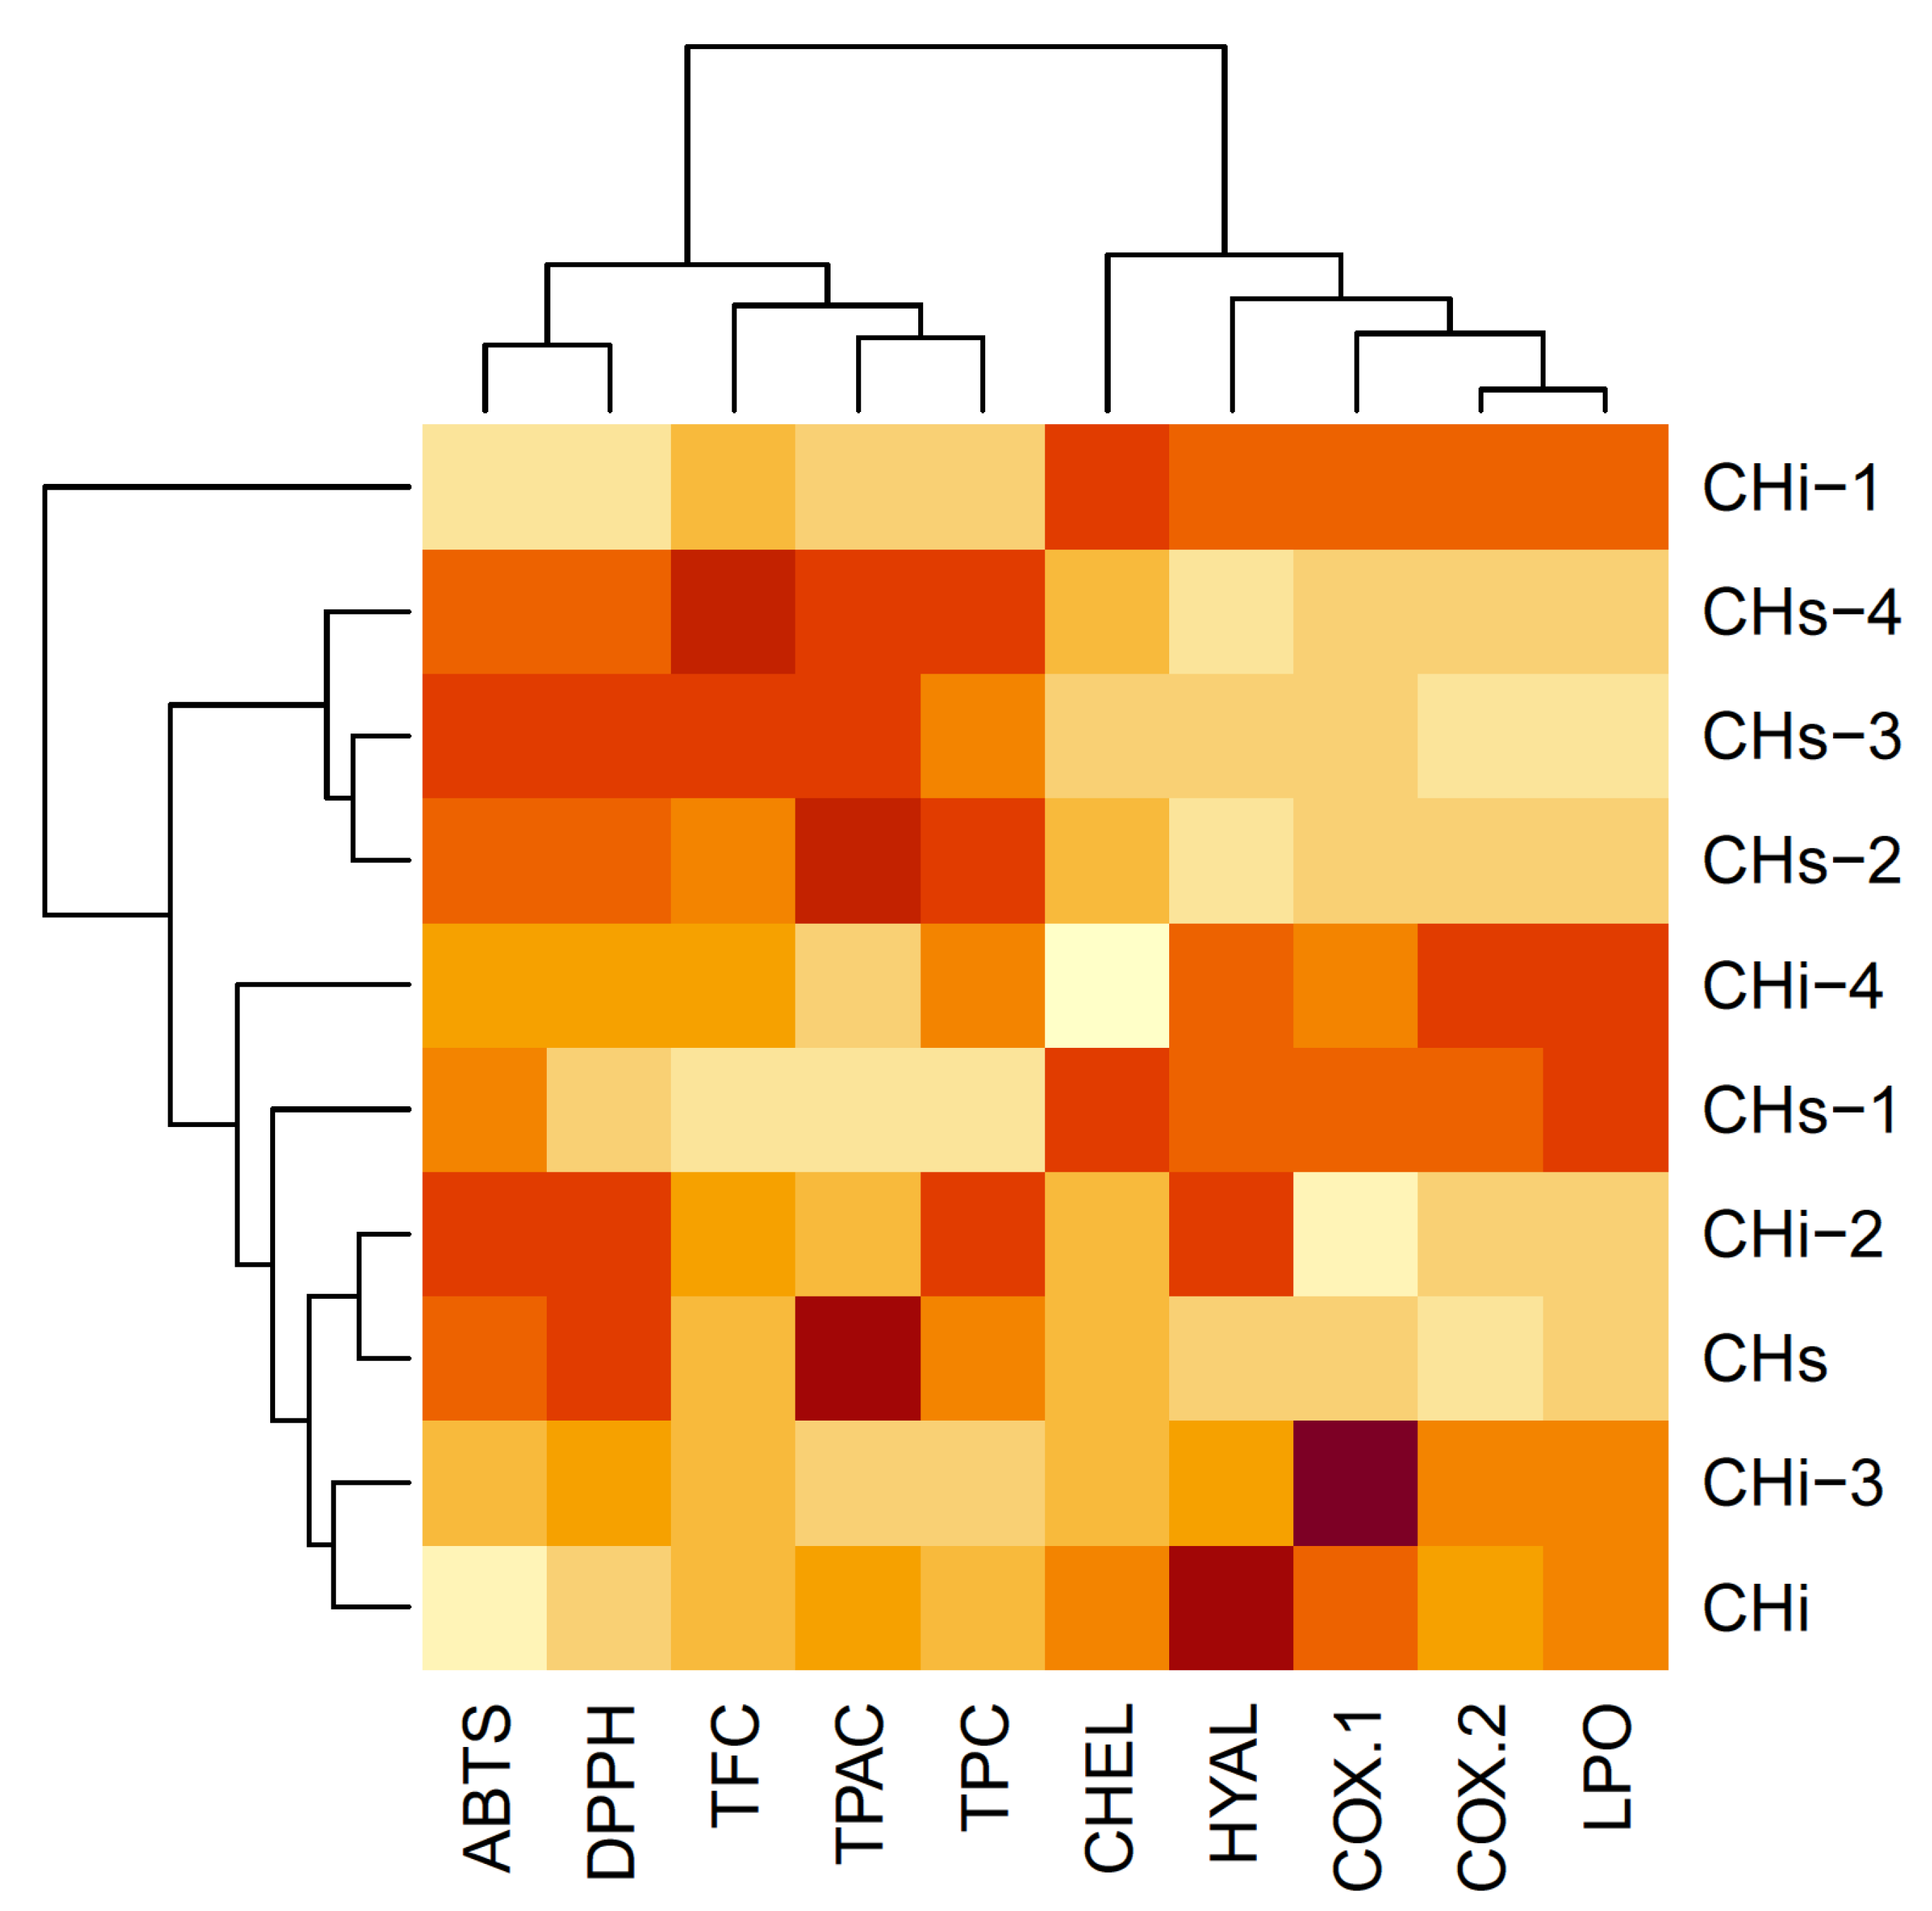
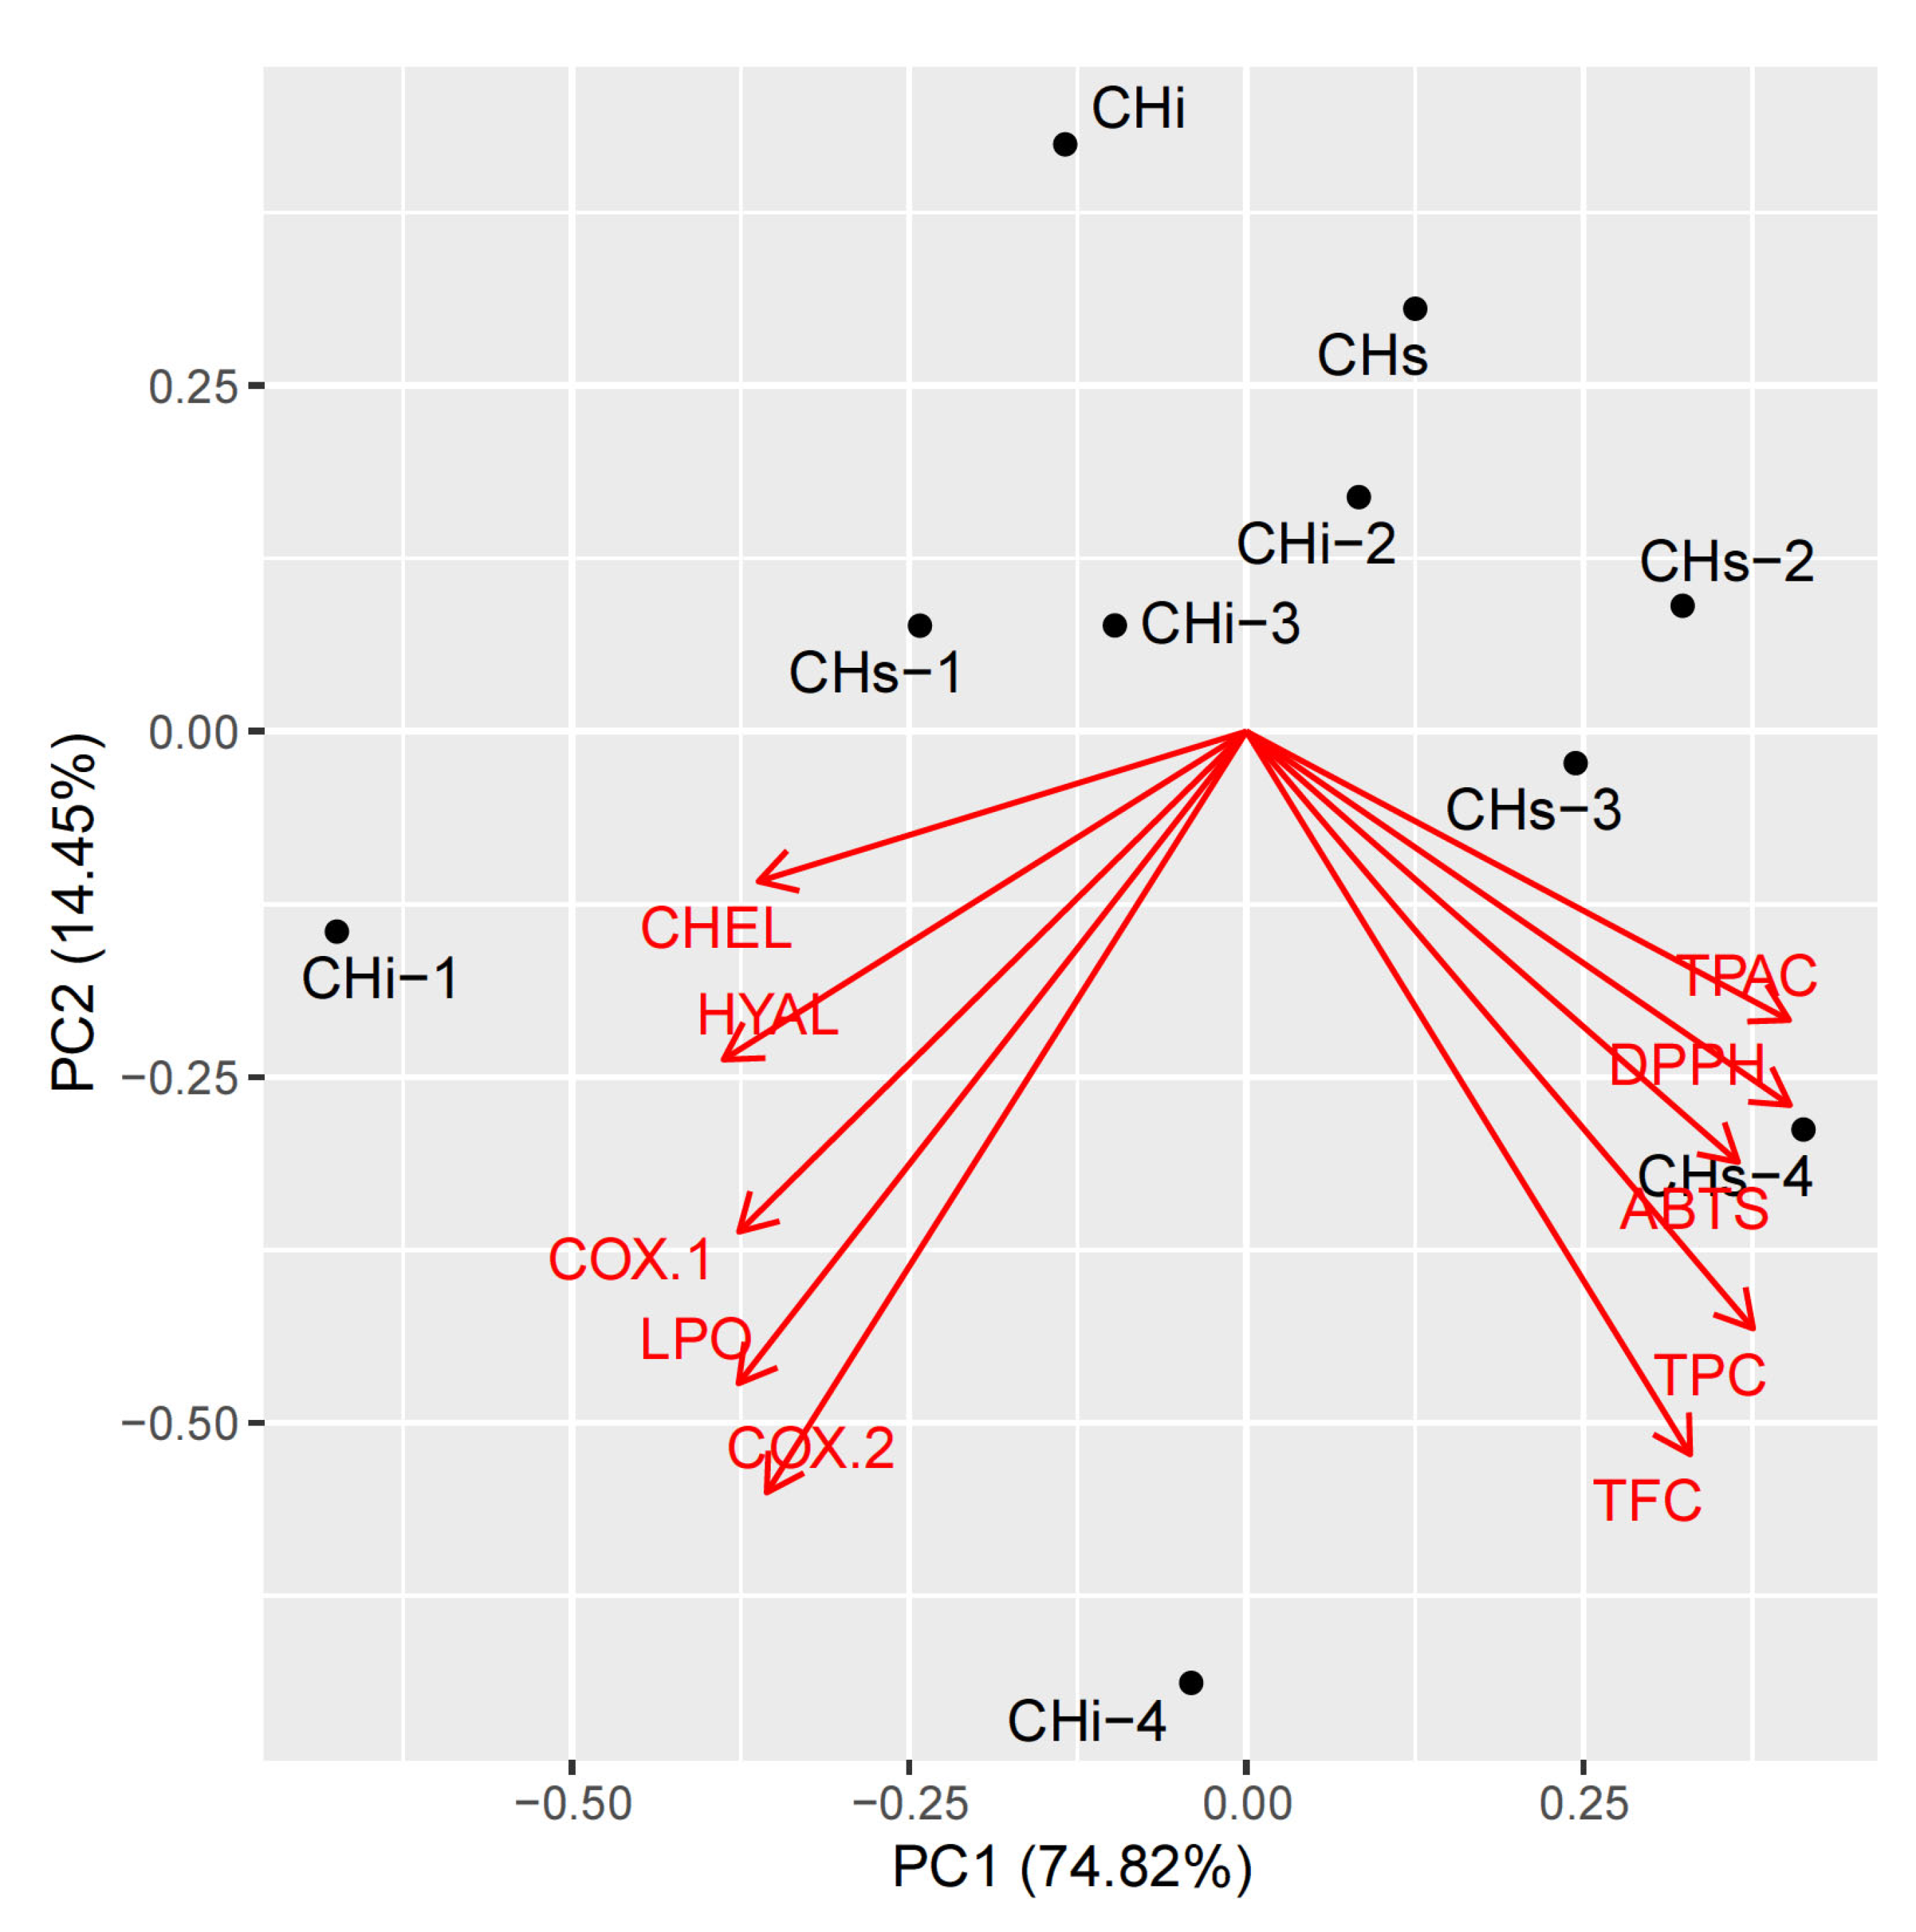
3.3. Multivariate Analysis of the Results
4. Conclusions
Supplementary Materials
Author Contributions
Funding
Data Availability Statement
Acknowledgments
Conflicts of Interest
References
- Sarici, G.; Cinar, S.; Armutcu, F.; Altınyazar, C.; Koca, R.; Tekin, N. Oxidative stress in acne vulgaris. J. Eur. Acad. Dermatol. Venereol. 2009, 23, 135–146. [Google Scholar] [CrossRef]
- Bojar, R.A.; Holland, K.T. Acne and Propionibacterium acnes. Clin. Dermatol. 2004, 22, 375–379. [Google Scholar] [CrossRef] [PubMed]
- Dreno, B.; Pecastaings, S.; Corvec, S.; Veraldi, S.; Khammari, A.; Roques, C. Cutibacterium acnes (Propionibacterium acnes) and acne vulgaris: A brief look at the latest updates. J. Eur. Acad. Dermatol. Venereol. 2018, 32, 5–14. [Google Scholar] [CrossRef] [Green Version]
- Mclaughlin, J.; Watterson, S.; Layton, A.M.; Bjourson, A.J.; Barnard, E.; Mcdowell, A. Propionibacterium acnes and acne vulgaris: New insights from the integration of population genetic, multi-omic, biochemical and host-microbe studies. Microorganisms 2019, 7, 128. [Google Scholar] [CrossRef] [PubMed] [Green Version]
- Keshari, S.; Kumar, M.; Balasubramaniam, A.; Chang, T.W.; Tong, Y.; Huang, C.M. Prospects of acne vaccines targeting secreted virulence factors of Cutibacterium acnes. Expert Rev. Vaccines 2019, 18, 433–437. [Google Scholar] [CrossRef] [PubMed]
- Wang, Y.; Hata, T.R.; Tong, Y.L.; Kao, M.S.; Zouboulis, C.C.; Gallo, R.L.; Huang, C.M. The anti-inflammatory activities of Propionibacterium acnes CAMP Factor-Targeted acne vaccines. J. Investig. Dermatol. 2018, 138, 2355–2364. [Google Scholar] [CrossRef] [Green Version]
- Vora, J.; Srivastava, A.; Modi, H. Antibacterial and antioxidant strategies for acne treatment through plant extracts. Inform. Med. Unlocked 2018, 13, 128–132. [Google Scholar] [CrossRef]
- Soleymani, S.; Farzaei, M.H.; Zargaran, A.; Niknam, S.; Rahimi, R. Promising plant-derived secondary metabolites for treatment of acne vulgaris: A mechanistic review. Arch. Dermatol. Res. 2020, 312, 5–23. [Google Scholar] [CrossRef]
- Mahdy, K.; Shaker, O.; Wafay, H.; Nassar, Y.; Hassan, H.; Hussein, A. Effect of some medicinal plant extracts on the oxidative stress status in Alzheimer’s disease induced in rats. Eur. Rev. Med. Pharmacol. Sci. 2021, 16, 31–42. [Google Scholar]
- Chang, C.-S.; Jeon, J.I. Leaf flavonoids in Cotoneaster wilsonii (Rosaceae) from the island Ulleung-do, Korea. Biochem. Syst. Ecol. 2003, 31, 171–179. [Google Scholar] [CrossRef]
- Mahmutović-Dizdarević, I.; Dizdar, M.; Čulum, D.; Vidic, D.; Dahija, S.; Jerković-Mujkić, A.; Bešta-Gajević, R. Phenolic composition, antioxidant and antimicrobial activity of Cotoneaster Medik. species from Bosnia and Herzegovina. Bull. Chem. Technol. Bosnia Herzeg. 2020, 54, 1–6. [Google Scholar] [CrossRef]
- Swati, S.; Manjula, R.R.; Sowjanya, K.; Vennela, Y.; Tanuja, K. A phyto pharmacological review on Cotoneaster microphyllus species. J. Pharm. Sci. Res. 2018, 10, 2166–2168. [Google Scholar]
- Zengin, G.; Ferrante, C.; Menghini, L.; Orlando, G.; Brunetti, L.; Recinella, L.; Chiavaroli, A.; Leone, S.; Ronci, M.; Aumeeruddy, M.Z. Protective effects of Cotoneaster integerrimus on in vitro and ex-vivo models of H2O2-induced lactate dehydrogenase activity in HCT116 cell and on lipopolysaccharide-induced inflammation in rat colon. J. Food Biochem. 2019, 43, e12766. [Google Scholar] [CrossRef] [PubMed]
- Khan, S.; Yasmeen, S.; Afza, N.; Malik, A.; Iqbal, L.; Lateef, M. Cotonoates A and B, new aromatic esters from Cotoneaster racemiflora. Z. Naturforsch. B 2008, 63, 1219–1222. [Google Scholar] [CrossRef]
- Khan, S.; Wang, Z.; Wang, R.; Zhang, L. Horizontoates A–C: New cholinesterase inhibitors from Cotoneaster horizontalis. Phytochem. Lett. 2014, 10, 204–208. [Google Scholar] [CrossRef]
- Akbar, S. Cotoneaster nummularius Fisch. & C.A.Mey. (Rosaceae). In Handbook of 200 Medicinal Plants; Springer: New York, NY, USA, 2020. [Google Scholar] [CrossRef]
- Polish Pharmaceutical Society. Polish Pharmacopoeia IX, PTFarm; Polish Pharmaceutical Society: Warsaw, Poland, 2011; p. 150. [Google Scholar]
- Szewczyk, K.; Bogucka-Kocka, A.; Vorobets, N.; Grzywa-Celińska, A.; Granica, S. Phenolic composition of the leaves of Pyrola rotundifolia L. and their antioxidant and cytotoxic activity. Molecules 2020, 25, 1749. [Google Scholar] [CrossRef] [Green Version]
- Guo, J.T.; Lee, H.L.; Chiang, S.H.; Lin, H.I.; Chang, C.Y. Antioxidant properties of the extracts from different parts of broccoli in Taiwan. J. Food Drug Anal. 2001, 9, 96–101. [Google Scholar] [CrossRef]
- Nowak, R.; Szewczyk, K.; Gawlik-Dziki, U.; Rzymowska, J.; Komsta, Ł. Antioxidative and cytotoxic potential of some Chenopodium L. species growing in Poland. Saudi J. Biol. Sci. 2016, 23, 15–23. [Google Scholar] [CrossRef] [Green Version]
- Liyanaarachchi, G.D.; Samarasekera, J.K.R.R.; Mahanama, K.R.R.; Hemalal, K.D.P. Tyrosinase, elastase, hyaluronidase, inhibitory and antioxidant activity of Sri Lankan medicinal plants for novel cosmeceuticals. Ind. Crop. Prod. 2018, 111, 597–605. [Google Scholar] [CrossRef]
- Bauer, A.W.; Kirby, W.M.; Sherris, J.C.; Turck, M. Antibiotic susceptibility testing by a standardized single disk method. Am. J. Clin. Pathol. 1966, 45, 493–496. [Google Scholar] [CrossRef] [PubMed]
- Szewczyk, K.; Pietrzak, W.; Klimek, K.; Miazga-Karska, M.; Firlej, A.; Flisiński, M.; Grzywa-Celińska, A. Flavonoid and phenolic acids content and in vitro study of the potential anti-aging properties of Eutrema japonicum (Miq.) Koidz cultivated in Wasabi Farm Poland. Int. J. Mol. Sci. 2021, 22, 6219. [Google Scholar] [CrossRef] [PubMed]
- Clinical Laboratory Standards Institute. Performance Standards for Antimicrobial Susceptibility Testing; Eighteenth International Supplement M7-MIC; Clinical Laboratory Standards Institute: Wayne, PA, USA, 2008. [Google Scholar]
- O’Donnell, F.; Smyth, T.J.P.; Ramachandran, V.N.; Smyth, W.F. A study of the antimicrobial activity of selected synthetic and naturally occurring quinolines. Int. J. Antimicrob. Agents 2010, 35, 30–38. [Google Scholar] [CrossRef] [PubMed] [Green Version]
- Chrząszcz, M.; Miazga-Karska, M.; Klimek, K.; Granica, S.; Tchórzewska, D.; Ginalska, G.; Szewczyk, K. Extracts from Cephalaria uralensis (Murray) Roem. & Schult. and Cephalaria gigantea (Ledeb.) Bobrov as potential agents for treatment of acne vulgaris: Chemical characterization and in vitro biological evaluation. Antioxidants 2020, 9, 796. [Google Scholar]
- Kicel, A.; Michel, P.; Owczarek, A.; Marchelak, A.; Zyzelewicz, D.; Budryn, G.; Oracz, J.; Olszewska, M.A. Phenolic profile and antioxidant potential of leaves from selected Cotoneaster Medik. species. Molecules 2016, 21, 688. [Google Scholar] [CrossRef] [PubMed] [Green Version]
- Kicel, A.; Kołodziejczyk-Czepas, J.; Owczarek, A.; Rutkowska, M.; Wajs-Bonikowska, A.; Granica, S.; Nowak, P.; Olszewska, M.A. Multifunctional phytocompounds in Cotoneaster fruits: Phytochemical profiling, cellular safety, anti-inflammatory and antioxidant effects in chemical and human plasma models in vitro. Oxid. Med. Cell. Longev. 2018, 2018, 3482521. [Google Scholar] [CrossRef]
- Kicel, A.; Kolodziejczyk-Czepas, J.; Owczarek, A.; Marchelak, A.; Sopinska, M.; Ciszewski, P.; Nowak, P.; Olszewska, M.A. Polyphenol-rich extracts from Cotoneaster leaves inhibit pro-inflammatory enzymes and protect human plasma components against oxidative stress in vitro. Molecules 2018, 23, 2472. [Google Scholar] [CrossRef] [PubMed] [Green Version]
- Yoo, N.H.; Kim, H.K.; Lee, C.O.; Park, J.H.; Kim, M.J. Comparison of antioxidant and anti-inflammatory activities of methanolic extracts obtained from different parts of Cotoneaster wilsonii Nakai. Korean J. Med. Crop Sci. 2019, 27, 194–201. [Google Scholar] [CrossRef]
- Holzer, V.M.D.; Lower-Nedza, A.D.; Nandintsetseg, M.; Batkhuu, J.; Brantner, A.H. Antioxidant constituents of Cotoneaster melanocarpus Lodd. Antioxidants 2013, 2, 265–272. [Google Scholar] [CrossRef]
- Palme, E.; Bilia, A.R.; de Feo, V.; Morelli, I. Flavonoid glycosides from Cotoneaster thymaefolia. Phytochemistry 1994, 35, 1381–1382. [Google Scholar] [CrossRef]
- Kicel, A.; Owczarek, A.; Gralak, P.; Ciszewski, P.; Olszewska, M.A. Polyphenolic profile, antioxidant activity, and pro-inflammatory enzymes inhibition of leaves, flowers, bark and fruits of Cotoneaster integerrimus: A comparative study. Phytochem. Lett. 2019, 30, 349–355. [Google Scholar] [CrossRef]
- Ekin, H.N.; Gokbulut, A.; Aydin, Z.U.; Donmez, A.A. Insight into anticholinesterase and antioxidant potential of thirty-four Rosaceae samples and phenolic characterization of the active extracts by HPLC. Ind. Crops Prod. 2016, 91, 104–113. [Google Scholar] [CrossRef]
- Les, F.; López, V.; Caprioli, G.; Iannarelli, R.; Fiorini, D.; Innocenti, M.; Bellumori, M.; Maggi, F. Chemical constituents, radical scavenging activity and enzyme inhibitory capacity of fruits from Cotoneaster pannosus Franch. Food Funct. 2017, 8, 1775–1784. [Google Scholar] [CrossRef] [PubMed]
- Kicel, A.; Owczarek, A.; Kapusta, P.; Kolodziejczyk-Czepas, J.; Olszewska, M.A. Contribution of individual polyphenols to antioxidant activity of cotoneaster bullatus and Cotoneaster zabelii leaves—Structural relationships, synergy effects and application for quality control. Antioxidants 2020, 9, 69. [Google Scholar] [CrossRef] [PubMed] [Green Version]
- Odontuya, G. Phytochemicals in leaves of Cotoneaster mongolica, their antioxidative, and acetylcholinesterase inhibitory activity. Mong. J. Chem. 2019, 20, 1–6. [Google Scholar]
- El-Mousallamy, A.M.; Hussein, S.A.; Merfort, I.; Nawwar, M.A. Unusual phenolic glycosides from Cotoneaster orbicularis. Phytochemistry 2000, 53, 699–704. [Google Scholar] [CrossRef]
- Palme, E.; Bilia, A.R.; Morelli, I. Flavonols and isoflavones from Cotoneaster simonsii. Phytochemistry 1996, 42, 903–905. [Google Scholar] [CrossRef]
- Cooke, R.G.; Fletcher, R.A.H. Isoflavonoids. III. Constituents of Cotoneaster species. Aust. J. Chem. 1974, 27, 1377–1379. [Google Scholar] [CrossRef] [Green Version]
- Chumbalov, T.K.; Pashinina, L.T.; Shukenova, R.Z. Flavonoids of Cotoneaster oligantha. Chem. Nat. Comp. 1978, 14, 166–172. [Google Scholar]
- Huang, W.C.; Tsai, T.H.; Huang, C.J.; Li, Y.Y.; Chyuan, J.H.; Chuang, L.T.; Tsai, P.J. Inhibitory effects of wild bitter melon leaf extract on Propionibacterium acnes-induced skin inflammation in mice and cytokine production in vitro. Food Funct. 2015, 6, 2550–2560. [Google Scholar] [CrossRef] [PubMed]
- Khan, S.; Rehman, A.U.; Riaz, N.; Afza, N.; Malik, A. Isolation studies on Cotoneaster racemiflora. J. Chem. Soc. Pak. 2007, 29, 620–623. [Google Scholar]
- Khan, S.; Riaz, N.; Afza, N.; Malik, A.; Rehman, A.U.; Iqbal, L.; Lateef, M. Antioxidant constituents from Cotoneaster racemiflora. J. Asian Nat. Prod. Res. 2009, 11, 44–48. [Google Scholar] [CrossRef]
- Al-Snafi, A.E. Pharmacological activities of Cotoneaster racemiflorus—A review. Pharm. Chem. J. 2016, 3, 98–104. [Google Scholar]
- Fakhri, M.; Davoodi, A.; Parviz, M.; Ghadi, Z.S.; Mousavinasab, S.N.; Farhadi, R.; Azadbakht, M. Characterization and HPLC analysis of manna from some Cotoneaster species. Int. J. Pharm. Sci. 2017, 8, 5360–5366. [Google Scholar]
- Nahrstedt, A. Cyanogenesis in Cotoneaster-arten. Phytochemistry 1973, 12, 1539–1542. [Google Scholar] [CrossRef]
- Sokkar, N.; El-Gindi, O.; Sayed, S.; Mohamed, S.; Ali, Z.; Alfishawy, I. Antioxidant, anticancer and hepatoprotective activities of Cotoneaster horizontalis Decne extract as well as tocopherol and amygdalin production from in vitro culture. Acta Physiol. Plant. 2013, 35, 2421–2428. [Google Scholar] [CrossRef]
- Dudonné, S.; Poupard, P.; Coutiere, P.; Woillez, M.; Richard, T.; Mérillon, J.M.; Vitrac, X. Phenolic composition and antioxidant properties of poplar bud (Populus nigra) extract: Individual antioxidant contribution of phenolics and transcriptional effect on skin aging. J. Agric. Food Chem. 2011, 59, 4527–4536. [Google Scholar] [CrossRef]
- Pluemsamran, T.; Onkoksoong, T.; Panich, U. Caffeic acid and ferulic acid inhibit UVA-induced matrix metalloproteinase-1 through regulation of antioxidant defense system in keratinocyte HaCaT cells. Photochem. Photobiol. 2012, 88, 961–968. [Google Scholar] [CrossRef] [PubMed]
- Działo, M.; Mierziak, J.; Korzun, U.; Preisner, M.; Szopa, J.; Kulma, A. The potential of plant phenolics in prevention and therapy of skin disorders. Int. J. Mol. Sci. 2016, 17, 160. [Google Scholar] [CrossRef] [Green Version]
- Huang, X.X.; Lu, J.Y.; Lai, H.F.; Wei, L.Q. F33O4 magnetic nanoparticles for cinnamic acid extraction from Ramulus cinnamomi. J. Chin. Chem. Soc. 2015, 62, 52–58. [Google Scholar] [CrossRef]
- Wittenauer, J.; Mäckle, S.; Sußmann, D.; Schweiggert-Weisz, U.; Carle, R. Inhibitory effects of polyphenols from grape pomace extract on collagenase and elastase activity. Fitoterapia 2015, 101, 179–187. [Google Scholar] [CrossRef]
- Lee, C.; Chien, Y.; Chiu, T.; Huang, W.; Lu, C.; Chiang, J.; Yang, J. Apoptosis triggered by vitexin in U937 human leukemia cells via a mitochondrial signaling pathway. Oncol. Rep. 2012, 28, 1883–1888. [Google Scholar] [CrossRef] [Green Version]
- Mohamed, S.A.; Sokkar, N.M.; El-Gindi, O.; Ali, Z.Y.; Alfishawy, I.A. Phytoconstituents investigation, anti-diabetic and anti-dyslipidemic activities of Cotoneaster horizontalis Decne cultivated in Egypt. Life Sci. J. 2012, 9, 394–403. [Google Scholar]
- Jayawardena, T.U.; Kim, H.S.; Sanjeewa, K.K.A.; Kim, S.Y.; Rho, J.R.; Jee, Y.; Ahn, G.; Jeon, Y.J. Sargassum horneri and isolated 6-hydroxy-4,4,7a-trimethyl-5,6,7,7a-tetrahydrobenzofuran-2(4H)-one (HTT); LPS-induced inflammation attenuation via suppressing NF-κB, MAPK and oxidative stress through Nrf2/HO-1 pathways in RAW 264.7 macrophages. Algal Res. 2019, 40, 101513. [Google Scholar] [CrossRef]
- Zengin, G.; Uysal, A.; Gunes, E.; Aktumsek, A. Survey of phytochemical composition and biological effects of three extracts from a wild plant (Cotoneaster nummularia Fisch. et Mey.): A potential source for functional food ingredients and drug formulations. PLoS ONE 2014, 9, e113527. [Google Scholar] [CrossRef]
- Kurutas, E.B. The importance of antioxidants which play the role in cellular response against oxidative/nitrosative stress: Current state. Nutr. J. 2016, 15, 71. [Google Scholar] [CrossRef] [PubMed] [Green Version]
- Lončarić, M.; Strelec, I.; Moslavac, T.; Šubarić, D.; Pavić, V.; Molnar, M. Lipoxygenase inhibition by plant extracts. Biomolecules 2021, 11, 152. [Google Scholar] [CrossRef]
- Sinha, P.; Srivastava, S.; Mishra, N.; Yadav, N.P. New perspectives on anti acne plant drugs: Contribution to modern therapeutics. Biomed Res. Int. 2014, 301, 4. [Google Scholar]
- Ferreres, F.; Lopes, G.; Gil-Izquierdo, A.; Andrade, P.B.; Sousa, C.; Mouga, T.; Valentão, P. Phlorotannin extracts from fucales characterized by HPLC-DAD-ESI-MSn: Approaches to hyaluronidase inhibitory capacity and antioxidant properties. Mar. Drugs 2012, 10, 2766–2781. [Google Scholar] [CrossRef] [PubMed] [Green Version]
- Bralley, E.; Greenspan, P.; Hargrov, J.L.; Hartle, D.K. Inhibition of hyaluronidase activity by Vitis rotundifolia. (Muscadine) Berry seeds and skins. Pharm. Biol. 2007, 45, 667–673. [Google Scholar] [CrossRef]
- Alberto, M.R.; Zampini, I.C.; Isla, M.I. Inhibition of cyclooxygenase activity by standardized hydroalcoholic extracts of four Asteraceae species from the Argentine Puna. Braz. J. Med. Biol. Res. 2009, 42, 787–790. [Google Scholar] [CrossRef] [Green Version]
- Sati, S.C.; Sati, M.; Sharma, A.; Joshi, M. Isolation and characterisation of phenolics from the roots of Cotoneaster acuminatus and determination of their antimicrobial activity. Int. J. Pharm. Pharm. Sci. 2010, 2, 58–60. [Google Scholar]
- Tsai, T.H.; Wu, W.H.; Tseng, J.T.P.; Tsai, P.J. In vitro antimicrobial and anti-inflammatory effects of herbs against Propionibacterium acnes. Food Chem. 2010, 119, 964–968. [Google Scholar] [CrossRef]
- Norimoto, H.; Nakajima, K.; Yomoda, S.; Morimoto, Y. Testostrone 5-alphareductase inhibitory consituents from the fruits of Rosa multiflora. Thunb. J. Trad. Med. 2010, 27, 90–95. [Google Scholar]
- Azimi, H.; Fallah-Tafti, M.; Khakshur, A.A.; Abdollahi, M. A review of phytotherapy of acne vulgaris: Perspective of new pharmacological treatments. Fitoterapia 2012, 83, 1306–1317. [Google Scholar] [CrossRef] [PubMed]
- Soto, M.; Falqué, E.; Domínguez, H. Relevance of natural phenolics from grape and derivative products in the formulation of cosmetics. Cosmetics 2015, 2, 259–276. [Google Scholar] [CrossRef] [Green Version]
- Lim, Y.H.; Kim, I.H.; Seo, J.J. In vitro activity of kaempferol isolated from Impatiens balsamina alone and in combination with erythromycin or clindamycin against Propionibacterium acnes. J. Microbiol. 2007, 45, 473–477. [Google Scholar]


| Sample | Extraction Yield (% DE) | Total Phenolic Content [mg GAE/g DE] | Total Phenolic Acids [mg CAE/g DE] | Total Flavonoid Content [mg QE/g DE] |
|---|---|---|---|---|
| CHi | 15.30 | 193.84 ± 1.14 e,f,g,h,i | 33.80 ± 1.03 e,f,g,h,i | 25.38 ± 0.35 e,f,g,h,i |
| CHi-1 | 3.00 | 83.87 ± 0.23 a,e,f,g,h,i | 10.31 ± 0.11 a,e,f,g,h,i | 0.12 ± 0.05 a,e,g,h,i |
| CHi-2 | 0.89 | 348.05 ± 2.81 a,b,e,f,g,h,i | 40.57 ± 0.19 a,b,e,f,g,h,i | 72.12 ± 0.35 a,b,e,f,g,h,i |
| CHi-3 | 17.29 | 219.00 ± 0.49 a,b,c,e,f,g,h,i | 37.83 ± 0.15 a,b,c,e,f,g,h,i | 58.71 ± 0.49 a,b,c,e,f,g,h,i |
| CHi-4 | 6.86 | 463.16 ± 3.94 a,b,c,d,e,f,g,h,i | 56.12 ± 0.27 a,b,c,d,e,f,g,h | 134.89 ± 0.51 a,b,c,d,i |
| CHs | 27.22 | 296.13 ± 1.52 | 61.27 ± 0.93 | 47.72 ± 0.37 |
| CHs-1 | 6.73 | 143.30 ± 1.09 e | 19.65 ± 0.30 e | 0.23 ± 0.02 e |
| CHs-2 | 2.07 | 486.04 ± 3.17 e,f | 83.94 ± 0.25 e,f | 97.66 ± 0.18 e,f |
| CHs-3 | 14.04 | 381.83 ± 2.53 e,f,g | 70.17 ± 0.13 e,f,g | 146.58 ± 1.10 e,f,g |
| CHs-4 | 5.76 | 559.77 ± 3.76 e,f,g,h | 91.95 ± 0.48 e,f,g,h | 252.27 ± 0.24 e,f,g,h |
| Peak No. | Name of Compound | [M − H]− | MS2 | Theoretical Mass [M − H]− (Da) | Experimental Mass [M − H]− (Da) | Δ ppm | Δ mDa | Elemental Composition |
|---|---|---|---|---|---|---|---|---|
| 1 | Mannitol | 181 | 59,71,73,85,89,101,113,119,163 | 181.07122 | 181.07118 | 0.22 | −0.04 | C6H13O6 |
| 4 | Quercetin-3-O-(2″-O-xylosyl)galactoside | 595 | 271,301b,435 | 595.12992 | 595.12999 | 0.12 | 0.07 | C26H27O16 |
| 5 | Quercetin-3-O-gentiobioside | 625 | 271,301b,463 | 625.14048 | 625.14038 | 0.16 | −0.10 | C27H29O17 |
| 6 | Vitexin-2″-O-arabinoside | 563 | 283,432b | 563.14009 | 563.14001 | 0.14 | −0.08 | C26H27O14 |
| 7 | Apigenin-6,8-C-dicelobioside | 593 | 325,386b,387 | 593.15065 | 593.15077 | 0.20 | 0.12 | C27H29O15 |
| 8 | Vitexin-2″-O-rhamnoside | 577 | 283,432b | 577.15574 | 577.15571 | 0.05 | −0.03 | C27H29O14 |
| 9 | Quercetin-3-O-glucoside (Isoquercitrin) | 463 | 271,300b,301 | 463.08766 | 463.08775 | 0.19 | 0.09 | C21H19O12 |
| 10 | Quercetin-3-O-galactoside (Hyperoside) | 463 | 271,300b,301 | 463.08766 | 463.08763 | 0.06 | −0.03 | C21H19O12 |
| 11 | Kaempferol-3-O-glucoside (Astragalin) | 447 | 284b,300 | 447.09274 | 447.09289 | 0.34 | 0.15 | C21H19O11 |
| 12 | Quercetin-3-O-rhamnoside (Quercitrin) | 447 | 284b,300 | 447.09274 | 447.09271 | 0.07 | −0.03 | C21H19O11 |
| 13 | 7-Methylkaempferol-4′-O-glucoside | 461 | 298b,315 | 461.10839 | 461.10849 | 0.22 | 0.10 | C22H21O11 |
| 14 | 3′,4′-dihydroxy-6-methoxyflavone-7-O-rhamnoside | 429 | 255,283b,400,401 | 429.11856 | 429.11853 | 0.07 | −0.03 | C22H21O9 |
| 15 | Apigenin-8-C-glucoside (Vitexin) | 431 | 283,311b,312,341 | 429.11856 | 429.11842 | 0.33 | −0.14 | C21H19O10 |
| 16 | Apigenin-7-O-glucoside | 447 | 269b,270,431 | 431.09783 | 431.09797 | 0.32 | 0.14 | C21H19O10 |
| 17 | Biochanin A-7-O-glucoside (Sissotrin) | 445 | 132,211,223,224,239b,240,267 | 445.11348 | 445.11355 | 0.16 | 0.07 | C22H21O10 |
| 18 | 5,7,2′,5′-tetrahydroxyflavanone-7-O-glucoside | 449 | 286b,302 | 449.10839 | 449.10825 | 0.31 | −0.14 | C21H21O11 |
| 19 | 5-Methylgenistein-4′-O-glucoside | 445 | 255,283b,417,430 | 445.11348 | 445.11339 | 0.20 | −0.09 | C22H21O10 |
| 20 | Gentisic acid 2-O-glucoside (Orbicularin) | 315 | 153b,271 | 315.07161 | 315.07149 | 0.38 | −0.12 | C13H15O9 |
| 27 | Caffeoylmalic acid | 295 | 133,135,179b | 295.0454 | 295.04533 | 0.24 | −0.07 | C13H11O8 |
| 28 | Prunasin | 294 | 161b | 294.09777 | 294.09771 | 0.20 | −0.06 | C14H16NO6 |
| 29 | Amygdalin | 456 | 89,119,143,179,221,263,323b | 456.15059 | 456.15047 | 0.26 | −0.12 | C20H26NO11 |
| 33 | 7,8-dimethoxy-6-hydroxycoumarin | 221 | 191,206b,207 | 221.045 | 221.04506 | 0.27 | 0.06 | C11H9O5 |
| 35 | Cotonoate A | 291 | 121,165,247b | 291.15964 | 291.15975 | 0.38 | 0.11 | C17H23O4 |
| 36 | Horizontoate A | 263 | 148,164,219b | 263.12834 | 263.12852 | 0.68 | 0.18 | C15H19O4 |
| 37 | 3,3′,4′-tri-O-methylellagic acid | 343 | 255,284,299b,329 | 343.0454 | 343.04554 | 0.41 | 0.14 | C17H11O8 |
| 40 | Scopoletin | 191 | 104,105,120,148b,176 | 191.03444 | 191.03439 | 0.26 | −0.05 | C10H7O4 |
| 41 | Arbutin | 271 | 71,101,108b,109,113,161 | 271.08178 | 271.08175 | 0.11 | −0.03 | C12H15O7 |
| 42 | 5-Methylgenistein | 283 | 239b,255,269 | 283.06065 | 283.06053 | 0.42 | −0.12 | C16H11O5 |
| 44 | Eriodictyol | 287 | 151,162b | 287.05557 | 287.05551 | 0.21 | −0.06 | C15H11O6 |
| 45 | 5,7,2′,5′-tetrahydroxyflavanone | 287 | 151,162b,259 | 287.05557 | 287.05564 | 0.24 | 0.07 | C15H11O6 |
| 46 | Naringenin | 271 | 119,151b,187 | 271.06065 | 271.06061 | 0.15 | −0.04 | C15H11O5 |
| 47 | Horizontoate C | 482 | 210,272b,288 | 482.42093 | 482.42097 | 0.08 | 0.04 | C29H56NO4 |
| No | Compound | Calibration Standard | Amounts [μg/g DE] | |
|---|---|---|---|---|
| CHi | CHs | |||
| 1 | mannitol | glucose | 6834 ± 249 | 3104 ± 123 * |
| 2 | ascorbic acid | ascorbic acid | 298 ± 10 | 1726 ± 66 * |
| 3 | quercetin 3-O-rutinoside (rutin) | rutin | 18,028 ± 650 | 3823 ± 131* |
| 4 | quercetin 3-O-(2″-O-xylosyl)galactoside | rutin | 7318 ± 289 | 2667 ± 99 * |
| 5 | quercetin 3-O-gentiobioside | rutin | 2759 ± 109 | 2310 ± 87 |
| 6 | vitexin 2″-O-arabinoside | rutin | 5625 ± 233 | 3249 ± 121 * |
| 7 | apigenin 6,8-C-dicelobioside | rutin | 5926 ± 225 | 1273 ± 50 * |
| 8 | vitexin 2″-O-rhamnoside | rutin | 3923 ± 154 | 1268 ± 49 * |
| 9 | quercetin 3-O-glucoside (isoquercitrin) | rutin | 10,079 ± 353 | 8926 ± 327 * |
| 10 | quercetin 3-O-galactoside (hyperoside) | rutin | 9119 ± 331 | 6184 ± 237 * |
| 11 | kaempferol 3-O-glucoside (astragalin) | rutin | 2480 ± 92 | 4430 ± 168 * |
| 12 | quercetin 3-O-rhamnoside (quercitrin) | rutin | 2158 ± 80 | 6726 ± 251 * |
| 13 | 7-methylkaempferol 4′-O-glucoside | rutin | 3939 ± 137.9 | 2079 ± 79 * |
| 14 | 3′,4′-dihydroxy-6-methoxyflavone 7-O-rhamnoside | rutin | 1538 ± 50 | 443 ± 16 * |
| 15 | apigenin 8-C-glucoside (vitexin) | rutin | 2454 ± 94 | 1930 ± 77 * |
| 16 | apigenin 7-O-glucoside | rutin | 1486 ± 57 | 3734 ± 149 * |
| 17 | biochanin A 7-O-glucoside (sissotrin) | rutin | 724 ± 26 | 709 ± 23 |
| 18 | 5,7,2′,5′-tetrahydroxyflavanone 7-O-glucoside | rutin | 8067 ± 290 | 2469 ± 93 * |
| 19 | 5-methylgenistein 4′-O-glucoside | rutin | 1205 ± 43 | 943 ± 34 * |
| 20 | orbicularin | quercetin | 3838 ± 154 | 1818 ± 79 * |
| 21 | p-hydroxybenzoic acid | p-hydroxybenzoic acid | 897 ± 30 | 823 ± 27 * |
| 22 | benzoic acid | benzoic acid | 339 ± 12 | 441 ± 16 |
| 23 | gentisic acid | gentisic acid | 258 ± 10 | <LOQ |
| 24 | protocatechuic acid | protocatechuic acid | 509 ± 20 | 69 ± 3 * |
| 25 | syringic acid | syringic acid | 753 ± 31 | 1130 ± 39 * |
| 26 | vanillic acid | vanillic acid | <LOQ | <LOQ |
| 27 | caffeoylmalic acid | caffeic acid | 2828 ± 109 | 1459 ± 51 * |
| 28 | chlorogenic acid | chlorogenic acid | 37,932 ± 1330 | 60,043 ± 2231 * |
| 29 | prunasin | glucose | 3360 ± 127 | 1226 ± 61 |
| 30 | p-coumaric acid | p-coumaric acid | 329 ± 13 | 539 ± 19 * |
| 31 | amygdalin | glucose | 1803 ± 63 | 555 ± 19 * |
| 32 | caffeic acid | caffeic acid | 6118 ± 223 | 2220 ± 81 * |
| 33 | cinnamic acid | cinnamic acid | 924 ± 31 | 2429 ± 89 * |
| 34 | ferulic acid | ferulic acid | 644 ± 24 | 1567 ± 65 * |
| 35 | salicylic acid | salicylic acid | 657 ± 27 | 823 ± 30 * |
| 36 | 7,8-dimethoxy-6-hydroxycoumarin | umbelliferone | 1209 ± 43 | <LOQ |
| 37 | cotonoate A | benzoic acid | 1564 ± 55 | <LOQ |
| 38 | horizontoate A | benzoic acid | <LOQ | <LOQ |
| 39 | 3,3′,4′-tri-O-methylellagic acid | quercetin | 2053 ± 81 | 1169 ± 45 * |
| 40 | scopoletin | umbelliferone | 12,219 ± 440 | 10,481 ± 371 * |
| 41 | arbutin | glucose | 1126 ± 41 | 1084 ± 46 * |
| 42 | 5-methylgenistein | quercetin | 1109 ± 39 | 1423 ± 59 * |
| 43 | quercetin | quercetin | 229 ± 7 | 115 ± 4 * |
| 44 | horizontoate C | oleic acid | 5516 ± 219 | 2939 ± 119 * |
| 45 | eriodictyol | quercetin | 59 ± 3 | <LOQ |
| 46 | 5,7,2′,5′-tetrahydroxyflavanone | quercetin | 89 ± 5 | <LOQ |
| 47 | naringenin | quercetin | 2627 ± 97 | 2121 ± 88 * |
| No. | tr | Area | %Area | Compound |
|---|---|---|---|---|
| 1 | 9.776 | 39557931 | 2.52 | Benzofuran, 2,3-dihydro- |
| 2 | 10.908 | 12341078 | 0.79 | Isosorbide |
| 3 | 12.913 | 3452024 | 0.22 | Furan, 3-(4-methyl-5-trans-phenyl-1,3-oxazolidin-2-yl)- |
| 4 | 13.952 | 192528086 | 12.29 | 1,3:2,5-Dimethylene-L-rhamnitol |
| 5 | 14.242 | 135536063 | 8.65 | d-Glycero-d-galacto-heptose |
| 6 | 15.48 | 7430877 | 0.47 | Megastigmatrienone |
| 7 | 15.988 | 32418863 | 2.07 | 3-Hydroxy-.beta.-damascone |
| 8 | 16.329 | 229108049 | 14.62 | 2-Deoxy-d-galactose |
| 9 | 17.009 | 21401978 | 1.37 | 2-Hydroxyhexadecyl butanoate |
| 10 | 17.229 | 21671810 | 1.38 | (E)-2,6-Dimethoxy-4-(prop-1-en-1-yl)phenol |
| 11 | 17.448 | 5862283 | 0.37 | Myristic acid methyl ester |
| 12 | 17.709 | 6588889 | 0.42 | 9-(3,3-Dimethyloxiran-2-yl)-2,7-dimethylnona-2,6-dien-1-ol |
| 13 | 18.137 | 7027919 | 0.45 | 6-Hydroxy-4,4,7a-trimethyl-5,6,7,7a-tetrahydrobenzofuran-2(4H)-one |
| 14 | 18.951 | 19840196 | 1.27 | Neophytadiene |
| 15 | 19.034 | 6060805 | 0.39 | 2-Pentadecanone, 6,10,14-trimethyl- |
| 16 | 19.222 | 10207664 | 0.65 | [1,1′-Bicyclopropyl]-2-octanoic acid, 2′-hexyl-, methyl ester |
| 17 | 19.496 | 10733207 | 0.69 | 3,7,11,15-Tetramethyl-2-hexadecen-1-ol |
| 18 | 20.028 | 157760294 | 10.07 | Hexadecanoic acid, methyl ester |
| 19 | 20.525 | 95409334 | 6.09 | Palmitic acid |
| 20 | 21.372 | 11475712 | 0.73 | Cyclohexanebutanoic acid |
| 21 | 21.913 | 3242083 | 0.21 | Methyl trans-4-(2-nonylcyclopentyl)butanoate |
| 22 | 22.029 | 10523560 | 0.67 | cis-11,14-Eicosadienoic acid, methyl ester |
| 23 | 22.104 | 33503994 | 2.14 | Linolenic acid methyl ester |
| 24 | 22.17 | 5141879 | 0.33 | 9-Octadecenoic acid (Z)-, methyl ester |
| 25 | 22.251 | 247573718 | 15.79 | Phytol, acetate |
| 26 | 22.387 | 53091621 | 3.39 | Methyl stearate |
| 27 | 23.854 | 32049624 | 2.05 | Benzyl.beta.-d-glucoside |
| 28 | 24.561 | 3681746 | 0.24 | Methyl 18-methylnonadecanoate |
| 29 | 24.852 | 4060228 | 0.26 | 4,8,12,16-Tetramethylheptadecan-4-olide |
| 30 | 25.205 | 2015357 | 0.13 | 3,7,11,15-Tetramethylhexadec-2-en-1-yl acetate |
| 31 | 26.197 | 5666720 | 0.36 | 1-Heptacosanol |
| 32 | 26.403 | 17982618 | 1.15 | 1-Docosanol, methyl ether |
| 33 | 27.053 | 3938497 | 0.25 | Phytyl palmitate |
| 34 | 28.102 | 4304975 | 0.27 | 9-Hexacosene |
| 35 | 28.421 | 2176024 | 0.14 | Methyl 18-methylnonadecanoate |
| 36 | 31.436 | 1813814 | 0.12 | Cholesta-4,6-dien-3-ol, (3.beta.)- |
| 37 | 31.551 | 8162207 | 0.52 | Octatriacontyl trifluoroacetate |
| 38 | 31.851 | 40546560 | 2.59 | dl-.alpha.-Tocopherol |
| 39 | 33.331 | 54433136 | 3.47 | beta.-Sitosterol |
| 40 | 33.63 | 1502659 | 0.10 | Acetyl betulinaldehyde |
| 41 | 33.87 | 1185800 | 0.08 | Urs-12-en-28-al |
| 42 | 34.019 | 3680922 | 0.23 | Acetyl betulinaldehyde |
| No. | tr | Area | %Area | Compound |
|---|---|---|---|---|
| 1 | 9.655 | 1862168 | 0.19 | Benzofuran, 2,3-dihydro- |
| 2 | 10.990 | 2840045 | 0.28 | Isosorbide |
| 3 | 12.933 | 560231 | 0.06 | Furan, 3-(4-methyl-5-trans-phenyl-1,3-oxazolidin-2-yl)- |
| 4 | 13.854 | 146558815 | 14.62 | 1,3:2,5-Dimethylene-L-rhamnitol |
| 5 | 14.235 | 38707499 | 3.86 | d-Glycero-d-galacto-heptose |
| 6 | 14.608 | 21753970 | 2.17 | Lauric acid methyl ester |
| 7 | 15.280 | 11348450 | 1.13 | Tridecanoic acid |
| 8 | 15.501 | 4033264 | 0.40 | Megastigmatrienone |
| 9 | 16.125 | 55318375 | 5.52 | 2-Deoxy-d-galactose |
| 10 | 16.648 | 30284734 | 3.02 | d-Glucitol, 2,5-anhydro-1-O-octyl- |
| 11 | 17.070 | 6971059 | 0.70 | 2-Hydroxyhexadecyl butanoate |
| 12 | 17.456 | 8567378 | 0.85 | Myristic acid methyl ester |
| 13 | 17.725 | 2962331 | 0.30 | 9-(3,3-Dimethyloxiran-2-yl)-2,7-dimethylnona-2,6-dien-1-ol |
| 14 | 18.153 | 4592151 | 0.46 | 6-Hydroxy-4,4,7a-trimethyl-5,6,7,7a-tetrahydrobenzofuran-2(4H)-one |
| 15 | 18.416 | 10513893 | 1.05 | Benzenesulfonamide, N-butyl- |
| 16 | 18.952 | 13881898 | 1.38 | Neophytadiene |
| 17 | 19.037 | 7043508 | 0.70 | 2-Pentadecanone, 6,10,14-trimethyl- |
| 18 | 19.269 | 4920685 | 0.49 | [1,1′-Bicyclopropyl]-2-octanoic acid, 2′-hexyl-, methyl ester |
| 19 | 19.500 | 7077957 | 0.71 | 3,7,11,15-Tetramethyl-2-hexadecen-1-ol |
| 20 | 20.027 | 170606966 | 17.02 | Hexadecanoic acid, methyl ester |
| 21 | 20.515 | 51495640 | 5.14 | Palmitic acid |
| 22 | 21.239 | 2788195 | 0.28 | Cyclohexanebutanoic acid |
| 23 | 21.920 | 3248248 | 0.32 | Methyl trans-4-(2-nonylcyclopentyl)butanoate |
| 24 | 22.033 | 9779382 | 0.98 | cis-11,14-Eicosadienoic acid, methyl ester |
| 25 | 22.105 | 34030060 | 3.39 | Linolenic acid methyl ester |
| 26 | 22.172 | 3962623 | 0.40 | 9-Octadecenoic acid (Z)-, methyl ester |
| 27 | 22.247 | 216221222 | 21.55 | Phytol, acetate |
| 28 | 22.386 | 56126780 | 5.60 | Methyl stearate |
| 29 | 23.876 | 3905372 | 0.39 | Benzyl.beta.-d-glucoside |
| 30 | 24.565 | 3540084 | 0.35 | Methyl 18-methylnonadecanoate |
| 31 | 24.857 | 1679444 | 0.17 | 4,8,12,16-Tetramethylheptadecan-4-olide |
| 32 | 25.213 | 1068195 | 0.11 | 3,7,11,15-Tetramethylhexadec-2-en-1-yl acetate |
| 33 | 26.211 | 1769239 | 0.18 | 1-Heptacosanol |
| 34 | 27.057 | 2638778 | 0.26 | Phytyl palmitate |
| 35 | 28.117 | 1110457 | 0.11 | 9-Hexacosene |
| 36 | 28.430 | 1074607 | 0.11 | Methyl 18-methylnonadecanoate |
| 37 | 28.792 | 1507426 | 0.15 | Neophytadiene |
| 38 | 29.305 | 1886233 | 0.19 | 2,6,10,14,18-Pentamethyl-2,6,10,14,18-eicosapentaene |
| 39 | 31.856 | 19787504 | 1.97 | dl-α-Tocopherol |
| 40 | 33.332 | 33729826 | 3.36 | β-Sitosterol |
| 41 | 34.009 | 802361 | 0.08 | Acetyl betulinaldehyde |
| Sample | IC50 | ||
|---|---|---|---|
| DPPH [μg/mL] | ABTS [μg/mL] | CHEL [μg/mL] | |
| CHi | 21.73 ± 0.13 e,f,g,h,i,k,l | 4.14 ± 0.10 e,f,g,h,i,j,k,l | 3.54 ± 0.15 f |
| CHi-1 | 32.37 ± 0.19 a,e,f,g,h,i,k,l | 5.48 ± 0.12 a,e,f,g,h,i,j,k,l | 182.67 ± 4.19 a,e,f,g,h,i,m |
| CHi-2 | 8.83 ± 0.10 a,b,e,f,g,h,i,j,k,l | 1.68 ± 0.03 a,b,e,f,g,h,i,k,l | 2.94 ± 0.03 b,f |
| CHi-3 | 13.69 ± 0.14 a,b,c,e,f,g,h,i,j,k,l | 2.74 ± 0.11 a,b,c,e,f,g,h,i,j,k,l | 4.04 ± 0.16 b,f |
| CHi-4 | 5.40 ± 0.10 a,b,c,d,e,f,g,h,i,j,k,l | 0.90 ± 0.02 a,b,c,d,e,f,i,j,k,l | 1.19 ± 0.05 b,f,i,m |
| CHs | 10.16 ± 0.02 j,k,l | 1.92 ± 0.13 j,l | 1.73 ± 0.10 j,m |
| CHs-1 | 18.15 ± 0.13 e,j,k,l | 1.53 ± 0.09 e,j | 76.50 ± 1.45 e,j,m |
| CHs-2 | 4.15 ± 0.05 e,f,j,k,l | 0.80 ± 0.02 e,f,j,k,l | 1.10 ± 0.03 f,j,m |
| CHs-3 | 3.43 ± 0.02 e,f,g,j,k | 0.68 ± 0.05 e,f,j,k,l | 1.01 ± 0.01 f,j,m |
| CHs-4 | 2.08 ± 0.03 e,f,g,h,k,l | 0.37 ± 0.01 e,f,g,h,j,k,l | 0.50 ± 0.01 f,j,m |
| quercetin | 2.05 ± 0.10 | 3.27 ± 0.23 | 6.24 ± 0.19 |
| AA | 4.75 ± 0.16 | 1.73 ± 0.09 | nt |
| Trolox | 3.68 ± 0.09 | 1.31 ± 0.05 | nt |
| Na2EDTA*2H2O | nt | nt | 4.15 ± 0.10 |
| Sample | IC50 [µg/mL] | |||
|---|---|---|---|---|
| Lipoxygenase Inhibition | Hyaluronidase Inhibition | COX-1 Inhibition | COX-2 Inhibition | |
| CHi | 28.73 ± 2.01 e,f,g,h,i,l | 15.09 ± 0.61 e,g,h,i,k | 24.77 ± 0.35 e,f,g,h,i,j | 19.95 ± 0.08 e,f,g,h,i,j |
| CHi-1 | 129.46 ± 6.35 a,i,l | 24.95 ± 0.52 a,e,f,g,h,i,k | 62.54 ± 1.02 a,e,f,g,h,i,j | 100.36 ± 1.27 a,e,f,g,h,i,j |
| CHi-2 | 19.77 ± 1.56 b,i,l | 13.19 ± 0.08 a,b,e,f,g,h,i,k | 11.15 ± 0.42 a,b,e,f,g,h,i,j | 16.68 ± 0.19 a,b,e,f,g,h,i j |
| CHi-3 | 45.69 ± 4.21 a,b,c,i,l | 10.28 ± 0.23 a,b,c,e,f,g,h,i,k | 46.71 ± 0.69 a,b,c,e,f,g,h,i,j | 38.50 ± 0.32 a,b,c,e,f,g,h,i,j |
| CHi-4 | 97.12 ± 3.86 a,b,c,d,i,l | 19.80 ± 0.51 a,b,c,d,e,f,g,h,i,k | 45.35 ± 0.47 a,b,c,e,f,g,h,i,j | 81.69 ± 0.78 a,b,c,d,e,f,g,h,i,j |
| CHs | 11.06 ± 1.14 l | 6.82 ± 0.15 k | 13.02 ± 0.17 j | 9.21 ± 0.09 j |
| CHs-1 | 72.15 ± 1.57 e,l | 14.76 ± 0.19 e,k | 34.12 ± 0.28 e,j | 57.59 ± 0.65 e,j |
| CHs-2 | 4.15 ± 0.31 e,f | 1.17 ± 0.02 e,f,k | 6.39 ± 0.04 e,f,j | 5.09 ± 0.06 e,f |
| CHs-3 | 11.56 ± 0.98 f,g,l | 7.41 ± 0.05 e,f,g,k | 15.56 ± 0.13 e,f,g,j | 10.32 ± 0.25 e,f,g,j |
| CHs-4 | 5.72 ± 0.26 e,f,h | 1.89 ± 0.05 e,f,g,h,k | 9.54 ± 0.04 e,f,g,j | 15.03 ± 0.19 e,f,g,j |
| IND | nt | nt | 4.34 ± 0.05 | 3.82 ± 0.09 |
| EGCG | nt | 6.25 ± 0.02 | nt | nt |
| NDGA | 5.89 ± 0.15 | nt | nt | nt |
| Sample | S. aureus ATCC 25923 | S. epidermidis ATCC 12228 | C. acnes PCM 2400 | C. acnes PCM 2334 | C. acnes ATCC 11827 | C. granulosu PCM 2462 | ||||||
|---|---|---|---|---|---|---|---|---|---|---|---|---|
| MIC [µg/mL] | MIC [µg/mL] | MIC [µg/mL] | MIC [µg/mL] | MIC [µg/mL] | MIC [µg/mL] | |||||||
| CHi | >1000 | >4 | >1000 | >4 | >1000 | >4 | >1000 | >4 | >1000 | >4 | >1000 | >4 |
| CHs | >1000 | >4 | >1000 | >4 | >1000 | >4 | >1000 | >4 | >1000 | >4 | >1000 | >4 |
| CHs-1 | >1000 | >4 | 1000 | >4 | 500 | >4 | 1000 | >4 | 1000 | >4 | 500 | >4 |
| CHs-2 | 500 | >4 | 1000 | >4 | 31.25 | 8 | 62.5 | 8 | 125 | 8 | 62.5 | 8 |
| CHs-3 | >1000 | >4 | >1000 | >4 | 1000 | >4 | 500 | >4 | 1000 | >4 | 1000 | >4 |
| CHs-4 | 1000 | >4 | >1000 | >4 | 250 | >4 | 250 | >4 | 125 | >8 | 250 | >4 |
Publisher’s Note: MDPI stays neutral with regard to jurisdictional claims in published maps and institutional affiliations. |
© 2022 by the authors. Licensee MDPI, Basel, Switzerland. This article is an open access article distributed under the terms and conditions of the Creative Commons Attribution (CC BY) license (https://creativecommons.org/licenses/by/4.0/).
Share and Cite
Krzemińska, B.; Dybowski, M.P.; Klimek, K.; Typek, R.; Miazga-Karska, M.; Dos Santos Szewczyk, K. The Anti-Acne Potential and Chemical Composition of Two Cultivated Cotoneaster Species. Cells 2022, 11, 367. https://0-doi-org.brum.beds.ac.uk/10.3390/cells11030367
Krzemińska B, Dybowski MP, Klimek K, Typek R, Miazga-Karska M, Dos Santos Szewczyk K. The Anti-Acne Potential and Chemical Composition of Two Cultivated Cotoneaster Species. Cells. 2022; 11(3):367. https://0-doi-org.brum.beds.ac.uk/10.3390/cells11030367
Chicago/Turabian StyleKrzemińska, Barbara, Michał P. Dybowski, Katarzyna Klimek, Rafał Typek, Małgorzata Miazga-Karska, and Katarzyna Dos Santos Szewczyk. 2022. "The Anti-Acne Potential and Chemical Composition of Two Cultivated Cotoneaster Species" Cells 11, no. 3: 367. https://0-doi-org.brum.beds.ac.uk/10.3390/cells11030367