
Multifaceted Analyses of Isolated Mitochondria Establish the Anticancer Drug 2-Hydroxyoleic Acid as an Inhibitor of Substrate Oxidation and an Activator of Complex IV-Dependent State 3 Respiration

 , ,
, ,  ,
,  , , , , and
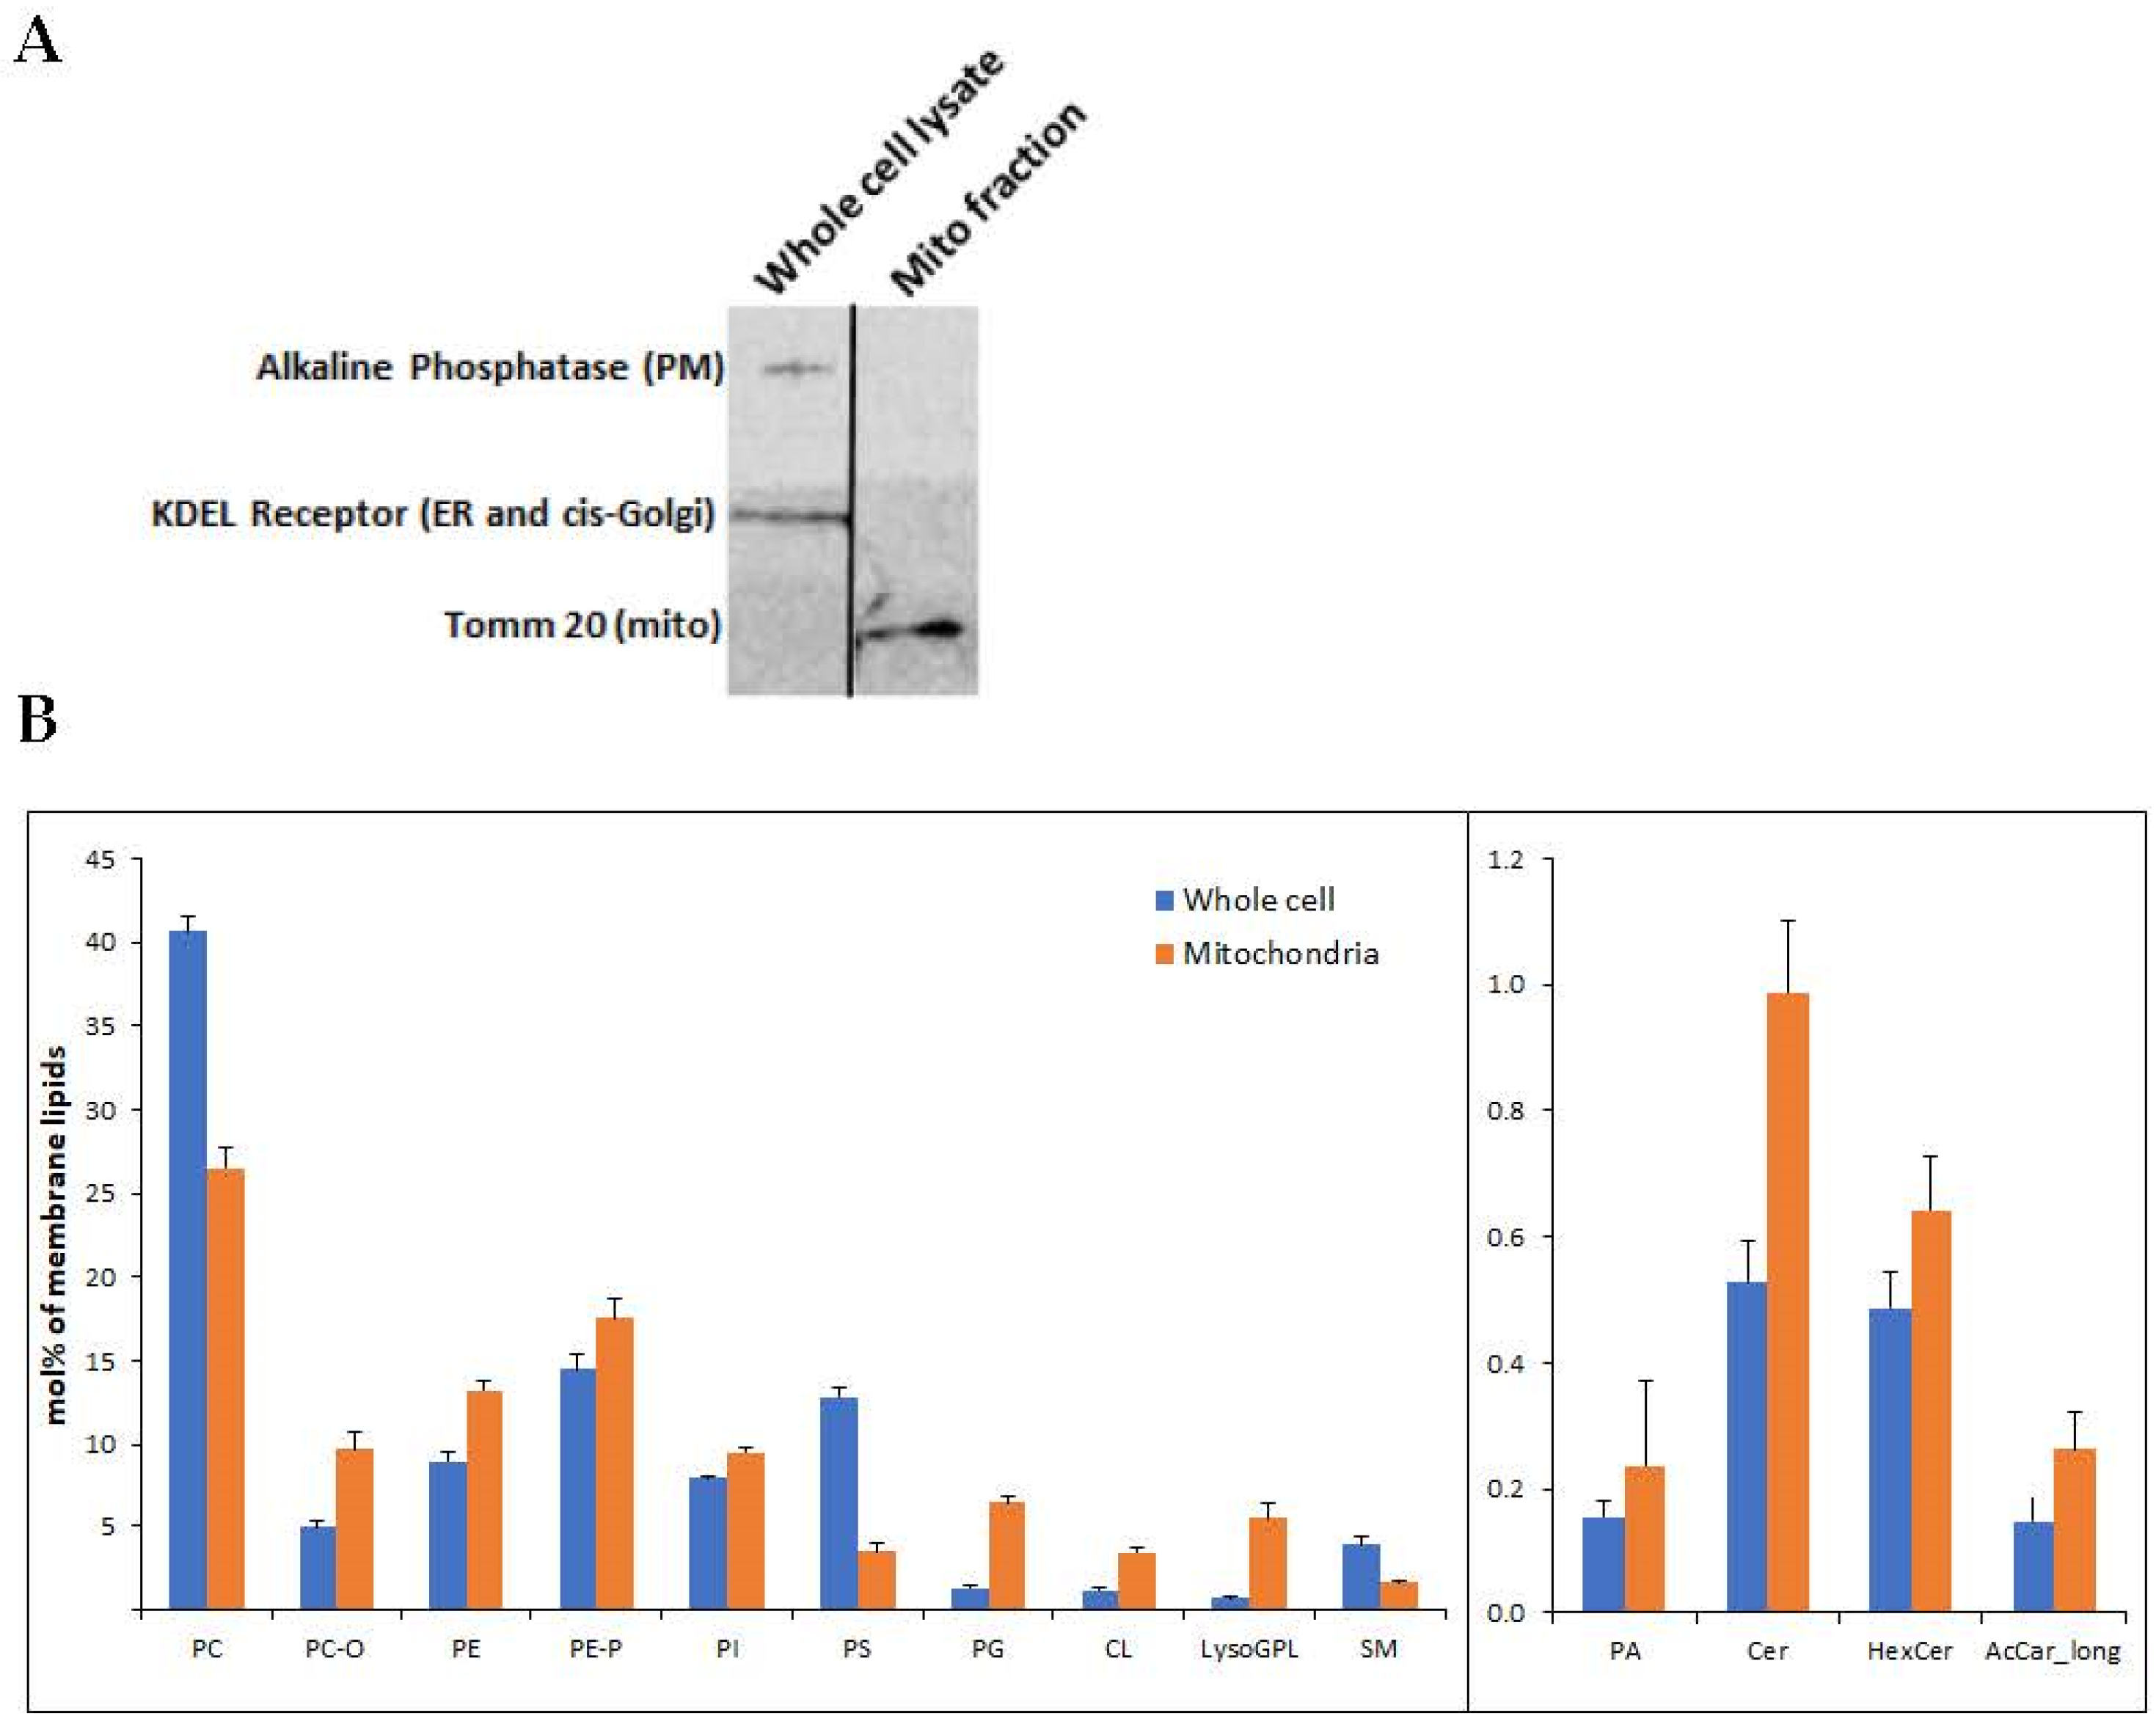
Abstract
:1. Introduction
2. Materials and Methods
2.1. Western Immunoblotting
2.2. Lipidomics
2.3. Molecular Dynamics Simulations
2.4. Determining the Activity of Mitochondrial Enzymes
2.5. Flow Cytometry
2.6. Evaluating β-Oxidation by Mass Spectrometry
2.7. Bioenergetic Studies
2.8. Statistical Analysis
3. Results
3.1. Lipidomics Analysis of Isolated Mitochondria
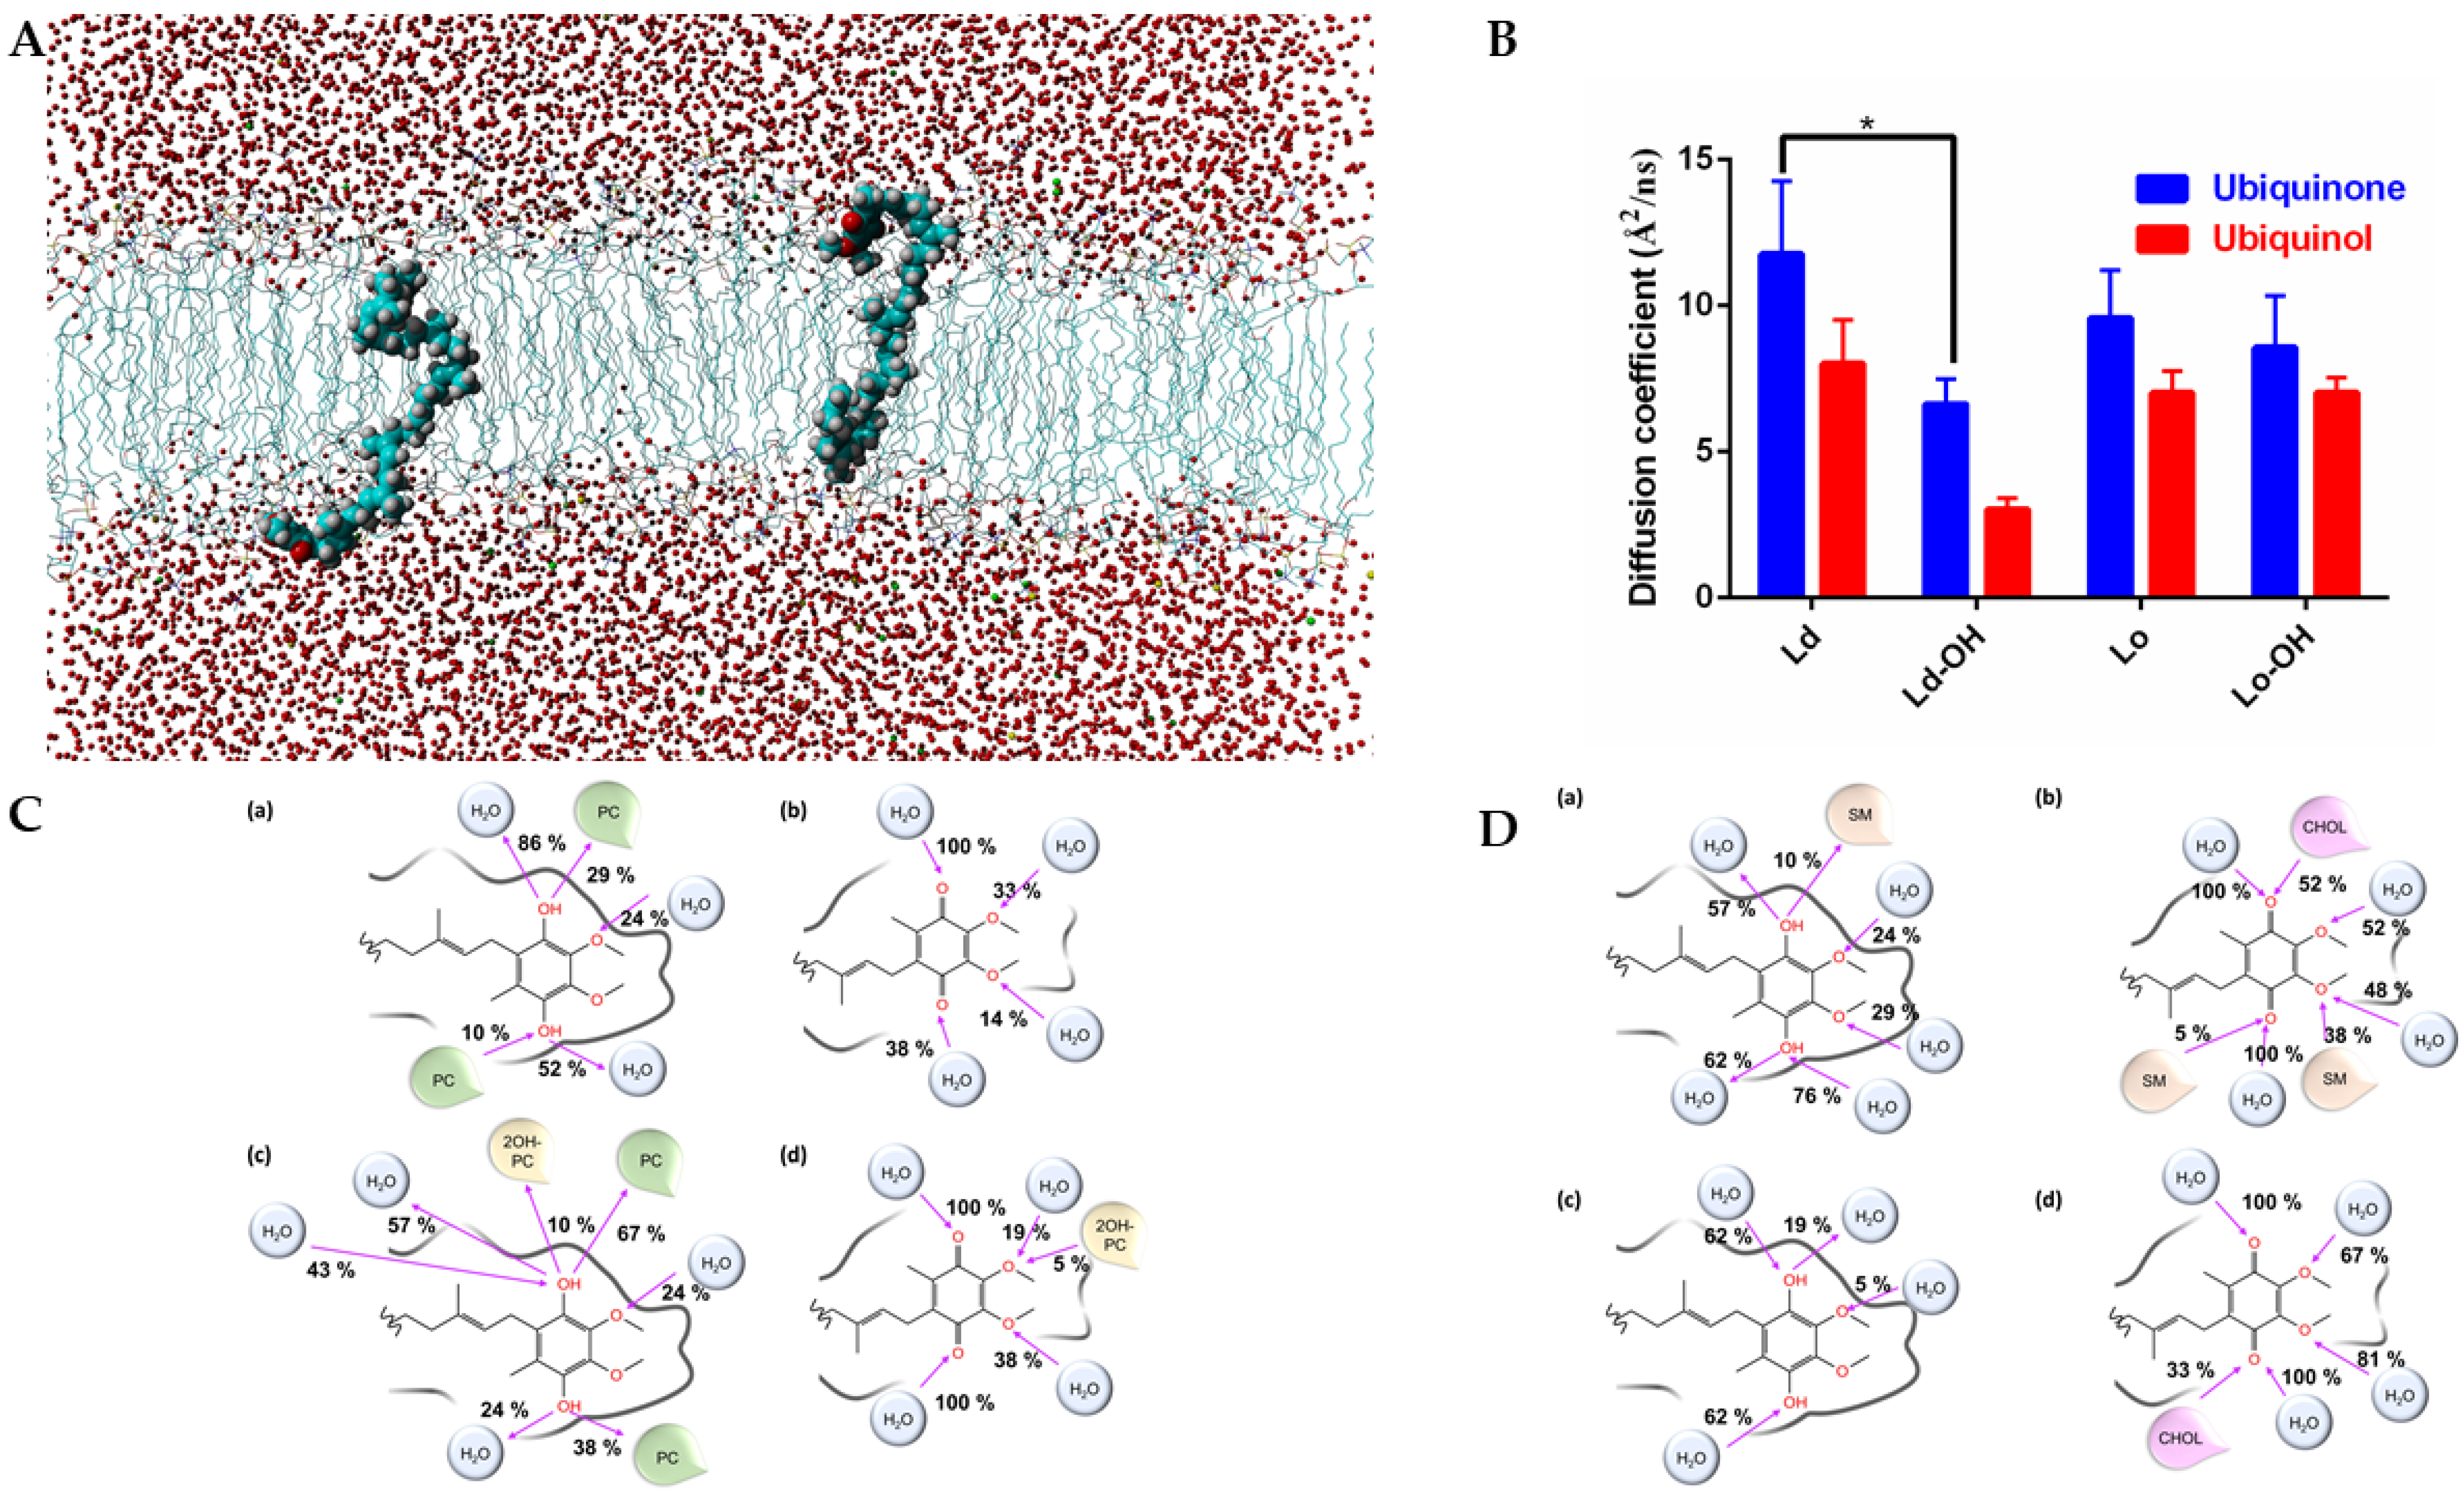
3.2. Molecular Dynamic Simulation of the Effect of 2OHOA on Mitochondrial Membranes
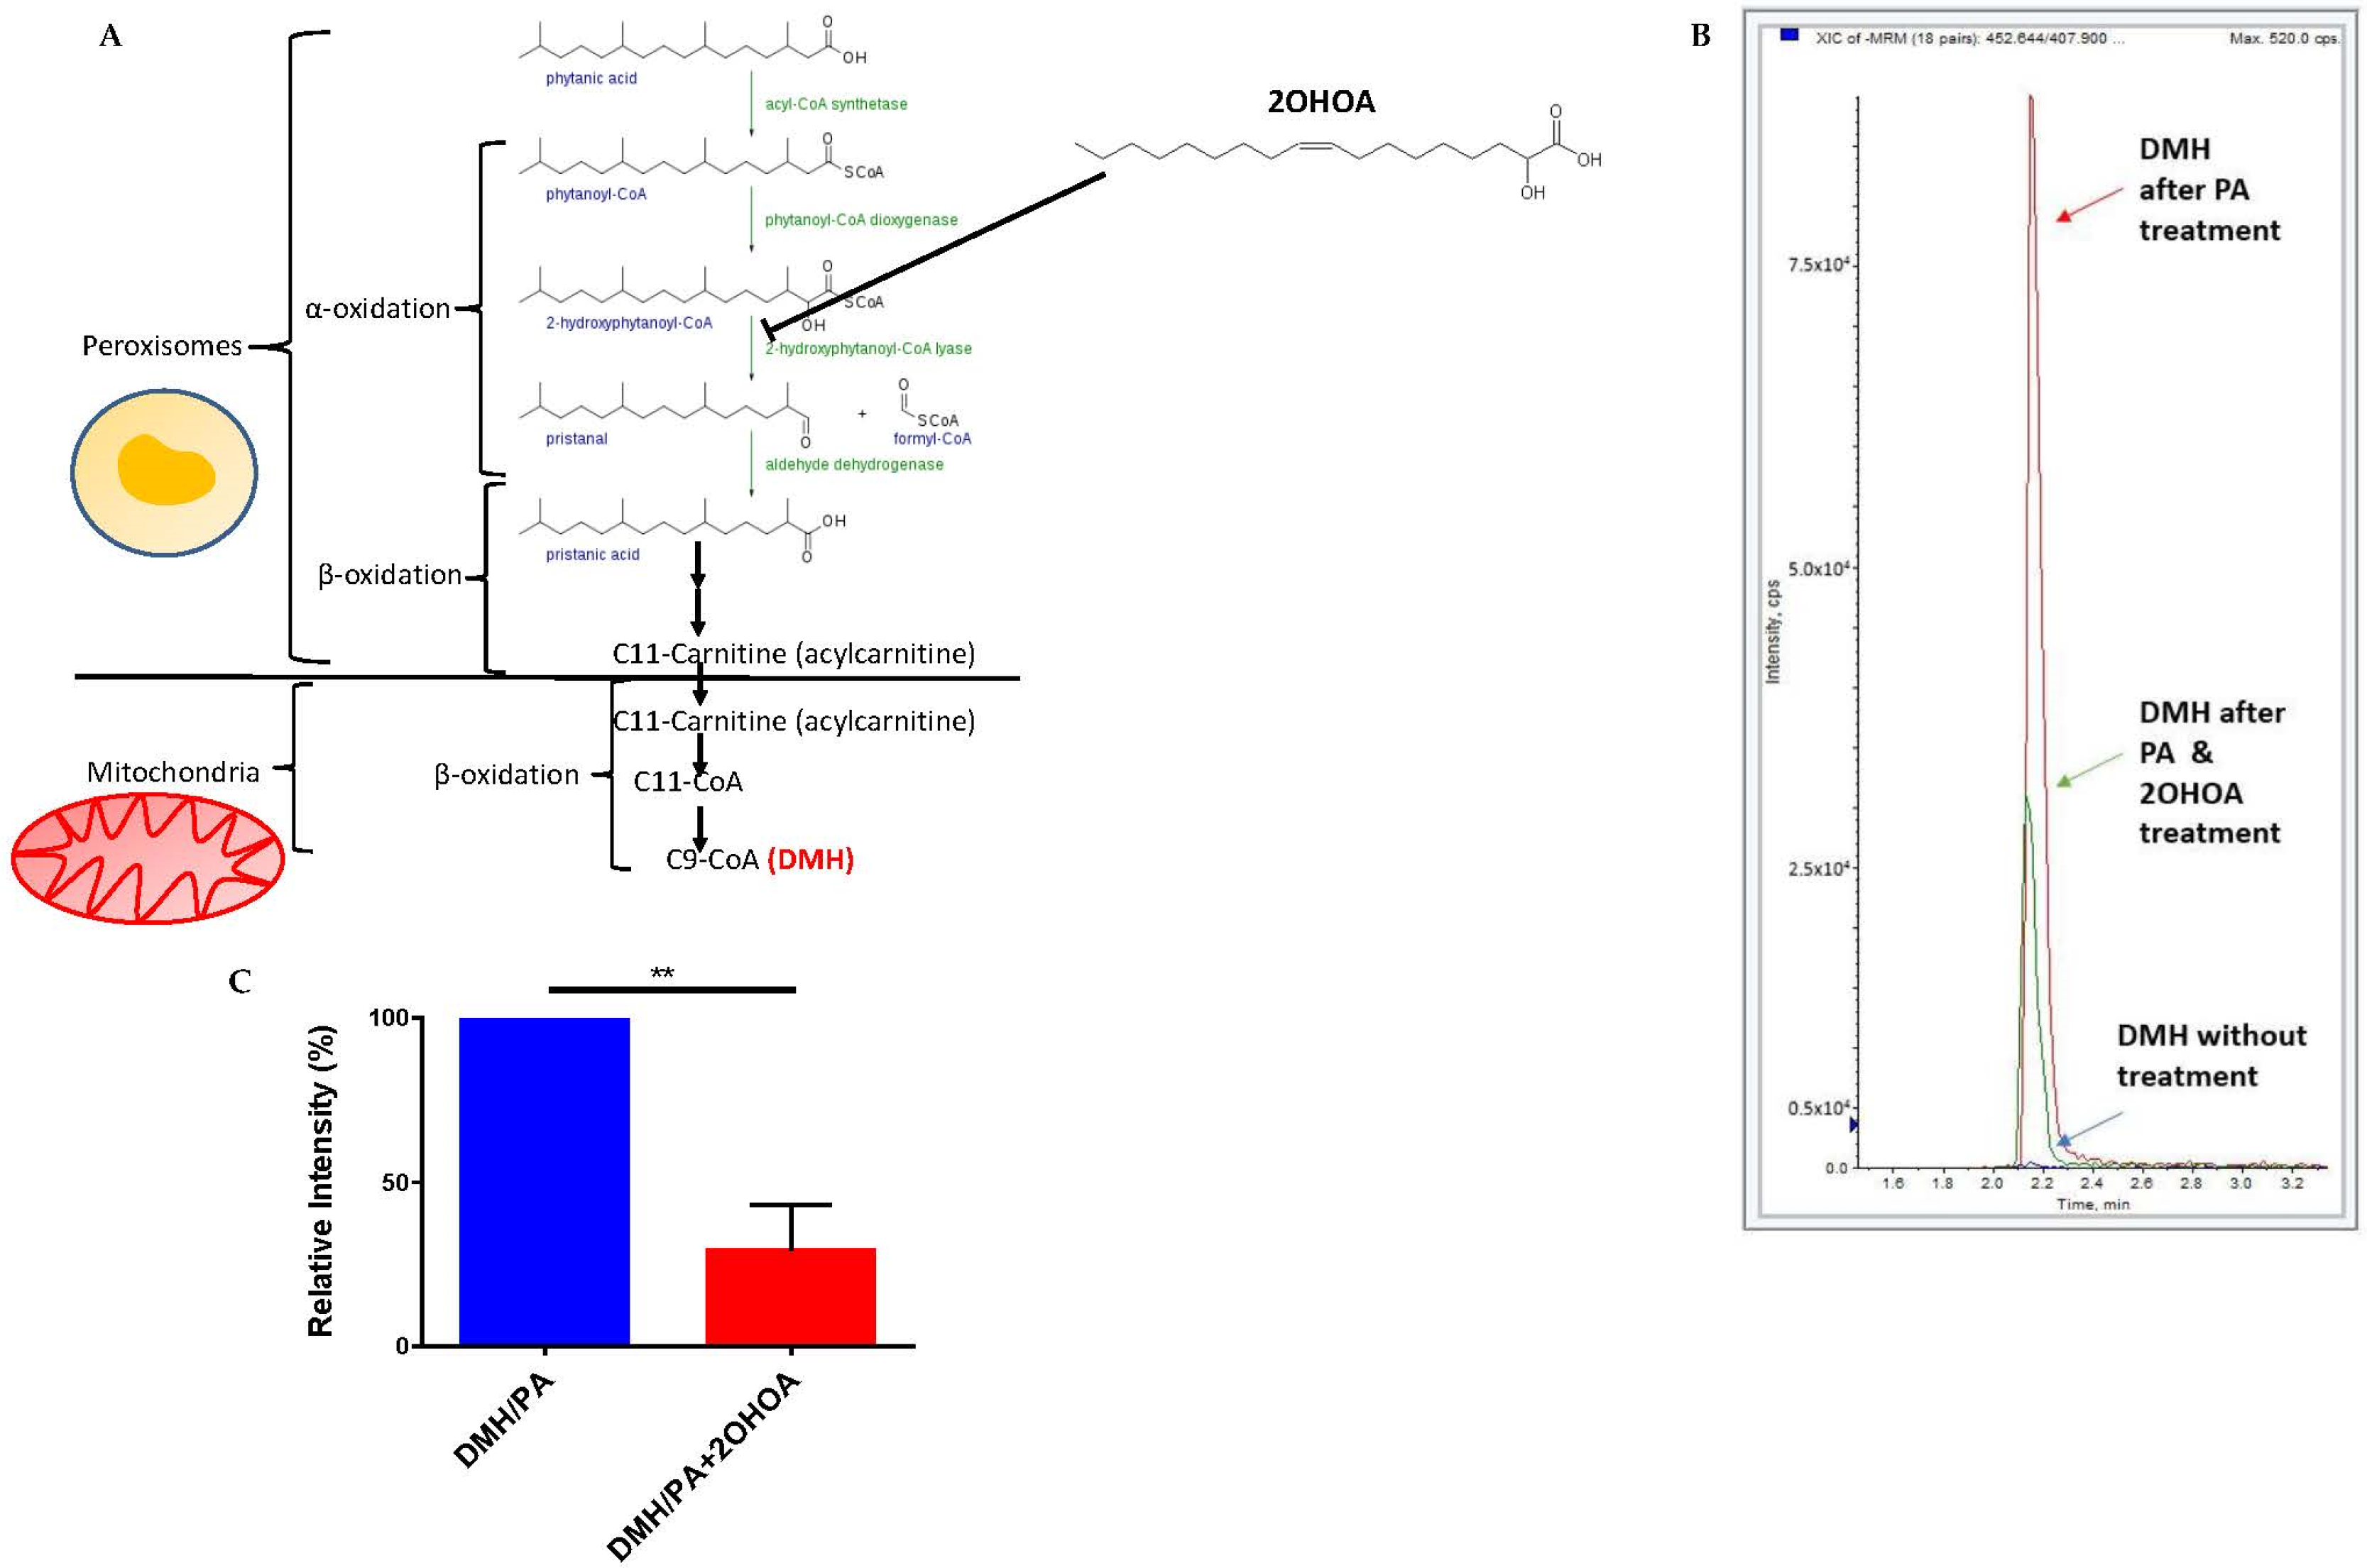
3.3. 2OHOA Influence on Substrate Availability and Substrate Oxidation
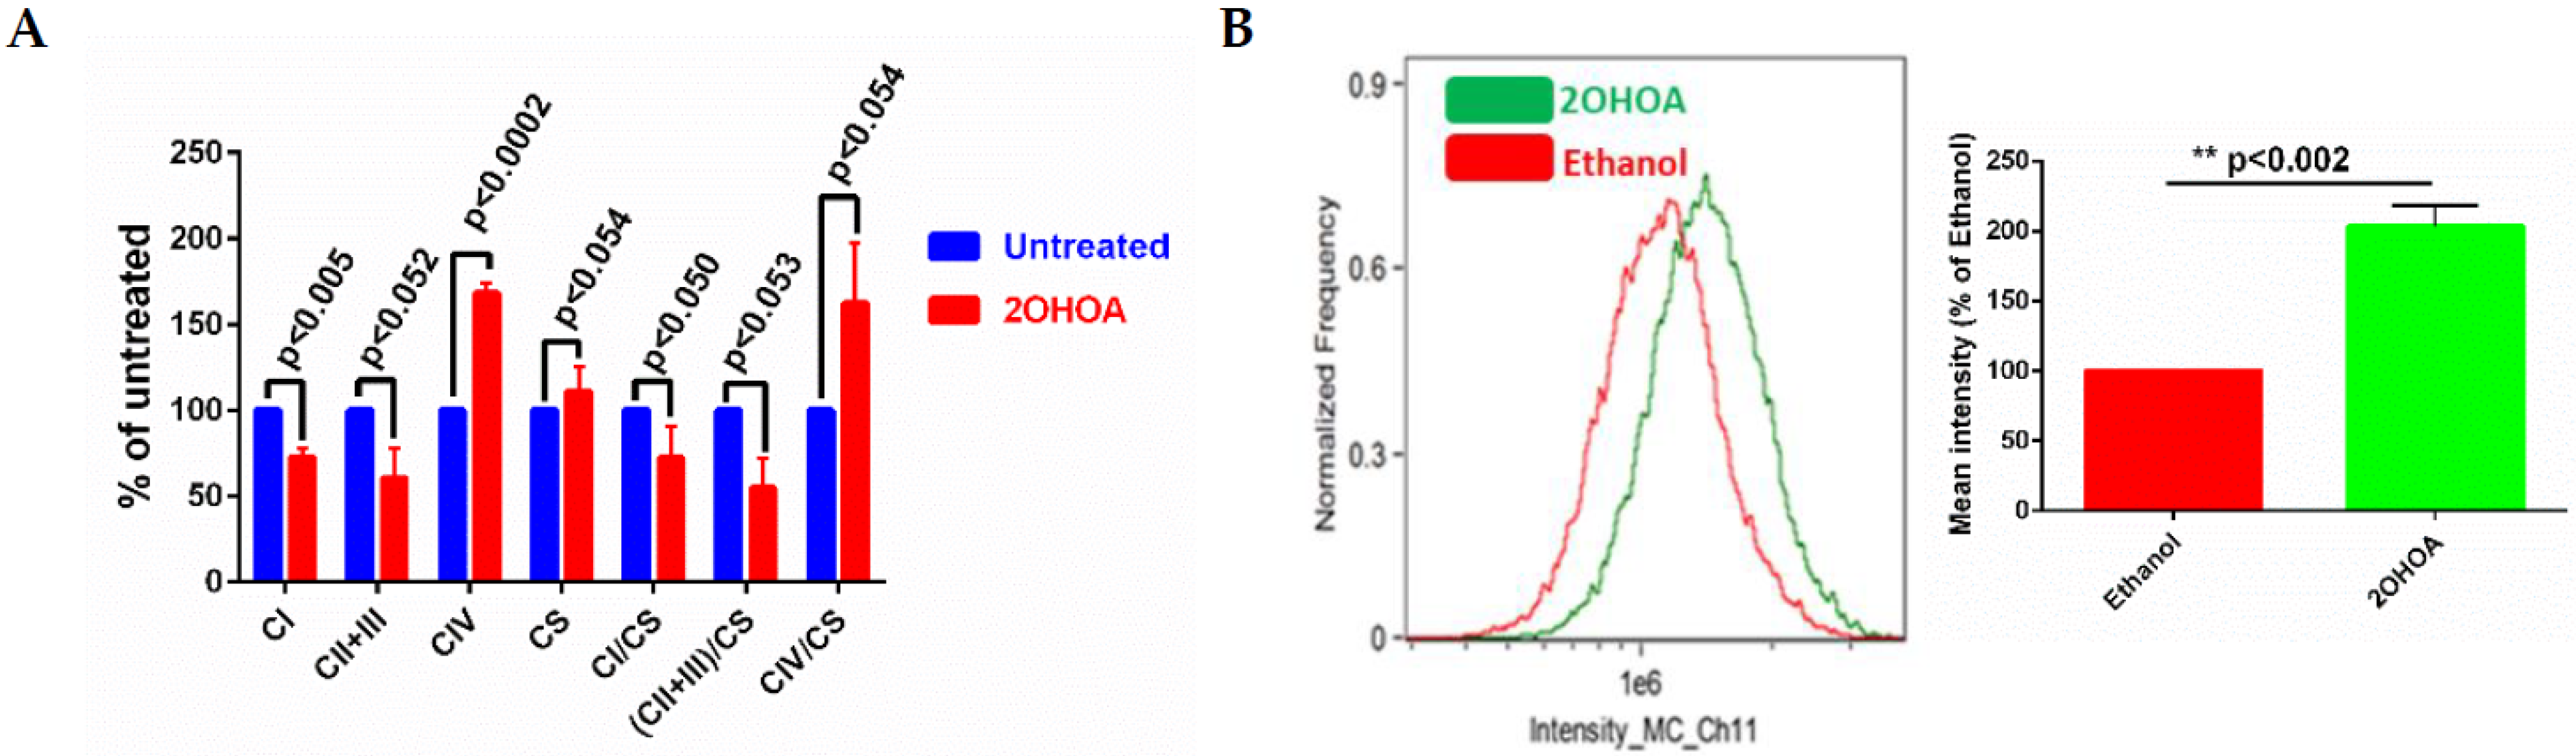
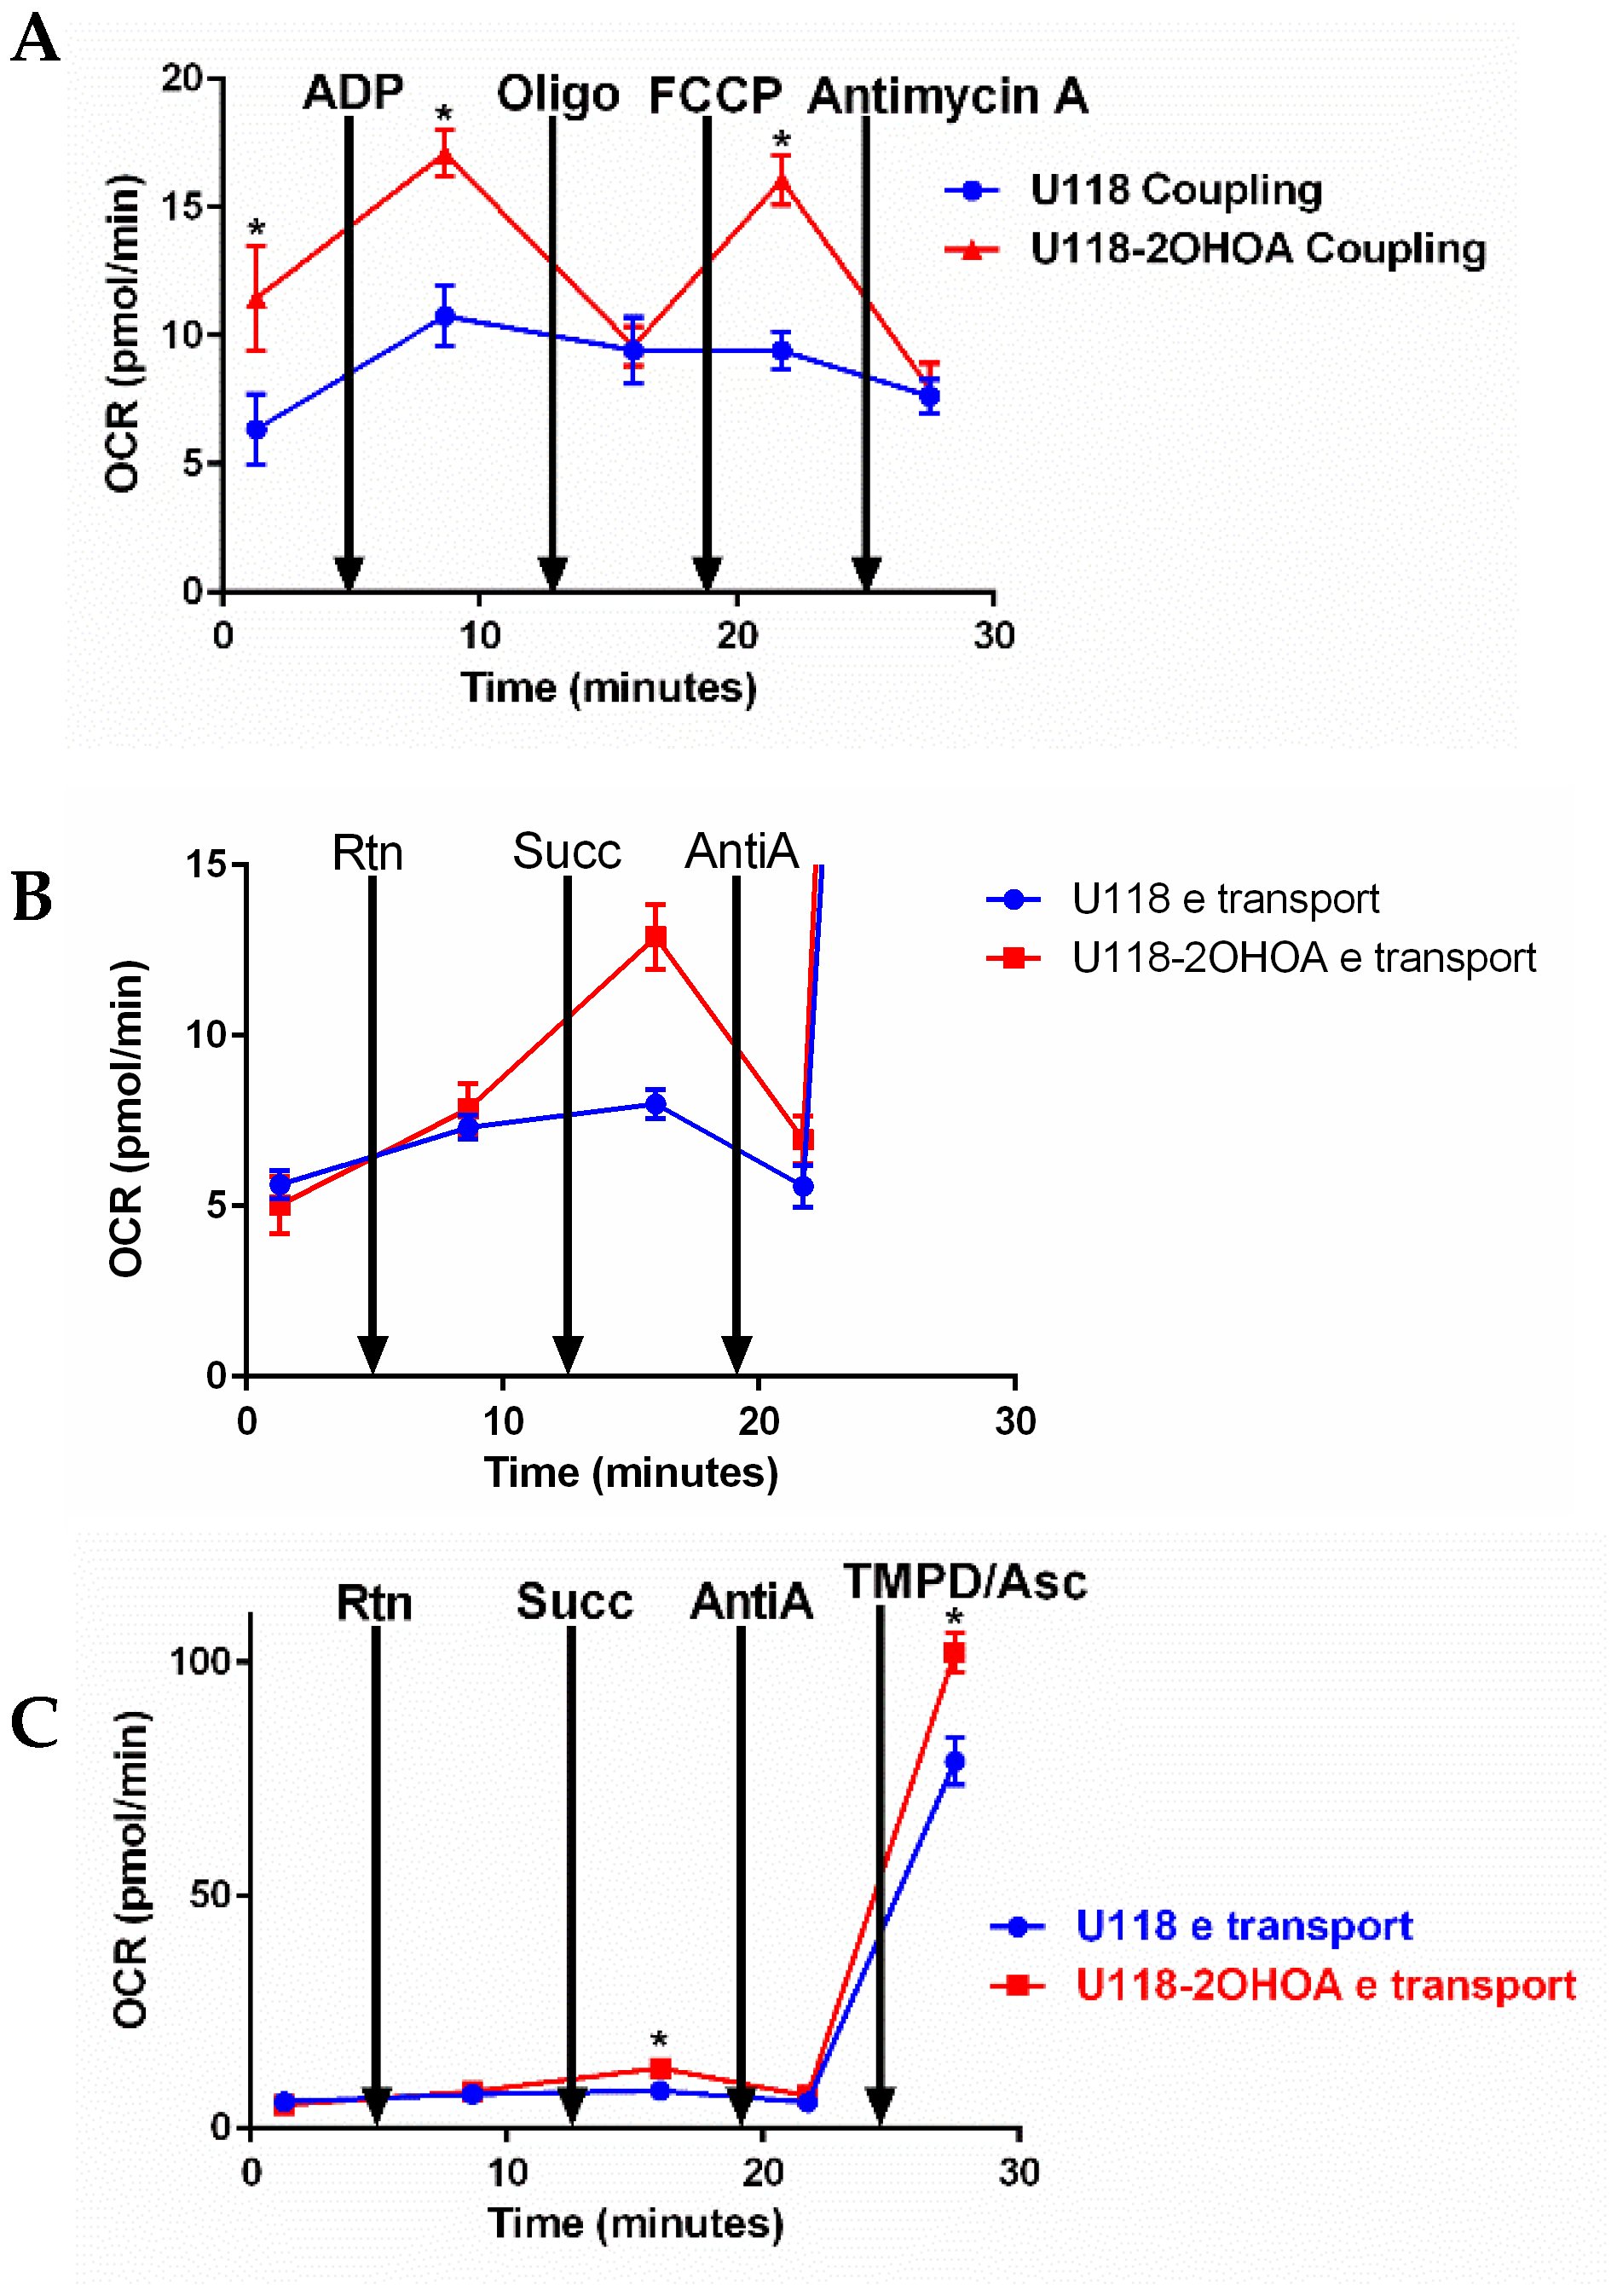
3.4. Modulation of Electron Transfer and Coupling by 2OHOA
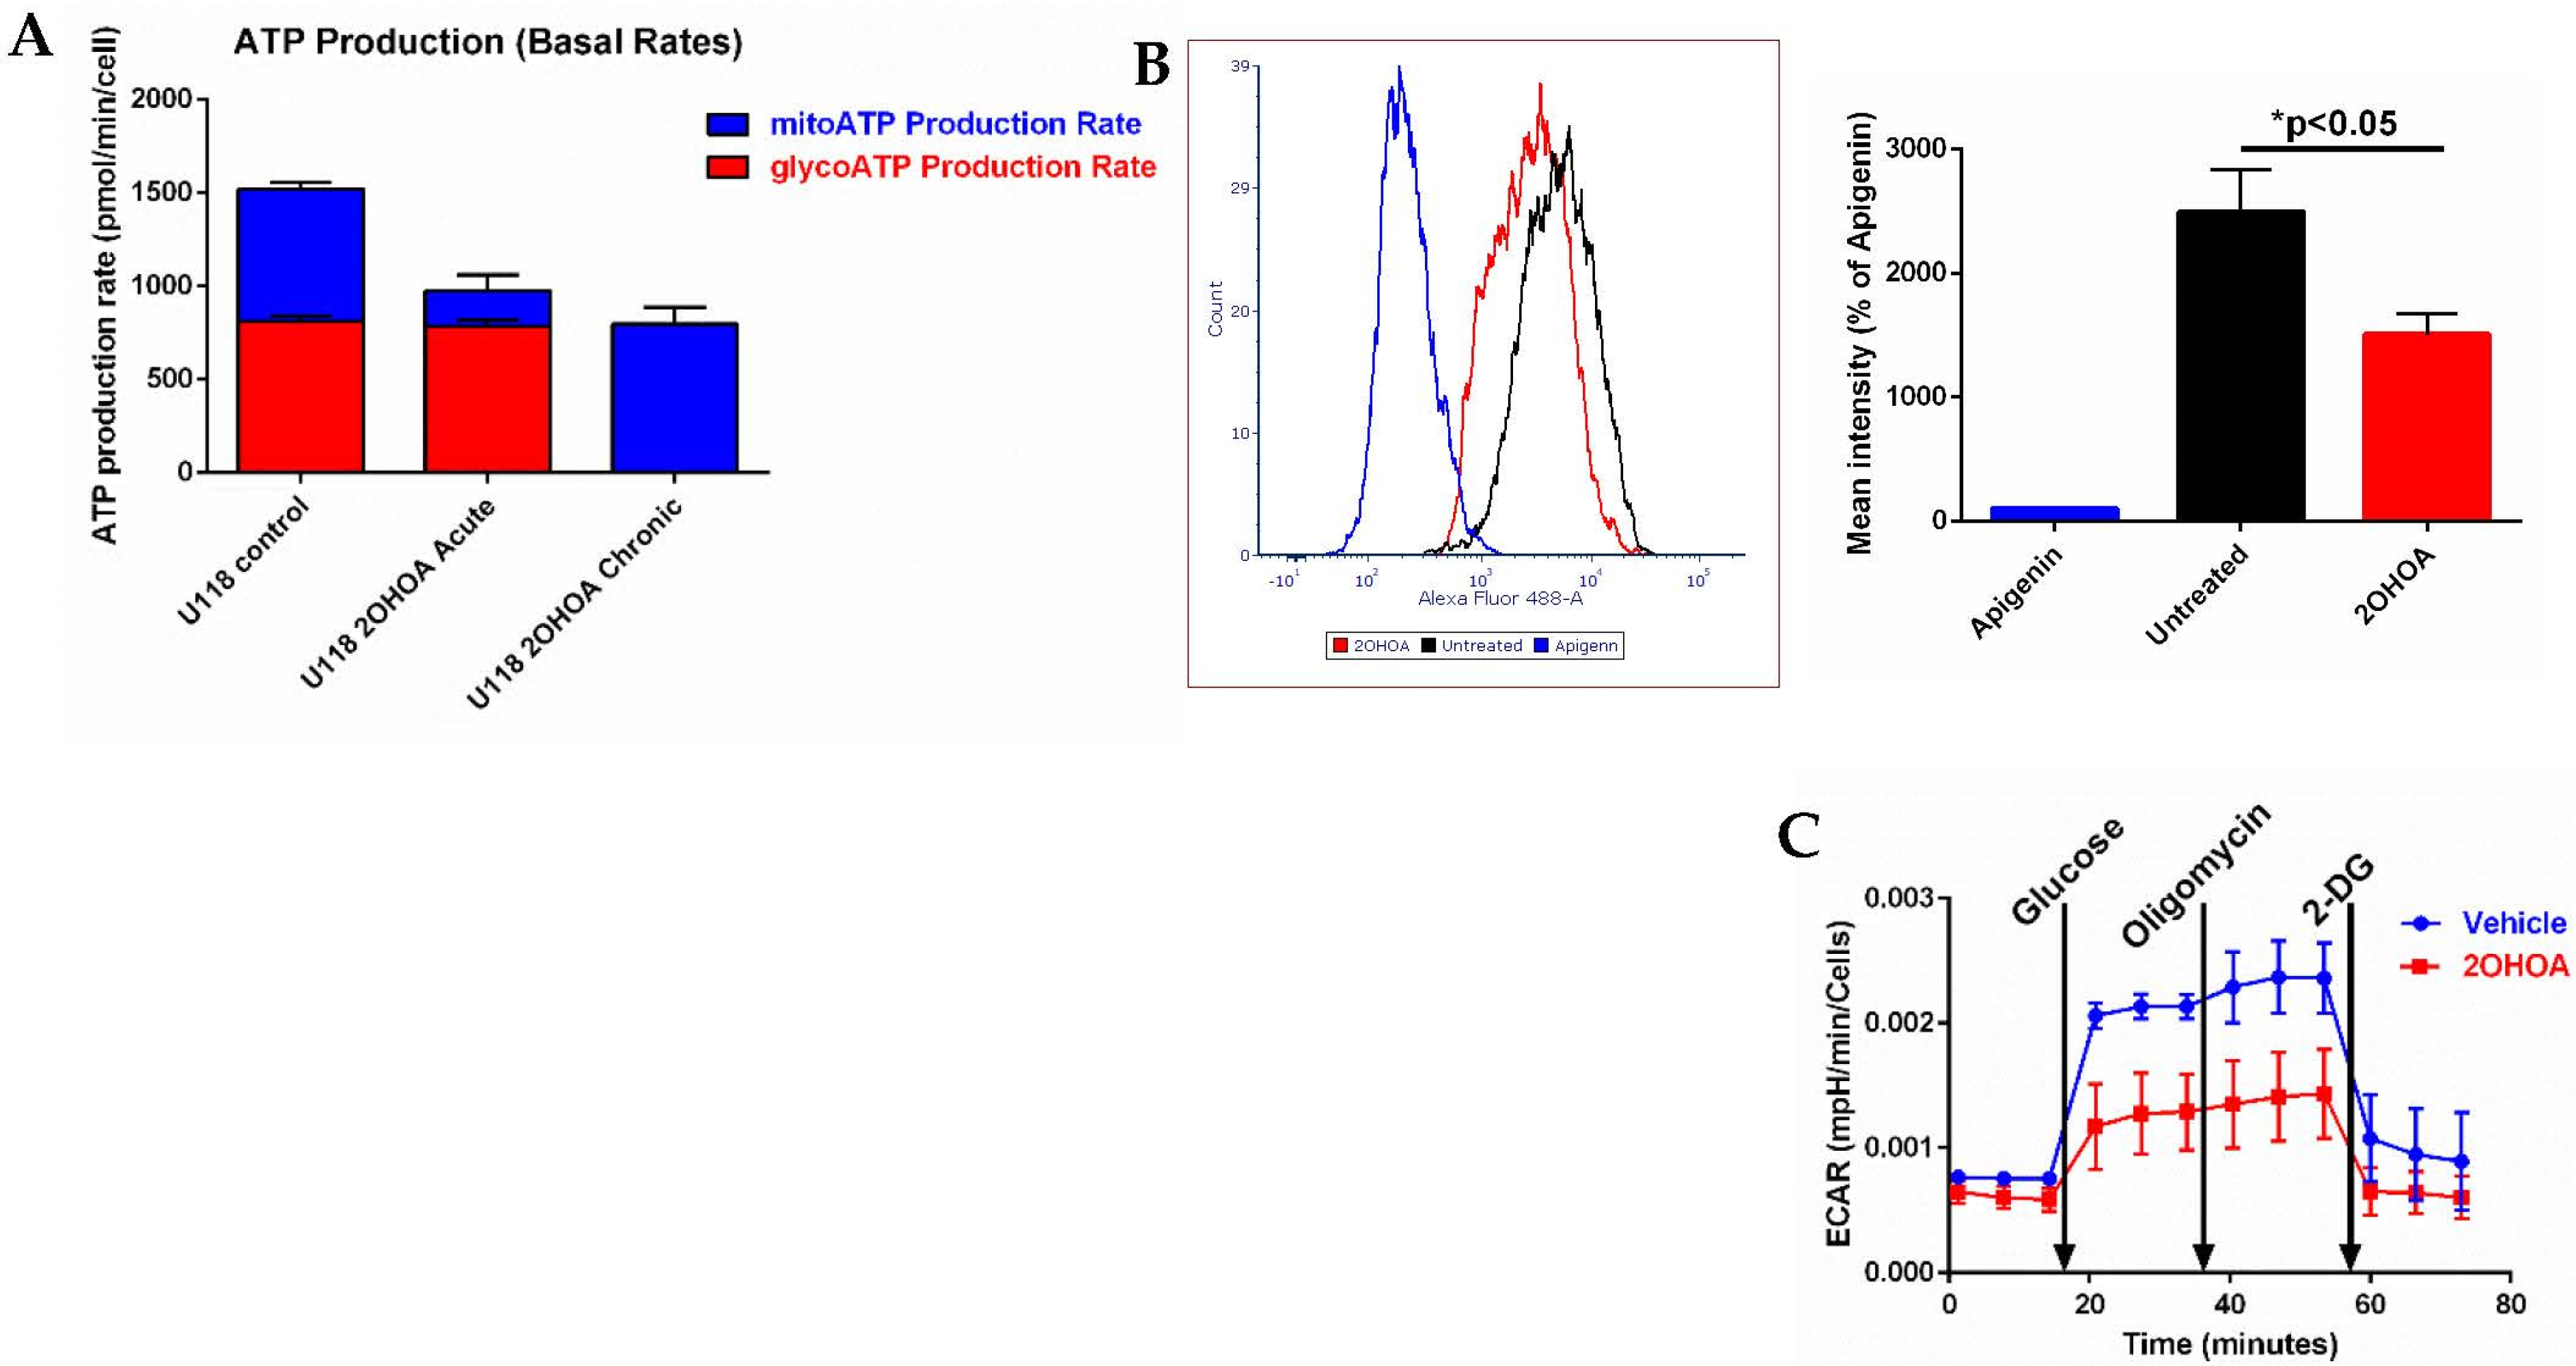
3.5. 2OHOA Effect on ATP Production and Glycolysis
4. Discussion
5. Conclusions
Supplementary Materials
Author Contributions
Funding
Institutional Review Board Statement
Informed Consent Statement
Data Availability Statement
Conflicts of Interest
References
- Escriba, P.V.; Sastre, M.; Garcia-Sevilla, J.A. Disruption of cellular signaling pathways by daunomycin through destabilization of nonlamellar membrane structures. Proc. Natl. Acad. Sci. USA 1995, 92, 7595–7599. [Google Scholar] [CrossRef] [Green Version]
- Escribá, P.V. Membrane-lipid therapy: A new approach in molecular medicine. Trends Mol. Med. 2006, 12, 34–43. [Google Scholar] [CrossRef] [PubMed]
- Doubravska, L.; Krausova, M.; Gradl, D.; Vojtechova, M.; Tumova, L.; Lukas, J.; Valenta, T.; Pospichalova, V.; Fafilek, B.; Plachy, J.; et al. Fatty acid modification of Wnt1 and Wnt3a at serine is prerequisite for lipidation at cysteine and is essential for Wnt signalling. Cell. Signal. 2011, 23, 837–848. [Google Scholar] [CrossRef] [PubMed]
- Lladó, V.; López, D.J.; Ibarguren, M.; Alonso, M.; Soriano, J.B.; Escriba, P.V.; Busquets, X. Regulation of the cancer cell membrane lipid composition by NaCHOleate: Effects on cell signaling and therapeutical relevance in glioma. Biochim. Biophys. Acta (BBA)-Biomembr. 2014, 1838, 1619–1627. [Google Scholar] [CrossRef] [PubMed] [Green Version]
- Teres, S.; Llado, V.; Higuera, M.; Barcelo-Coblijn, G.; Martin, M.L.; Noguera-Salva, M.A.; Marcilla-Etxenike, A.; García-Verdugo, J.M.; Soriano-Navarro, M.; Saus, C.; et al. 2-Hydroxyoleate, a nontoxic membrane binding anticancer drug, induces glioma cell differentiation and autophagy. Proc. Natl. Acad. Sci. USA 2012, 109, 8489–8494. [Google Scholar] [CrossRef] [Green Version]
- Barceló-Coblijn, G.; Martin, M.L.; de Almeida, R.F.M.; Noguera-Salvà, M.A.; Marcilla-Etxenike, A.; Guardiola-Serrano, F.; Lüth, A.; Kleuser, B.; Halver, J.E.; Escribá, P.V. Sphingomyelin and sphingomyelin synthase (SMS) in the malignant transformation of glioma cells and in 2-hydroxyoleic acid therapy. Proc. Natl. Acad. Sci. USA 2011, 108, 19569–19574. [Google Scholar] [CrossRef] [Green Version]
- Fernández-García, P.; Rosselló, C.A.; Rodríguez-Lorca, R.; Beteta-Göbel, R.; Fernández-Díaz, J.; Lladó, V.; Busquets, X.; Escribá, P.V. The Opposing Contribution of SMS1 and SMS2 to Glioma Progression and Their Value in the Therapeutic Response to 2OHOA. Cancers 2019, 11, 88. [Google Scholar] [CrossRef] [Green Version]
- Sessa, L.; Nardiello, A.M.; Santoro, J.; Concilio, S.; Piotto, S. Hydroxylated Fatty Acids: The Role of the Sphingomyelin Synthase and the Origin of Selectivity. Membranes 2021, 11, 787. [Google Scholar] [CrossRef]
- Piotto, S.; Concilio, S.; Bianchino, E.; Iannelli, P.; López, D.J.; Terés, S.; Ibarguren, M.; Barceló-Coblijn, G.; Martin, M.L.; Guardiola-Serrano, F.; et al. Differential effect of 2-hydroxyoleic acid enantiomers on protein (sphingomyelin synthase) and lipid (membrane) targets. Biochim. Biophys. Acta 2014, 1838, 1628–1637. [Google Scholar] [CrossRef]
- Piotto, S.; Sessa, L.; Iannelli, P.; Concilio, S. Computational study on human sphingomyelin synthase 1 (hSMS1). Biochim. Biophys. Acta Biomembr. 2017, 1859, 1517–1525. [Google Scholar] [CrossRef]
- Escriba, P.V.; Busquets, X.; Inokuchi, J.-I.; Balogh, G.; Török, Z.; Horváth, I.; Harwood, J.L.; Vígh, L. Membrane lipid therapy: Modulation of the cell membrane composition and structure as a molecular base for drug discovery and new disease treatment. Prog. Lipid Res. 2015, 59, 38–53. [Google Scholar] [CrossRef] [Green Version]
- Escribá, P.V. Membrane-lipid therapy: A historical perspective of membrane-targeted therapies—From lipid bilayer structure to the pathophysiological regulation of cells. Biochim. Biophys. Acta (BBA)-Biomembr. 2017, 1859, 1493–1506. [Google Scholar] [CrossRef]
- Prades, J.; Alemany, R.; Perona, J.S.; Funari, S.S.; Vögler, O.; Ruiz-Gutiérrez, V.; Escribá, P.V.; Barceló, F. Effects of 2-hydroxyoleic acid on the structural properties of biological and model plasma membranes. Mol. Membr. Biol. 2008, 25, 46–57. [Google Scholar] [CrossRef] [PubMed] [Green Version]
- Drobnies, A.E.; Davies, S.M.A.; Kraayenhof, R.; Epand, R.F.; Epand, R.; Cornell, R.B. CTP: Phosphocholine cytidylyltransferase and protein kinase C recognize different physical features of membranes: Differential responses to an oxidized phosphatidylcholine. Biochim. Biophys. Acta (BBA)-Biomembr. 2002, 1564, 82–90. [Google Scholar] [CrossRef] [Green Version]
- Alwarawrah, M.; Wereszczynski, J. Investigation of the Effect of Bilayer Composition on PKCα-C2 Domain Docking Using Molecular Dynamics Simulations. J. Phys. Chem. B 2017, 121, 78–88. [Google Scholar] [CrossRef] [PubMed] [Green Version]
- Martin, M.L.; Barceló-Coblijn, G.; de Almeida, R.F.; Noguera-Salvà, M.A.; Terés, S.; Higuera, M.; Liebisch, G.; Schmitz, G.; Busquets, X.; Escribá, P.V. The role of membrane fatty acid remodeling in the antitumor mechanism of action of 2-hydroxyoleic acid. Biochim. Biophys. Acta (BBA)-Biomembr. 2013, 1828, 1405–1413. [Google Scholar] [CrossRef] [Green Version]
- Torgersen, M.L.; Klokk, T.I.; Kavaliauskiene, S.; Klose, C.; Simons, K.; Skotland, T.; Sandvig, K. The anti-tumor drug 2-hydroxyoleic acid (Minerval) stimulates signaling and retrograde transport. Oncotarget 2016, 7, 86871–86888. [Google Scholar] [CrossRef] [Green Version]
- Lou, B.; Liu, Q.; Hou, J.; Kabir, I.; Liu, P.; Ding, T.; Dong, J.; Mo, M.; Ye, D.; Chen, Y.; et al. 2-Hydroxy-oleic acid does not activate sphingomyelin synthase activity. J. Biol. Chem. 2018, 293, 18328–18336. [Google Scholar] [CrossRef] [Green Version]
- Tonin, A.M.; Ferreira, G.C.; Grings, M.; Viegas, C.M.; Busanello, E.N.; Amaral, A.U.; Zanatta, A.; Schuck, P.F.; Wajner, M. Disturbance of mitochondrial energy homeostasis caused by the metabolites accumulating in LCHAD and MTP deficiencies in rat brain. Life Sci. 2010, 86, 825–831. [Google Scholar] [CrossRef]
- Tonin, A.M.; Amaral, A.U.; Busanello, E.N.B.; Grings, M.; Castilho, R.F.; Wajner, M. Long-chain 3-hydroxy fatty acids accumulating in long-chain 3-hydroxyacyl-CoA dehydrogenase and mitochondrial trifunctional protein deficiencies uncouple oxidative phosphorylation in heart mitochondria. J. Bioenerg. Biomembr. 2013, 45, 47–57. [Google Scholar] [CrossRef]
- Massalha, W.; Markovits, M.; Pichinuk, E.; Feinstein-Rotkopf, Y.; Tarshish, M.; Mishra, K.; Llado, V.; Weil, M.; Escriba, P.V.; Kakhlon, O. Minerval (2-hydroxyoleic acid) causes cancer cell selective toxicity by uncoupling oxidative phosphorylation and compromising bioenergetic compensation capacity. Biosci. Rep. 2019, 39, BSR20181661. [Google Scholar] [CrossRef] [PubMed] [Green Version]
- Kappler, L.; Li, J.; Häring, H.-U.; Weigert, C.; Lehmann, R.; Xu, G.; Hoene, M. Purity matters: A workflow for the valid high-resolution lipid profiling of mitochondria from cell culture samples. Sci. Rep. 2016, 6, 21107. [Google Scholar] [CrossRef] [Green Version]
- Balogh, G.; Péter, M.; Liebisch, G.; Horváth, I.; Török, Z.; Nagy, E.; Maslyanko, A.; Benkő, S.; Schmitz, G.; Harwood, J.L.; et al. Lipidomics reveals membrane lipid remodelling and release of potential lipid mediators during early stress responses in a murine melanoma cell line. Biochim. Biophys. Acta (BBA)-Mol. Cell Biol. Lipids 2010, 1801, 1036–1047. [Google Scholar] [CrossRef] [PubMed]
- Péter, M.; Gudmann, P.; Kóta, Z.; Török, Z.; Vígh, L.; Glatz, A.; Balogh, G. Lipids and Trehalose Actively Cooperate in Heat Stress Management of Schizosaccharomyces pombe. Int. J. Mol. Sci. 2021, 22, 13272. [Google Scholar] [CrossRef]
- Tóth, M.; Dukay, B.; Péter, M.; Balogh, G.; Szűcs, G.; Zvara, Á.; Szebeni, G.; Hajdu, P.; Sárközy, M.; Puskás, L.; et al. Male and Female Animals Respond Differently to High-Fat Diet and Regular Exercise Training in a Mouse Model of Hyperlipidemia. Int. J. Mol. Sci. 2021, 22, 4198. [Google Scholar] [CrossRef]
- Herzog, R.; Schwudke, D.; Schuhmann, K.; Sampaio, J.L.; Bornstein, S.R.; Schroeder, M.; Shevchenko, A. A novel informatics concept for high-throughput shotgun lipidomics based on the molecular fragmentation query language. Genome Biol. 2011, 12, R8. [Google Scholar] [CrossRef] [PubMed] [Green Version]
- Liebisch, G.; Vizcaino, J.A.; Köfeler, H.; Trötzmüller, M.; Griffiths, W.; Schmitz, G.; Spener, F.; Wakelam, M. Shorthand notation for lipid structures derived from mass spectrometry. J. Lipid Res. 2013, 54, 1523–1530. [Google Scholar] [CrossRef] [Green Version]
- Storey, J.D.; Tibshirani, R. Statistical significance for genomewide studies. Proc. Natl. Acad. Sci. USA 2003, 100, 9440–9445. [Google Scholar] [CrossRef] [Green Version]
- Xia, J.; Wishart, D.S. Web-based inference of biological patterns, functions and pathways from metabolomic data using MetaboAnalyst. Nat. Protoc. 2011, 6, 743–760. [Google Scholar] [CrossRef]
- Eldad, S.; Hertz, R.; Vainer, G.; Saada, A.; Bar-Tana, J. Treatment of ErbB2 breast cancer by mitochondrial targeting. Cancer Metab. 2020, 8, 17. [Google Scholar] [CrossRef]
- Ben-Meir, A.; Yahalomi, S.; Moshe, B.; Shufaro, Y.; Reubinoff, B.; Saada, A. Coenzyme Q–dependent mitochondrial respiratory chain activity in granulosa cells is reduced with aging. Fertil. Steril. 2015, 104, 724–727. [Google Scholar] [CrossRef] [PubMed]
- Grba, D.N.; Hirst, J. Mitochondrial complex I structure reveals ordered water molecules for catalysis and proton translocation. Nat. Struct. Mol. Biol. 2020, 27, 892–900. [Google Scholar] [CrossRef]
- Kim, K.-B.; Lee, J.-W.; Lee, C.S.; Kim, B.-W.; Choo, H.-J.; Jung, S.-Y.; Chi, S.-G.; Yoon, Y.-S.; Yoon, G.; Ko, Y.-G. Oxidation–reduction respiratory chains and ATP synthase complex are localized in detergent-resistant lipid rafts. Proteomics 2006, 6, 2444–2453. [Google Scholar] [CrossRef] [PubMed]
- Barrientos, A. In Vivo and in organello assessment of OXPHOS activities. Methods 2002, 26, 307–316. [Google Scholar] [CrossRef]
- Barrientos, A.; Fontanesi, F.; Díaz, F. Evaluation of the Mitochondrial Respiratory Chain and Oxidative Phosphorylation System Using Polarography and Spectrophotometric Enzyme Assays. Curr. Protoc. Hum. Genet. 2009, 63, 19.3.1–19.3.14. [Google Scholar] [CrossRef] [PubMed] [Green Version]
- Verhoeven, N.M.; Roe, D.S.; Kok, R.M.; Wanders, R.J.; Jakobs, C.; Roe, C.R. Phytanic acid and pristanic acid are oxidized by sequential peroxisomal and mitochondrial reactions in cultured fibroblasts. J. Lipid Res. 1998, 39, 66–74. [Google Scholar] [CrossRef]
- Barnette, B.L.; Yu, Y.; Ullrich, R.L.; Emmett, M.R. Mitochondrial Effects in the Liver of C57BL/6 Mice by Low Dose, High Energy, High Charge Irradiation. Int. J. Mol. Sci. 2021, 22, 11806. [Google Scholar] [CrossRef]
- Acin-Perez, R.; Benador, I.Y.; Petcherski, A.; Veliova, M.; Benavides, G.A.; Lagarrigue, S.; Caudal, A.; Vergnes, L.; Murphy, A.N.; Karamanlidis, G.; et al. A novel approach to measure mitochondrial respiration in frozen biological samples. EMBO J. 2020, 39, e104073. [Google Scholar] [CrossRef]
- Shalata, A.; Edery, M.; Habib, C.; Genizi, J.; Mahroum, M.; Khalaily, L.; Assaf, N.; Segal, I.; El Rahim, H.A.; Shapira, H.; et al. Primary Coenzyme Q deficiency Due to Novel ADCK3 Variants, Studies in Fibroblasts and Review of Literature. Neurochem. Res. 2019, 44, 2372–2384. [Google Scholar] [CrossRef]
- Böttinger, L.; Horvath, S.E.; Kleinschroth, T.; Hunte, C.; Daum, G.; Pfanner, N.; Becker, T. Phosphatidylethanolamine and Cardiolipin Differentially Affect the Stability of Mitochondrial Respiratory Chain Supercomplexes. J. Mol. Biol. 2012, 423, 677–686. [Google Scholar] [CrossRef] [Green Version]
- Horvath, S.E.; Daum, G. Lipids of mitochondria. Prog. Lipid Res. 2013, 52, 590–614. [Google Scholar] [CrossRef] [PubMed]
- Monteiro, J.P.; Oliveira, P.J.; Jurado, A.S. Mitochondrial membrane lipid remodeling in pathophysiology: A new target for diet and therapeutic interventions. Prog. Lipid Res. 2013, 52, 513–528. [Google Scholar] [CrossRef] [PubMed] [Green Version]
- Almendro-Vedia, V.; Natale, P.; González, D.V.; Lillo, M.P.; Aragones, J.L.; López-Montero, I. How rotating ATP synthases can modulate membrane structure. Arch. Biochem. Biophys. 2021, 708, 108939. [Google Scholar] [CrossRef] [PubMed]
- Luengo, A.; Li, Z.; Gui, D.Y.; Sullivan, L.B.; Zagorulya, M.; Do, B.T.; Ferreira, R.; Naamati, A.; Ali, A.; Lewis, C.A.; et al. Increased demand for NAD+ relative to ATP drives aerobic glycolysis. Mol. Cell 2021, 81, 691–707.e6. [Google Scholar] [CrossRef] [PubMed]
- Hwang, E.S.; Hwang, S.Y. Cellular NAD+ Level: A Key Determinant of Mitochondrial. Quality and Health. Ann. Geriatr. Med. Res. 2017, 7, 149–157. [Google Scholar] [CrossRef] [Green Version]
- Chini, C.C.; Zeidler, J.D.; Kashyap, S.; Warner, G.; Chini, E.N. Evolving concepts in NAD+ metabolism. Cell Metab. 2021, 33, 1076–1087. [Google Scholar] [CrossRef]
- Virtuoso, A.; Giovannoni, R.; De Luca, C.; Gargano, F.; Cerasuolo, M.; Maggio, N.; Lavitrano, M.; Papa, M. The Glioblastoma Microenvironment: Morphology, Metabolism, and Molecular Signature of Glial Dynamics to Discover Metabolic Rewiring Sequence. Int. J. Mol. Sci. 2021, 22, 3301. [Google Scholar] [CrossRef] [PubMed]
- Garofano, L.; Migliozzi, S.; Oh, Y.T.; D’Angelo, F.; Najac, R.D.; Ko, A.; Frangaj, B.; Caruso, F.P.; Yu, K.; Yuan, J.; et al. Pathway-based classification of glioblastoma uncovers a mitochondrial subtype with therapeutic vulnerabilities. Nat. Rev. Cancer 2021, 2, 141–156. [Google Scholar] [CrossRef]
- Nguyen, T.T.T.; Shang, E.; Shu, C.; Kim, S.; Mela, A.; Humala, N.; Mahajan, A.; Yang, H.W.; Akman, H.O.; Quinzii, C.M.; et al. Aurora kinase A inhibition reverses the Warburg effect and elicits unique metabolic vulnerabilities in glioblastoma. Nat. Commun. 2021, 12, 5203. [Google Scholar] [CrossRef]


Publisher’s Note: MDPI stays neutral with regard to jurisdictional claims in published maps and institutional affiliations. |
© 2022 by the authors. Licensee MDPI, Basel, Switzerland. This article is an open access article distributed under the terms and conditions of the Creative Commons Attribution (CC BY) license (https://creativecommons.org/licenses/by/4.0/).
Share and Cite
Mishra, K.; Péter, M.; Nardiello, A.M.; Keller, G.; Llado, V.; Fernandez-Garcia, P.; Kahlert, U.D.; Barasch, D.; Saada, A.; Török, Z.; et al. Multifaceted Analyses of Isolated Mitochondria Establish the Anticancer Drug 2-Hydroxyoleic Acid as an Inhibitor of Substrate Oxidation and an Activator of Complex IV-Dependent State 3 Respiration. Cells 2022, 11, 578. https://0-doi-org.brum.beds.ac.uk/10.3390/cells11030578
Mishra K, Péter M, Nardiello AM, Keller G, Llado V, Fernandez-Garcia P, Kahlert UD, Barasch D, Saada A, Török Z, et al. Multifaceted Analyses of Isolated Mitochondria Establish the Anticancer Drug 2-Hydroxyoleic Acid as an Inhibitor of Substrate Oxidation and an Activator of Complex IV-Dependent State 3 Respiration. Cells. 2022; 11(3):578. https://0-doi-org.brum.beds.ac.uk/10.3390/cells11030578
Chicago/Turabian StyleMishra, Kumudesh, Mária Péter, Anna Maria Nardiello, Guy Keller, Victoria Llado, Paula Fernandez-Garcia, Ulf D. Kahlert, Dinorah Barasch, Ann Saada, Zsolt Török, and et al. 2022. "Multifaceted Analyses of Isolated Mitochondria Establish the Anticancer Drug 2-Hydroxyoleic Acid as an Inhibitor of Substrate Oxidation and an Activator of Complex IV-Dependent State 3 Respiration" Cells 11, no. 3: 578. https://0-doi-org.brum.beds.ac.uk/10.3390/cells11030578