
Shear-Stress-Gradient and Oxygen-Gradient Ektacytometry in Sickle Cell Patients at Steady State and during Vaso-Occlusive Crises

 ,
,  and
and 
Abstract
:1. Introduction
2. Materials and Methods
2.1. Patients
2.2. Hematological and Biochemical Parameters
2.3. Shear Gradient Ektacytometry
2.4. Oxygen Gradient Ektacytometry
2.5. Statistics
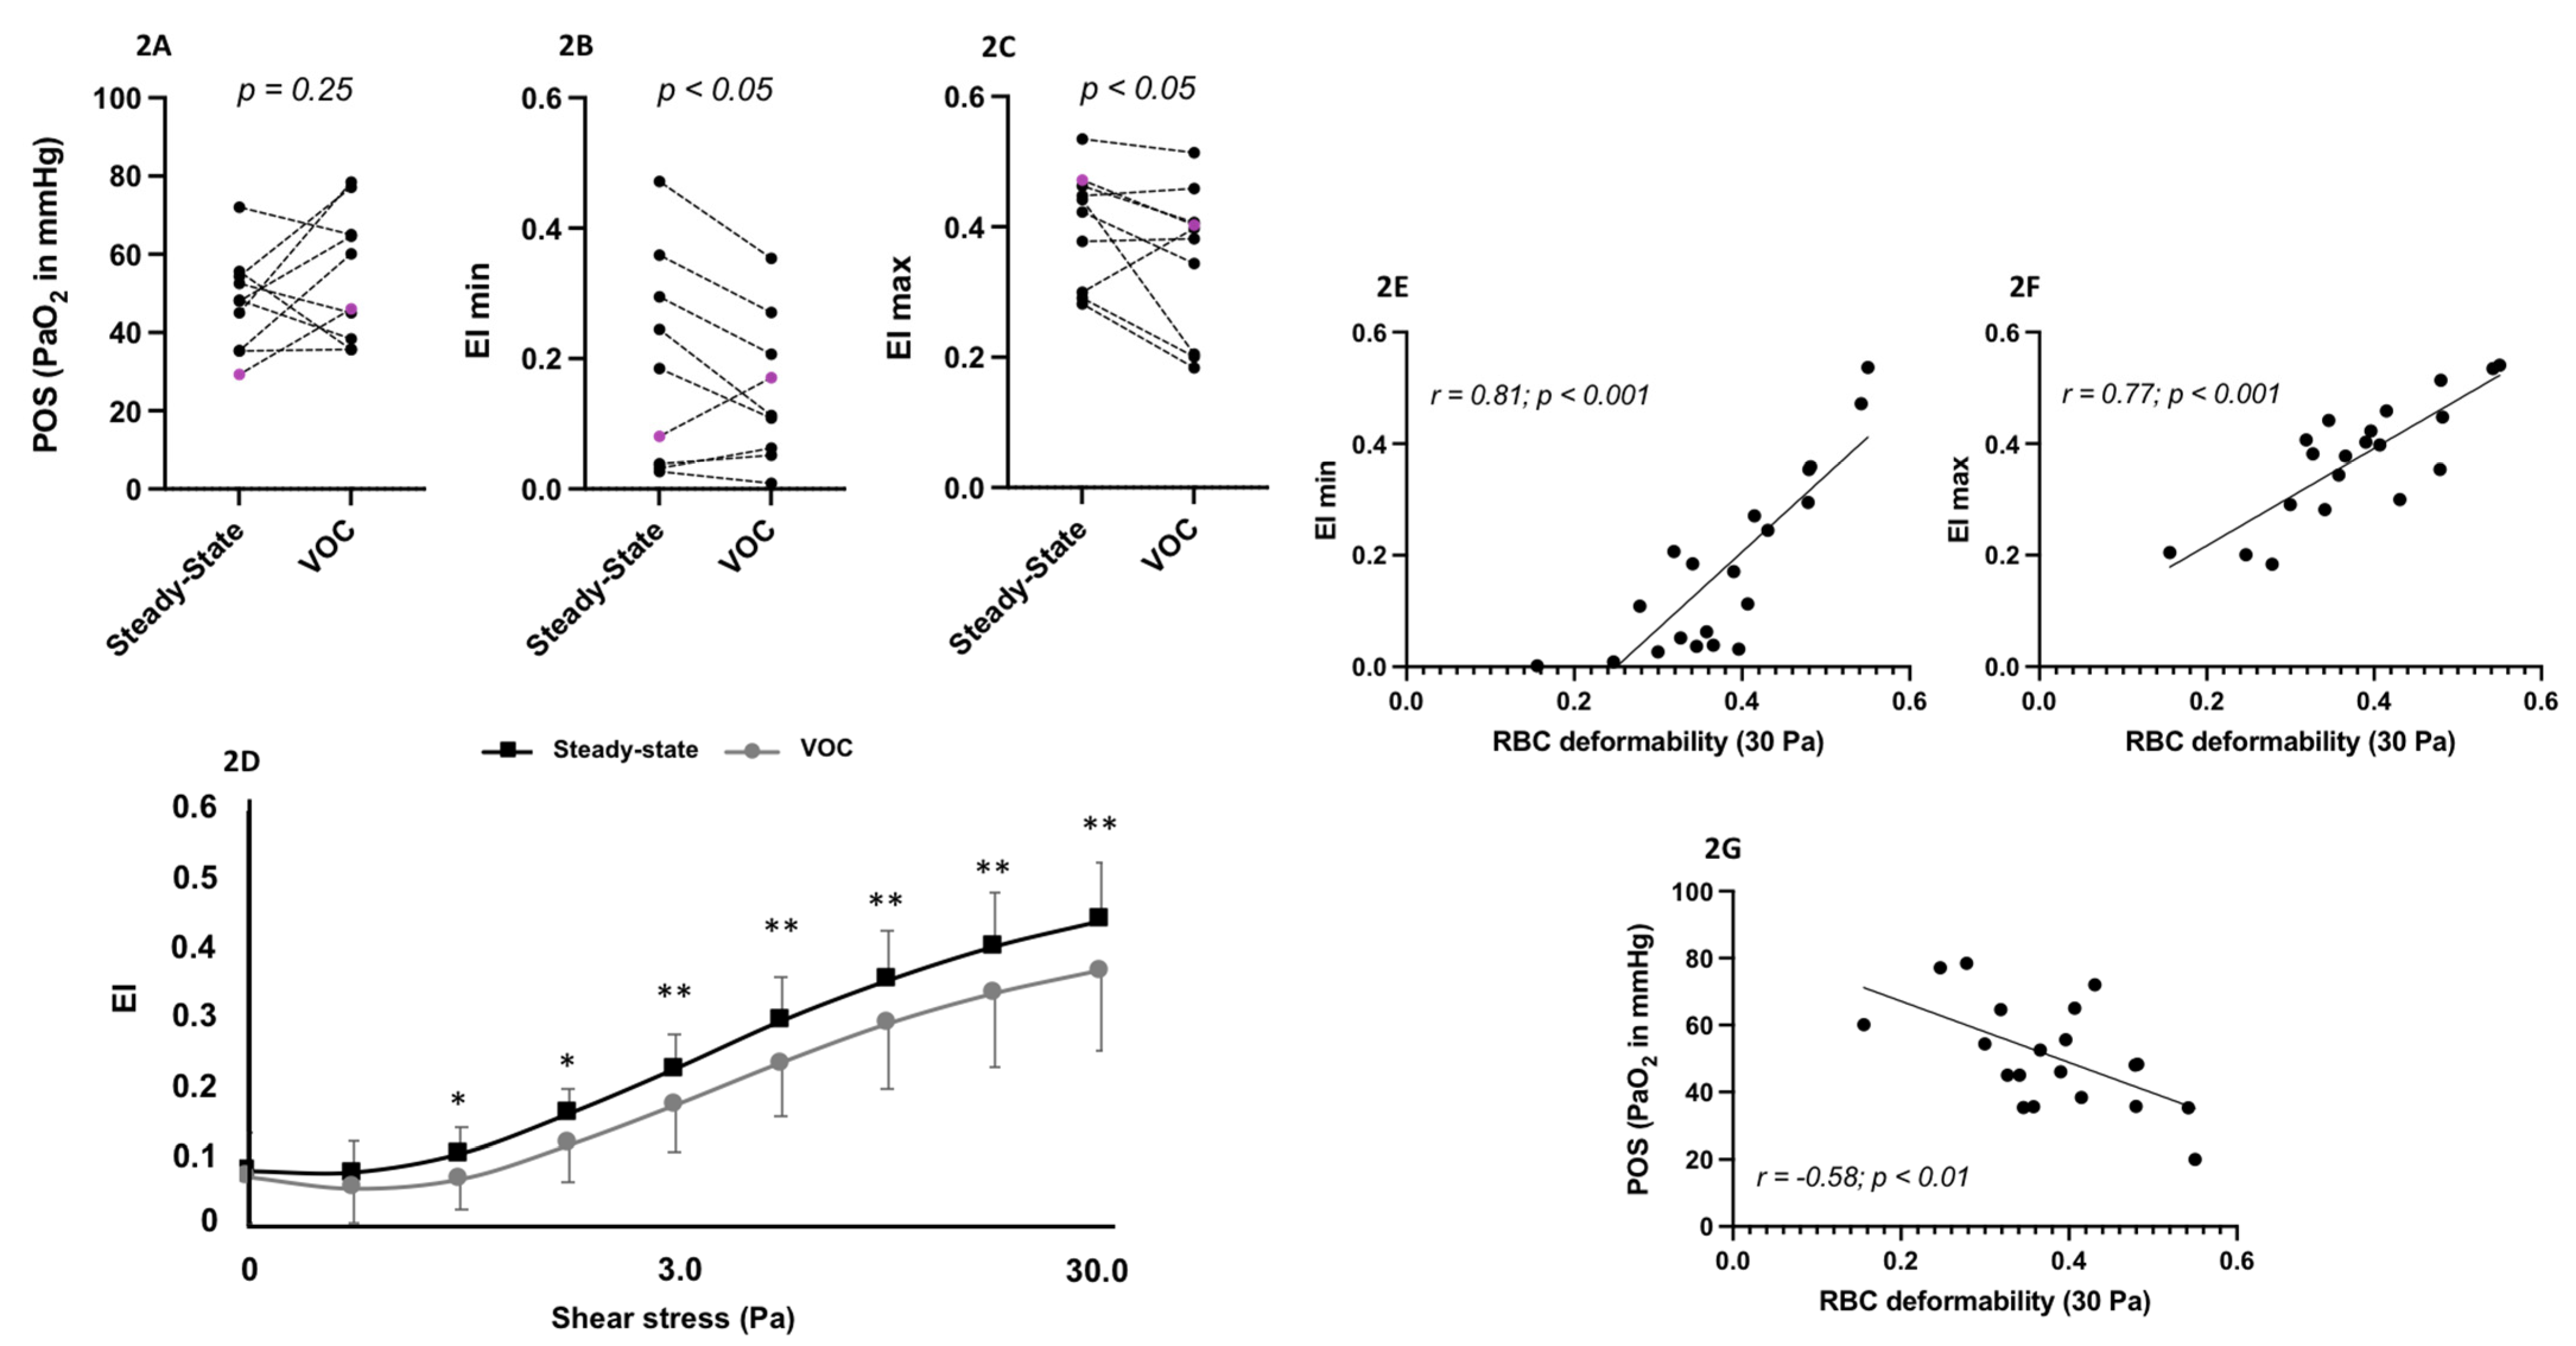
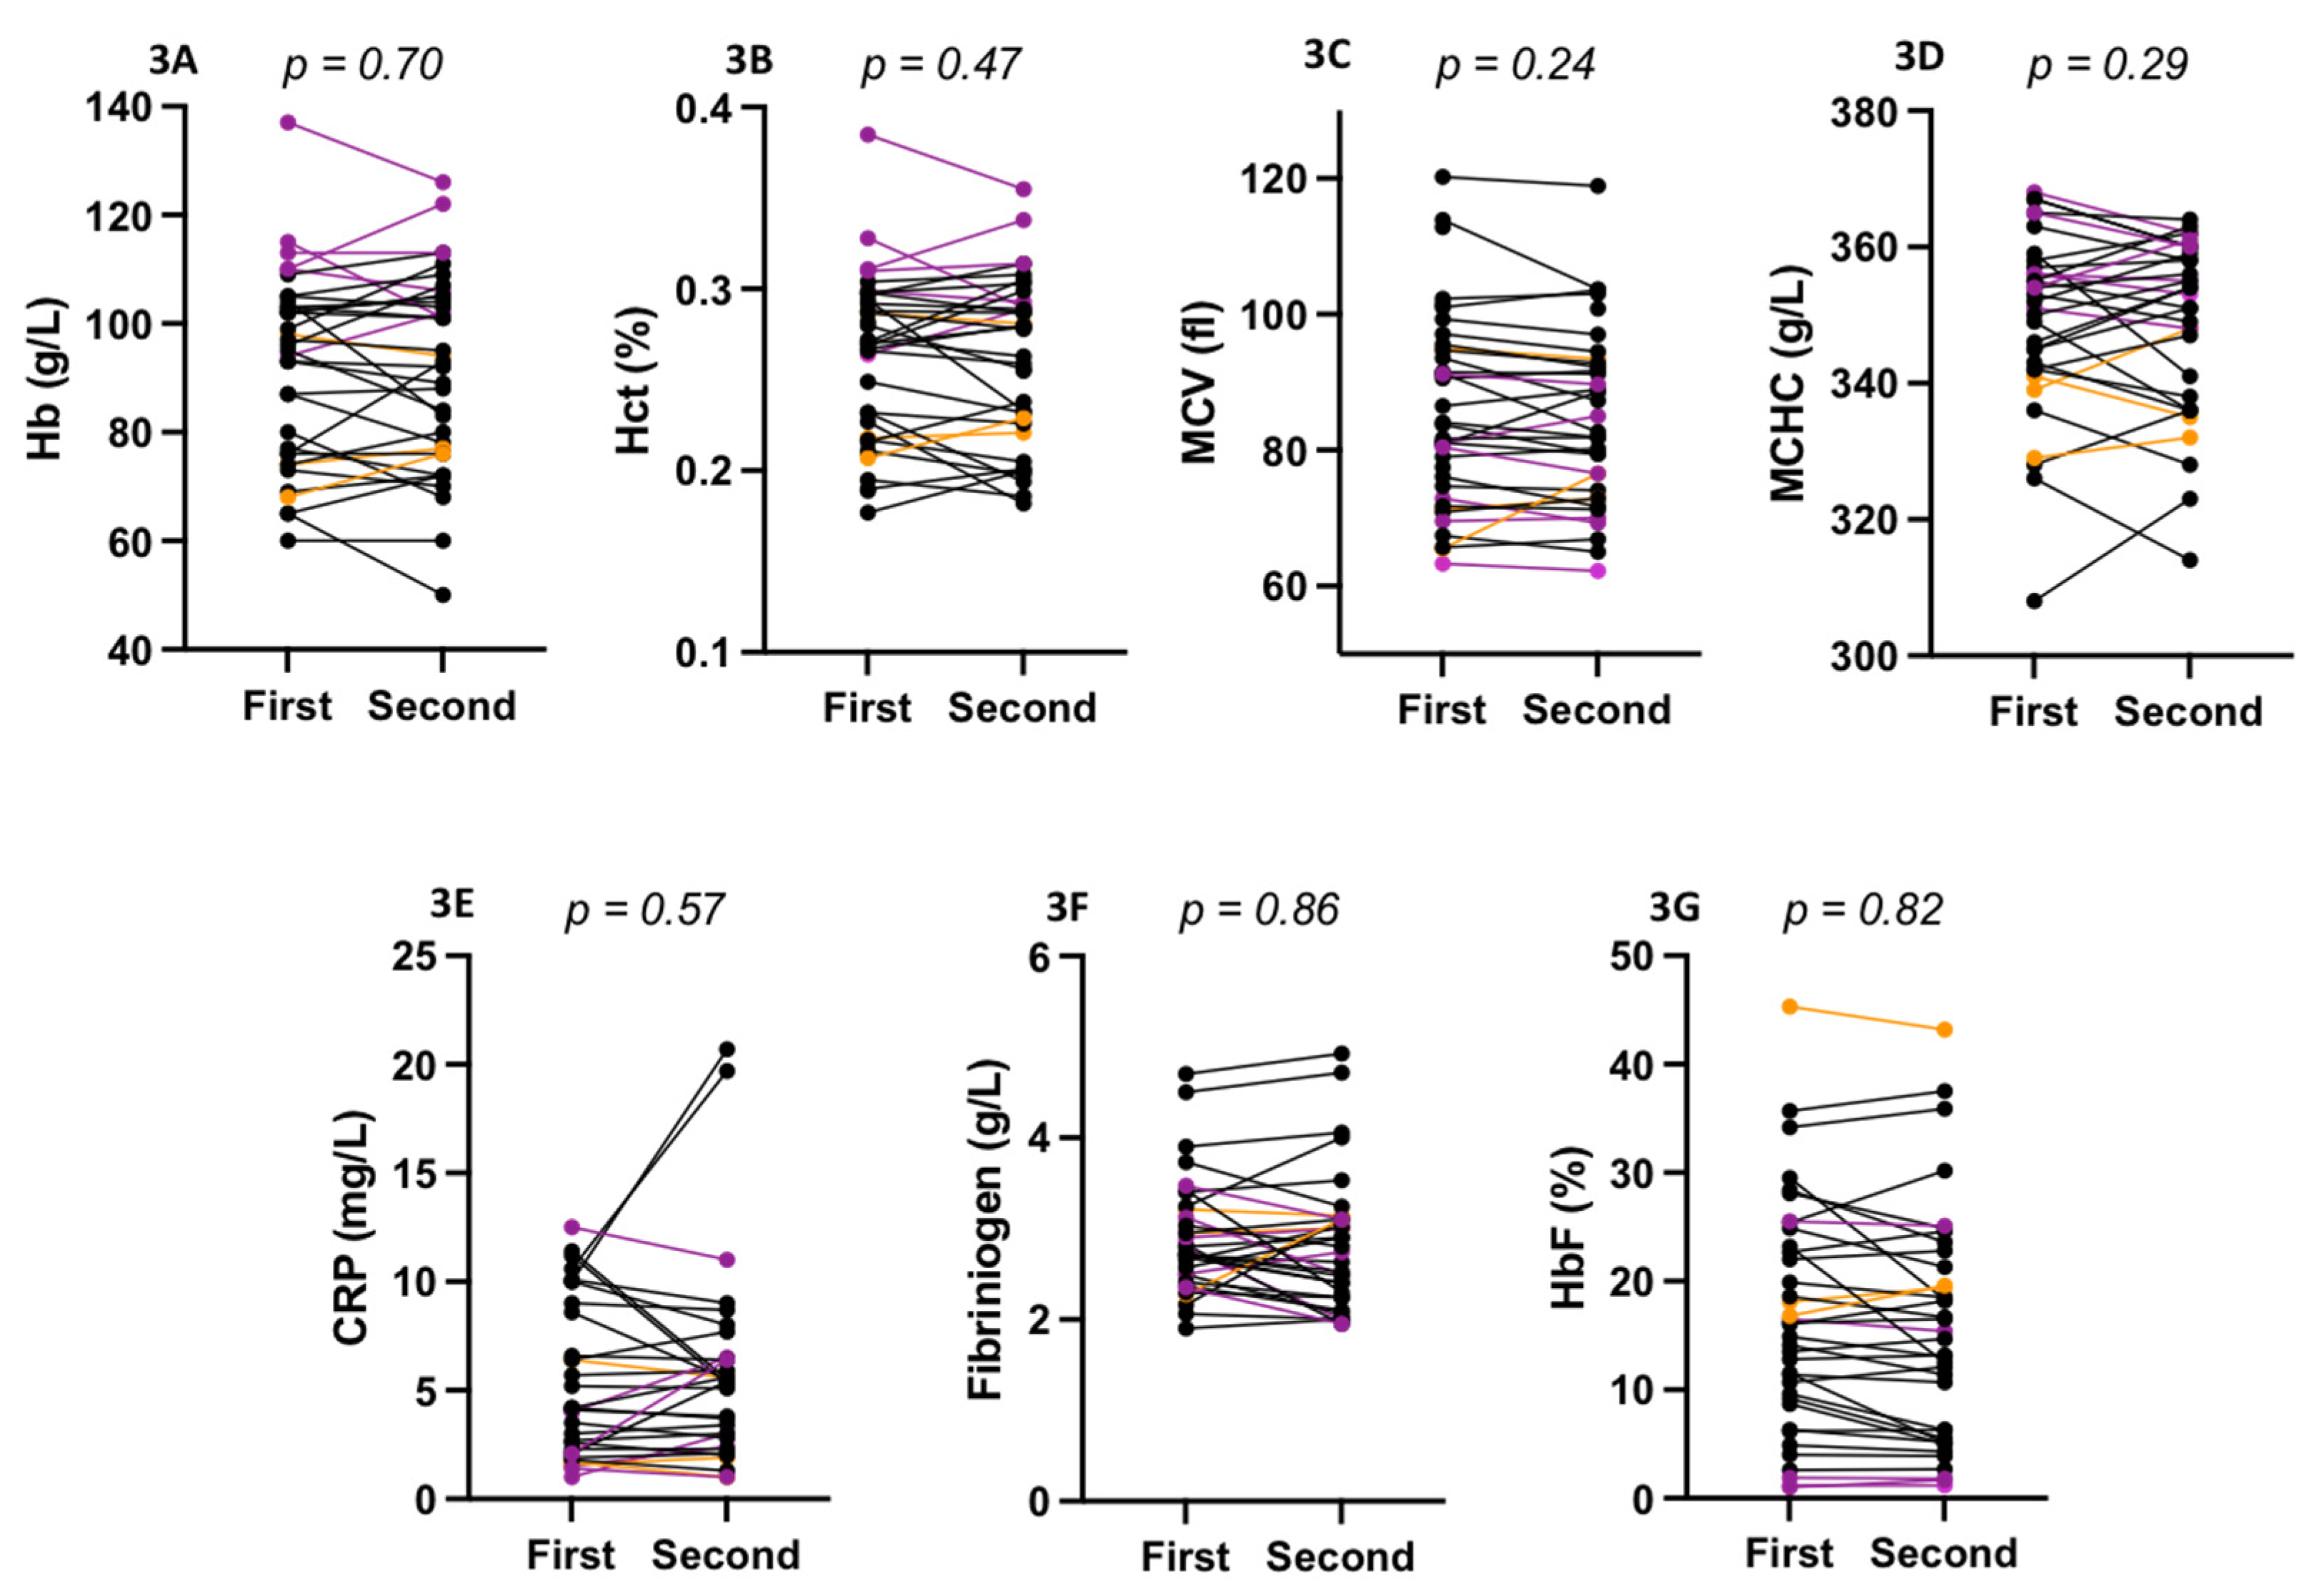
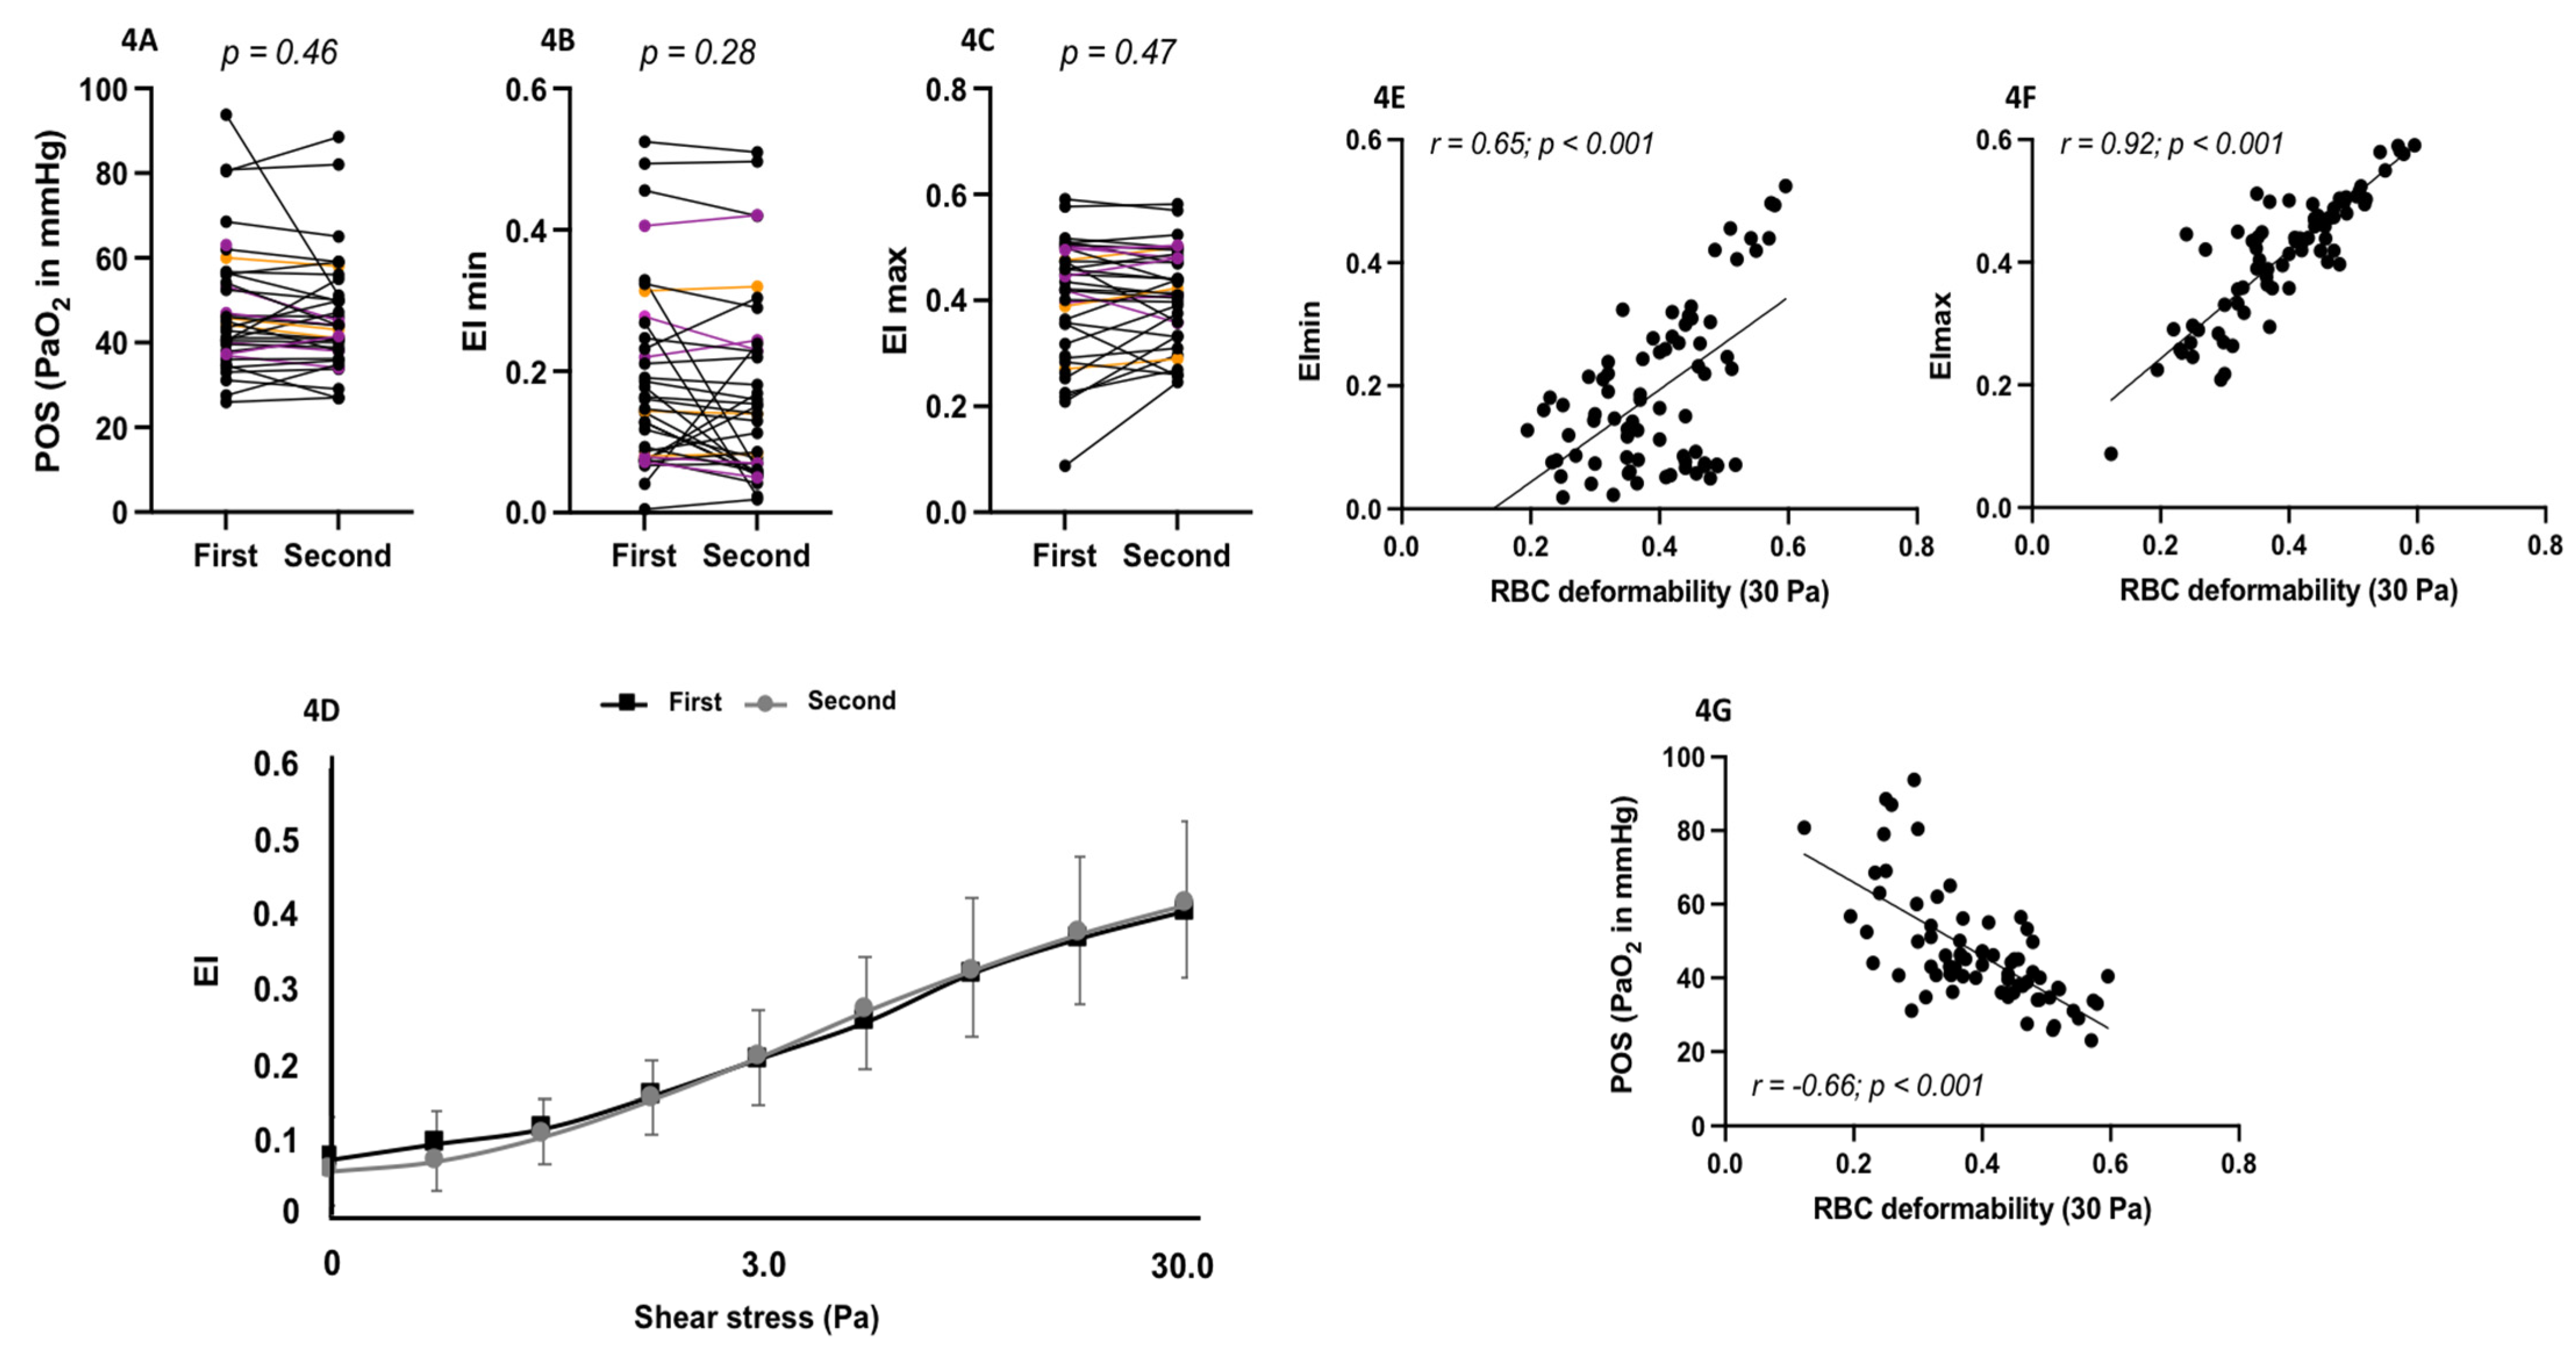
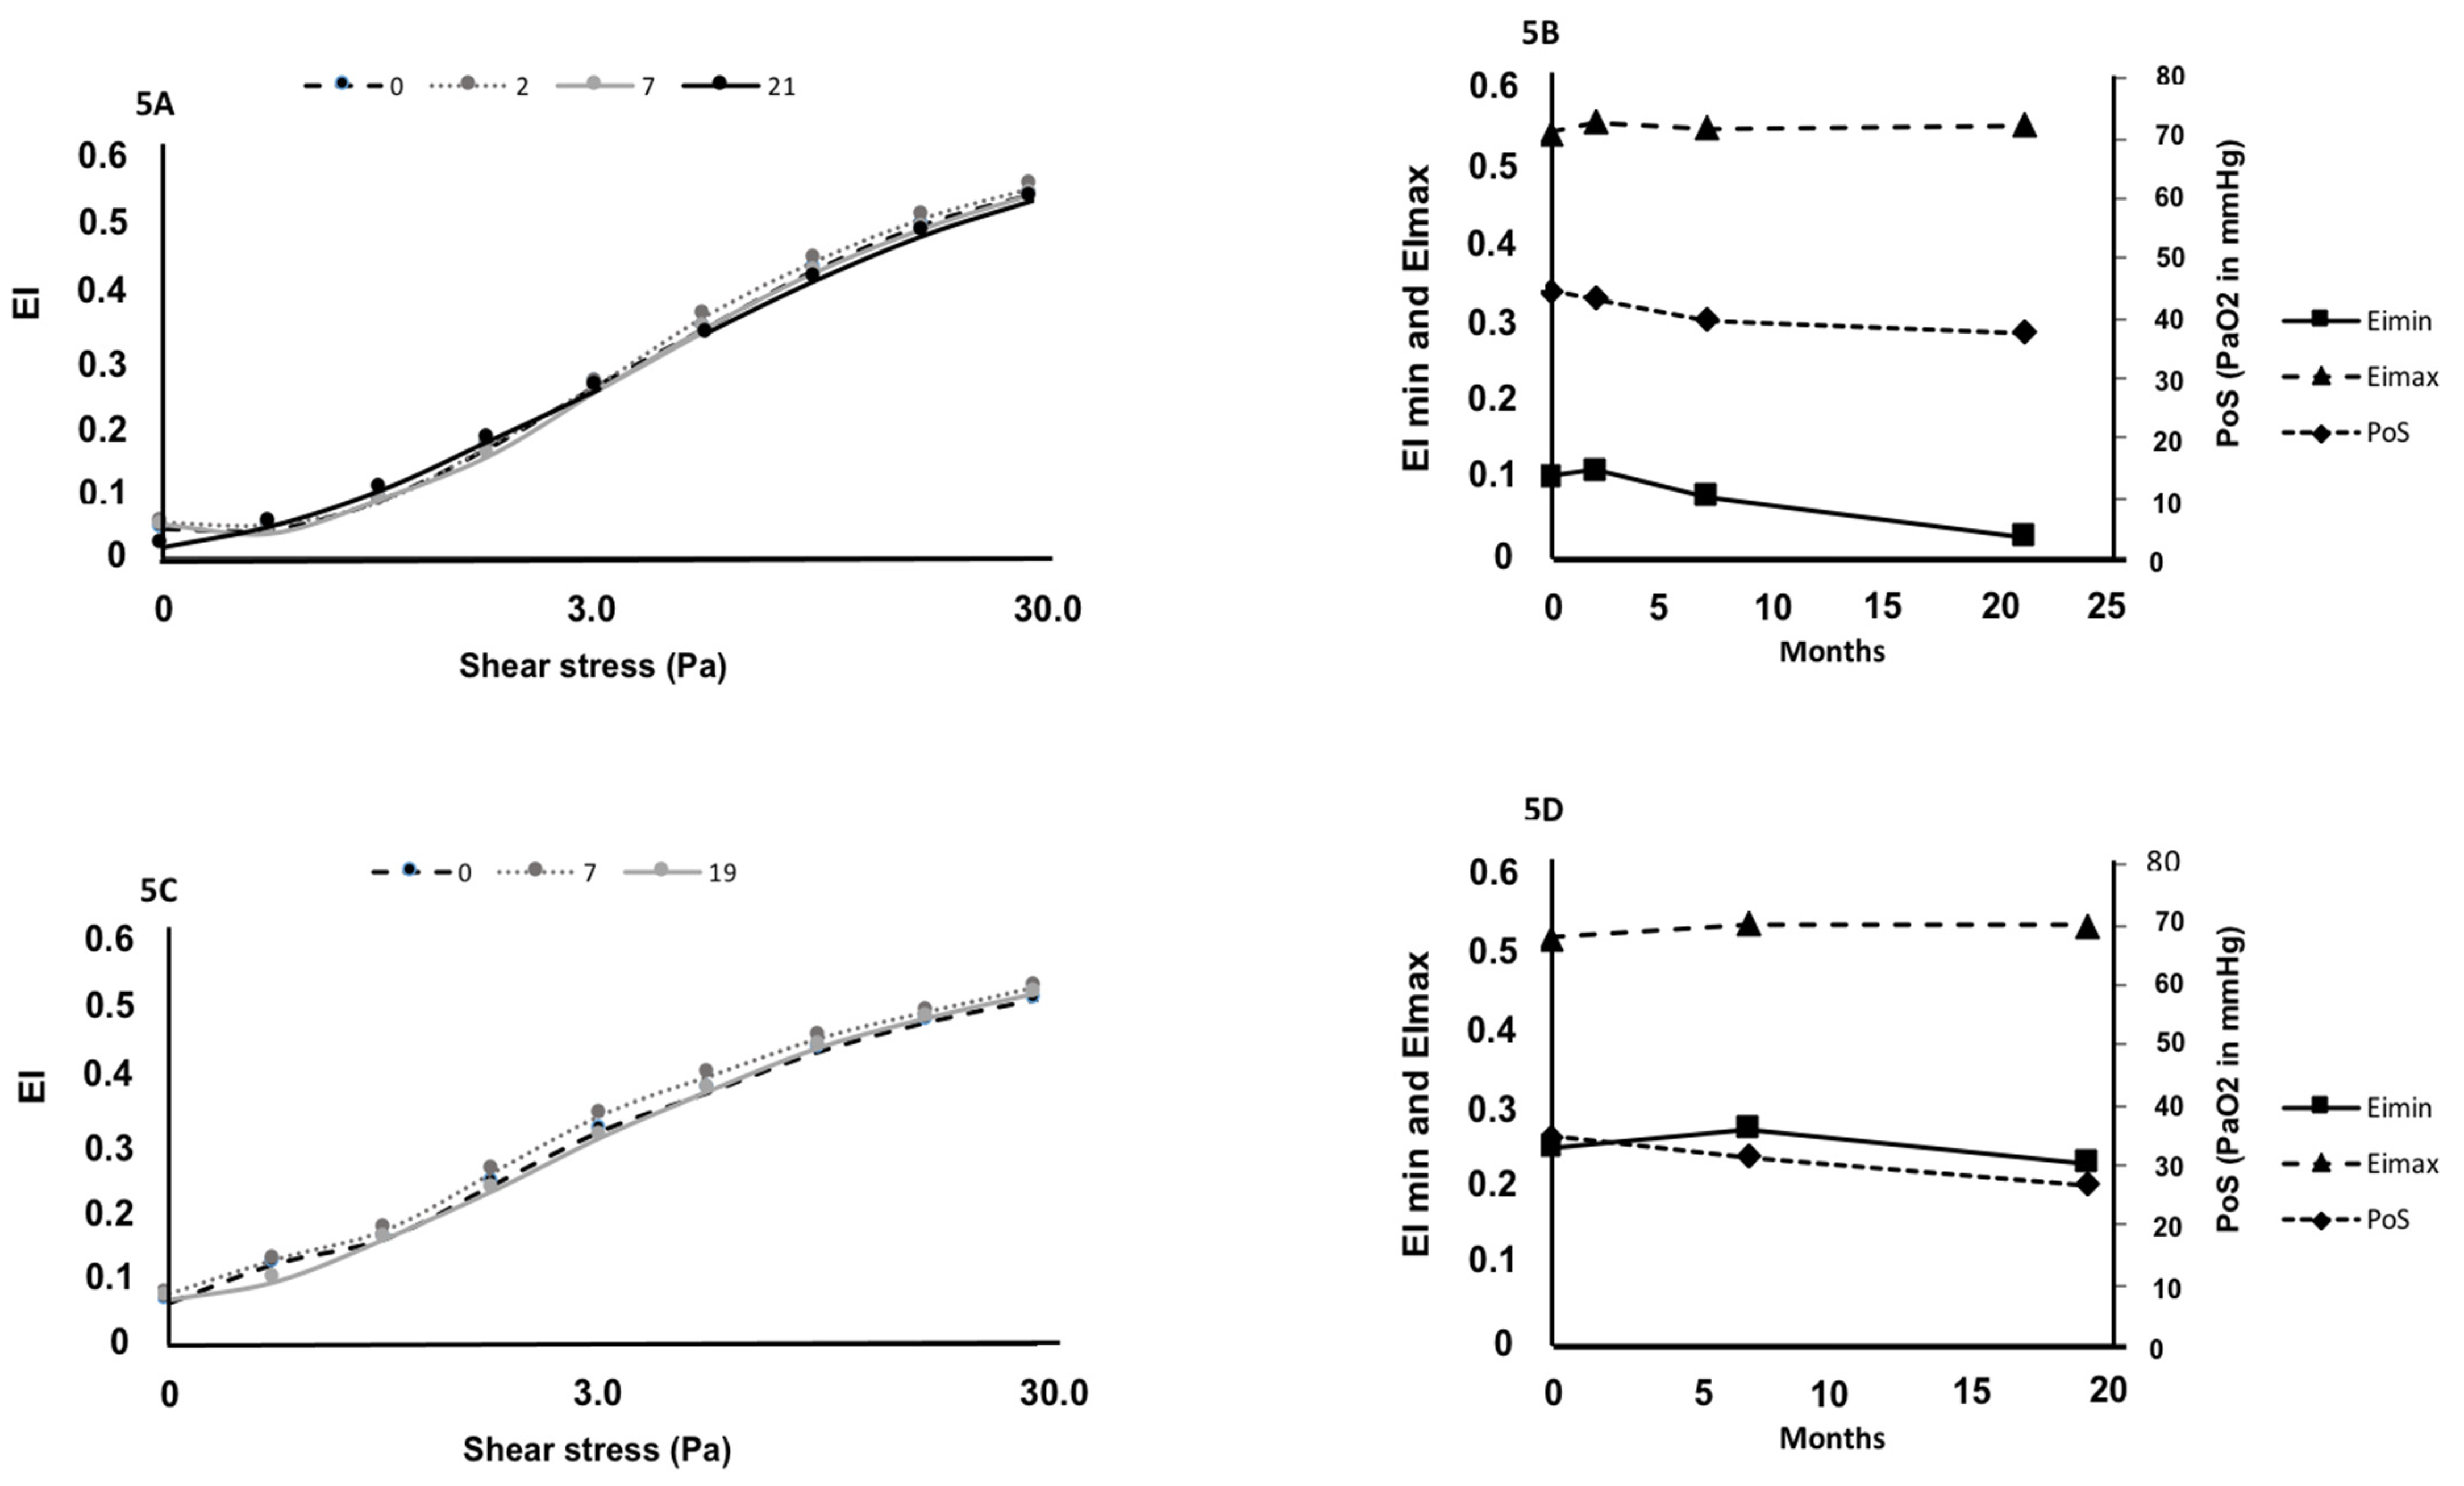
3. Results
3.1. Steady State vs. VOC Comparisons
3.2. Biological and Ektacytometry Parameters Stability
4. Discussion
5. Conclusion
Author Contributions
Funding
Institutional Review Board Statement
Informed Consent Statement
Data Availability Statement
Acknowledgments
Conflicts of Interest
References
- Clark, M.R.; Mohandas, N.; Shohet, S.B. Deformability of oxygenated irreversibly sickled cells. J. Clin. Invest. 1980, 65, 189–196. [Google Scholar] [CrossRef] [PubMed]
- Connes, P.; Alexy, T.; Detterich, J.; Romana, M.; Hardy-Dessources, M.D.; Ballas, S.K. The role of blood rheology in sickle cell disease. Blood Rev. 2016, 30, 111–118. [Google Scholar] [CrossRef] [PubMed]
- Murayama, M. Molecular mechanism of red cell “sickling”. Science 1966, 153, 145–149. [Google Scholar] [CrossRef]
- Lessin, L.S.; Kurantsin-Mills, J.; Wallas, C.; Weems, H. Membrane alterations in irreversibly sickled cells: Hemoglobin--membrane interaction. J. Supramol. Struct. 1978, 9, 537–554. [Google Scholar] [CrossRef] [PubMed]
- Lux, S.E.; John, K.M.; Karnovsky, M.J. Irreversible deformation of the spectrin-actin lattice in irreversibly sickled cells. J. Clin. Invest. 1976, 58, 955–963. [Google Scholar] [CrossRef] [PubMed] [Green Version]
- Brugnara, C.; Tosteson, D.C. Inhibition of K transport by divalent cations in sickle erythrocytes. Blood 1987, 70, 1810–1815. [Google Scholar] [CrossRef] [Green Version]
- Connes, P.; Lamarre, Y.; Waltz, X.; Ballas, S.K.; Lemonne, N.; Etienne-Julan, M.; Hue, O.; Hardy-Dessources, M.D.; Romana, M. Haemolysis and abnormal haemorheology in sickle cell anaemia. Br. J. Haematol. 2014, 165, 564–572. [Google Scholar] [CrossRef]
- Brousse, V.; Pondarre, C.; Kossorotoff, M.; Arnaud, C.; Kamdem, A.; de Montalembert, M.; Boutonnat-Faucher, B.; Allali, S.; Bourdeau, H.; Charlot, K.; et al. Brain injury pathophysiology study by a multimodal approach in children with sickle cell anemia with no intra or extra cranial arteriopathy. Haematologica 2021. [Google Scholar] [CrossRef]
- Cita, K.C.; Brureau, L.; Lemonne, N.; Billaud, M.; Connes, P.; Ferdinand, S.; Tressieres, B.; Tarer, V.; Etienne-Julan, M.; Blanchet, P.; et al. Men with Sickle Cell Anemia and Priapism Exhibit Increased Hemolytic Rate, Decreased Red Blood Cell Deformability and Increased Red Blood Cell Aggregate Strength. PLoS ONE 2016, 11, 0154866. [Google Scholar] [CrossRef] [Green Version]
- Connes, P.; Lamarre, Y.; Hardy-Dessources, M.D.; Lemonne, N.; Waltz, X.; Mougenel, D.; Mukisi-Mukaza, M.; Lalanne-Mistrih, M.L.; Tarer, V.; Tressieres, B.; et al. Decreased hematocrit-to-viscosity ratio and increased lactate dehydrogenase level in patients with sickle cell anemia and recurrent leg ulcers. PLoS ONE 2013, 8, 79680. [Google Scholar] [CrossRef]
- Lamarre, Y.; Romana, M.; Lemonne, N.; Hardy-Dessources, M.D.; Tarer, V.; Mougenel, D.; Waltz, X.; Tressieres, B.; Lalanne-Mistrih, M.L.; Etienne-Julan, M.; et al. Alpha thalassemia protects sickle cell anemia patients from macro-albuminuria through its effects on red blood cell rheological properties. Clin. Hemorheol. Microcirc. 2014, 57, 63–72. [Google Scholar] [CrossRef]
- Lamarre, Y.; Romana, M.; Waltz, X.; Lalanne-Mistrih, M.L.; Tressieres, B.; Divialle-Doumdo, L.; Hardy-Dessources, M.D.; Vent-Schmidt, J.; Petras, M.; Broquere, C.; et al. Hemorheological risk factors of acute chest syndrome and painful vaso-occlusive crisis in children with sickle cell disease. Haematologica 2012, 97, 1641–1647. [Google Scholar] [CrossRef]
- Renoux, C.; Connes, P.; Nader, E.; Skinner, S.; Faes, C.; Petras, M.; Bertrand, Y.; Garnier, N.; Cuzzubbo, D.; Divialle-Doumdo, L.; et al. Alpha-thalassaemia promotes frequent vaso-occlusive crises in children with sickle cell anaemia through haemorheological changes. Pediatr Blood Cancer 2017, 64, e26455. [Google Scholar] [CrossRef] [PubMed]
- Charlot, K.; Romana, M.; Moeckesch, B.; Jumet, S.; Waltz, X.; Divialle-Doumdo, L.; Hardy-Dessources, M.D.; Petras, M.; Tressieres, B.; Tarer, V.; et al. Which side of the balance determines the frequency of vaso-occlusive crises in children with sickle cell anemia: Blood viscosity or microvascular dysfunction? Blood Cells Mol. Dis. 2016, 56, 41–45. [Google Scholar] [CrossRef] [PubMed]
- Nebor, D.; Bowers, A.; Hardy-Dessources, M.D.; Knight-Madden, J.; Romana, M.; Reid, H.; Barthelemy, J.C.; Cumming, V.; Hue, O.; Elion, J.; et al. Frequency of pain crises in sickle cell anemia and its relationship with the sympatho-vagal balance, blood viscosity and inflammation. Haematologica 2011, 96, 1589–1594. [Google Scholar] [CrossRef]
- Boisson, C.; Rab, M.A.E.; Nader, E.; Renoux, C.; Kanne, C.; Bos, J.; van Oirschot, B.A.; Joly, P.; Fort, R.; Gauthier, A.; et al. Effects of Genotypes and Treatment on Oxygenscan Parameters in Sickle Cell Disease. Cells 2021, 10, 811. [Google Scholar] [CrossRef] [PubMed]
- Rab, M.A.E.; Kanne, C.K.; Bos, J.; van Oirschot, B.A.; Boisson, C.; Houwing, M.E.; Gerritsma, J.; Teske, E.; Renoux, C.; Riedl, J.; et al. Oxygen gradient ektacytometry-derived biomarkers are associated with vaso-occlusive crises and correlate with treatment response in sickle cell disease. Am. J. Hematol. 2021, 96, 29–32. [Google Scholar] [CrossRef] [PubMed]
- Sadaf, A.; Seu, K.G.; Thaman, E.; Fessler, R.; Konstantinidis, D.G.; Bonar, H.A.; Korpik, J.; Ware, R.E.; McGann, P.T.; Quinn, C.T.; et al. Automated Oxygen Gradient Ektacytometry: A Novel Biomarker in Sickle Cell Anemia. Front. Physiol. 2021, 12, 636609. [Google Scholar] [CrossRef] [PubMed]
- Rab, M.A.E.; van Oirschot, B.A.; Bos, J.; Merkx, T.H.; van Wesel, A.C.W.; Abdulmalik, O.; Safo, M.K.; Versluijs, B.A.; Houwing, M.E.; Cnossen, M.H.; et al. Rapid and reproducible characterization of sickling during automated deoxygenation in sickle cell disease patients. Am. J. Hematol. 2019, 94, 575–584. [Google Scholar] [CrossRef]
- Chonat, S.; Fields, E.; Baratz, H.; Watt, A.; Pochron, M.; Dixon, S.; Tonda, M.; Lehrer-Graiwer, J.; Brown, C.; Archer, D.R. Improvement in Red Blood Cell Physiology in Children with Sickle Cell Anemia Receiving Voxelotor. Blood 2019, 134, 2281. [Google Scholar] [CrossRef]
- Hierso, R.; Lemonne, N.; Villaescusa, R.; Lalanne-Mistrih, M.L.; Charlot, K.; Etienne-Julan, M.; Tressieres, B.; Lamarre, Y.; Tarer, V.; Garnier, Y.; et al. Exacerbation of oxidative stress during sickle vaso-occlusive crisis is associated with decreased anti-band 3 autoantibodies rate and increased red blood cell-derived microparticle level: A prospective study. Br. J. Haematol. 2017, 176, 805–813. [Google Scholar] [CrossRef]
- Baskurt, O.K.; Boynard, M.; Cokelet, G.C.; Connes, P.; Cooke, B.M.; Forconi, S.; Liao, F.; Hardeman, M.R.; Jung, F.; Meiselman, H.J.; et al. New guidelines for hemorheological laboratory techniques. Clin. Hemorheol. Microcirc. 2009, 42, 75–97. [Google Scholar] [CrossRef] [Green Version]
- Renoux, C.; Parrow, N.; Faes, C.; Joly, P.; Hardeman, M.; Tisdale, J.; Levine, M.; Garnier, N.; Bertrand, Y.; Kebaili, K.; et al. Importance of methodological standardization for the ektacytometric measures of red blood cell deformability in sickle cell anemia. Clin. Hemorheol. Microcirc. 2016, 62, 173–179. [Google Scholar] [CrossRef] [PubMed]
- Boisson, C.; Rab, M.A.E.; Nader, E.; Renoux, C.; van Oirschot, B.A.; Joly, P.; Fort, R.; Stauffer, E.; van Beers, E.J.; Sheehan, V.A.; et al. Methodological aspects of oxygen gradient ektacytometry in sickle cell disease: Effects of sample storage on outcome parameters in distinct patient subgroups. Clin. Hemorheol. Microcirc. 2021, 77, 391–394. [Google Scholar] [CrossRef] [PubMed]
- Rab, M.A.E.; Kanne, C.K.; Bos, J.; Boisson, C.; van Oirschot, B.A.; Nader, E.; Renoux, C.; Joly, P.; Fort, R.; van Beers, E.J.; et al. Methodological aspects of the oxygenscan in sickle cell disease: A need for standardization. Am. J. Hematol. 2020, 95, 5–8. [Google Scholar] [CrossRef] [PubMed]
- Rees, D.C.; Gibson, J.S. Biomarkers in sickle cell disease. Br. J. Haematol. 2012, 156, 433–445. [Google Scholar] [CrossRef]
- Havell, T.C.; Hillman, D.; Lessin, L.S. Deformability characteristics of sickle cells by microelastimetry. Am. J. Hematol. 1978, 4, 9–16. [Google Scholar] [CrossRef]
- Nash, G.B.; Johnson, C.S.; Meiselman, H.J. Influence of oxygen tension on the viscoelastic behavior of red blood cells in sickle cell disease. Blood 1986, 67, 110–118. [Google Scholar] [CrossRef]
- Reid, H.L.; Obi, G.O. A study of erythrocyte deformability in sickle cell disease. Trop. Geogr. Med. 1982, 34, 43–46. [Google Scholar]
- Maciaszek, J.L.; Lykotrafitis, G. Sickle cell trait human erythrocytes are significantly stiffer than normal. J. Biomech. 2011, 44, 657–661. [Google Scholar] [CrossRef]
- Brandao, M.M.; Fontes, A.; Barjas-Castro, M.L.; Barbosa, L.C.; Costa, F.F.; Cesar, C.L.; Saad, S.T. Optical tweezers for measuring red blood cell elasticity: Application to the study of drug response in sickle cell disease. Eur J. Haematol. 2003, 70, 207–211. [Google Scholar] [CrossRef] [PubMed]
- Alapan, Y.; Matsuyama, Y.; Little, J.A.; Gurkan, U.A. Dynamic deformability of sickle red blood cells in microphysiological flow. Technol. (Singap. World Sci.) 2016, 4, 71–79. [Google Scholar] [CrossRef] [PubMed] [Green Version]
- Faivre, M.; Renoux, C.; Bessaa, A.; Da Costa, L.; Joly, P.; Gauthier, A.; Connes, P. Mechanical Signature of Red Blood Cells Flowing Out of a Microfluidic Constriction Is Impacted by Membrane Elasticity, Cell Surface-to-Volume Ratio and Diseases. Front. Physiol. 2020, 11, 576. [Google Scholar] [CrossRef] [PubMed]
- Ballas, S.K. Sickle cell anemia with few painful crises is characterized by decreased red cell deformability and increased number of dense cells. Am. J. Hematol. 1991, 36, 122–130. [Google Scholar] [CrossRef] [PubMed]
- Ballas, S.K.; Larner, J.; Smith, E.D.; Surrey, S.; Schwartz, E.; Rappaport, E.F. Rheologic predictors of the severity of the painful sickle cell crisis. Blood 1988, 72, 1216–1223. [Google Scholar] [CrossRef] [Green Version]
- Embury, S.H.; Clark, M.R.; Monroy, G.; Mohandas, N. Concurrent sickle cell anemia and alpha-thalassemia. Effect on pathological properties of sickle erythrocytes. J. Clin. Invest. 1984, 73, 116–123. [Google Scholar] [CrossRef]
- Clark, M.R.; Mohandas, N.; Shohet, S.B. Osmotic gradient ektacytometry: Comprehensive characterization of red cell volume and surface maintenance. Blood 1983, 61, 899–910. [Google Scholar] [CrossRef] [Green Version]
- Da Costa, L.; Galimand, J.; Fenneteau, O.; Mohandas, N. Hereditary spherocytosis, elliptocytosis, and other red cell membrane disorders. Blood Rev. 2013, 27, 167–178. [Google Scholar] [CrossRef]
- Ballas, S.K.; Connes, P.; Investigators of the Multicenter Study of Hydroxyurea in Sickle Cell Anemia. Rheological properties of sickle erythrocytes in patients with sickle-cell anemia: The effect of hydroxyurea, fetal hemoglobin, and alpha-thalassemia. Eur. J. Haematol. 2018, 101, 798–803. [Google Scholar] [CrossRef]
- Parrow, N.L.; Violet, P.C.; Tu, H.; Nichols, J.; Pittman, C.A.; Fitzhugh, C.; Fleming, R.E.; Mohandas, N.; Tisdale, J.F.; Levine, M. Measuring Deformability and Red Cell Heterogeneity in Blood by Ektacytometry. J. Vis. Exp. 2018, 56910. [Google Scholar] [CrossRef]
- Tripette, J.; Alexy, T.; Hardy-Dessources, M.D.; Mougenel, D.; Beltan, E.; Chalabi, T.; Chout, R.; Etienne-Julan, M.; Hue, O.; Meiselman, H.J.; et al. Red blood cell aggregation, aggregate strength and oxygen transport potential of blood are abnormal in both homozygous sickle cell anemia and sickle-hemoglobin C disease. Haematologica 2009, 94, 1060–1065. [Google Scholar] [CrossRef]
- Lapoumeroulie, C.; Connes, P.; El Hoss, S.; Hierso, R.; Charlot, K.; Lemonne, N.; Elion, J.; Le Van Kim, C.; Romana, M.; Hardy-Dessources, M.D. New insights into red cell rheology and adhesion in patients with sickle cell anaemia during vaso-occlusive crises. Br. J. Haematol. 2019, 185, 991–994. [Google Scholar] [CrossRef] [PubMed] [Green Version]
- Renoux, C.; Faivre, M.; Bessaa, A.; Da Costa, L.; Joly, P.; Gauthier, A.; Connes, P. Impact of surface-area-to-volume ratio, internal viscosity and membrane viscoelasticity on red blood cell deformability measured in isotonic condition. Sci. Rep. 2019, 9, 6771. [Google Scholar] [CrossRef] [PubMed]
- Krishnan, S.; Setty, Y.; Betal, S.G.; Vijender, V.; Rao, K.; Dampier, C.; Stuart, M. Increased levels of the inflammatory biomarker C-reactive protein at baseline are associated with childhood sickle cell vasocclusive crises. Br. J. Haematol. 2010, 148, 797–804. [Google Scholar] [CrossRef]
- Bargoma, E.M.; Mitsuyoshi, J.K.; Larkin, S.K.; Styles, L.A.; Kuypers, F.A.; Test, S.T. Serum C-reactive protein parallels secretory phospholipase A2 in sickle cell disease patients with vasoocclusive crisis or acute chest syndrome. Blood 2005, 105, 3384–3385. [Google Scholar] [CrossRef] [PubMed] [Green Version]
- Pepys, M.B.; Hirschfield, G.M. C-reactive protein: A critical update. J. Clin. Invest. 2003, 111, 1805–1812. [Google Scholar] [CrossRef]


Publisher’s Note: MDPI stays neutral with regard to jurisdictional claims in published maps and institutional affiliations. |
© 2022 by the authors. Licensee MDPI, Basel, Switzerland. This article is an open access article distributed under the terms and conditions of the Creative Commons Attribution (CC BY) license (https://creativecommons.org/licenses/by/4.0/).
Share and Cite
Boisson, C.; Nader, E.; Renoux, C.; Gauthier, A.; Poutrel, S.; Bertrand, Y.; Stauffer, E.; Virot, E.; Hot, A.; Fort, R.; et al. Shear-Stress-Gradient and Oxygen-Gradient Ektacytometry in Sickle Cell Patients at Steady State and during Vaso-Occlusive Crises. Cells 2022, 11, 585. https://0-doi-org.brum.beds.ac.uk/10.3390/cells11030585
Boisson C, Nader E, Renoux C, Gauthier A, Poutrel S, Bertrand Y, Stauffer E, Virot E, Hot A, Fort R, et al. Shear-Stress-Gradient and Oxygen-Gradient Ektacytometry in Sickle Cell Patients at Steady State and during Vaso-Occlusive Crises. Cells. 2022; 11(3):585. https://0-doi-org.brum.beds.ac.uk/10.3390/cells11030585
Chicago/Turabian StyleBoisson, Camille, Elie Nader, Céline Renoux, Alexandra Gauthier, Solène Poutrel, Yves Bertrand, Emeric Stauffer, Emilie Virot, Arnaud Hot, Romain Fort, and et al. 2022. "Shear-Stress-Gradient and Oxygen-Gradient Ektacytometry in Sickle Cell Patients at Steady State and during Vaso-Occlusive Crises" Cells 11, no. 3: 585. https://0-doi-org.brum.beds.ac.uk/10.3390/cells11030585