Dysregulation of the Immune System in HIV/HCV-Coinfected Patients According to Liver Stiffness Status

 , , , and
Abstract
:1. Introduction
2. Methods
2.1. Study Subjects
2.2. Clinical Data
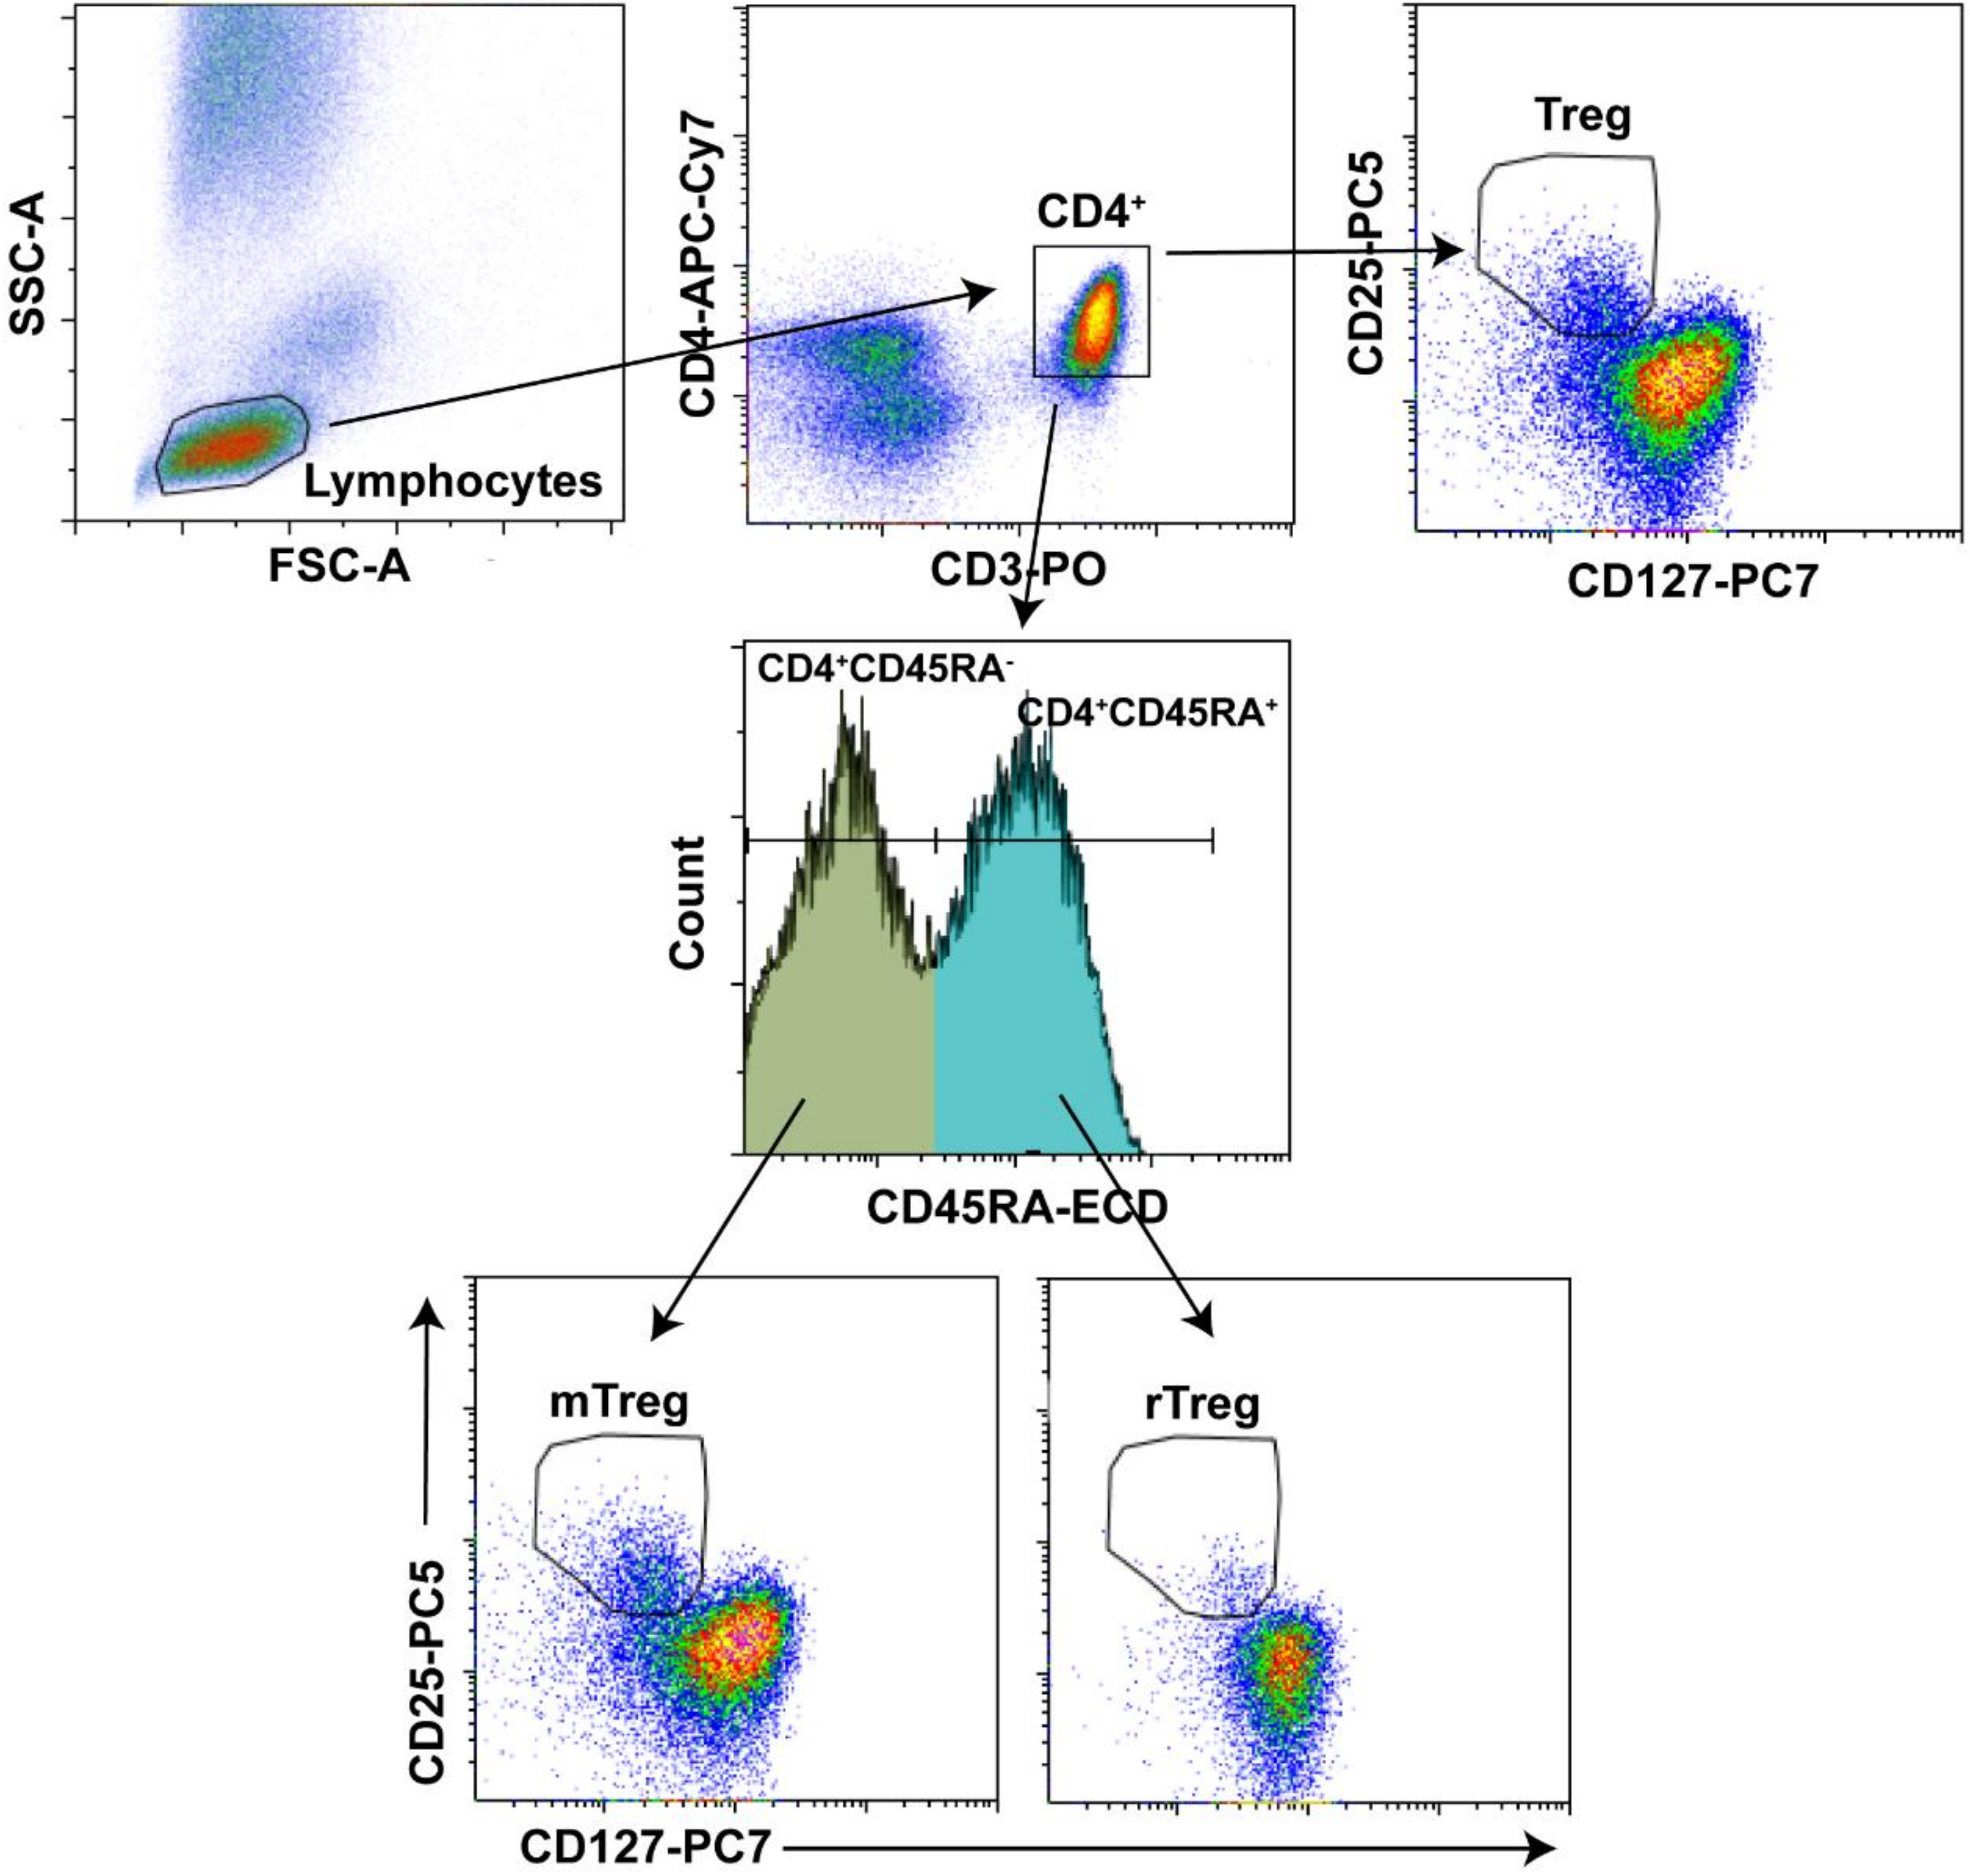
2.3. Flow Cytometry
2.4. Multiplex Assay and ELISA
2.5. Statistical Analysis
3. Results
3.1. Patients
3.2. Biomarker Values in HIV/HCV-Coinfected Patients and Control Groups: Univariate Analysis
3.3. Association between Biomarker Values and Liver Stiffness: Multivariate Analysis
4. Discussion
5. Limitations of Study
6. Conclusions
Supplementary Materials
Author Contributions
Funding
Acknowledgments
Conflicts of Interest
Appendix A
References
- Miles, B.; Miller, S.M.; Connick, E. CD4 T follicular helper and regulatory cell dynamics and function in HIV infection. Front. Immunol. 2016, 7, 659. [Google Scholar] [CrossRef] [PubMed]
- Pandiyan, P.; Younes, S.A.; Ribeiro, S.P.; Talla, A.; McDonald, D.; Bhaskaran, N.; Levine, A.D.; Weinberg, A.; Sekaly, R.P. Mucosal regulatory T cells and t helper 17 cells in HIV-associated immune activation. Front. Immunol. 2016, 7, 228. [Google Scholar] [CrossRef] [PubMed]
- De Biasi, S.; Bianchini, E.; Nasi, M.; Digaetano, M.; Gibellini, L.; Carnevale, G.; Borghi, V.; Guaraldi, G.; Pinti, M.; Mussini, C.; et al. Th1 and th17 proinflammatory profile characterizes invariant natural killer T cells in virologically suppressed HIV+ patients with low CD4+/CD8+ ratio. AIDS 2016, 30, 2599–2610. [Google Scholar] [CrossRef] [PubMed] [Green Version]
- Fernandes, J.R.; Berthoud, T.K.; Kumar, A.; Angel, J.B. Il-23 signaling in th17 cells is inhibited by HIV infection and is not restored by HAART: Implications for persistent immune activation. PLoS ONE 2017, 12, e0186823. [Google Scholar] [CrossRef] [PubMed]
- DaFonseca, S.; Niessl, J.; Pouvreau, S.; Wacleche, V.S.; Gosselin, A.; Cleret-Buhot, A.; Bernard, N.; Tremblay, C.; Jenabian, M.A.; Routy, J.P.; et al. Impaired th17 polarization of phenotypically naive CD4(+) t-cells during chronic HIV-1 infection and potential restoration with early art. Retrovirology 2015, 12, 38. [Google Scholar] [CrossRef] [PubMed]
- Mahnke, Y.D.; Fletez-Brant, K.; Sereti, I.; Roederer, M. Reconstitution of peripheral t cells by tissue-derived CCR4+ central memory cells following HIV-1 antiretroviral therapy. Pathog. Immun. 2016, 1, 260–290. [Google Scholar] [CrossRef] [PubMed]
- DuPage, M.; Bluestone, J.A. Harnessing the plasticity of CD4(+) T cells to treat immune-mediated disease. Nat. Rev. Immunol. 2016, 16, 149–163. [Google Scholar] [CrossRef] [PubMed]
- Veiga-Parga, T.; Sehrawat, S.; Rouse, B.T. Role of regulatory T cells during virus infection. Immunol. Rev. 2013, 255, 182–196. [Google Scholar] [CrossRef] [PubMed] [Green Version]
- Mudd, J.C.; Brenchley, J.M. Gut mucosal barrier dysfunction, microbial dysbiosis, and their role in HIV-1 disease progression. J. Infect. Dis. 2016, 214 (Suppl. 2), S58–S66. [Google Scholar] [CrossRef]
- Sun, H.; Kim, D.; Li, X.; Kiselinova, M.; Ouyang, Z.; Vandekerckhove, L.; Shang, H.; Rosenberg, E.S.; Yu, X.G.; Lichterfeld, M. Th1/17 polarization of CD4 T cells supports HIV-1 persistence during antiretroviral therapy. J. Virol. 2015, 89, 11284–11293. [Google Scholar] [CrossRef] [PubMed]
- Seu, L.; Mobley, J.A.; Goepfert, P.A. CD4+ T cells from HIV-1 patients with impaired th1 effector responses to mycobacterium tuberculosis exhibit diminished histone and nucleoprotein signatures. Clin. Immunol. 2017, 181, 16–23. [Google Scholar] [CrossRef] [PubMed]
- Jambo, K.C.; Banda, D.H.; Afran, L.; Kankwatira, A.M.; Malamba, R.D.; Allain, T.J.; Gordon, S.B.; Heyderman, R.S.; Russell, D.G.; Mwandumba, H.C. Asymptomatic HIV-infected individuals on antiretroviral therapy exhibit impaired lung CD4(+) T-cell responses to mycobacteria. Am. J. Respir. Crit. Care Med. 2014, 190, 938–947. [Google Scholar] [CrossRef] [PubMed]
- Glennie, S.J.; Banda, D.; Gould, K.; Hinds, J.; Kamngona, A.; Everett, D.D.; Williams, N.A.; Heyderman, R.S. Defective pneumococcal-specific th1 responses in HIV-infected adults precedes a loss of control of pneumococcal colonization. Clin. Infect. Dis. 2013, 56, 291–299. [Google Scholar] [CrossRef] [PubMed]
- Westbrook, R.H.; Dusheiko, G. Natural history of hepatitis c. J. Hepatol. 2014, 61, S58–S68. [Google Scholar] [CrossRef] [PubMed]
- Manns, M.P.; Buti, M.; Gane, E.; Pawlotsky, J.M.; Razavi, H.; Terrault, N.; Younossi, Z. Hepatitis c virus infection. Nat. Rev. Dis. Primers 2017, 3, 17006. [Google Scholar] [CrossRef] [PubMed]
- Vallet-Pichard, A.; Pol, S. Natural history and predictors of severity of chronic hepatitis c virus (HCV) and human immunodeficiency virus (HIV) co-infection. J. Hepatol. 2006, 44, S28–S34. [Google Scholar] [CrossRef] [PubMed]
- Lo Re, V., 3rd; Kallan, M.J.; Tate, J.P.; Localio, A.R.; Lim, J.K.; Goetz, M.B.; Klein, M.B.; Rimland, D.; Rodriguez-Barradas, M.C.; Butt, A.A.; et al. Hepatic decompensation in antiretroviral-treated patients co-infected with HIV and hepatitis c virus compared with hepatitis c virus-monoinfected patients: A cohort study. Ann. Intern. Med. 2014, 160, 369–379. [Google Scholar] [PubMed]
- López-Diéguez, M.; Montes, M.L.; Pascual-Pareja, J.F.; Quereda, C.; Von Wichmann, M.A.; Berenguer, J.; Tural, C.; Hernando, A.; González-García, J.; Serrano, L.; et al. The natural history of liver cirrhosis in HIV-hepatitis c virus-coinfected patients. AIDS 2011, 25, 899–904. [Google Scholar] [CrossRef] [PubMed]
- Macias, J.; Berenguer, J.; Japon, M.A.; Giron, J.A.; Rivero, A.; Lopez-Cortes, L.F.; Moreno, A.; Gonzalez-Serrano, M.; Iribarren, J.A.; Ortega, E.; et al. Fast fibrosis progression between repeated liver biopsies in patients coinfected with human immunodeficiency virus/hepatitis c virus. Hepatology 2009, 50, 1056–1063. [Google Scholar] [CrossRef] [PubMed]
- Berenguer, J.; Rodriguez, E.; Miralles, P.; Von Wichmann, M.A.; Lopez-Aldeguer, J.; Mallolas, J.; Galindo, M.J.; Van Den Eynde, E.; Tellez, M.J.; Quereda, C.; et al. Sustained virological response to interferon plus ribavirin reduces non-liver-related mortality in patients coinfected with HIV and hepatitis c virus. Clin. Infect. Dis. 2012, 55, 728–736. [Google Scholar] [CrossRef] [PubMed]
- Berenguer, J.; Rodriguez-Castellano, E.; Carrero, A.; Von Wichmann, M.A.; Montero, M.; Galindo, M.J.; Mallolas, J.; Crespo, M.; Tellez, M.J.; Quereda, C.; et al. Eradication of hepatitis c virus and non-liver-related non-acquired immune deficiency syndrome-related events in human immunodeficiency virus/hepatitis c virus coinfection. Hepatology 2017, 66, 344–356. [Google Scholar] [CrossRef] [PubMed]
- Hartling, H.J.; Ballegaard, V.C.; Nielsen, N.S.; Gaardbo, J.C.; Nielsen, S.D. Immune regulation in chronic hepatitis c virus infection. Scand. J. Gastroenterol. 2016, 51, 1387–1397. [Google Scholar] [CrossRef] [PubMed]
- Paquissi, F.C. Immunity and fibrogenesis: The role of th17/il-17 axis in HBV and HCV-induced chronic hepatitis and progression to cirrhosis. Front. Immunol. 2017, 8, 1195. [Google Scholar] [CrossRef] [PubMed]
- Jung, M.K.; Shin, E.C. Regulatory t cells in hepatitis b and c virus infections. Immune Netw. 2016, 16, 330–336. [Google Scholar] [CrossRef] [PubMed]
- Albillos, A.; Lario, M.; Alvarez-Mon, M. Cirrhosis-associated immune dysfunction: Distinctive features and clinical relevance. J. Hepatol. 2014, 61, 1385–1396. [Google Scholar] [CrossRef] [PubMed]
- Larrubia, J.R.; Moreno-Cubero, E.; Lokhande, M.U.; Garcia-Garzon, S.; Lazaro, A.; Miquel, J.; Perna, C.; Sanz-de-Villalobos, E. Adaptive immune response during hepatitis c virus infection. World J. Gastroenterol. 2014, 20, 3418–3430. [Google Scholar] [CrossRef] [PubMed]
- Medrano, L.M.; Garcia-Broncano, P.; Berenguer, J.; Gonzalez-Garcia, J.; Jimenez-Sousa, M.A.; Guardiola, J.M.; Crespo, M.; Quereda, C.; Sanz, J.; Canorea, I.; et al. Elevated liver stiffness is linked to increased biomarkers of inflammation and immune activation in HIV/HCV-coinfected patients. AIDS 2018, 32, 1095–1105. [Google Scholar] [CrossRef] [PubMed]
- Castera, L.; Forns, X.; Alberti, A. Non-invasive evaluation of liver fibrosis using transient elastography. J. Hepatol. 2008, 48, 835–847. [Google Scholar] [CrossRef] [PubMed]
- Garcia-Tsao, G.; Abraldes, J.G.; Berzigotti, A.; Bosch, J. Portal hypertensive bleeding in cirrhosis: Risk stratification, diagnosis, and management: 2016 practice guidance by the American association for the study of liver diseases. Hepatology 2017, 65, 310–335. [Google Scholar] [CrossRef] [PubMed]
- Lopez-Abente, J.; Correa-Rocha, R.; Pion, M. Functional mechanisms of TREG in the context of HIV infection and the Janus face of immune suppression. Front. Immunol. 2016, 7, 192. [Google Scholar] [CrossRef] [PubMed]
- Estevez, J.; Chen, V.L.; Podlaha, O.; Li, B.; Le, A.; Vutien, P.; Chang, E.T.; Rosenberg-Hasson, Y.; Jiang, Z.; Pflanz, S.; et al. Differential serum cytokine profiles in patients with chronic hepatitis b, c, and hepatocellular carcinoma. Sci. Rep. 2017, 7, 11867. [Google Scholar] [CrossRef] [PubMed]
- Irvine, K.M.; Wockner, L.F.; Hoffmann, I.; Horsfall, L.U.; Fagan, K.J.; Bijin, V.; Lee, B.; Clouston, A.D.; Lampe, G.; Connolly, J.E.; et al. Multiplex serum protein analysis identifies novel biomarkers of advanced fibrosis in patients with chronic liver disease with the potential to improve diagnostic accuracy of established biomarkers. PLoS ONE 2016, 11, e0167001. [Google Scholar] [CrossRef] [PubMed]
- Patel, K.; Remlinger, K.S.; Walker, T.G.; Leitner, P.; Lucas, J.E.; Gardner, S.D.; McHutchison, J.G.; Irving, W.; Guha, I.N. Multiplex protein analysis to determine fibrosis stage and progression in patients with chronic hepatitis c. Clin. Gastroenterol. Hepatol. 2014, 12, 2113–2120. [Google Scholar] [CrossRef] [PubMed]
- Castera, L.; Vergniol, J.; Foucher, J.; Le Bail, B.; Chanteloup, E.; Haaser, M.; Darriet, M.; Couzigou, P.; De Ledinghen, V. Prospective comparison of transient elastography, Fibrotest, APRI, and liver biopsy for the assessment of fibrosis in chronic hepatitis c. Gastroenterology 2005, 128, 343–350. [Google Scholar] [CrossRef] [PubMed]
- Rosenblum, M.D.; Way, S.S.; Abbas, A.K. Regulatory t cell memory. Nat. Rev. Immunol. 2016, 16, 90–101. [Google Scholar] [CrossRef] [PubMed]
- De Souza-Cruz, S.; Victoria, M.B.; Tarrago, A.M.; da Costa, A.G.; Pimentel, J.P.; Pires, E.F.; Araujo Lde, P.; Coelho-dos-Reis, J.G.; Gomes Mde, S.; Amaral, L.R.; et al. Liver and blood cytokine microenvironment in HCV patients is associated to liver fibrosis score: A proinflammatory cytokine ensemble orchestrated by TNF and tuned by il-10. BMC Microbiol. 2016, 16, 3. [Google Scholar] [CrossRef] [PubMed]
- Ebinuma, H.; Nakamoto, N.; Li, Y.; Price, D.A.; Gostick, E.; Levine, B.L.; Tobias, J.; Kwok, W.W.; Chang, K.M. Identification and in vitro expansion of functional antigen-specific CD25+ FoxP3+ regulatory t cells in hepatitis c virus infection. J. Virol. 2008, 82, 5043–5053. [Google Scholar] [CrossRef] [PubMed]
- Sugimoto, K.; Ikeda, F.; Stadanlick, J.; Nunes, F.A.; Alter, H.J.; Chang, K.M. Suppression of HCV-specific t cells without differential hierarchy demonstrated ex vivo in persistent HCV infection. Hepatology 2003, 38, 1437–1448. [Google Scholar] [CrossRef] [PubMed]
- Schulze Zur Wiesch, J.; Thomssen, A.; Hartjen, P.; Toth, I.; Lehmann, C.; Meyer-Olson, D.; Colberg, K.; Frerk, S.; Babikir, D.; Schmiedel, S.; et al. Comprehensive analysis of frequency and phenotype of t regulatory cells in HIV infection: CD39 expression of FoxP3+ t regulatory cells correlates with progressive disease. J. Virol. 2011, 85, 1287–1297. [Google Scholar] [CrossRef] [PubMed]
- Suchard, M.S.; Mayne, E.; Green, V.A.; Shalekoff, S.; Donninger, S.L.; Stevens, W.S.; Gray, C.M.; Tiemessen, C.T. FoxP3 expression is upregulated in CD4 T cells in progressive HIV-1 infection and is a marker of disease severity. PLoS ONE 2010, 5, e11762. [Google Scholar] [CrossRef] [PubMed]
- Rallon, N.I.; Lopez, M.; Soriano, V.; Garcia-Samaniego, J.; Romero, M.; Labarga, P.; Garcia-Gasco, P.; Gonzalez-Lahoz, J.; Benito, J.M. Level, phenotype and activation status of CD4+ FoxP3+ regulatory t cells in patients chronically infected with human immunodeficiency virus and/or hepatitis c virus. Clin. Exp. Immunol. 2009, 155, 35–43. [Google Scholar] [CrossRef] [PubMed]
- Cho, H.; Kikuchi, M.; Li, Y.; Nakamoto, N.; Amorosa, V.K.; Valiga, M.E.; Chang, K.M. Induction of multiple immune regulatory pathways with differential impact in HCV/HIV coinfection. Front. Immunol. 2014, 5, 265. [Google Scholar] [CrossRef] [PubMed]
- Hartling, H.J.; Gaardbo, J.C.; Ronit, A.; Knudsen, L.S.; Ullum, H.; Vainer, B.; Clausen, M.R.; Skogstrand, K.; Gerstoft, J.; Nielsen, S.D. CD4(+) and CD8(+) regulatory T cells (TREGS) are elevated and display an active phenotype in patients with chronic HCV mono-infection and HIV/HCV co-infection. Scand. J. Immunol. 2012, 76, 294–305. [Google Scholar] [CrossRef] [PubMed]
- Rallon, N.I.; Barreiro, P.; Soriano, V.; Garcia-Samaniego, J.; Lopez, M.; Benito, J.M. Elevated TGF-beta1 levels might protect HCV/HIV-coinfected patients from liver fibrosis. Eur. J. Clin. Investig. 2011, 41, 70–76. [Google Scholar] [CrossRef] [PubMed]
- Langhans, B.; Nischalke, H.D.; Kramer, B.; Hausen, A.; Dold, L.; van Heteren, P.; Huneburg, R.; Nattermann, J.; Strassburg, C.P.; Spengler, U. Increased peripheral CD4+ regulatory T cells persist after successful direct-acting antiviral treatment of chronic hepatitis C. J. Hepatol. 2017, 66, 888–896. [Google Scholar] [CrossRef] [PubMed]
- Wilson, E.B.; Brooks, D.G. The role of il-10 in regulating immunity to persistent viral infections. Curr. Top. Microbiol. Immunol. 2011, 350, 39–65. [Google Scholar] [PubMed]
- Kakumu, S.; Okumura, A.; Ishikawa, T.; Yano, M.; Enomoto, A.; Nishimura, H.; Yoshioka, K.; Yoshika, Y. Serum levels of il-10, il-15 and soluble Tumour necrosis factor-alpha (TNF-alpha) receptors in type c chronic liver disease. Clin. Exp. Immunol. 1997, 109, 458–463. [Google Scholar] [CrossRef] [PubMed]
- Afify, M.; Hamza, A.H.; Alomari, R.A. Correlation between serum cytokines, interferons, and liver functions in hepatitis c virus patients. J. Interferon Cytokine Res. 2017, 37, 32–38. [Google Scholar] [CrossRef] [PubMed]
- Hodowanec, A.C.; Brady, K.E.; Gao, W.; Kincaid, S.L.; Plants, J.; Bahk, M.; Landay, A.L.; Huhn, G.D. Characterization of CD4(+) t-cell immune activation and interleukin 10 levels among HIV, hepatitis c virus, and HIV/HCV-coinfected patients. J. Acquir. Immune Defic. Syndr. 2013, 64, 232–240. [Google Scholar] [CrossRef] [PubMed]
- Rojas, J.M.; Avia, M.; Martin, V.; Sevilla, N. Il-10: A multifunctional cytokine in viral infections. J. Immunol. Res. 2017, 2017, 6104054. [Google Scholar] [CrossRef] [PubMed]
- Theron, A.J.; Anderson, R.; Rossouw, T.M.; Steel, H.C. The role of transforming growth factor beta-1 in the progression of HIV/aids and development of non-aids-defining fibrotic disorders. Front. Immunol. 2017, 8, 1461. [Google Scholar] [CrossRef] [PubMed]
- Pinzani, M. Pathophysiology of liver fibrosis. Dig. Dis. 2015, 33, 492–497. [Google Scholar] [CrossRef] [PubMed]
- Boyman, O.; Sprent, J. The role of interleukin-2 during homeostasis and activation of the immune system. Nat. Rev. Immunol. 2012, 12, 180–190. [Google Scholar] [CrossRef] [PubMed]
- Miedema, F. Immunological abnormalities in the natural history of HIV infection: Mechanisms and clinical relevance. Immunodefic. Rev. 1992, 3, 173–193. [Google Scholar] [PubMed]
- Shin, E.C.; Sung, P.S.; Park, S.H. Immune responses and immunopathology in acute and chronic viral hepatitis. Nat. Rev. Immunol. 2016, 16, 509–523. [Google Scholar] [CrossRef] [PubMed]
- Sole, C.; Sola, E.; Morales-Ruiz, M.; Fernandez, G.; Huelin, P.; Graupera, I.; Moreira, R.; de Prada, G.; Ariza, X.; Pose, E.; et al. Characterization of inflammatory response in acute-on-chronic liver failure and relationship with prognosis. Sci. Rep. 2016, 6, 32341. [Google Scholar] [CrossRef] [PubMed]
- Waters, J.P.; Pober, J.S.; Bradley, J.R. Tumour necrosis factor in infectious disease. J. Pathol. 2013, 230, 132–147. [Google Scholar] [CrossRef] [PubMed]
- Kumar, A.; Abbas, W.; Herbein, G. TNF and TNF receptor superfamily members in HIV infection: New cellular targets for therapy? Mediat. Inflamm. 2013, 2013, 484378. [Google Scholar] [CrossRef] [PubMed]
- Del Campo, J.A.; Gallego, P.; Grande, L. Role of inflammatory response in liver diseases: Therapeutic strategies. World J. Hepatol. 2018, 10, 1–7. [Google Scholar] [CrossRef] [PubMed]
- Kanwar, B.; Favre, D.; McCune, J.M. Th17 and regulatory t cells: Implications for aids pathogenesis. Curr. Opin. HIV AIDS 2010, 5, 151–157. [Google Scholar] [CrossRef] [PubMed]
- Watts, G. Liquid biopsy: Still early days for early detection. Lancet 2018, 391, 2593–2594. [Google Scholar] [CrossRef]
- Mann, J.; Reeves, H.L.; Feldstein, A.E. Liquid biopsy for liver diseases. Gut 2018. [Google Scholar] [CrossRef] [PubMed]
- Younas, M.; Psomas, C.; Reynes, J.; Corbeau, P. Immune activation in the course of HIV-1 infection: Causes, phenotypes and persistence under therapy. HIV Med. 2016, 17, 89–105. [Google Scholar] [CrossRef] [PubMed]
- Soriano, V.; Berenguer, J. Extrahepatic comorbidities associated with hepatitis c virus in HIV-infected patients. Curr. Opin. HIV AIDS 2015, 10, 309–315. [Google Scholar] [CrossRef] [PubMed]
- Perneger, T.V. What’s wrong with bonferroni adjustments. BMJ 1998, 316, 1236–1238. [Google Scholar] [CrossRef] [PubMed]
- Sterne, J.A.; Davey Smith, G. Sifting the evidence-what’s wrong with significance tests? BMJ 2001, 322, 226–231. [Google Scholar] [CrossRef] [PubMed]

 ): Values of adjusted arithmetic mean ratio (aAMR) in HIV/HCV-coinfected patients. Red (
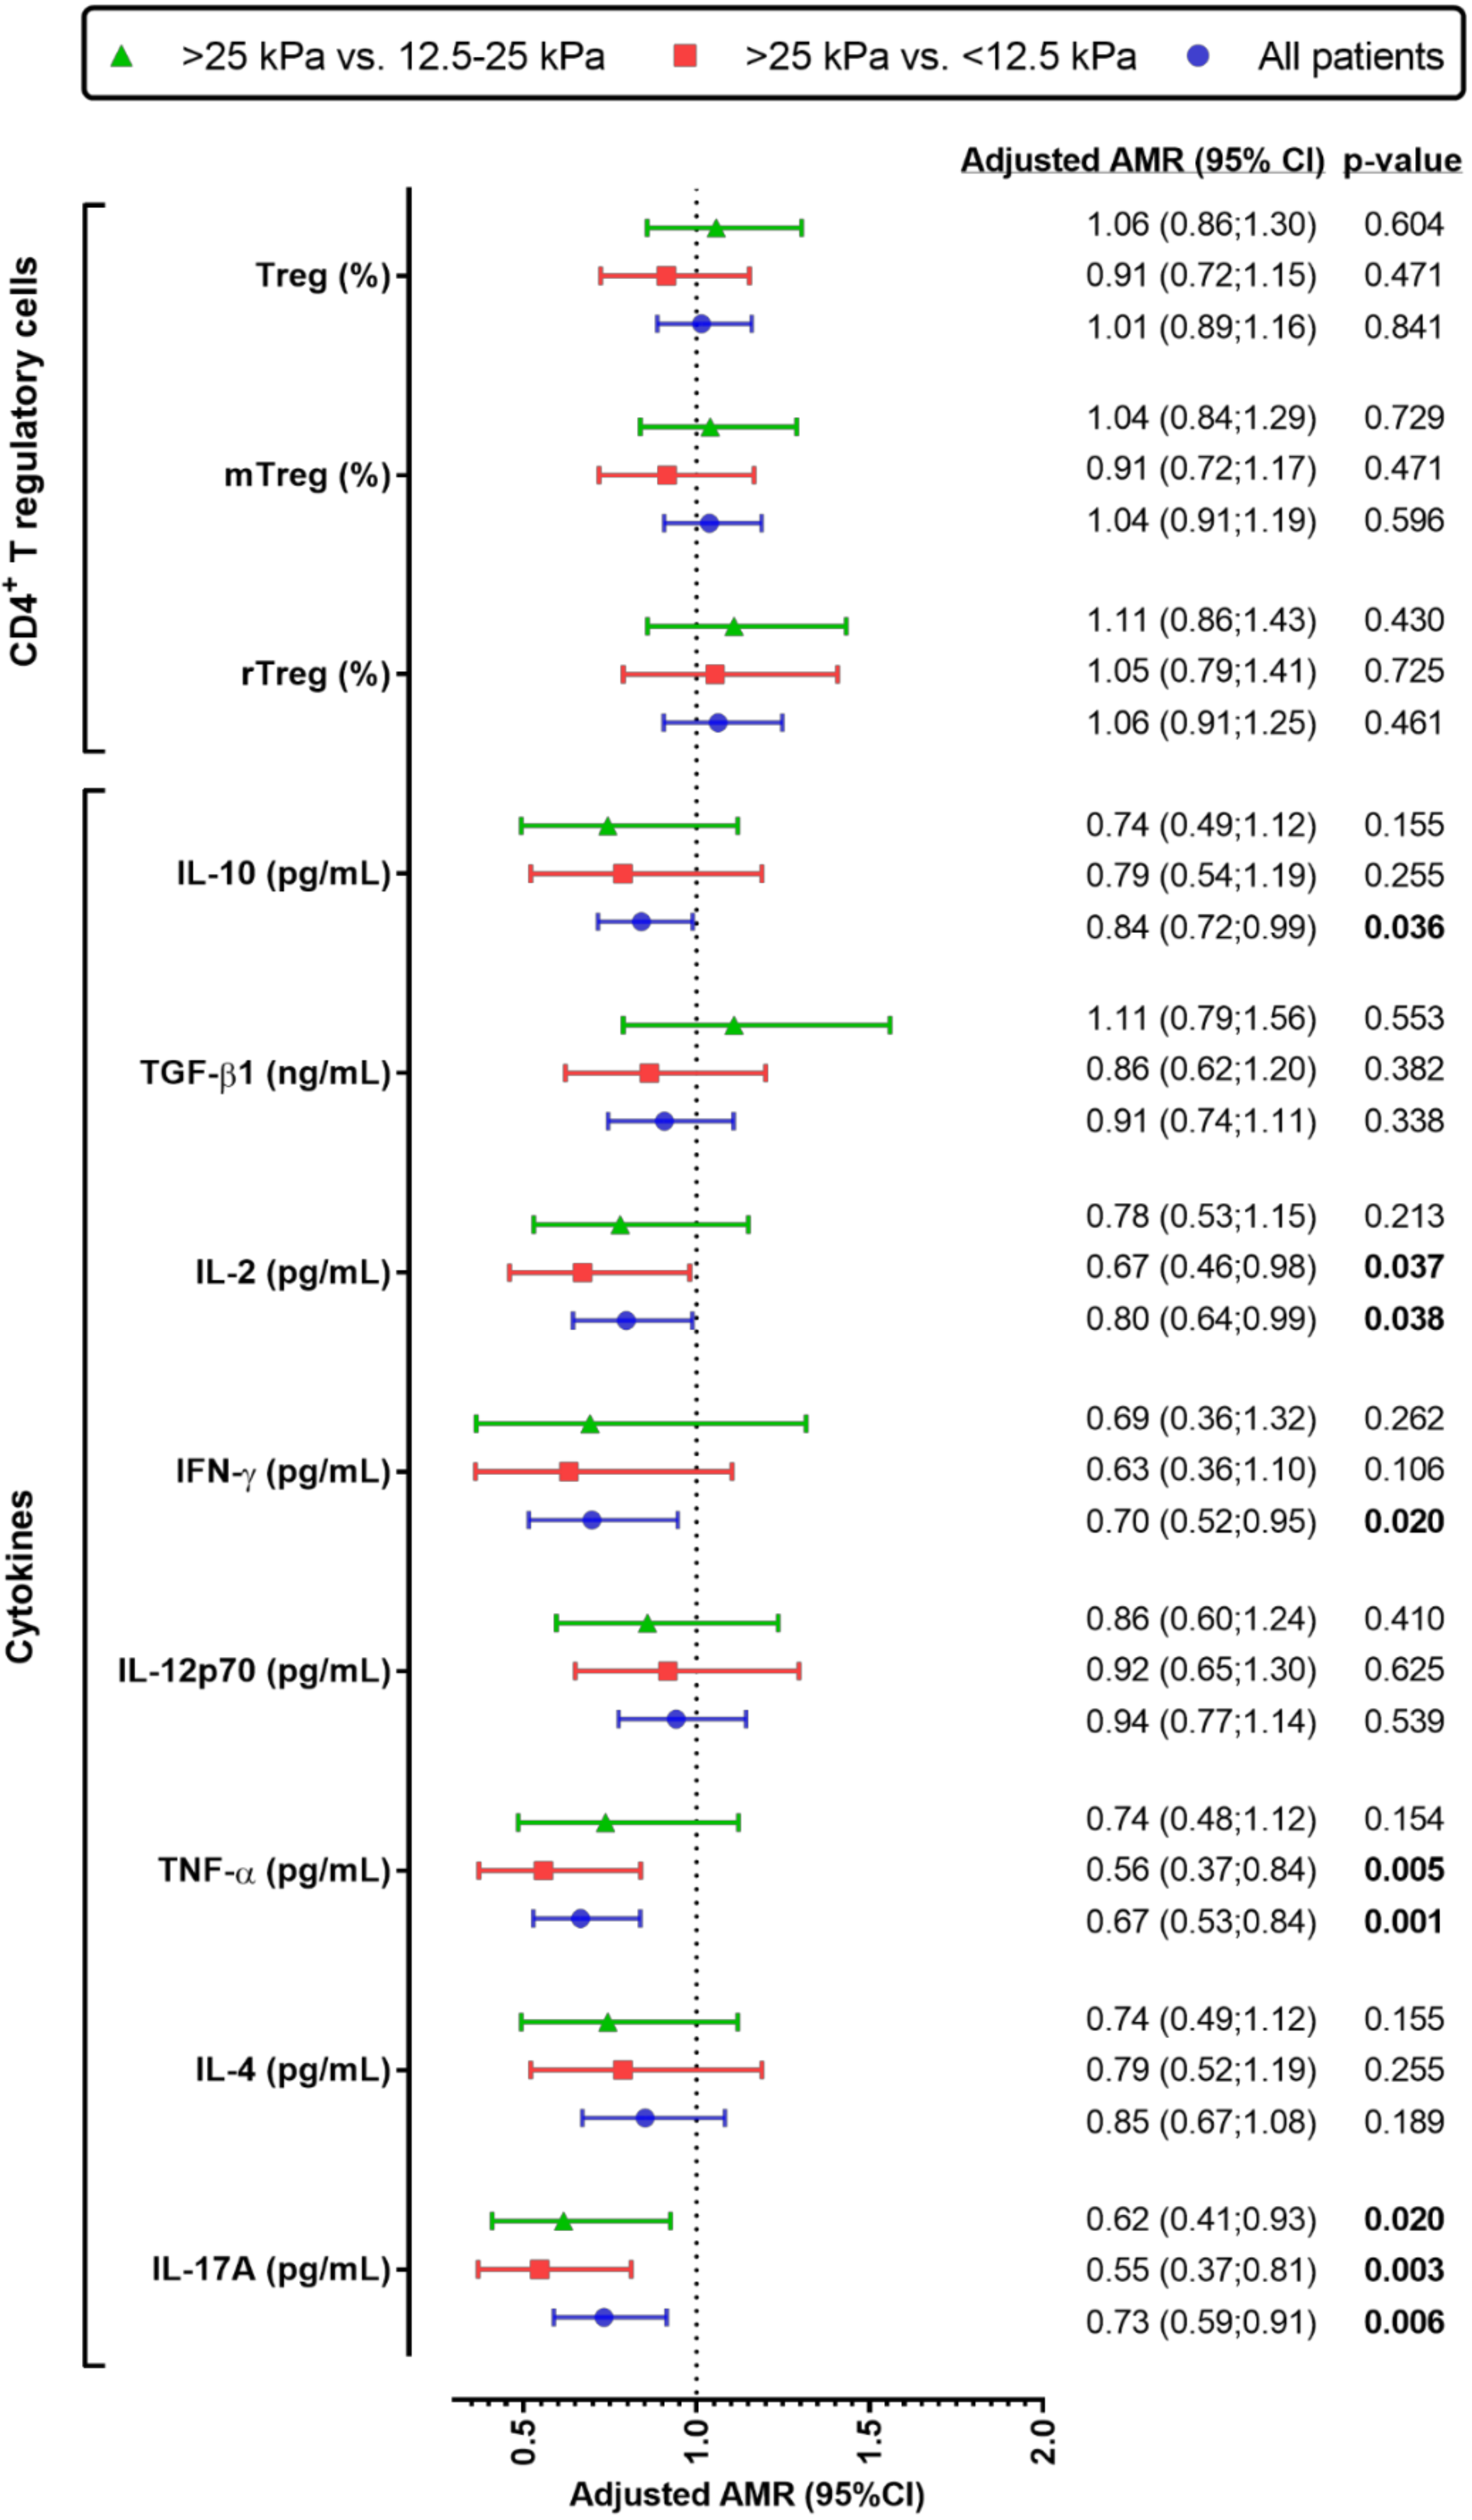
  ): Values of aAMR for patients with >25 kPa versus patients with <12.5 kPa (reference). Green (
  ): Values of aAMR for patients with >25 kPa versus patients with 12.5–25 kPa (reference). Statistics. p-values were calculated by the Generalized Linear Models test with a gamma distribution (log-link). Each regression test was adjusted by age, gender, baseline CD4+ T cells, HIV viral load (≥50 cp/mL), high alcohol intake, diabetes, log10 HCV RNA, HCV-GT1, previous IFNα HCV therapy, and prior AIDS diagnosis. Abbreviations: HCV, hepatitis C virus; HIV, human immunodeficiency virus; LSM, liver stiffness measure; aAMR, adjusted arithmetic mean ratio; CI, confidence interval; CDXX, cluster of differentiation; TGF-β1, transforming growth factor beta 1; IFN-γ, Interferon gamma; IL-XX, interleukin; Treg cells, regulatory CD4+ T cells; TNF-α, tumor necrosis factor alpha.
): Values of adjusted arithmetic mean ratio (aAMR) in HIV/HCV-coinfected patients. Red ( ): Values of aAMR for patients with >25 kPa versus patients with <12.5 kPa (reference). Green ( ): Values of aAMR for patients with >25 kPa versus patients with 12.5–25 kPa (reference). Statistics. p-values were calculated by the Generalized Linear Models test with a gamma distribution (log-link). Each regression test was adjusted by age, gender, baseline CD4+ T cells, HIV viral load (≥50 cp/mL), high alcohol intake, diabetes, log10 HCV RNA, HCV-GT1, previous IFNα HCV therapy, and prior AIDS diagnosis. Abbreviations: HCV, hepatitis C virus; HIV, human immunodeficiency virus; LSM, liver stiffness measure; aAMR, adjusted arithmetic mean ratio; CI, confidence interval; CDXX, cluster of differentiation; TGF-β1, transforming growth factor beta 1; IFN-γ, Interferon gamma; IL-XX, interleukin; Treg cells, regulatory CD4+ T cells; TNF-α, tumor necrosis factor alpha.
): Values of aAMR for patients with >25 kPa versus patients with 12.5–25 kPa (reference). Statistics. p-values were calculated by the Generalized Linear Models test with a gamma distribution (log-link). Each regression test was adjusted by age, gender, baseline CD4+ T cells, HIV viral load (≥50 cp/mL), high alcohol intake, diabetes, log10 HCV RNA, HCV-GT1, previous IFNα HCV therapy, and prior AIDS diagnosis. Abbreviations: HCV, hepatitis C virus; HIV, human immunodeficiency virus; LSM, liver stiffness measure; aAMR, adjusted arithmetic mean ratio; CI, confidence interval; CDXX, cluster of differentiation; TGF-β1, transforming growth factor beta 1; IFN-γ, Interferon gamma; IL-XX, interleukin; Treg cells, regulatory CD4+ T cells; TNF-α, tumor necrosis factor alpha.
): Values of adjusted arithmetic mean ratio (aAMR) in HIV/HCV-coinfected patients. Red ( ): Values of aAMR for patients with >25 kPa versus patients with <12.5 kPa (reference). Green ( ): Values of aAMR for patients with >25 kPa versus patients with 12.5–25 kPa (reference). Statistics. p-values were calculated by the Generalized Linear Models test with a gamma distribution (log-link). Each regression test was adjusted by age, gender, baseline CD4+ T cells, HIV viral load (≥50 cp/mL), high alcohol intake, diabetes, log10 HCV RNA, HCV-GT1, previous IFNα HCV therapy, and prior AIDS diagnosis. Abbreviations: HCV, hepatitis C virus; HIV, human immunodeficiency virus; LSM, liver stiffness measure; aAMR, adjusted arithmetic mean ratio; CI, confidence interval; CDXX, cluster of differentiation; TGF-β1, transforming growth factor beta 1; IFN-γ, Interferon gamma; IL-XX, interleukin; Treg cells, regulatory CD4+ T cells; TNF-α, tumor necrosis factor alpha. 

| Characteristic | <12.5 kPa | 12.5–25 kPa | >25 kPa | p |
|---|---|---|---|---|
| No. | 102 | 65 | 39 | - |
| Age (years) | 48 (45; 52) | 49 (46; 51) | 50 (46; 53) | 0.287 |
| Gender (male) | 83 (81.4%) | 47 (72.3%) | 32 (82.1%) | 0.320 |
| BMI (kg/m2) | 23.8 (21.4; 26.1) | 25.1 (22.7; 28.1) | 24.5 (21.8; 26.5) | 0.077 |
| Diabetes | 8 (7.8%) | 5 (7.7%) | 5 (12.8%) | 0.605 |
| Current alcohol drinker (>50 g/day) | 2 (2%) | 3 (4.6%) | 1 (2.6%) | 0.603 |
| Alcohol ex-drinker | 47 (46.1%) | 31 (47.7%) | 23 (59%) | 0.399 |
| HIV acquired by IVDU | 79 (77.5%) | 49 (77.4%) | 32(82.1%) | 0.570 |
| Prior AIDS | 21 (20.6%) | 20 (30.8%) | 13 (34.2%) | 0.276 |
| Years since HIV diagnosis | 23 (17; 26) | 24 (20; 26) | 21 (17; 25) | 0.098 |
| Years since HCV infection | 22 (16; 24) | 21 (18; 26) | 18 (17; 22) | 0.170 |
| Previous IFNα HCV-therapy | 33 (32.4%) | 46 (70.8%) | 19 (48.7%) | 0.001 |
| Antiretroviral therapy | ||||
| Non-treated | 1 (1%) | 0 (0%) | 2 (5.3%) | 0.122 |
| PI-based | 15 (14.7%) | 11 (16.9%) | 3 (7.7%) | 0.432 |
| 2NRTI+II-based | 28 (27.5%) | 17 (26.2%) | 8 (20.5%) | 0.709 |
| 2NRTI+PI-based | 23 (22.5%) | 9 (13.8%) | 10 (26.3%) | 0.233 |
| 2NRTI+NNRTI-based | 29 (28.4%) | 23 (35.4%) | 12 (31.6%) | 0.689 |
| Others | 6 (5.9%) | 5 (7.7%) | 4 (10.2%) | 0.523 |
| HIV markers | ||||
| Nadir CD4+ T cells | 198 (99; 277) | 162 (83; 234) | 167 (84; 242) | 0.197 |
| Nadir CD4+ T cells < 200 cells/mm3 | 49 (48%) | 39 (60%) | 25 (64.1%) | 0.128 |
| Baseline CD4+ T cells | 626 (436; 845) | 511 (344; 730) | 506 (360; 803) | 0.023 |
| Baseline CD4+ T cells < 500 cells/mm3 | 33 (32.4%) | 31 (48.4%) | 19 (48.7%) | 0.062 |
| HCV markers | ||||
| HCV genotype | ||||
| 1 | 69 (67.6%) | 52 (80%) | 28 (71.8%) | 0.158 |
| 2 | 3 (2.9%) | 1 (1.5%) | 1 (2.6%) | 0.853 |
| 3 | 16 (15.7%) | 11 (16.9%) | 8 (20.5%) | 0. 764 |
| 4 | 14 (13.7%) | 1 (1.5%) | 2 (5.1%) | 0.016 |
| Log10 HCV-RNA (IU/mL) | 6.30 (5.81; 6.80) | 6.30 (6.00 6.68) | 6.11 (5.74; 6.56) | 0.472 |
| HCV-RNA > 850,000 IU/mL | 77 (75.5%) | 55 (84.6%) | 30 (76.9%) | 0.251 |
| Biomarkers | Healthy Controls (0) | HIV-mono (1) | HIV/HCV-co (2) | p (0–1) | p (0–2) | p (1–2) |
|---|---|---|---|---|---|---|
| CD4+ T regulatory cells (%) | ||||||
| CD3+CD4+CD25+CD127−/low (Treg) | 4.5 (3.3; 5.4) | 6.1 (4.9; 7.5) | 8.1 (6.3; 10) | <0.001 | <0.001 | <0.001 |
| CD3+CD4+CD25+CD127−/lowCD45RA− (mTreg) | 5.9 (4.1; 8.2) | 7.9 (6.4; 10.8) | 10.7 (8.1; 13.8) | 0.001 | <0.001 | <0.001 |
| CD3+CD4+CD25+CD127−/lowCD45RA+ (rTreg) | 3 (2.1; 3.8) | 3.2 (1.8; 5.5) | 3 (2; 4.3) | 0.472 | 0.692 | 0.524 |
| Cytokines | ||||||
| IL-10 (pg/mL) | 0.5 (0.4; 1.5) | 0.8 (0.4; 1.7) | 1.4 (0.8; 2.6) | 0.533 | 0.001 | 0.003 |
| TGF-β1 (ng/mL) | 35.6 (21.2; 53.7) | 31.2 (17.7; 51.9) | 28.2 (14; 56.9) | 0.825 | 0.382 | 0.468 |
| IL-2 (pg/mL) | 3.6 (1; 4.1) | 1.5 (1; 3.7) | 3.6 (0.9; 6.5) | 0.355 | 0.778 | 0.695 |
| IFN-γ (pg/mL) | 4.8 (3.5; 8.5) | 5.1 (2.8; 9.1) | 8.6 (2.6; 26.7) | 0.984 | 0.048 | 0.014 |
| IL-12p70 (pg/mL) | 1.7 (0.9; 3.2) | 1.6 (1.1; 2.5) | 1.9 (1.2; 3.9) | 0.802 | 0.390 | 0.174 |
| TNF-α (pg/mL) | 1.5 (0.7; 3.5) | 1.6 (0.7; 3) | 2.1 (0.9; 5) | 0.881 | 0.167 | 0.177 |
| IL-4 (pg/mL) | 3 (1.4; 6.1) | 3.1 (1.8; 5.1) | 3 (1.7; 6.8) | 0.807 | 0.497 | 0.823 |
| IL-17A (pg/mL) | 0.9 (0.5; 2.1) | 1.5 (1; 2.1) | 1.1 (0.5; 2.6) | 0.150 | 0.681 | 0.233 |
| Parameter | LSM < 12.5 kpa (0) | LSM 12.5–25 kpa (1) | LSM ≥ 25 Kpa (2) | p (0–1) | p (0–2) | p (1–2) |
|---|---|---|---|---|---|---|
| CD4+ T regulatory cells (%) | ||||||
| CD3+CD4+CD25+CD127−/low (Treg) | 8 (6.1; 10) | 8.5 (6.2; 10.8) | 7.7 (6.4; 9.7) | 0.573 | 0.549 | 0.327 |
| CD3+CD4+CD25+CD127−/lowCD45RA− (mTreg) | 11.1 (8.5; 13.7) | 11.1 (8.1; 14.2) | 9.8 (7.6; 12.8) | 0.965 | 0.095 | 0.207 |
| CD3+CD4+CD25+CD127−/lowCD45RA+ (rTreg) | 2.9 (2.2; 3.9) | 2.9 (1.7; 5.2) | 3.7 (2.5; 4.4) | 0.837 | 0.112 | 0.491 |
| Cytokines | ||||||
| IL-10 (pg/mL) | 1.5 (0.9; 3) | 1.2 (0.7; 2.2) | 1.4 (0.7; 2.6) | 0.076 | 0.410 | 0.383 |
| TGF-β1 (ng/mL) | 33 (15.8; 56) | 23.5 (12.2; 59.8) | 22.3 (10.5; 48.5) | 0.275 | 0.137 | 0.750 |
| IL-2 (pg/mL) | 3.6 (0.9; 7.9) | 1.5 (0.9; 5.7) | 2.7 (0.9; 3.6) | 0.078 | 0.039 | 0.800 |
| IFN-γ (pg/mL) | 10.5 (2.7; 34.5) | 6.6 (1.5; 15.2) | 12.4 (4.7; 28.3) | 0.071 | 0.833 | 0.041 |
| IL-12p70 (pg/mL) | 2.3 (1.4; 4.3) | 1.6 (0.9; 3) | 1.8 (1.1; 4) | 0.017 | 0.227 | 0.492 |
| TNF-α (pg/mL) | 3 (1.3; 6.2) | 1.7 (0.9; 4.9) | 1.1 (0.4; 3.2) | 0.043 | 0.003 | 0.341 |
| IL-4 (pg/mL) | 3.8 (1.7; 7.4) | 2.4 (1.5; 6) | 1.8 (1.1; 6.7) | 0.032 | 0.038 | 0.886 |
| IL-17A (pg/mL) | 1.7 (0.8; 3.8) | 0.9 (0.3; 2) | 0.7 (0.4; 2) | 0.008 | 0.003 | 0.620 |
© 2018 by the authors. Licensee MDPI, Basel, Switzerland. This article is an open access article distributed under the terms and conditions of the Creative Commons Attribution (CC BY) license (http://creativecommons.org/licenses/by/4.0/).
Share and Cite
Garcia-Broncano, P.; Medrano, L.M.; Berenguer, J.; González-García, J.; Jiménez-Sousa, M.Á.; Carrero, A.; Hontañón, V.; Guardiola, J.M.; Crespo, M.; Quereda, C.; et al. Dysregulation of the Immune System in HIV/HCV-Coinfected Patients According to Liver Stiffness Status. Cells 2018, 7, 196. https://0-doi-org.brum.beds.ac.uk/10.3390/cells7110196
Garcia-Broncano P, Medrano LM, Berenguer J, González-García J, Jiménez-Sousa MÁ, Carrero A, Hontañón V, Guardiola JM, Crespo M, Quereda C, et al. Dysregulation of the Immune System in HIV/HCV-Coinfected Patients According to Liver Stiffness Status. Cells. 2018; 7(11):196. https://0-doi-org.brum.beds.ac.uk/10.3390/cells7110196
Chicago/Turabian StyleGarcia-Broncano, Pilar, Luz Maria Medrano, Juan Berenguer, Juan González-García, Mª Ángeles Jiménez-Sousa, Ana Carrero, Victor Hontañón, Josep M. Guardiola, Manuel Crespo, Carmen Quereda, and et al. 2018. "Dysregulation of the Immune System in HIV/HCV-Coinfected Patients According to Liver Stiffness Status" Cells 7, no. 11: 196. https://0-doi-org.brum.beds.ac.uk/10.3390/cells7110196