The Heterochromatin Landscape in Migrating Cells and the Importance of H3K27me3 for Associated Transcriptome Alterations


Department of Molecular Biology, Faculty of Life Sciences and Ariel Center for Applied Cancer Research, Ariel University, Ariel 40700, Israel
*
Authors to whom correspondence should be addressed.
Cells 2018, 7(11), 205; https://0-doi-org.brum.beds.ac.uk/10.3390/cells7110205
Submission received: 26 October 2018
/
Revised: 6 November 2018
/
Accepted: 7 November 2018
/
Published: 9 November 2018
(This article belongs to the Section Cell Nuclei: Function, Transport and Receptors)
Abstract
:H3K9me3, H3K27me3, and H4K20me1 are epigenetic markers associated with chromatin condensation and transcriptional repression. Previously, we found that migration of melanoma cells is associated with and dependent on global chromatin condensation that includes a global increase in these markers. Taken together with more recent reports by others suggests it is a general signature of migrating cells. Here, to learn about the function of these markers in migrating cells, we mapped them by ChIP-seq analysis. This analysis revealed that induction of migration leads to expansion of these markers along the genome and to an increased overlapping between them. Significantly, induction of migration led to a higher increase in H3K9me3 and H4K20me1 signals at repetitive elements than at protein-coding genes, while an opposite pattern was found for H3K27me3. Transcriptome analysis revealed 182 altered genes following induction of migration, of which 33% are dependent on H3K27me3 for these changes. H3K27me3 was also required to prevent changes in the expression of 501 other genes upon induction of migration. Taken together, our results suggest that heterochromatinization in migrating cells is global and not restricted to specific genomic loci and that H3K27me3 is a key component in executing a migration-specific transcriptional plan.
1. Introduction
Cell migration is one of cancer hallmarks that is fundamental for metastasis formation [1]. Tumor cell migration is highly dependent on cytoplasmic changes in the cytoskeleton and in the activity of motor proteins [2,3,4], but more recently alterations in chromatin structures were also found to be required [5]. Chromatin basic repetitive packaging unit is the nucleosome, which is composed of 147bp of DNA that are wrapped around an octamer of histones [6]. Nucleosomes are organized in higher order structures, of which relatively decondensed and transcribed regions are termed euchromatin, while more condensed and nontranscribed regions are termed heterochromatin. Euchromatin and heterochromatin are decorated by different levels and/or types of epigenetic marks, such as histone modifications. Heterochromatin-associated histone modifications include H3K9me3, H3K27me3, and H4K20me1 [7]. H3K9me3 is enriched in constitutive heterochromatin regions, such as repetitive elements and pericentromeric regions, where it is important for their repression [8]. Still, H3K9me3 was also found at promoters of repressed genes, as well as at some active genes [9]. H3K27me3 accumulates over cell-type specific repressed genes (facultative heterochromatin) and the inactivate X chromosome [9,10,11]. H4K20me1 is associated with repression of the inactive X chromosome and specific genes, but it was also found to accumulate downstream from the transcription start site (TSS) of highly active genes [12,13]. The inconsistent observations regarding H4K20me1 may arise from various cross-talks of H4K20me1 with other epigenetic marks and the fact that H4K20me1 is an initial step in the process of generating the highly repressive mark H4K20me3.
Previously, we found that migration of mouse melanoma cells is associated with and dependent on global chromatin condensation that includes more than a two-fold increase in the levels of H3K9me3, H3K27me3, and H4K20me1 [14,15,16]. More recently, migration-associated global chromatin condensation was reported in primary and transformed T-cells [17], primary tenocytes [18], and mesenchymal stem cells [19]. Reliance of cell migration on chromatin condensation has been reported in various types of cells, including lung cancer cells [20], embryonic fibroblasts [21], breast adenocarcinoma cells [22,23,24], colorectal cancer cells [24], prostate cancer cells [25], glioma cells [26], chondrosarcoma cells [27], epidermal cancer stem cells [28], primary tenocytes [18], and primary and transformed T-cells [17]. Thus, the dependence of tumor cell migration on chromatin condensation is a ubiquitous mechanism. Still, the exact roles of heterochromatin formation in migrating cells are not fully understood.
Here, to gain a mechanistic insight on the roles of heterochromatin in migrating cells, we mapped the changes in heterochromatin spread and in the transcriptome in melanoma cells in response to migration signals by ChIP-seq and RNA-seq, respectively. Induction of migration was associated with a more diffuse distribution of H3K9me3, H3K27me3, and H4K20me1 that generated lower number of peaks, but had a higher overlapping between the different histone modifications. Following induction of migration, H3K9me3 and H4K20me1 accumulated to a higher degree in repetitive regions, while H3K27me3 redistributed towards genes. In parallel, we identified 182 genes with altered RNA levels, of which one third were dependent on migration-induced methylation of H3K27.
2. Materials and Methods
2.1. Cell Culture
Mouse melanoma B16-F1 cells were bought from the ATCC and grown in DMEM (D5796, Sigma-Aldrich, St. Louis, MO, USA) supplemented with 10% FCS (04-007-1A Biological Industries, Beit Haemek, Israel), 0.292 mg/ mL L-glutamine (03-020-1B, 1A Biological Industries, Beit Haemek, Israel), and 40 units/mL Penicillin-Streptomycin (03-031-1B, Biological Industries, Beit Haemek, Israel) at 37 °C, 7% CO2. For migration assays, the cells plated on fibronectin-coated plates were grown to confluence. To induce migration, the cells were scratched at multiple sites, washed once with DMEM, and incubated in a growth medium at 37 °C and 7% CO2 for 3 h. Control cells were kept in similar conditions without being scratched. To inhibit the generation of H3K27me3 or to inhibit RNA polymerase II, the cells were incubated in a growth medium supplemented with 3 µM GSK343 (SML0766, Sigma-Aldrich, Rehovot, Israel) or 0.1 mM DRB (D1916, Sigma-Aldrich, Rehovot, Israel). The inhibitors were added 3 h before lysing the cells.
2.2. ChIP-seq
Chromatin immunoprecipitation (ChIP) was performed as described previously [29] with the following modifications. Following cross linking with 1% PFA, cells were collected and aliquoted to 107 cells. Nuclei were isolated by lysis buffer and DNA was collected following fragmentation by 0.7 mU/μL of MNase (N3755, Sigma-Aldrich, Rehovot, Israel) at 37 °C for 15 min that was followed by a brief sonication in RIPA buffer. IP was done using magnetic protein A/G beads (BioVision, 6527-1, Milpitas, CA, USA) coupled to 24 µL of rabbit anti-H3K9me3 (Millipore, 07-442, Temecula, CA, USA), 12 µL of rabbit anti-H3K27me3 (Millipore, 07-449, Temecula, CA, USA), or 24 µL of rabbit anti-H4K20me1 (Millipore, 17-610, Temecula, CA, USA). DNA was purified using the QIAquick Gel Extraction kit (QIAGEN, 28704, Hilden, Germany) according to the manufacturer protocol and sequenced at the Technion Genome Center by an Illumina HiSeq 2500 machine.
2.3. RNA Purification and RNA-seq
Total RNA was purified by the NucleoZOL kit (MACHEREY-NAGEL, 740404.200, Duren, Germany) according to the manufacturer’s instructions. Purified RNA was sent for poly A containing mRNA selection, library preparation, and sequencing at the Technion Genome Center. Replicates number was five for untreated control and migrating cells and three for cells treated with GSK343 or DRB.
2.4. Peak Calling and Peak Analysis
Quality control checks of the raw sequence data were carried out using the FastQC tool (version 0.10.1) [30]. Then, the Trim_galore (version 0.4.1) [31] tool that is based on cutadapt [32] was used for adapters trimming and for removing of low quality bases from the ends of reads. The first four nucleotides, which were of bad quality, were trimmed from reads by a fastX trimmer (FATSX-Toolkit version 0.0.13) [33]. Cleaned, high-quality reads were aligned to the mouse genome (build mm10) using Bowtie2 [34] with the default parameters. PCR bias of duplicated reads were removed using the “MarkDuplicates” command implemented by the Picard tool (version 1.77) [35]. Broad peaks enriched in immunoprecipitation over input were identified by SICER [36] with “fragment size” of 350, “ effective genome fraction” of 0.8, and “ FDR” of 0.05. SICER-df was applied to determine differential peaks enriched in migrating cells compared to control cells and vice versa. Operations on genomic intervals were performed using BEDTools [37].
2.5. Calculation of ChIP-seq Coverage and Signal Distribution Across Specific Genomic Location
The genomic locations of Refseq genes and repetitive elements were downloaded from the UCSC table browser [38]. The enhancers’ locations were downloaded from HOMER [39] and the genomic coordinates were converted to mm10 assembly using the UCSC liftOver tool. Promoters were defined as 1000 bp upstream of transcription start sites (TSS). Within each list, overlapping intervals were merged into a single feature that spans all of the combined features. In order to avoid intervals overlapping more than a single defined annotated element, we removed from each list nucleotides that belong to another annotation list by assigning the following priority: Coding genes, noncoding genes, promoters, enhancers and repetitive elements. The coverage of the ChIP signal across these regions was presented as a percentage of reads mapping within genomic regions out of the total mapped reads without redundancy, or as a percentage of bp mapping within genomic regions out of the total number of bp included within differential peaks, and was calculated using coverageBed [37] and intersectBed [37], respectively. The distribution of ChIP signal across functional genomic regions was done using ngs.plot [40].
2.6. Correlation Analysis and Combinatorial Pattern of Heterochromatin Markers
The entire genome was divided into non-overlapping equally sized bins (10 kb), and the average ChIP score was calculated for each bin using the multiBamSummary command from deepTools [41]. Spearman correlation coefficients were computed using deepTool’s multiBamSummary and plotCorrelation commands. Hidden Markov model-based chromatin state definition was performed using the ChromHMM v1.14 [42]. Five states were used to segment the genome, and the enrichment of these states across different genomic features was calculated.
2.7. RNA-seq Analysis
Reads were aligned to the mouse genome (mm10) using TopHat [43] after removal of adapter sequences and critical examination of quality controls using Trim_galore [31] with the default parameters. The number of reads mapping to each mouse gene (as annotated in Ensembl release GRCm38.86) was counted using the ‘intersection-nonempty’ mode of HTseq-count script [44]. Differential expression analysis was performed using the edgeR [45] and Limma [46] packages from the Bioconductor framework [47]. Briefly, features with less than 1 read per million in 3 samples were removed. The remaining gene counts were normalized using the TMM method, followed by voom transformation [48]. Linear models were used to remove the batch effect and to find differentially expressed genes. Up- and down-regulated genes having FDR <0.05 and fold change ≥1.3 were analyzed for pathway enrichment using the Ingenuity Pathway Analysis [49] (IPA). H3K27me3 dependency was detected by comparing genes found to be differentially expressed between migrating and control cells to genes found to be differentially expressed between migrating cells treated with GSK343 to control cells. H3K27me3-dependent genes are genes whose expression changes abolished upon treatment with GSK343, while H3K27me3-independent genes are those whose change in expression was preserved even after treatment with GSK343.
2.8. Distribution of Heterochromatin Signals Across High and Low Abundant Genes
Average gene expression was calculated across five replicates of RNA-seq samples for control cells and migrating cells and genes with an average expression which was lower than 1 cpm (counts per million) reads were excluded. Genes were ranked based on their expression level, and the top and bottom 500 genes were chosen. The distribution of histone modifications signal across these genes was plotted using the ngs.plot tool [40].
3. Results
3.1. Migration-Induced Changes in the Genomic Distribution of H3K9me3, H3K27me3, and H4K20me1
Induction of migration leads to a global increase of 2–4-fold in the levels of the heterochromatin markers H3K9me3, H3K27me3, and H4K20me1, as we previously detected by immunostaining [14,15,16]. To learn about the mechanistic role of these histone modifications in the migration process, we mapped their relative distribution along the genome by ChIP-seq. Migration of the B16-F1 mouse melanoma cells was induced by the wound healing assay [50], in which multiple scratches were performed in each plate to generate large numbers of migrating cells. This way of induction of migration enabled us to receive an enriched population of migrating cells as measured by a 2–5-fold increase in the levels of H3K9me3 and H3K27me3 at the promoters of E-cadherin, Gapdh, and Line (Figure S1).
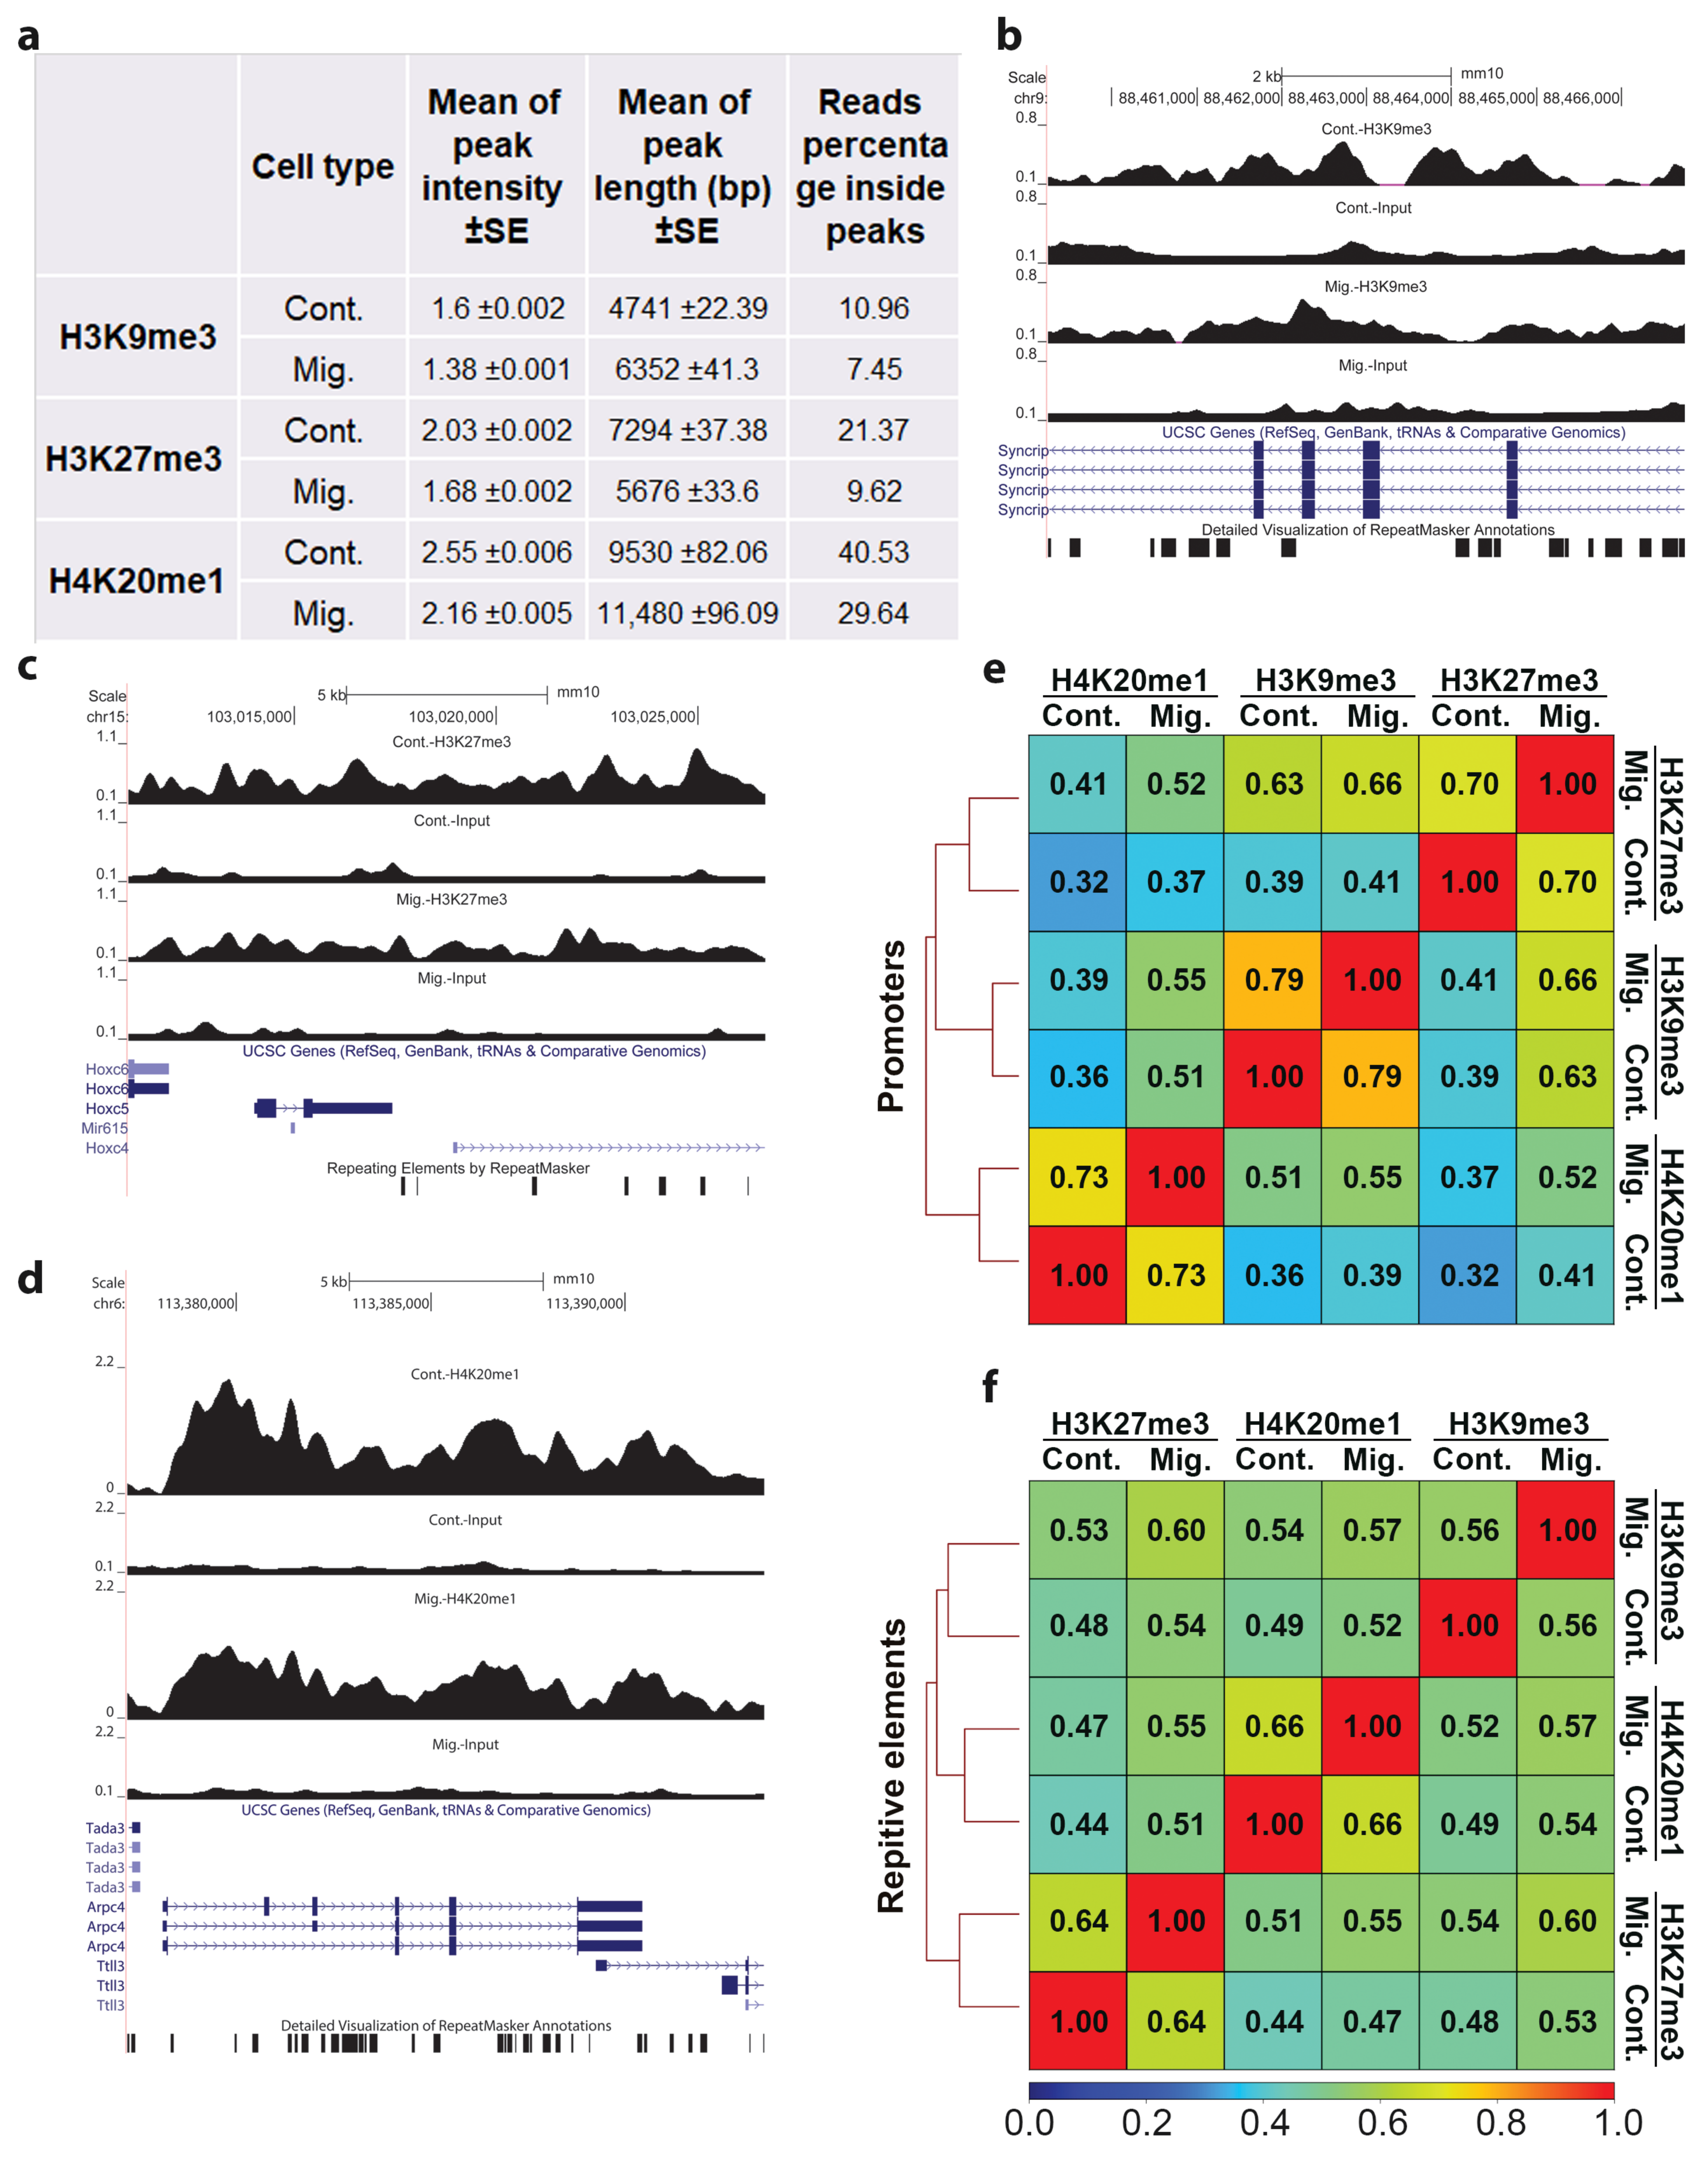
H3K9me3, H3K27me3, and H4K20me1 ChIP-seq-mapped reads were at the range of 27–42 million and the coverage values at the range of 0.68–1.52 (Figure S2a). As expected from the nature of heterochromatin modifications, more than 50% of the signals of these modifications did not accumulate at defined and short loci to form sharp peaks (Figure 1a). Moreover, following indication of migration, this phenomenon further increased, resulting in the accumulation of only 7.45%, 9.62%, and 29.64% of the reads of H3K9me3, H3K27me3, and H4K20me1, respectively, inside peaks (Figure 1a). In agreement, upon induction of migration, the intensities of the peaks were reduced by 14–17% (Figure 1a–d), and the number of identified peaks was reduced by 30–40%, while the number of differential peaks was reduced by more than 90% (Figure S2b). Significantly, upon induction of migration, the average peak length of H3K9me3 and H4K20me1 was increased by 34% and 20%, respectively, while the average peak length of H3K27me3 was reduced by 20% (Figure 1a–d). Taken together, the above analyses indicate more diffused signals of H3K9me3, H3K27me3, and H4K20me1 upon induction of migration. This pattern suggests a possible increase in the degree of overlap between the three modifications following induction of migration. Indeed, in migrating cells, the correlation between these modifications increased significantly over any evaluated genomic element (promoters, repetitive elements, enhancers, and gene bodies) (Figure 1e,f and Figure S3).
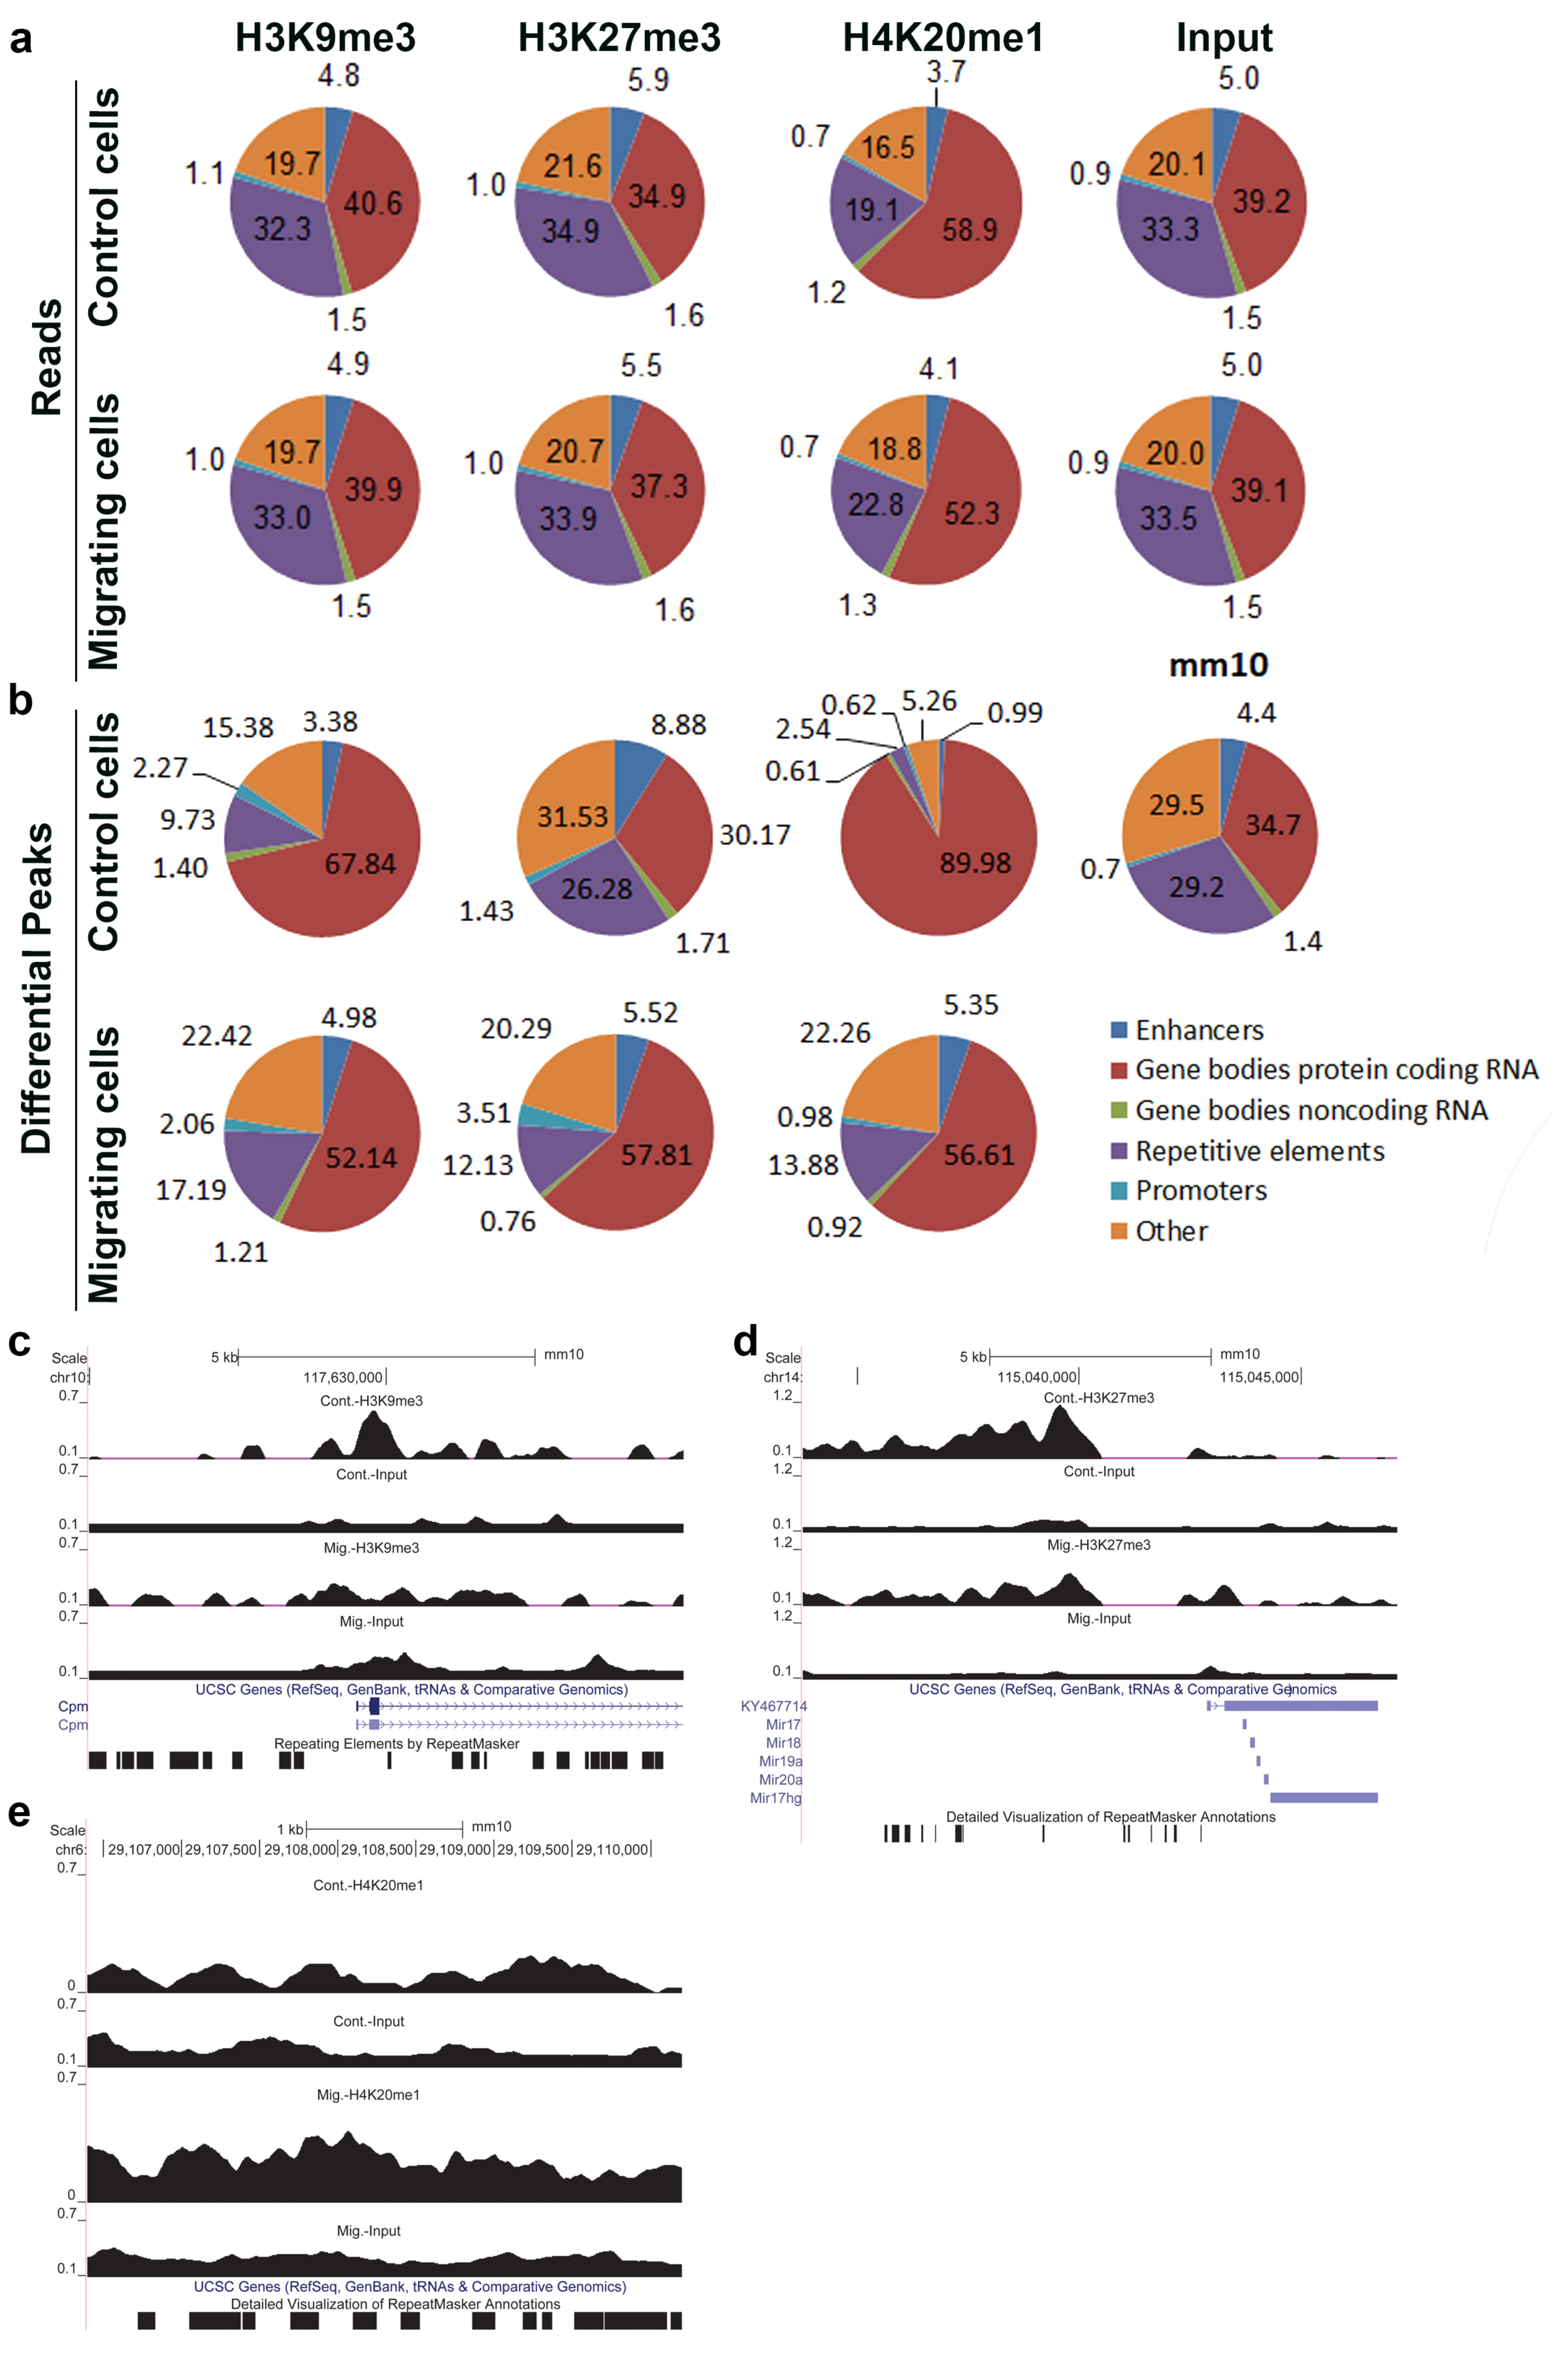
To assess which genomic regions are more prone to being affected in migrating cells by each of the above modifications, we counted the number of mapped reads overlapping specific genomic regions and calculated them as the percentage of the total mapped reads (Figure 2a). We also calculated the relative distribution of differential peaks that fall inside different genomic elements (Figure 2b).
This analysis revealed a migration-induced increase in the relative distribution of nucleotides in differential peaks of H3K9me3 and H4K20me1 at repetitive elements by 83% and 446%, respectively, and a migration-induced decrease of these modifications at protein-coding genes by 23% and 37%, respectively. On contrary, upon induction of migration, the relative distribution of nucleotides in differential peaks of H3K27me3 increased by 92% at protein-coding genes, while it decreased by 54% at repetitive elements (Figure 2b). A similar trend was seen in the relative distribution of the total reads of these modifications, as well (Figure 2a,c–e).
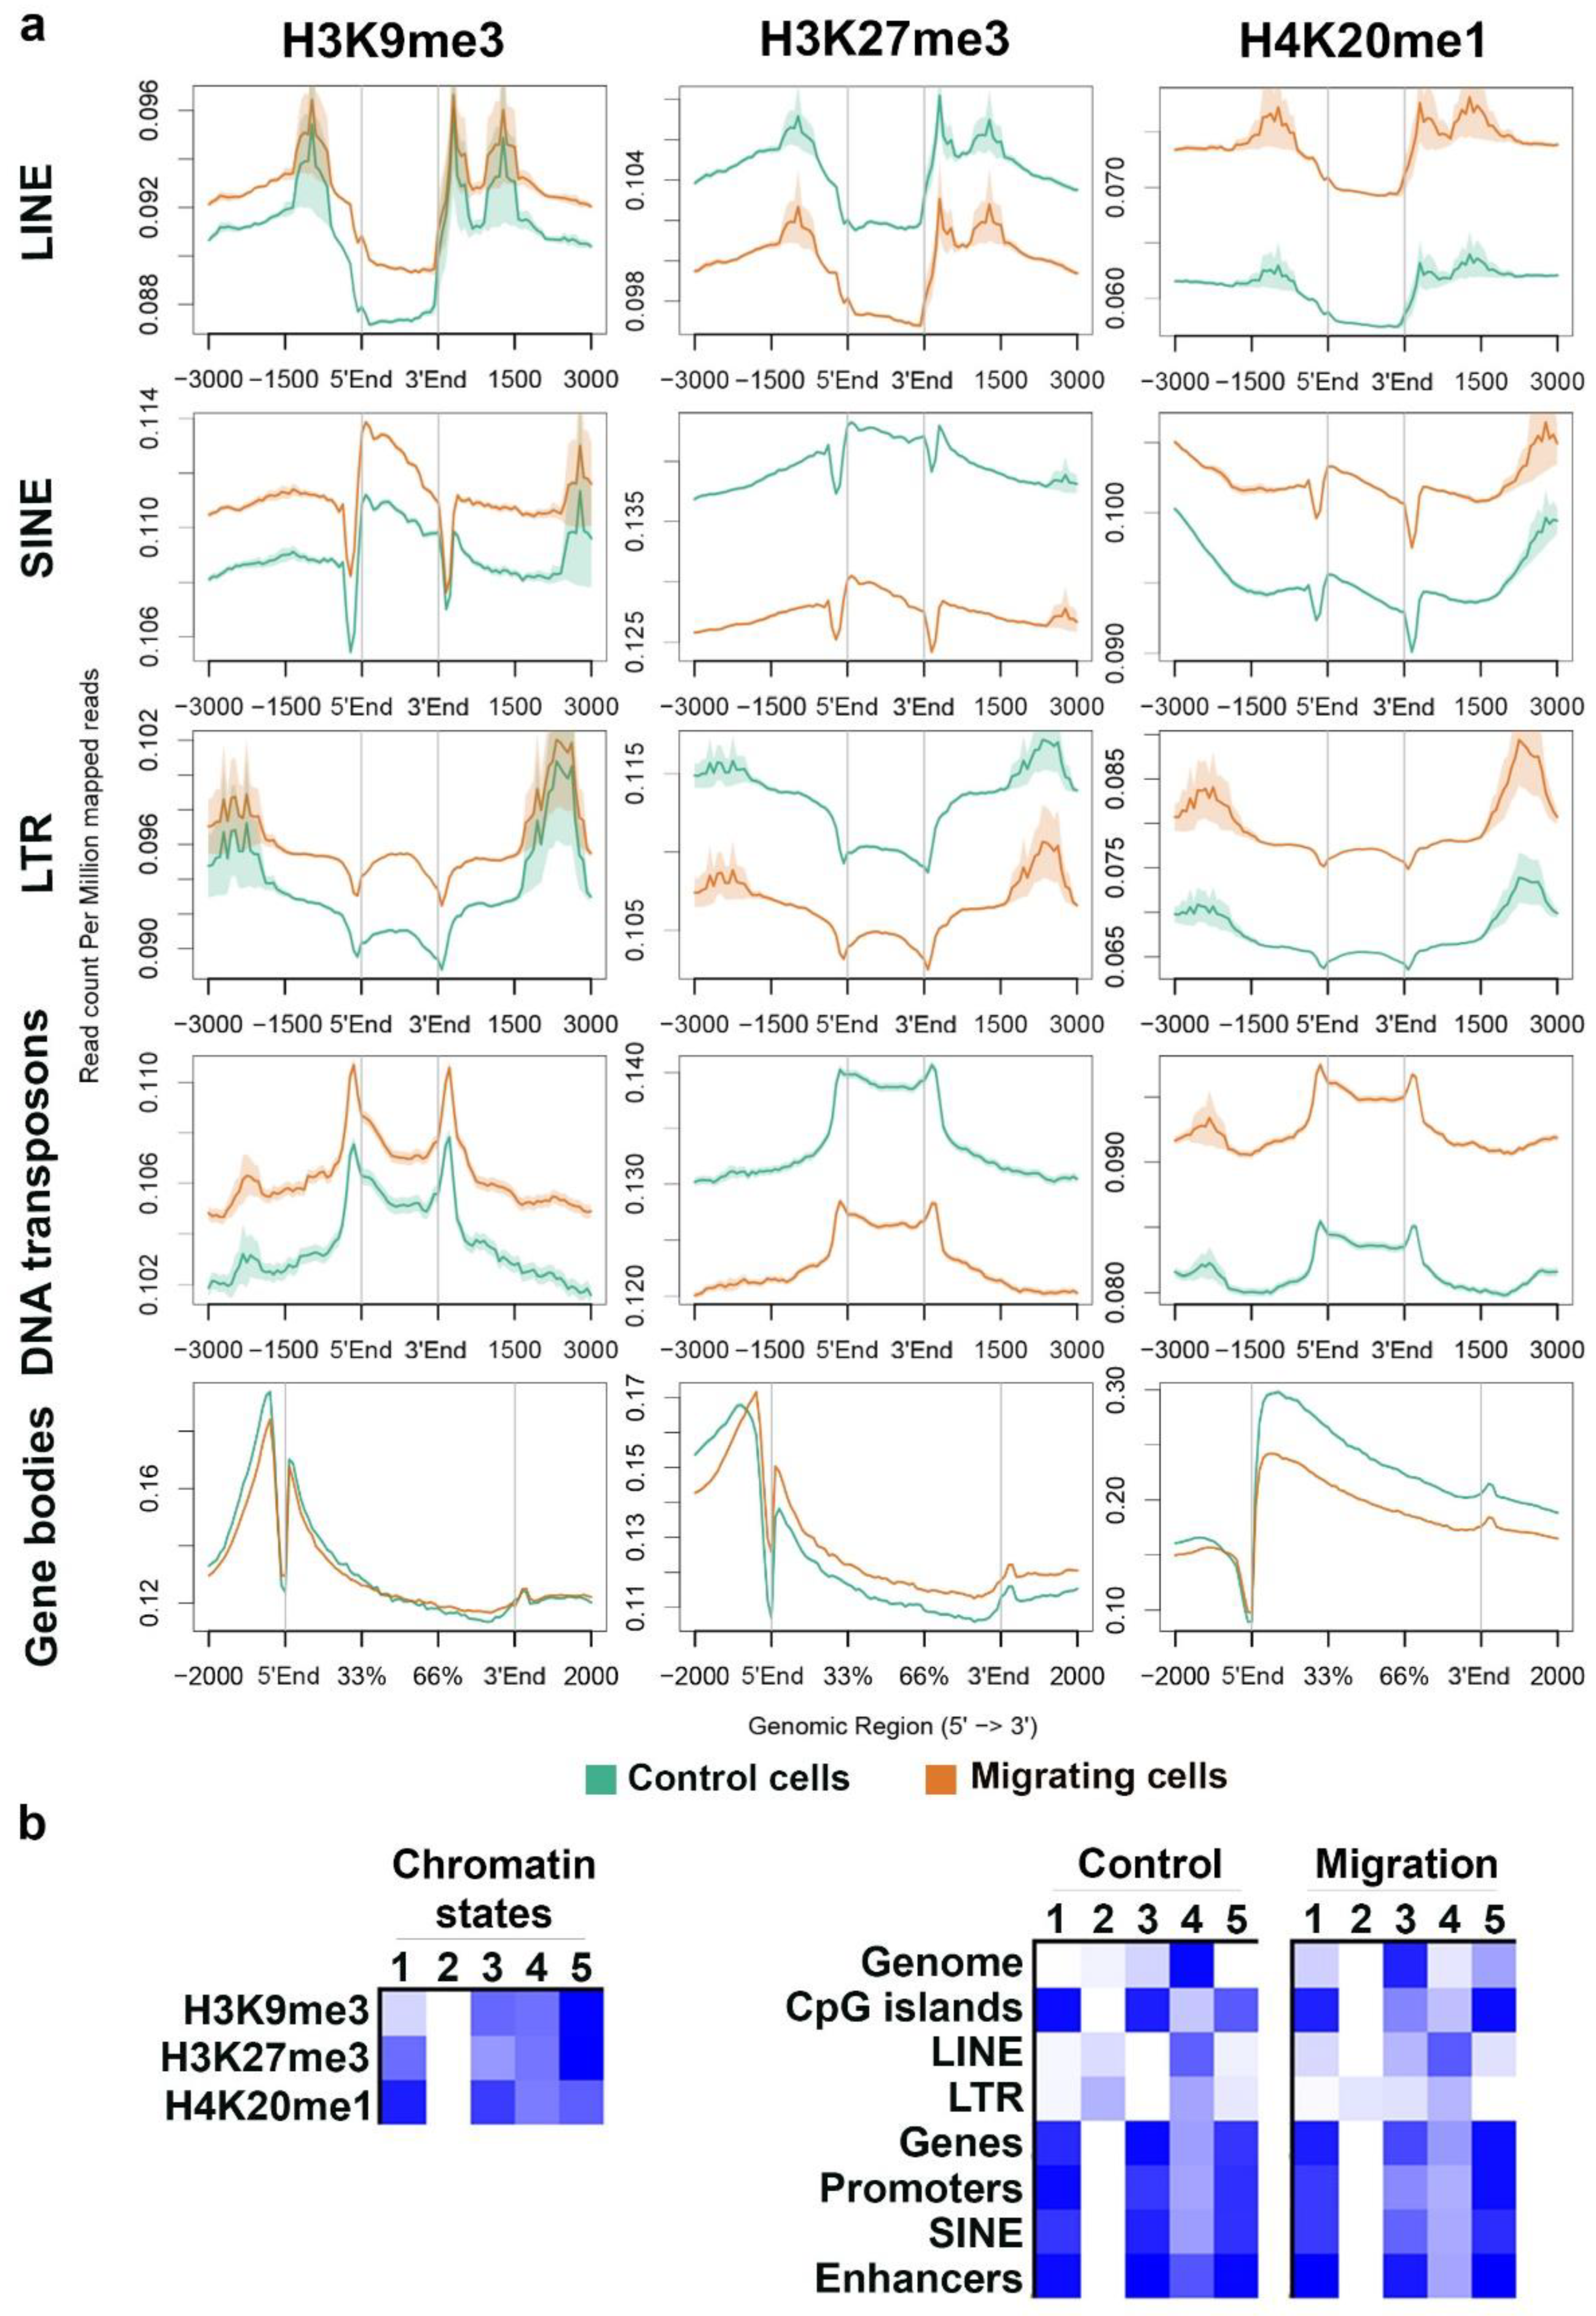
To verify these results, we analyzed the average signal distribution of these modifications across different types of repetitive elements and across protein-coding genes. In agreement with the previous analysis, the signals of H3K9me3 and H4K20me1 were higher across LINE, SINE, LTR, and DNA transposons in migrating cells than in control cells, while the signal of H3K27me3 was lower across the same repetitive elements in migrating cells than in control cells. An opposite pattern emerged over protein-coding genes: Reduced levels of H4K20me1 together with increasing levels of H3K27me3 in migrating cells than in control cells (Figure 3a).
Classifying the combinatorial pattern of the above modifications using a hidden-Markov-model (HMM) based approach revealed that upon migration, there is a reduction in the genomic coverage by regions with similar levels of the three markers (state no. 4, Figure 3b), while there is an increase in the percentage of genomic regions that are decorated by all three markers, but at differential levels (states no. 1, 3, and 5, Figure 3b). Interestingly, regions free of all three markers occur in repetitive elements (LINE and LTR), but their percentage decreases upon induction of migration (state no. 2, Figure 3b).
Importantly, upon induction of migration, the changes in the combinations of the modifications across promoters and gene bodies were much smaller than the changes over the whole genome, thus raising the question if there are any transcriptional changes in migrating cells.
3.2. Migration-Induced Transcriptome Changes
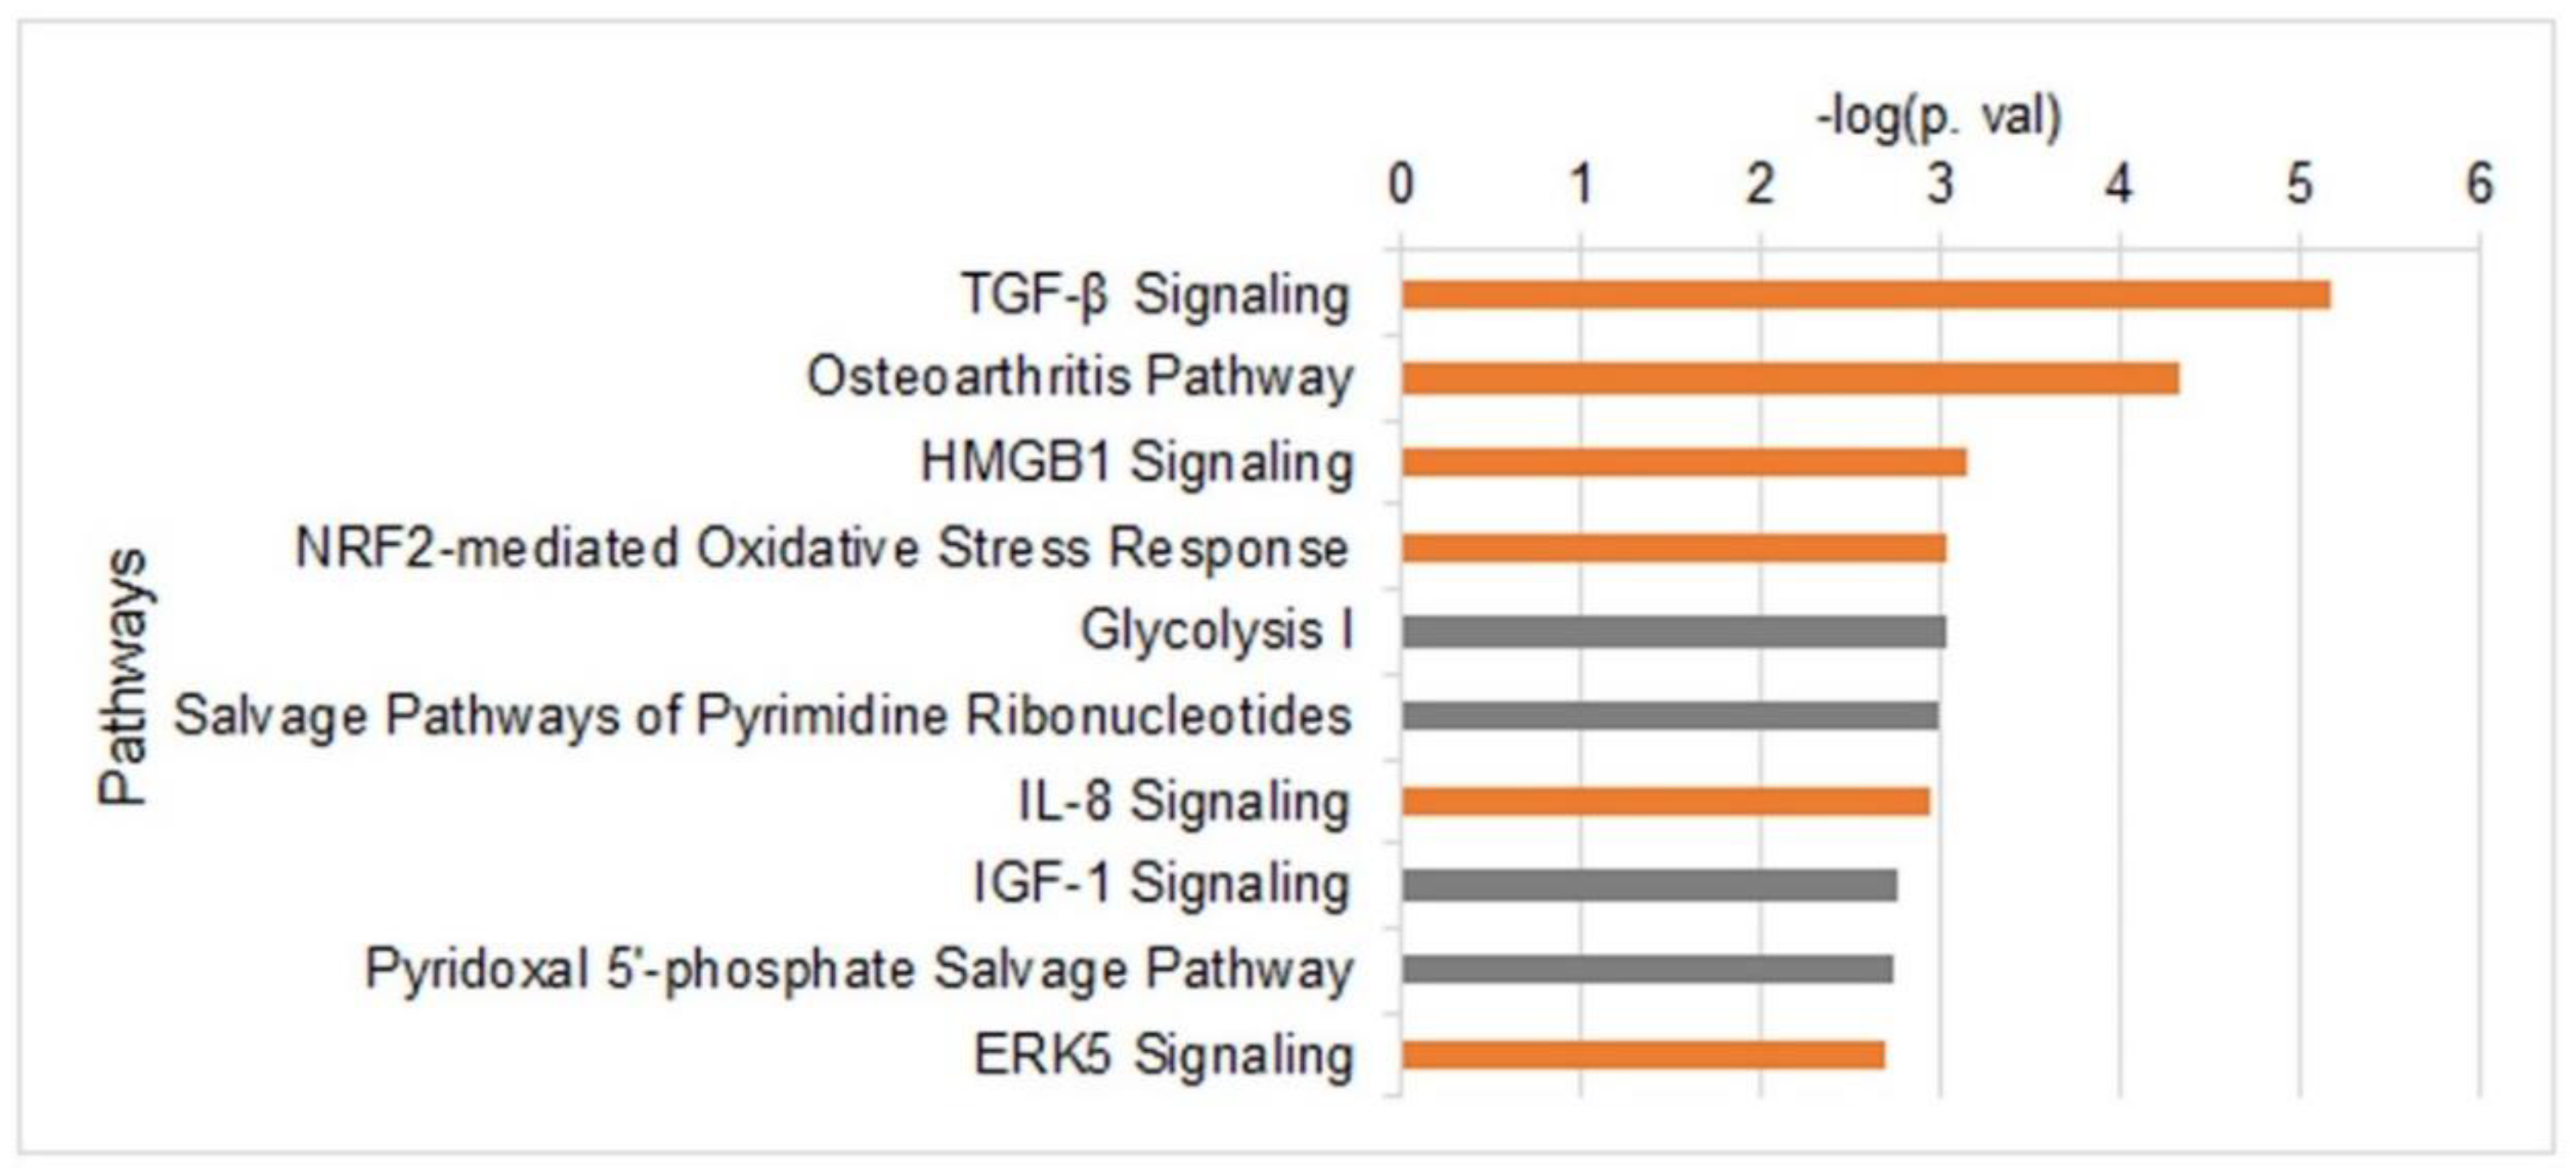
To determine the changes in the transcriptome upon induction of migration, we carried out an RNA-seq analysis (Figure S4). Differential expression analyses identified 801 genes with altered expression levels (FDR < 0.05) in cells that were induced to migrate for 3 h; 465 genes were up-regulated and 336 genes were down-regulated. Out of them, 182 genes were altered with a fold change of >1.3; 129 up-regulated genes and 53 down-regulated genes (Table S1 and Figure S5). Surprisingly, although induction of migration induces a global increase in chromatin condensation, a higher number of genes were up-regulated than down-regulated. To search for common functions of the altered genes, genes found to be differentially expressed with FDR >0.05 and fold change >1.3 were subjected to Ingenuity Pathway Analysis (IPA). As shown in Figure 4, the most significantly enriched pathways included ones that are known to be associated with tumor cell proliferation and migration, such as the TGF-β, IGF-1 and ERK5 signaling pathways [51,52,53,54,55], and pathways involved in energy generation: Glycolysis and pyridoxal 5′-phosphate (PLP) salvage pathways. PLP is an active form of vitamin B6, which is important for the metabolism of carbohydrates, amino acids, and fats, the generation of the methyl donor S-adenosylmethionine (SAM), and in neutralizing oxidative stress [56,57]. Activation of oxidative stress response was also indicated by the up-regulation of NRF2 targets (Figure 4). Analysis of upstream regulators and downstream-affected functions identified a strong link to cell migration (Figure S6).
To evaluate the correlations between H3K9me3, H3K27me3, and H4K20me1 and transcription in our system, we assessed the spread of each modification over the genes that are found in peak areas of the same modification. H3K9me3 enrichment was not found at unexpressed genes, which may be repressed by DNA methylation. In expressed genes, H3K9me3 enrichment along gene bodies correlated with higher gene expression levels, while H3K9me3 enrichment at promoters correlated with lower gene expression levels (Figure S7: Cluster no. 1 versus cluster no. 3, respectively). A similar pattern was found for H4K20me1: High enrichment levels of H4K20me1 along gene bodies correlated with high gene expression levels, whereas high enrichment levels of H4K20me1 at promoters or its moderate enrichment over gene bodies associated with low gene expression levels (Figure S8). Significantly, the correlation of H3K27me3 enrichment with low gene expression was the most pronounced out of the three evaluated modifications (Figure S9).
3.3. H3K27me-Dependent Transcriptome Changes upon Induction of Migration
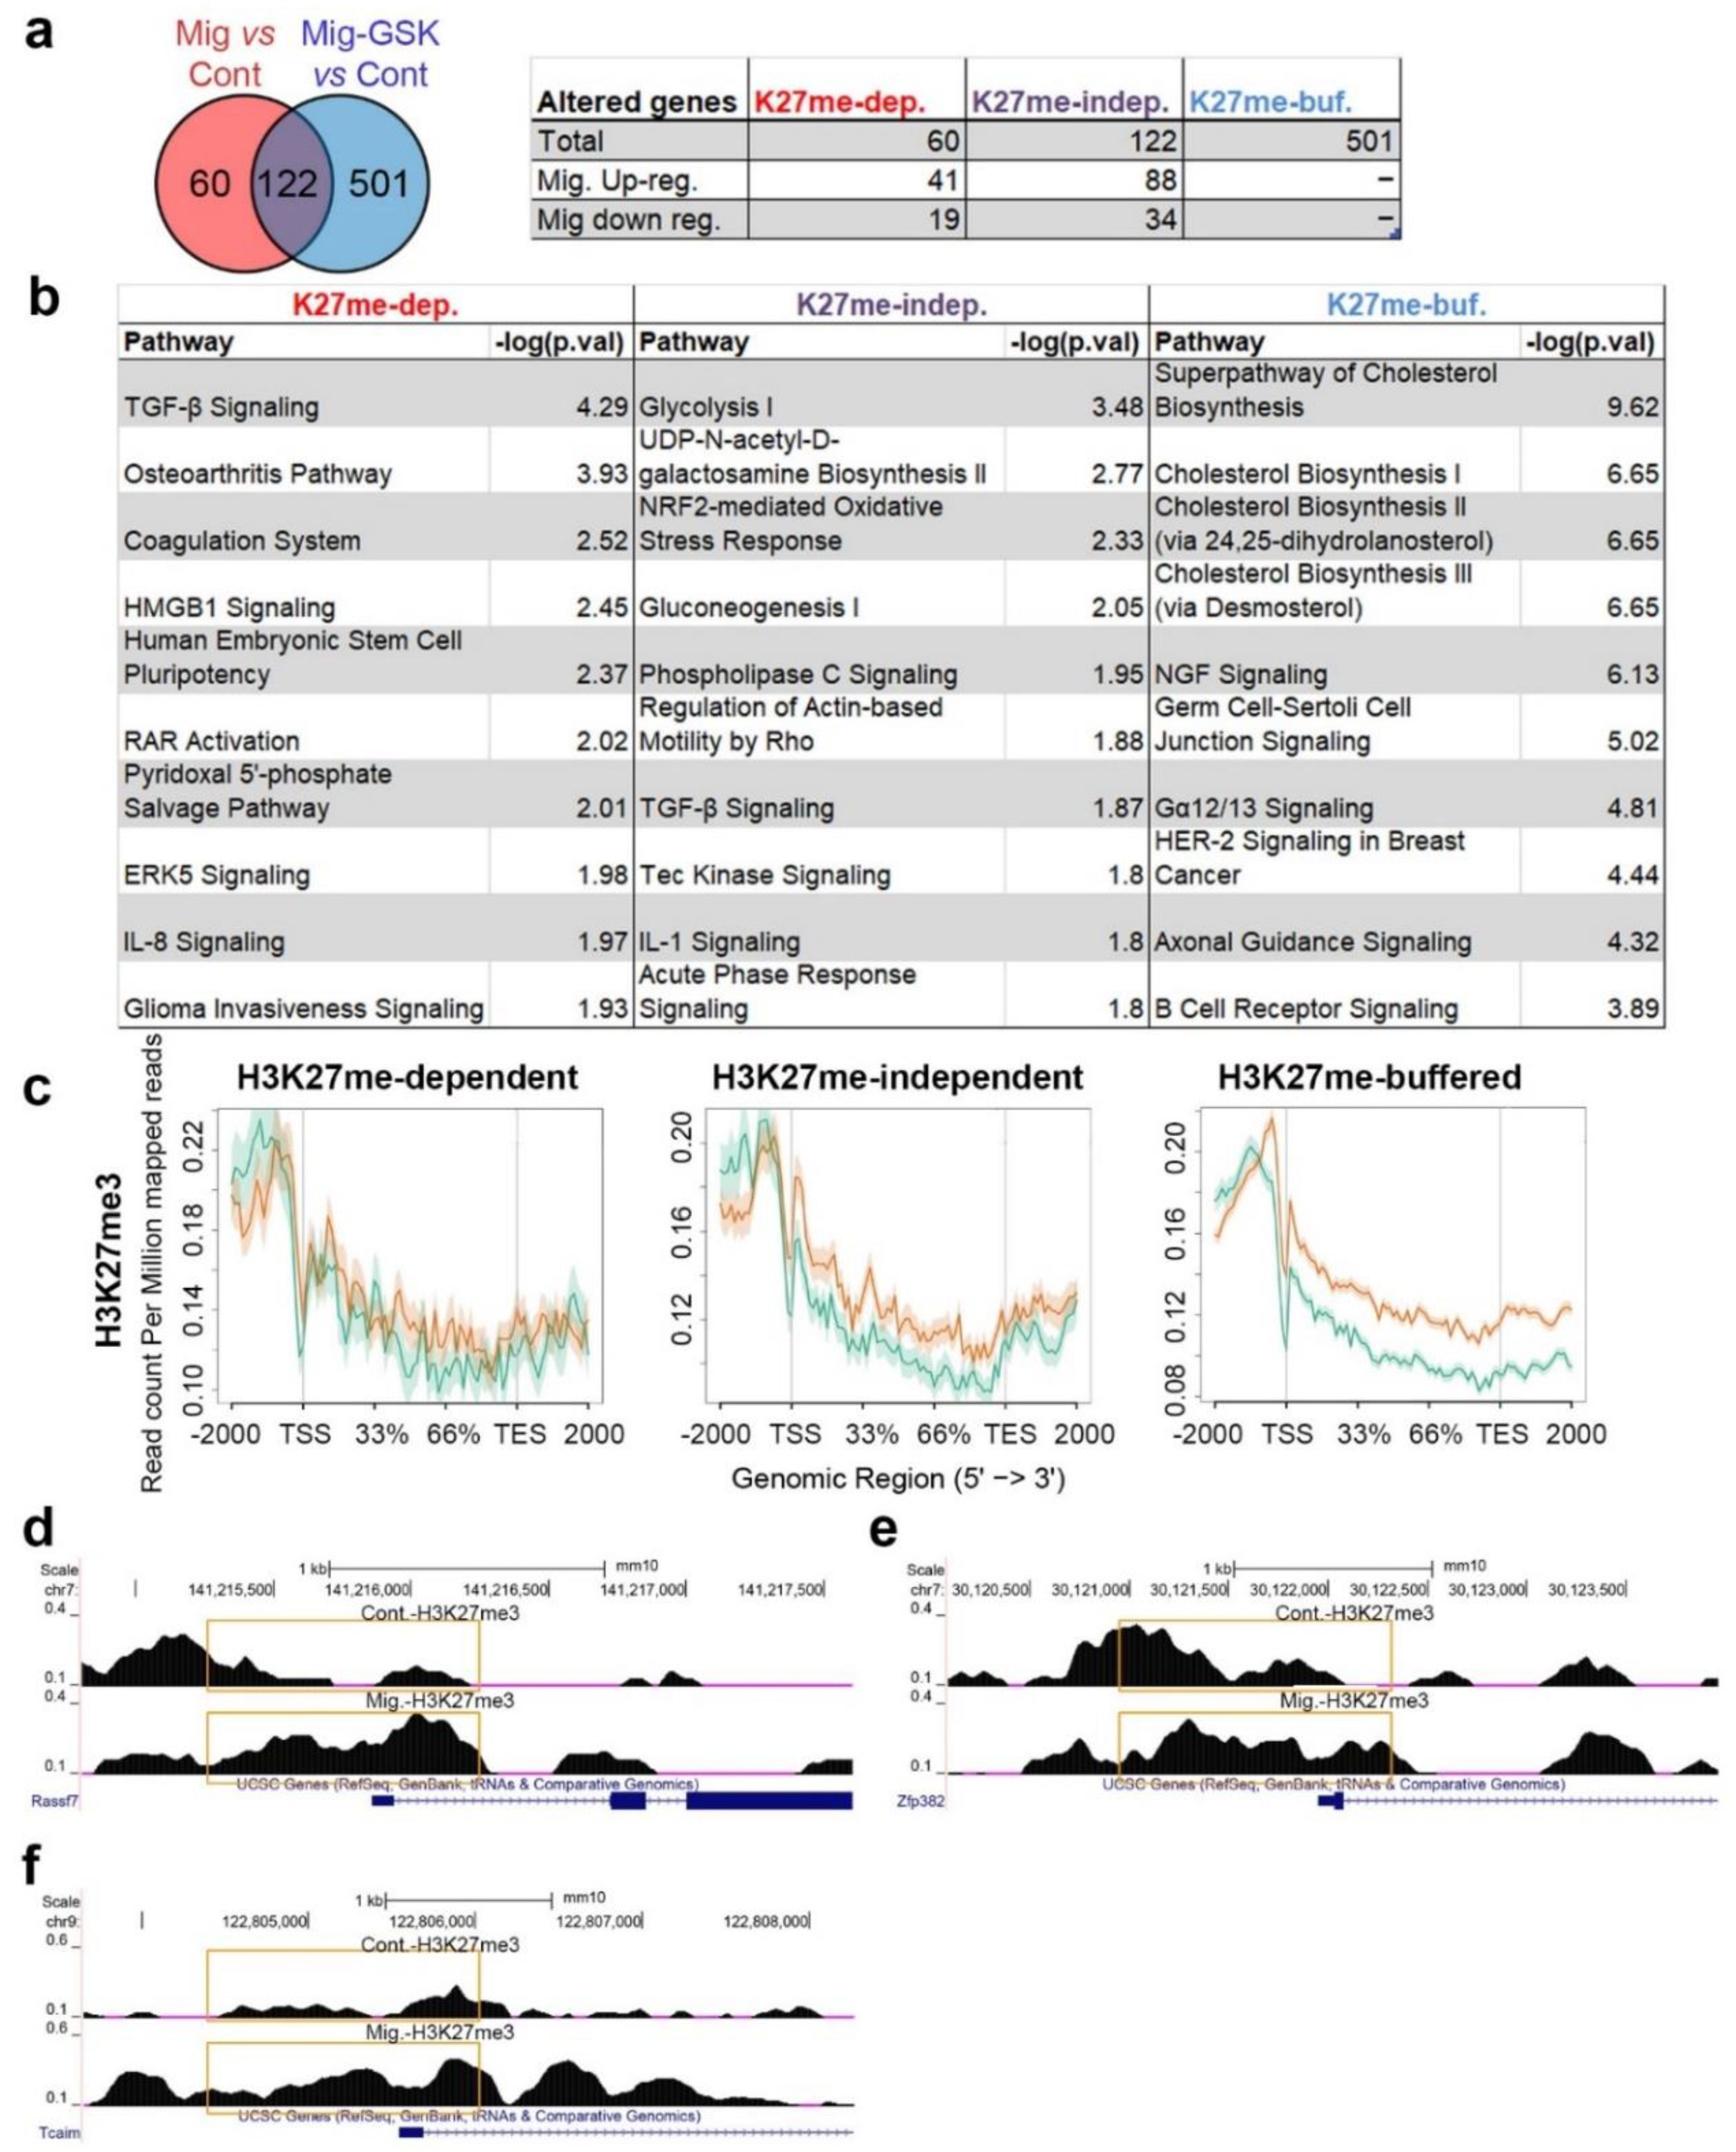
Out of the three analyzed histone modifications, only H3K27me3 displayed increased levels over genes upon induction of migration (Figure 3). Therefore, we analyzed which migration-associated transcriptome changes are dependent on H3K27me3 by RNA-seq of migrating cells that were treated with the Ezh2-specific inhibitor, GSK343, at a concentration that we previously found to inhibit migration [16]. This analysis revealed that 33% of the migration-altered genes were not changed once GSK343 was added, indicating they are H3K27me3-dependent genes. The 67% of the migration-altered genes that were changed also in migrating cells treated with GSK343 were termed H3K27me-independent genes (Figure 5a, Table S2, Figures S4 and S10). Significantly, most of the signaling pathways altered in migrating cells, such as TGF-β and ERK5, were H3K27me-dependent, while the most significant H3K27me independent-pathways were glycolysis and NRF2-mediated response (Figure 5b). In addition, 501 genes that normally do not change upon induction of migration did change once H3K27 methylation was inhibited (Figure 5, Table S2, Figure S10). These genes (termed H3K27me-buffered genes) are mainly involved in cholesterol metabolism. Thus, H3K27 methylation in migrating cells is important not only for establishing a new transcriptional plan, but also to limit the transcriptional changes to specific genes. Analyzing the levels of H3K27me3 at the promoters of H3K27me-buffered genes revealed a clear increase in H3K27me3 levels upon induction of migration that was not found in the H3K27me-indepednent genes (Figure 5c). A similar analysis of the H3K27me-dependent genes did not find significant changes between control and migrating cells, probably due to the low number of genes in this group.
Still, examination of single H3K27me-dependent down-regulated genes identified increased H3K27me3 levels around the TSS in most of them, including Rassf7, Zfp382, and Tcaim (Figure 5d–f). Significantly, these genes can affect the expression of additional genes since they are involved in signaling (Rassf7 and Tcaim) or in transcriptional control (Zfp382).
3.4. H3K27me-Dependent Genes Are Less Prone to RNA Stability Control
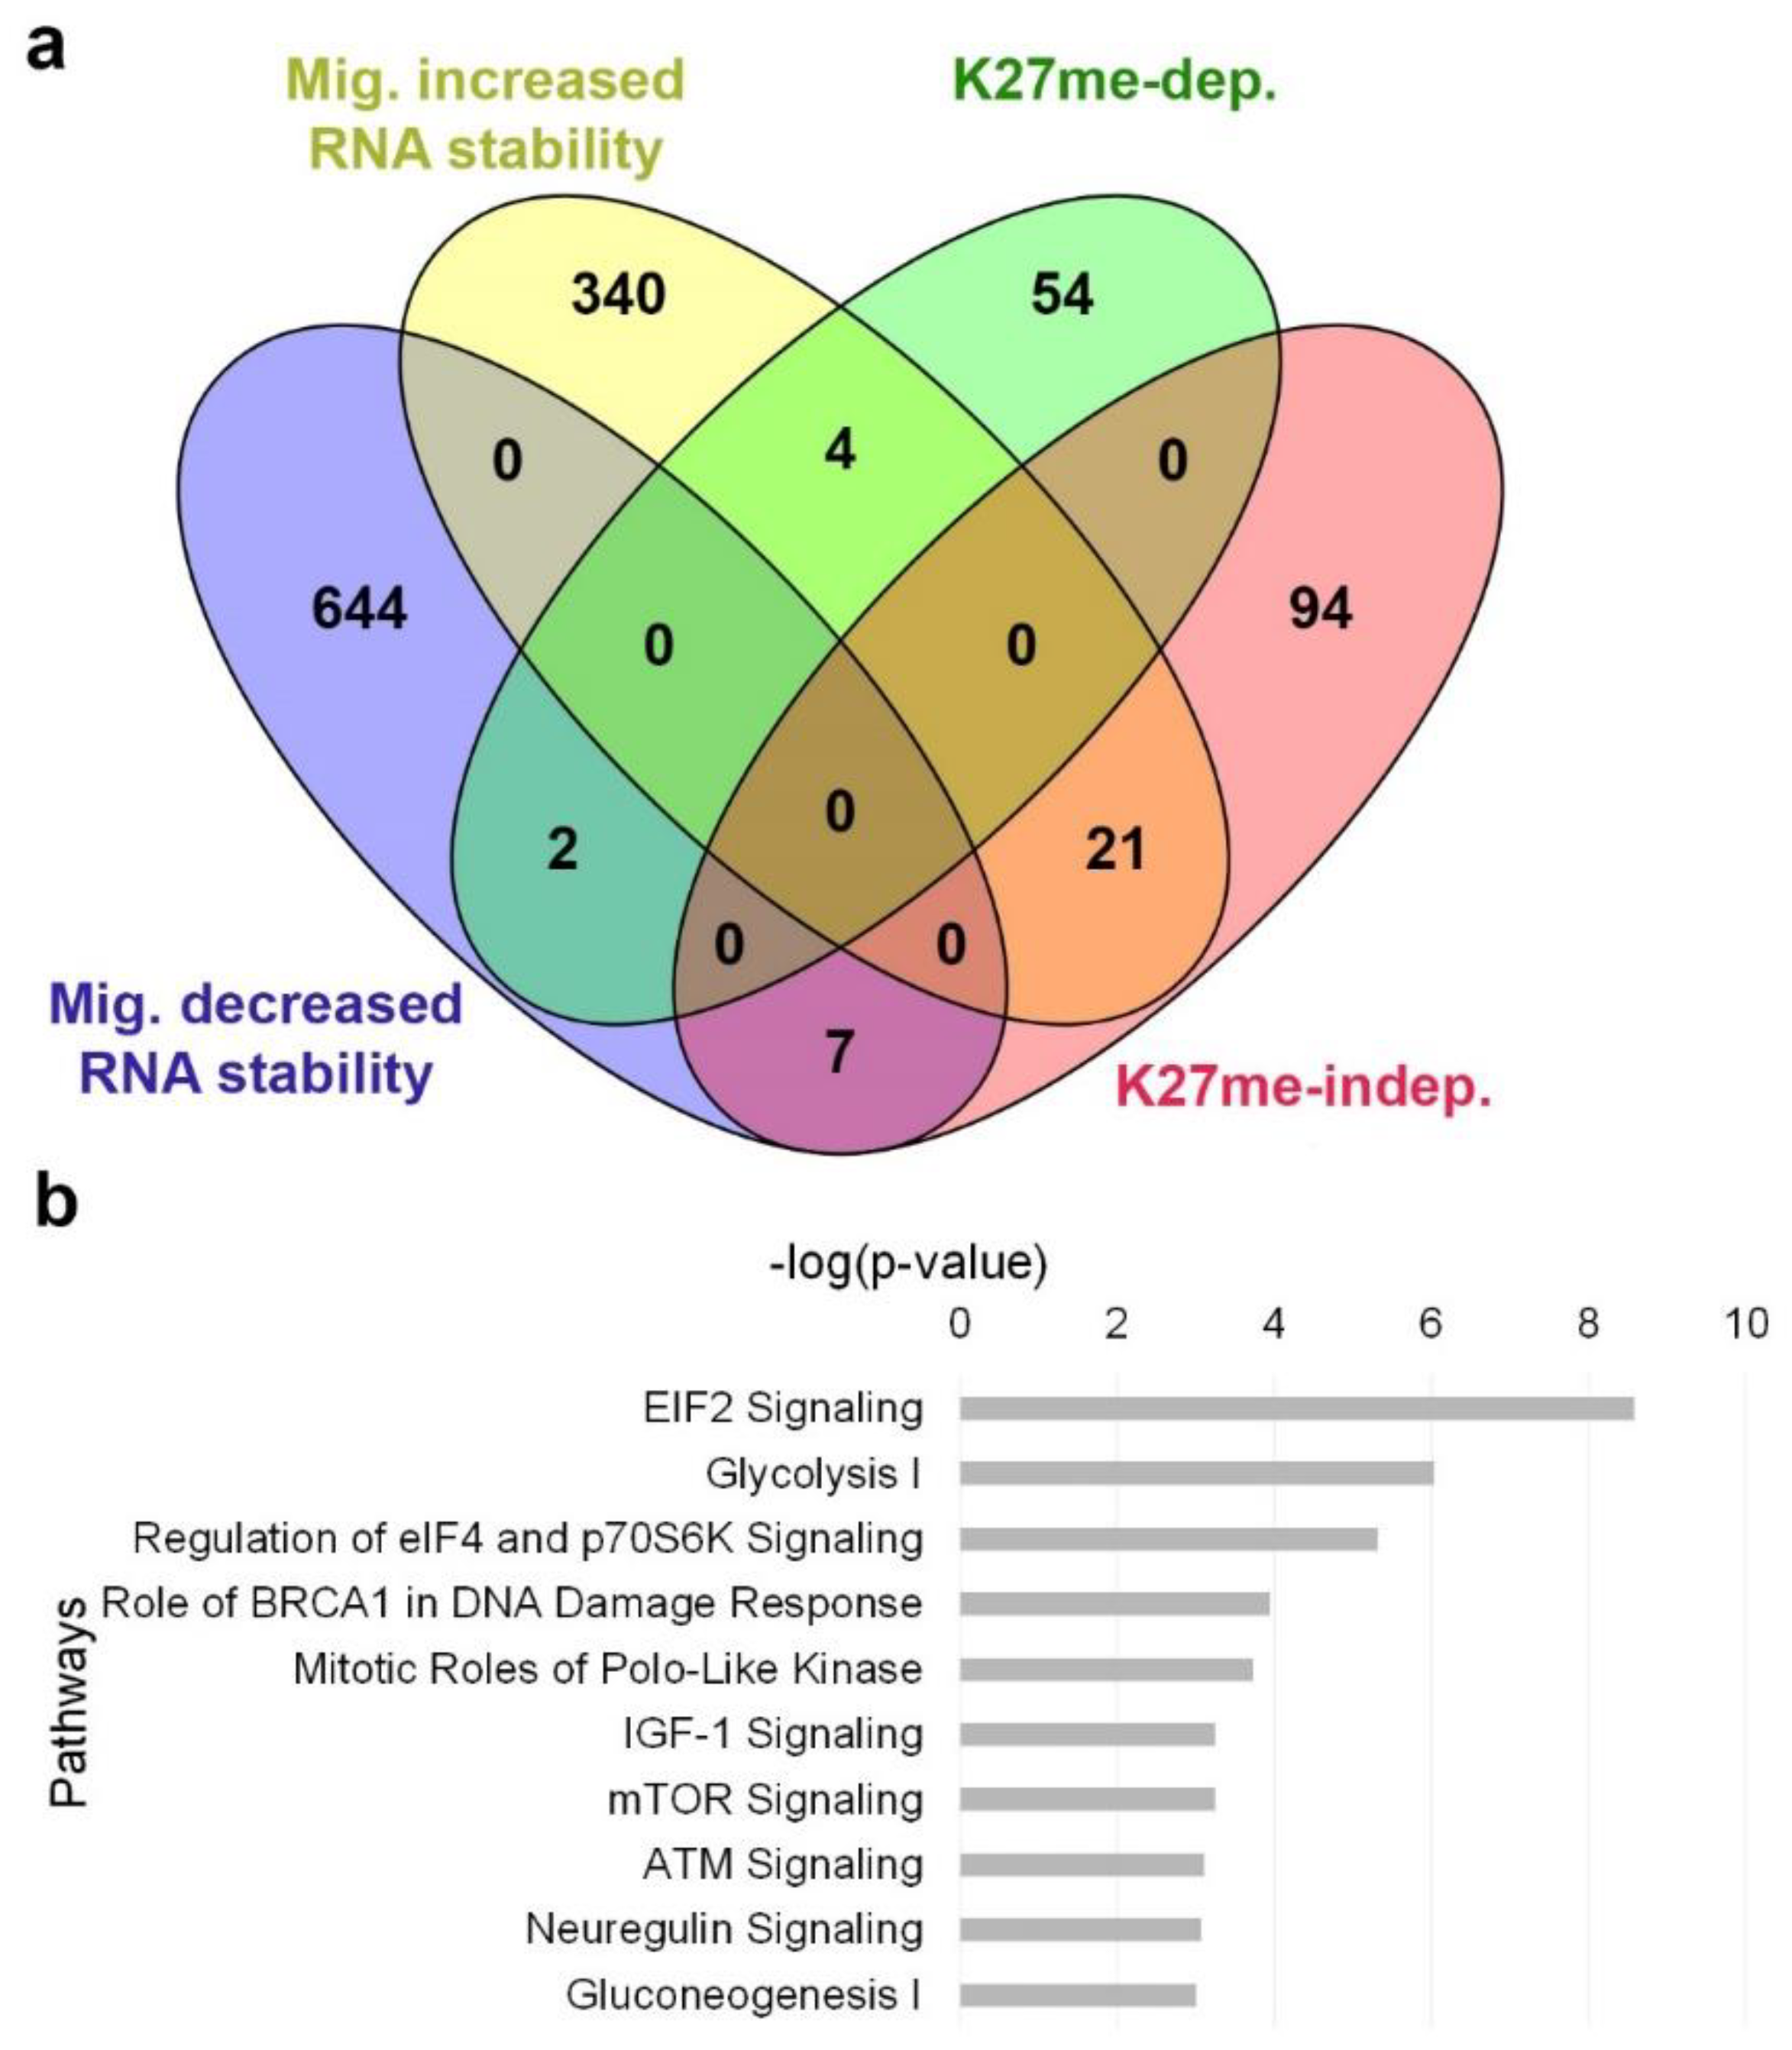
Finding that 67% of the migration-altered transcripts are independent of H3K27 methylation means that additional mechanisms are involved in their regulation. To learn if alterations in their RNA stability levels are involved, we determined the transcriptome of control and migrating cells following 3 h of RNA polymerase II inhibition by DRB. Calculation of the ratio between the mRNA levels in DRB-treated migrating cells and DRB-treated control cells identified 653 down-regulated genes and 365 up-regulated genes having decreased and increased RNA stability upon induction of migration, respectively (Figure 6a, Table S3, Figures S4 and S11). Notably, whereas only 10% of the H3K27me-dependent genes had migration-dependent changes in their RNA stability levels, 23% of the H3K27me-independent genes had migration-dependent changes in their RNA stability levels. IPA analysis revealed that genes with increased RNA stability in migrating cells are mainly involved in translational control and energy production, while genes with decreased RNA stability in migrating cells are mainly involved in cell cycle control and DNA damage response (Figure 6b), suggesting that regulation at the levels of RNA stability and translation rate may be highly important for cell migration.
4. Discussion
In this study, we found that upon induction of migration, the increase in heterochromatin markers does not occur in narrow regions to generate peaks, but rather spreads over larger genomic regions. Migration signals alter the RNA levels of 182 genes that are involved in signaling pathways, such as TGF-β and ERK5, but also in glucose metabolism and oxidative stress response. One third of the transcriptome alterations is dependent on methylation of H3K27, while altered genes in an H3K27me-indepednent manner are more prone to regulation at their RNA stability level.
ChIP-seq protocols depend on the assumption that the overall yields of DNA are identical per cell under different conditions. Accordingly, the same amounts of total DNA are taken for analysis and the resulting data are normalized to each other, so that the total amounts of signals are identical. Since induction of migration is associated with a dramatic increase in the amount of heterochromatin, ChIP doesn’t yield the same amount of DNA in control and migrating cells. Hence, the DNA normalization done during library preparation reduces the quantitative difference between the two conditions, which explains the lack of global increase in heterochromatin markers upon induction of migration in our ChIP-seq experiments. Therefore, our analysis has been mainly focused on the changes in signal distribution across genomic features upon induction of migration.
Induction of migration led to a more diffuse distribution of H3K9me3, H3K27me3, and H4K20me1 along the genome as measured by the reduced number of ChIP-seq peaks and ChIP-seq signals within peaks (Figure 1 and Figure S2). In agreement with this pattern, the overlapping between the different markers increased dramatically (Figure 1). These changes were accompanied by a shift in the distribution of these markers between the various genomic elements: H3K9me3 and H4K20me1 signals shifted from protein-coding regions to repetitive elements, while the H3K27me3 signal shifted in the opposite direction (Figure 2). These patterns suggest that although the overall signals of each of these markers is increased by 2–4-fold, as previously measured by immunostaining [14,15,16], the effects on transcription may be moderate, since the signals do not accumulate at narrow regions. Indeed, transcriptome analysis revealed that upon induction of migration, only 182 genes were altered with a fold change of >1.3, while only 30% of them were down-regulated.
Reports on the transcriptome of migrating cells are quite scarce [58,59,60]. In previous reports, the transcriptome was evaluated by microarrays that had a limited genomic coverage. Analyzing our RNA-seq data by IPA identified the activation of TGF-β IL-8 and ERK5 signaling pathways that were found to be activated in previous transcriptome analyses of migrating cells [58,59,60] (Figure 4). These pathways are well-established regulators of cancer cell migration and invasion [51,52,53,54,55]. In addition, we found an increase in three glycolytic enzymes (Glucose-6-Phosphate Isomerase, Phosphofructokinase, and Aldolase C) that can increase energy production in migrating cells. The increase in oxidative stress response genes may be required due to the increase in ATP production.
Analyzing the association of H3K9me3, H3K27me3, and H4K20me1 with gene expression levels revealed a positive correlation between high H4K20me1 levels downstream the TSS and gene expression levels, and negative correlation between H4K20me1 accumulation upstream the TSS and gene expression levels (Figure S8). Thus, H4K20me1 may support transcription when localized downstream the TSS, whereas it may be involved in transcriptional repression when localized upstream of the TSS or at low levels over the gene body. We also found a positive association between H3K9me3 enrichment along gene bodies and high expression levels (Figure S7), as found before [61,62].
Using an Ezh2 specific inhibitor, we were able to find that methylation of H3K27 is required for the transcriptional regulation of 33% of the migration-altered genes, as well as to prevent changes in 501 additional genes upon induction of migration (Figure 5). Migration signals lead to the activation of several transcriptional regulators, such as SMAD4 and SP1 (Figure S6) that have the potential to affect the transcription of several hundreds of genes. We hypothesize that the changes in the transcription of many of these genes are not required or may even interfere with the migration process, and H3K27me3 serves to prevent the binding or the activity of transcription factors at these genes. H3K27 methylation is mainly known for its negative effect on transcription; however, the group of H3K27me-depedent genes includes 41 up-regulated genes and 19 down-regulated genes. We hypothesize that only a fraction of these genes is affected directly by H3K27 methylation and this fraction of genes regulates the expression of many additional genes. In support of this hypothesis, we identified increased H3K27me3 levels at the promoter of many of the H3K27me-depedent migration-repressed genes, such as Rassf7, Zfp382, and Tciam (Figure 5d–f). Interestingly, Rassf7 was shown to inhibit the MKK7/JNK signaling pathway [63], Zfp382 was shown to inhibit the transcription of various tumor and migration promoting genes [64,65], and Tciam was found to inhibit LPS signaling and NF-κB activity [66].
In analyzing the importance of transcription for cell migration, we previously found that active transcription is dispensable for migration during a time period of 3 h, whereas it is important for migration during a longer period of time (11 h) [14]. Thus, the changes we identified here are the initial changes that will have an accumulative effect as the migration time increases. The spread of the heterochromatin markers upon induction of migration may indicate additional roles for these markers during cell migration such as increasing nuclear rigidity [5,18,67,68]. Overall, our results support a model in which migration-induced chromatin condensation serves to alter both the transcription plan as well as the physical properties of the nucleus.
Supplementary Materials
Supplementary figures, tables, scripts and methods are available online at https://0-www-mdpi-com.brum.beds.ac.uk/2073-4409/7/11/205/s1.
Author Contributions
T.S., M.S.-D., and G.G. planned the experiments, analyzed the data, and wrote the manuscript. T.S. and G.G. performed the experiments.
Acknowledgments
We thank the Technion Genome Service and the Israel National Center for Personalized Medicine for their NGS services. This work was supported by the Israel Cancer Research Fund (14-109-RCDA to G.G.), the Israel Cancer Association (20150910 to G.G.), and Ariel Center for Applied Cancer Research (to M.S.D. and G.G.).
Conflicts of Interest
The authors declare no conflict of interest. The sponsors had no role in the design, execution, interpretation, or writing of the study.
Data Availability
The raw data files of sequencing experiments have been deposited in the sequence read archive, accession number PRJNA437732.
References
- Hanahan, D.; Weinberg, R.A. Hallmarks of Cancer: The Next Generation. Cell 2011, 144, 646–674. [Google Scholar] [CrossRef] [PubMed] [Green Version]
- Etienne-Manneville, S. Microtubules in Cell Migration. Annu. Rev. Cell Dev. Biol. 2013, 29, 471–499. [Google Scholar] [CrossRef] [PubMed]
- Rottner, K.; Stradal, T.E. Actin dynamics and turnover in cell motility. Curr. Opin. Cell Biol. 2011, 23, 569–578. [Google Scholar] [CrossRef] [PubMed]
- Ouderkirk, J.L.; Krendel, M. Non-muscle myosins in tumor progression, cancer cell invasion, and metastasis: Non-Muscle Myosins and Cancer. Cytoskeleton 2014, 71, 447–463. [Google Scholar] [CrossRef] [PubMed]
- Gerlitz, G.; Bustin, M. The role of chromatin structure in cell migration. Trends Cell Biol. 2011, 21, 6–11. [Google Scholar] [CrossRef] [PubMed] [Green Version]
- McGinty, R.K.; Tan, S. Histone, Nucleosome, and Chromatin Structure. In Fundamentals of Chromatin; Workman, J.L., Abmayr, S.M., Eds.; Springer: New York, NY, USA, 2014; pp. 1–28. [Google Scholar]
- Mozzetta, C.; Boyarchuk, E.; Pontis, J.; Ait-Si-Ali, S. Sound of silence: The properties and functions of repressive Lys methyltransferases. Nat. Rev. Mol. Cell Biol. 2015, 16, 499–513. [Google Scholar] [CrossRef] [PubMed]
- Peters, A.H.; O’Carroll, D.; Scherthan, H.; Mechtler, K.; Sauer, S.; Schofer, C.; Weipoltshammer, K.; Pagani, M.; Lachner, M.; Kohlmaier, A.; et al. Loss of the Suv39h histone methyltransferases impairs mammalian heterochromatin and genome stability. Cell 2001, 107, 323–337. [Google Scholar] [CrossRef]
- Barski, A.; Cuddapah, S.; Cui, K.; Roh, T.-Y.; Schones, D.E.; Wang, Z.; Wei, G.; Chepelev, I.; Zhao, K. High-Resolution Profiling of Histone Methylations in the Human Genome. Cell 2007, 129, 823–837. [Google Scholar] [CrossRef] [PubMed]
- Margueron, R.; Reinberg, D. The Polycomb complex PRC2 and its mark in life. Nature 2011, 469, 343–349. [Google Scholar] [CrossRef] [PubMed] [Green Version]
- Rougeulle, C.; Chaumeil, J.; Sarma, K.; Allis, C.D.; Reinberg, D.; Avner, P.; Heard, E. Differential histone H3 Lys-9 and Lys-27 methylation profiles on the X. chromosome. Mol. Cell Biol. 2004, 24, 5475–5484. [Google Scholar] [CrossRef] [PubMed]
- Beck, D.B.; Oda, H.; Shen, S.S.; Reinberg, D. PR-Set7 and H4K20me1: At the crossroads of genome integrity, cell cycle, chromosome condensation, and transcription. Genes Dev. 2012, 26, 325–337. [Google Scholar] [CrossRef] [PubMed]
- Kohlmaier, A.; Savarese, F.; Lachner, M.; Martens, J.; Jenuwein, T.; Wutz, A. A Chromosomal Memory Triggered by Xist Regulates Histone Methylation in X. Inactivation. PLoS Biol. 2004, 2, e171. [Google Scholar] [CrossRef] [PubMed] [Green Version]
- Gerlitz, G.; Bustin, M. Efficient cell migration requires global chromatin condensation. J. Cell Sci. 2010, 123, 2207–2217. [Google Scholar] [CrossRef] [PubMed] [Green Version]
- Gerlitz, G.; Livnat, I.; Ziv, C.; Yarden, O.; Bustin, M.; Reiner, O. Migration cues induce chromatin alterations. Traffic 2007, 8, 1521–1529. [Google Scholar] [CrossRef] [PubMed]
- Maizels, Y.; Elbaz, A.; Hernandez-Vicens, R.; Sandrusy, O.; Rosenberg, A.; Gerlitz, G. Increased chromatin plasticity supports enhanced metastatic potential of mouse melanoma cells. Exp. Cell Res. 2017, 357, 282–290. [Google Scholar] [CrossRef] [PubMed]
- Zhang, X.; Cook, P.C.; Zindy, E.; Williams, C.J.; Jowitt, T.A.; Streuli, C.H.; MacDonald, A.S.; Redondo-Muñoz, J. Integrin α4β1 controls G9a activity that regulates epigenetic changes and nuclear properties required for lymphocyte migration. Nucleic Acids Res. 2016, 44, 3031–3044. [Google Scholar] [CrossRef] [PubMed]
- Zhang, B.; Luo, Q.; Chen, Z.; Shi, Y.; Ju, Y.; Yang, L.; Song, G. Increased nuclear stiffness via FAK-ERK1/2 signaling is necessary for synthetic mechano-growth factor E peptide-induced tenocyte migration. Sci. Rep. 2016, 6, 18809. [Google Scholar] [CrossRef] [PubMed] [Green Version]
- Liu, L.; Luo, Q.; Sun, J.; Ju, Y.; Morita, Y.; Song, G. Chromatin organization regulated by EZH2-mediated H3K27me3 is required for OPN-induced migration of bone marrow-derived mesenchymal stem cells. Int. J. Biochem. Cell Biol. 2018, 96, 29–39. [Google Scholar] [CrossRef] [PubMed]
- Chen, M.W.; Hua, K.T.; Kao, H.J.; Chi, C.C.; Wei, L.H.; Johansson, G.; Shiah, S.G.; Chen, P.S.; Jeng, Y.M.; Cheng, T.Y.; et al. H3K9 histone methyltransferase G9a promotes lung cancer invasion and metastasis by silencing the cell adhesion molecule Ep-CAM. Cancer Res. 2010, 70, 7830–7840. [Google Scholar] [CrossRef] [PubMed]
- Kottakis, F.; Polytarchou, C.; Foltopoulou, P.; Sanidas, I.; Kampranis, S.C.; Tsichlis, P.N. FGF-2 Regulates Cell Proliferation, Migration, and Angiogenesis through an NDY1/KDM2B-miR-101-EZH2 Pathway. Mol. Cell 2011, 43, 285–298. [Google Scholar] [CrossRef] [PubMed]
- Fu, Y.; Chin, L.K.; Bourouina, T.; Liu, A.Q.; VanDongen, A.M.J. Nuclear deformation during breast cancer cell transmigration. Lab Chip 2012, 12, 3774. [Google Scholar] [CrossRef] [PubMed] [Green Version]
- Kokura, K.; Sun, L.; Bedford, M.T.; Fang, J. Methyl-H3K9-binding protein MPP8 mediates E-cadherin gene silencing and promotes tumour cell motility and invasion. EMBO J. 2010, 29, 3673–3687. [Google Scholar] [CrossRef] [PubMed] [Green Version]
- Yokoyama, Y.; Hieda, M.; Nishioka, Y.; Matsumoto, A.; Higashi, S.; Kimura, H.; Yamamoto, H.; Mori, M.; Matsuura, S.; Matsuura, N. Cancer-associated upregulation of histone H3 lysine 9 trimethylation promotes cell motility in vitro and drives tumor formation in vivo. Cancer Sci. 2013, 104, 889–895. [Google Scholar] [CrossRef] [PubMed] [Green Version]
- Yu, T.; Wang, C.; Yang, J.; Guo, Y.; Wu, Y.; Li, X. Metformin inhibits SUV39H1-mediated migration of prostate cancer cells. Oncogenesis 2017, 6, e324. [Google Scholar] [CrossRef] [PubMed] [Green Version]
- Spyropoulou, A.; Gargalionis, A.; Dalagiorgou, G.; Adamopoulos, C.; Papavassiliou, K.A.; Lea, R.W.; Piperi, C.; Papavassiliou, A.G. Role of Histone Lysine Methyltransferases SUV39H1 and SETDB1 in Gliomagenesis: Modulation of Cell Proliferation, Migration, and Colony Formation. Neuromol. Med. 2014, 16, 70–82. [Google Scholar] [CrossRef] [PubMed]
- Girard, N.; Bazille, C.; Lhuissier, E.; Benateau, H.; Llombart-Bosch, A.; Boumediene, K.; Bauge, C. 3-Deazaneplanocin A. (DZNep), an Inhibitor of the Histone Methyltransferase EZH2, Induces Apoptosis and Reduces Cell Migration in Chondrosarcoma Cells. PLoS ONE 2014, 9, e98176. [Google Scholar] [CrossRef] [PubMed]
- Adhikary, G.; Grun, D.; Balasubramanian, S.; Kerr, C.; Huang, J.M.; Eckert, R.L. Survival of skin cancer stem cells requires the Ezh2 polycomb group protein. Carcinogenesis 2015, 36, 800–810. [Google Scholar] [CrossRef] [PubMed] [Green Version]
- Aparicio, O.; Geisberg, J.V.; Sekinger, E.; Yang, A.; Moqtaderi, Z.; Struhl, K. Chromatin Immunoprecipitation for Determining the Association of Proteins with Specific Genomic Sequences In Vivo. In Current Protocols in Molecular Biology; Ausubel, F.M., Brent, R., Kingston, R.E., Moore, D.D., Seidman, J.G., Smith, J.A., Struhl, K., Eds.; John Wiley & Sons, Inc.: Hoboken, NJ, USA, 2005. [Google Scholar]
- Andrews, S. FastQC A Quality Control Tool for High Throughput Sequence Data. Available online: https://www.bioinformatics.babraham.ac.uk/projects/fastqc/ (accessed on 24 November 2010).
- Krueger, F. Trim_galore. Available online: https://www.bioinformatics.babraham.ac.uk/projects/trim_galore/ (accessed on 19 October 2012).
- Martin, M. Cutadapt removes adapter sequences from high-throughput sequencing reads. EMBnet. J. 2011, 17, 10–12. [Google Scholar] [CrossRef]
- FASTX-Toolkit. Available online: http://hannonlab.cshl.edu/fastx_toolkit/ (accessed on 24 November 2009).
- Langmead, B.; Salzberg, S.L. Fast gapped-read alignment with Bowtie 2. Nat. Methods 2012, 9, 357–359. [Google Scholar] [CrossRef] [PubMed] [Green Version]
- Picard. Available online: https://broadinstitute.github.io/picard/ (accessed on 9 November 2018).
- Xu, S.; Grullon, S.; Ge, K.; Peng, W. Spatial Clustering for Identification of ChIP-Enriched Regions (SICER) to Map Regions of Histone Methylation Patterns in Embryonic Stem Cells. Methods Mol. Biol. 2014, 1150, 97–111. [Google Scholar] [CrossRef] [PubMed] [Green Version]
- Quinlan, A.R.; Hall, I.M. BEDTools: A flexible suite of utilities for comparing genomic features. Bioinform. Oxf. Engl. 2010, 26, 841–842. [Google Scholar] [CrossRef] [PubMed]
- Tyner, C.; Barber, G.P.; Casper, J.; Clawson, H.; Diekhans, M.; Eisenhart, C.; Fischer, C.M.; Gibson, D.; Gonzalez, J.N.; Guruvadoo, L.; et al. The UCSC Genome Browser database: 2017 update. Nucleic Acids Res. 2017, 45, D626–D634. [Google Scholar] [CrossRef] [PubMed]
- Heinz, S.; Benner, C.; Spann, N.; Bertolino, E.; Lin, Y.C.; Laslo, P.; Cheng, J.X.; Murre, C.; Singh, H.; Glass, C.K. Simple combinations of lineage-determining transcription factors prime cis-regulatory elements required for macrophage and B. cell identities. Mol. Cell 2010, 38, 576–589. [Google Scholar] [CrossRef] [PubMed]
- Shen, L.; Shao, N.; Liu, X.; Nestler, E. ngs. plot: Quick mining and visualization of next-generation sequencing data by integrating genomic databases. BMC Genom. 2014, 15, 284. [Google Scholar] [CrossRef] [PubMed]
- Ramírez, F.; Ryan, D.P.; Grüning, B.; Bhardwaj, V.; Kilpert, F.; Richter, A.S.; Heyne, S.; Dündar, F.; Manke, T. deepTools2: A next generation web server for deep-sequencing data analysis. Nucleic Acids Res. 2016, 44, W160–W165. [Google Scholar] [CrossRef] [PubMed]
- Ernst, J.; Kellis, M. Chromatin-state discovery and genome annotation with ChromHMM. Nat. Protoc. 2017, 12, 2478–2492. [Google Scholar] [CrossRef] [PubMed]
- Trapnell, C.; Pachter, L.; Salzberg, S.L. TopHat: Discovering splice junctions with RNA-Seq. Bioinformatics 2009, 25, 1105–1111. [Google Scholar] [CrossRef] [PubMed]
- Anders, S.; Pyl, P.T.; Huber, W. HTSeq—A Python framework to work with high-throughput sequencing data. Bioinformatics 2015, 31, 166–169. [Google Scholar] [CrossRef] [PubMed]
- Robinson, M.D.; McCarthy, D.J.; Smyth, G.K. edgeR: A Bioconductor package for differential expression analysis of digital gene expression data. Bioinform. Oxf. Engl. 2010, 26, 139–140. [Google Scholar] [CrossRef] [PubMed]
- Ritchie, M.E.; Phipson, B.; Wu, D.; Hu, Y.; Law, C.W.; Shi, W.; Smyth, G.K. limma powers differential expression analyses for RNA-sequencing and microarray studies. Nucleic Acids Res. 2015, 43, e47. [Google Scholar] [CrossRef] [PubMed]
- Reimers, M.; Carey, V.J. Bioconductor: An Open Source Framework for Bioinformatics and Computational Biology. In Methods in Enzymology; DNA Microarrays, Part B: Databases and Statistics; Academic Press: Cambridge, MA, USA, 2006; pp. 119–134. [Google Scholar]
- Law, C.W.; Chen, Y.; Shi, W.; Smyth, G.K. Voom: Precision weights unlock linear model analysis tools for RNA-seq read counts. Genome Biol. 2014, 15, R29. [Google Scholar] [CrossRef] [PubMed]
- Yu, J.; Gu, X.; Yi, S. Ingenuity Pathway Analysis of Gene Expression Profiles in Distal Nerve Stump following Nerve Injury: Insights into Wallerian Degeneration. Front. Cell. Neurosci. 2016, 10. [Google Scholar] [CrossRef] [PubMed]
- Liang, C.-C.; Park, A.Y.; Guan, J.-L. In vitro scratch assay: A convenient and inexpensive method for analysis of cell migration in vitro. Nat. Protoc. 2007, 2, 329–333. [Google Scholar] [CrossRef] [PubMed]
- Gabellini, C.; Trisciuoglio, D.; Desideri, M.; Candiloro, A.; Ragazzoni, Y.; Orlandi, A.; Zupi, G.; Del Bufalo, D. Functional activity of CXCL8 receptors, CXCR1 and CXCR2, on human malignant melanoma progression. Eur. J. Cancer 2009, 45, 2618–2627. [Google Scholar] [CrossRef] [PubMed]
- Giampieri, S.; Manning, C.; Hooper, S.; Jones, L.; Hill, C.S.; Sahai, E. Localized and reversible TGFβ signalling switches breast cancer cells from cohesive to single cell motility. Nat. Cell Biol. 2009, 11, 1287–1296. [Google Scholar] [CrossRef] [PubMed] [Green Version]
- Ning, Y.; Manegold, P.C.; Hong, Y.K.; Zhang, W.; Pohl, A.; Lurje, G.; Winder, T.; Yang, D.; LaBonte, M.J.; Wilson, P.M.; et al. Interleukin-8 is associated with proliferation, migration, angiogenesis and chemosensitivity in vitro and in vivo in colon cancer cell line models. Int. J. Cancer 2011, 128, 2038–2049. [Google Scholar] [CrossRef] [PubMed]
- Pang, M.-F.; Georgoudaki, A.-M.; Lambut, L.; Johansson, J.; Tabor, V.; Hagikura, K.; Jin, Y.; Jansson, M.; Alexander, J.S.; Nelson, C.M.; et al. TGF-β1-induced EMT promotes targeted migration of breast cancer cells through the lymphatic system by the activation of CCR7/CCL21-mediated chemotaxis. Oncogene 2016, 35, 748–760. [Google Scholar] [CrossRef] [PubMed]
- Simões, A.E.S.; Rodrigues, C.M.P.; Borralho, P.M. The MEK5/ERK5 signalling pathway in cancer: A promising novel therapeutic target. Drug Discov. Today 2016, 21, 1654–1663. [Google Scholar] [CrossRef] [PubMed]
- Bird, R.P. The Emerging Role of Vitamin B6 in Inflammation and Carcinogenesis. In Advances in Food and Nutrition Research; Elsevier: Amsterdam, The Netherlands, 2018; pp. 151–194. [Google Scholar]
- Anderson, O.S.; Sant, K.E.; Dolinoy, D.C. Nutrition and epigenetics: An interplay of dietary methyl donors, one-carbon metabolism and DNA methylation. J. Nutr. Biochem. 2012, 23, 853–859. [Google Scholar] [CrossRef] [PubMed]
- Dayem, M.A.; Moreilhon, C.; Turchi, L.; Magnone, V.; Christen, R.; Ponzio, G.; Barbry, P. Early Gene Expression in Wounded Human Keratinocytes Revealed by DNA Microarray Analysis. Comp. Funct. Genom. 2003, 4, 47–55. [Google Scholar] [CrossRef] [PubMed]
- Demuth, T.; Rennert, J.L.; Hoelzinger, D.B.; Reavie, L.B.; Nakada, M.; Beaudry, C.; Nakada, S.; Anderson, E.M.; Henrichs, A.N.; McDonough, W.S.; et al. Glioma cells on the run—The migratory transcriptome of 10 human glioma cell lines. BMC Genom. 2008, 9, 54. [Google Scholar] [CrossRef] [PubMed]
- Fitsialos, G.; Chassot, A.-A.; Turchi, L.; Dayem, M.A.; LeBrigand, K.; Moreilhon, C.; Meneguzzi, G.; Buscà, R.; Mari, B.; Barbry, P.; et al. Transcriptional Signature of Epidermal Keratinocytes Subjected to in vitro Scratch Wounding Reveals Selective Roles for ERK1/2, p38, and Phosphatidylinositol 3-Kinase Signaling Pathways. J. Biol. Chem. 2007, 282, 15090–15102. [Google Scholar] [CrossRef] [PubMed]
- Vakoc, C.R.; Mandat, S.A.; Olenchock, B.A.; Blobel, G.A. Histone H3 lysine 9 methylation and HP1gamma are associated with transcription elongation through mammalian chromatin. Mol. Cell 2005, 19, 381–391. [Google Scholar] [CrossRef] [PubMed]
- Brinkman, A.B.; Roelofsen, T.; Pennings, S.W.C.; Martens, J.H.A.; Jenuwein, T.; Stunnenberg, H.G. Histone modification patterns associated with the human X. chromosome. EMBO Rep. 2006. [Google Scholar] [CrossRef] [PubMed]
- Takahashi, S.; Ebihara, A.; Kajiho, H.; Kontani, K.; Nishina, H.; Katada, T. RASSF7 negatively regulates pro-apoptotic JNK signaling by inhibiting the activity of phosphorylated-MKK7. Cell Death Differ. 2011, 18, 645–655. [Google Scholar] [CrossRef] [PubMed]
- Nätt, D.; Johansson, I.; Faresjö, T.; Ludvigsson, J.; Thorsell, A. High cortisol in 5-year-old children causes loss of DNA methylation in SINE retrotransposons: A possible role for ZNF263 in stress-related diseases. Clin. Epigenetics 2015, 7, 91. [Google Scholar] [CrossRef] [PubMed]
- Zhang, C.; Xiang, T.; Li, S.; Ye, L.; Feng, Y.; Pei, L.; Li, L.; Wang, X.; Sun, R.; Ren, G.; et al. The novel 19q13 KRAB zinc-finger tumour suppressor ZNF382 is frequently methylated in oesophageal squamous cell carcinoma and antagonises Wnt/β-catenin signalling. Cell Death Dis. 2018, 9. [Google Scholar] [CrossRef] [PubMed]
- Vogel, S.Z.; Schlickeiser, S.; Jürchott, K.; Akyuez, L.; Schumann, J.; Appelt, C.; Vogt, K.; Schröder, M.; Vaeth, M.; Berberich-Siebelt, F.; et al. TCAIM decreases T cell priming capacity of dendritic cells by inhibiting TLR-induced Ca2+ influx and IL-2 production. J. Immunol. 2015, 201, 1400713. [Google Scholar] [CrossRef] [PubMed]
- Furusawa, T.; Rochman, M.; Taher, L.; Dimitriadis, E.K.; Nagashima, K.; Anderson, S.; Bustin, M. Chromatin decompaction by the nucleosomal binding protein HMGN5 impairs nuclear sturdiness. Nat. Commun. 2015, 6, 6138. [Google Scholar] [CrossRef] [PubMed]
- Stephens, A.D.; Liu, P.Z.; Banigan, E.J.; Almassalha, L.M.; Backman, V.; Adam, S.A.; Goldman, R.D.; Marko, J.F. Chromatin histone modifications and rigidity affect nuclear morphology independent of lamins. Mol. Biol. Cell 2018, 29, 220–233. [Google Scholar] [CrossRef] [PubMed] [Green Version]
Figure 1.
The patterns of the ChIP-seq signals of H3K9me3, H3K27me3, and H4K20me1 upon induction of migration. (a) Mean ± SE of ChIP-seq peak intensities and lengths of H3K9me3, H3K27me3, and H4K20me1 in control (Cont.) and migrating (Mig.) cells. Reads percentage inside peaks are the percentages of ChIP-seq mapped reads of the indicated heterochromatin markers that are localized inside peaks. Statistical significance was calculated between control cells to migrating cells by Wilcoxon rank sum test, p < 2.2 × 10⁻¹⁶. (b–d) UCSC browser shots of H3K9me3, H3K27me3, and H4K20me1, respectively. (e,f) Correlation between the three heterochromatin markers over promoters and repetitive elements. Spearman correlation coefficients of the ChIP-seq signals were calculated from reads coverage of consecutively equally sized 10 kb bins.

Figure 2.
Relative distribution of ChIP-seq signal across various genomic elements in control and migrating cells. (a,b) The relative distribution of ChIP-seq reads (a) and ChIP-seq differential peaks (b) across the indicated genomic elements was calculated for the input and the three heterochromatin markers in control cells and in migrating cells. (c–e) UCSC browser shots of H3K9me3, H3K27me3, and H4K20me1, respectively.

Figure 3.
Distinct and combinatorial pattern of heterochromatin markers over genomic elements. (a) Distribution of H3K9me3, H3K27me3, and H4K20me1 ChIP-seq signals in control cells (green line) and in migrating cells (orange line) across gene bodies and the repetitive elements LINE (n = 671,156), SINE (n = 682,126), LTR (n = 646,284), and DNA transposons (n = 79,756). In each graph, the region between 5’End and 3’End represents the analyzed element. (b) Five combinatorial chromatin states were defined using the three heterochromatin markers. The left panel describes the chromatin states as represented by the emission coefficients in ChromHMM model; the right panel describes the relative enrichment of states coverage across the whole genome and over different genomic regions, in control and migrating cells.

Figure 4.
Altered gene expression upon induction of migration. Top 10 pathways that are altered upon induction of migration as were identified by IPA using RNA-seq data collected from control cells and migrating cells (n = 5). Only genes that were differentially expressed by a factor of >1.3 and FDR <0.05 were included in the analysis. Orange bars represent up-regulated pathways and grey bars represent altered pathways in which the altered genes did not have a uniform trend.

Figure 5.
The dependence of migration-induced transcriptional changes on H3K27 methylation. (a) Altered genes upon induction of migration (fold change > 1.3, FDR < 0.05) that were detected in untreated migrating cells and in migrating cells treated with GSK343 are represented by a Venn diagram. Overlapping genes are termed “H3K27me-independent”, genes altered only when migrating cells were compared to control cells are termed “H3K27me-dependent”, and differentially expressed genes only in GSK343-treated migrating cells are termed “H3K27me-buffered”. (b) Top 10 pathways altered according to the “H3K27me-independent” gene list, the “H3K27me-dependent” gene list, and the “H3K27me-buffered” gene list as identified by IPA. (c) Distribution of H3K27me3 signal across “H3K27me-dependent”, “H3K27me-independent” and “H3K27me-buffered” genes in control cells (green) and in migrating cells (orange). The region between 5’End and the 3’End represents genes bodies. Additional 2000 bp upstream and downstream of the genes are plotted. (d–f) H3K27me3 signal around the transcription start site (TSS) of Rassf7, Zfp382, and Tcaim. The altered signals around the TSS are marked by orange rectangles.

Figure 6.
Migration-induced changes in RNA stability. Altered genes upon induction of migration were detected in the presence of DRB, an RNA polymerase II inhibitor (fold change > 1.3, FDR < 0.05). Increased RNA stability is detected by up-regulation of genes in DRB-treated migrating cells compared to DRB-treated control cells, and decreased RNA stability by down-regulation. (a) A Venn diagram representing the overlap between genes with increased or decreased RNA stability levels upon induction of migration to H3K27me-dependent and independent genes. (b) Top 10 pathways of the genes with altered RNA stability levels upon induction of migration as identified by IPA.

© 2018 by the authors. Licensee MDPI, Basel, Switzerland. This article is an open access article distributed under the terms and conditions of the Creative Commons Attribution (CC BY) license (http://creativecommons.org/licenses/by/4.0/).
Share and Cite
MDPI and ACS Style
Segal, T.; Salmon-Divon, M.; Gerlitz, G. The Heterochromatin Landscape in Migrating Cells and the Importance of H3K27me3 for Associated Transcriptome Alterations. Cells 2018, 7, 205. https://0-doi-org.brum.beds.ac.uk/10.3390/cells7110205
AMA Style
Segal T, Salmon-Divon M, Gerlitz G. The Heterochromatin Landscape in Migrating Cells and the Importance of H3K27me3 for Associated Transcriptome Alterations. Cells. 2018; 7(11):205. https://0-doi-org.brum.beds.ac.uk/10.3390/cells7110205
Chicago/Turabian StyleSegal, Tamar, Mali Salmon-Divon, and Gabi Gerlitz. 2018. "The Heterochromatin Landscape in Migrating Cells and the Importance of H3K27me3 for Associated Transcriptome Alterations" Cells 7, no. 11: 205. https://0-doi-org.brum.beds.ac.uk/10.3390/cells7110205
Note that from the first issue of 2016, this journal uses article numbers instead of page numbers. See further details here.