A Direct Comparison of the Relationship of Epigenetic Aging and Epigenetic Substance Consumption Markers to Mortality in the Framingham Heart Study


Abstract
:1. Introduction
2. Materials and Methods
2.1. DNA Methylation Data
2.2. Clinical Assessments of the FHS Subjects
2.3. Data Analysis
3. Results
4. Discussion
- (1)
- cg05575921 and cg04987734 have predictive effects over and above LEA, but the converse is also true;
- (2)
- in the full model with all predictors, cg05575921 has the strongest standardized effect followed by LEA and cg04987734;
- (3)
- after adjustment for multiple comparisons, 38% and 64% of the markers in the LEA index are significantly associated with the objective epigenetic biomarkers of smoking and drinking (cg05575921 and cg04987734), respectively.
5. Conclusions
Supplementary Materials
Author Contributions
Funding
Acknowledgments
Conflicts of Interest
References
- Framingham Heart Study. Available online: https://www.framinghamheartstudy.org/fhs-bibliography/ (accessed on 9 July 2018).
- Cupples, L.; D’Agostino, R.; Kiely, D. The Framingham Heart Study, Section 35. An Epidemiological Investigation of Cardiovascular Disease: Survival following Cardiovascular Events: 30 Year Follow-up; National Heart Lung and Blood Institute: Bethesda, MD, USA, 1988.
- Hannum, G.; Guinney, J.; Zhao, L.; Zhang, L.; Hughes, G.; Sadda, S.; Klotzle, B.; Bibikova, M.; Fan, J.B.; Gao, Y.; et al. Genome-wide methylation profiles reveal quantitative views of human aging rates. Mol. Cell 2013, 49, 359–367. [Google Scholar] [CrossRef] [PubMed]
- Bocklandt, S.; Lin, W.; Sehl, M.E.; Sanchez, F.J.; Sinsheimer, J.S.; Horvath, S.; Vilain, E. Epigenetic predictor of age. PLoS ONE 2011, 6, e14821. [Google Scholar] [CrossRef] [PubMed]
- Fraga, M.F.; Esteller, M. Epigenetics and aging: The targets and the marks. Trends Genet. 2007, 23, 413–418. [Google Scholar] [CrossRef] [PubMed]
- Fuke, C.; Shimabukuro, M.; Petronis, A.; Sugimoto, J.; Oda, T.; Miura, K.; Miyazaki, T.; Ogura, C.; Okazaki, Y.; Jinno, Y. Age related changes in 5-methylcytosine content in human peripheral leukocytes and placentas: An hplc-based study. Ann. Hum. Genet. 2004, 68, 196–204. [Google Scholar] [CrossRef] [PubMed]
- Svane, A.; Soerensen, M.; Lund, J.; Tan, Q.; Jylhävä, J.; Wang, Y.; Pedersen, N.; Hägg, S.; Debrabant, B.; Deary, I.; et al. DNA methylation and all-cause mortality in middle-aged and elderly Danish twins. Genes 2018, 9, 78. [Google Scholar] [CrossRef] [PubMed]
- Levine, M.E.; Lu, A.T.; Quach, A.; Chen, B.H.; Assimes, T.L.; Bandinelli, S.; Hou, L.; Baccarelli, A.A.; Stewart, J.D.; Li, Y. An epigenetic biomarker of aging for lifespan and healthspan. Aging (Albany NY) 2018, 10, 573. [Google Scholar] [CrossRef] [PubMed]
- Zhang, Y.; Schottker, B.; Florath, I.; Stock, C.; Butterbach, K.; Holleczek, B.; Mons, U.; Brenner, H. Smoking-associated DNA methylation biomarkers and their predictive value for all-cause and cardiovascular mortality. Environ. Health Perspect. 2016, 124, 67–74. [Google Scholar] [CrossRef]
- Philibert, R.; Dogan, M.V.; Noel, A.; Miller, S.; Krukow, B.; Papworth, E.; Cowley, J.; Knudsen, A.; Beach, S.R.; Black, D. Genome wide and digital PCR epigenetic assessments of alcohol consumption. Am. J. Med. Genet. Part B 2018, 177, 479–488. [Google Scholar] [CrossRef]
- Zhang, Y.; Saum, K.U.; Schöttker, B.; Holleczek, B.; Brenner, H. Methylomic survival predictors, frailty, and mortality. Aging (Albany NY) 2018, 10, 339. [Google Scholar] [CrossRef]
- Johnson, N.B.; Hayes, L.D.; Brown, K.; Hoo, E.C.; Ethier, K.A.; Centers for Disease Control and Prevention. CDC national health report: Leading causes of morbidity and mortality and associated behavioral risk and protective factors—United States, 2005–2013. MMWR Surveill. Summ. 2014, 63, 3–27. [Google Scholar]
- Centers for Disease Control and Prevention. Alcohol-attributable deaths and years of potential life lost—United States, 2001. Morbid Mortal Wkly. Rep. 2004, 53, 866–870. [Google Scholar]
- Benowitz, N.L. Cotinine as a biomarker of environmental tobacco smoke exposure. Epidemiol. Rev. 1996, 18, 188–204. [Google Scholar] [CrossRef] [PubMed]
- Gao, X.; Jia, M.; Zhang, Y.; Breitling, L.P.; Brenner, H. DNA methylation changes of whole blood cells in response to active smoking exposure in adults: A systematic review of DNA methylation studies. Clin. Epigenet. 2015, 7, 113. [Google Scholar] [CrossRef] [PubMed]
- Andersen, A.M.; Dogan, M.V.; Beach, S.R.; Philibert, R.A. Current and future prospects for epigenetic biomarkers of substance use disorders. Genes 2015, 6, 991–1022. [Google Scholar] [CrossRef] [PubMed]
- Philibert, R.; Hollenbeck, N.; Andersen, E.; Osborn, T.; Gerrard, M.; Gibbons, R.; Wang, K. A quantitative epigenetic approach for the assessment of cigarette consumption. Front. Psychol. 2015, 6, 656. [Google Scholar] [CrossRef] [PubMed]
- Philibert, R.; Penaluna, B.; White, T.; Shires, S.; Gunter, T.D.; Liesveld, J.; Erwin, C.; Hollenbeck, N.; Osborn, T. A pilot examination of the genome-wide DNA methylation signatures of subjects entering and exiting short-term alcohol dependence treatment programs. Epigenetics 2014, 9, 1–7. [Google Scholar] [CrossRef] [PubMed]
- Liu, C.; Marioni, R.E.; Hedman, A.K.; Pfeiffer, L.; Tsai, P.C.; Reynolds, L.M.; Just, A.C.; Duan, Q.; Boer, C.G.; Tanaka, T.; et al. A DNA methylation biomarker of alcohol consumption. Mol. Psychiatry 2016, 23, 422–433. [Google Scholar] [CrossRef] [PubMed] [Green Version]
- Philibert, R.; Dogan, M.V.; Noel, A.; Miller, S.; Krukow, B.; Papworth, E.; Cowley, J.; Long, J.; Beach, S.R.; Black, D. Dose response and prediction characteristics of a methylation sensitive digital PCR assay for cigarette consumption in adults. Front. Genet. Epigenet. 2018, 9, 137. [Google Scholar] [CrossRef] [PubMed]
- Dogan, M.V.; Xiang, J.; Beach, S.R.; Cutrona, C.; Gibbons, F.X.; Simons, R.L.; Brody, G.H.; Stapleton, J.T.; Philibert, R.A. Ethnicity and smoking-associated DNA methylation changes at HIV co-receptor GPR15. Front. Psychiatry 2015, 6, 132. [Google Scholar] [CrossRef] [PubMed]
- Dogan, M.V.; Beach, S.R.H.; Philibert, R.A. Genetically contextual effects of smoking on genome wide DNA methylation. Am. J. Med. Genet. Part B Neuropsychiatry Genet. 2017, 174, 595–607. [Google Scholar] [CrossRef]
- Dogan, M.V.; Grumbach, I.M.; Michaelson, J.J.; Philibert, R.A. Integrated genetic and epigenetic prediction of coronary heart disease in the Framingham heart study. PLoS ONE 2018, 13, e0190549. [Google Scholar] [CrossRef] [PubMed]
- Fleiss, J.L. Statistical Methods for Rates and Proportions, 2nd ed.; John Wiley & Sons Inc.: New York, NY, USA, 1981. [Google Scholar]
- Cox, D.R. Regression models and life-tables. J. R. Stat. Soc. Ser. B Methodol. 1972, 34, 187–220. [Google Scholar] [CrossRef]
- Hosmer D.W., Jr.; Califf, R.M.; Pryor, D.B.; Lee, K.L.; Rosati, R.A. Evaluating the yield of medical tests. J. Am. Med. Assoc. 1982, 247, 2543–2546. [Google Scholar]
- Hosmer D.W., Jr.; Lemeshow, S. Applied Survival Analysis: Regression Modelling of Time to Event Data; John Wiley and Sons Limited: Chichester, UK, 1999. [Google Scholar]
- Pencina, M.J.; D’agostino, R.B.; Pencina, K.M.; Janssens, A.C.J.; Greenland, P. Interpreting incremental value of markers added to risk prediction models. Am. J. Epidemiol. 2012, 176, 473–481. [Google Scholar] [CrossRef] [PubMed]
- Benjamini, Y.; Hochberg, H. Controlling the false discovery rate. A practical and powerful approach to multiple testing. J. R. Stat. Soc. Ser. B Methodol. 1995, 57, 289–300. [Google Scholar] [CrossRef]
- Philibert, R.; Hollenbeck, N.; Andersen, E.; McElroy, S.; Wilson, S.; Vercande, K.; Beach, S.R.; Osborn, T.; Gerrard, M.; Gibbons, F.X.; et al. Reversion of AHRR demethylation is a quantitative biomarker of smoking cessation. Front. Psychiatry 2016, 7, 55. [Google Scholar] [CrossRef] [PubMed]
- Guida, F.; Sandanger, T.M.; Castagné, R.; Campanella, G.; Polidoro, S.; Palli, D.; Krogh, V.; Tumino, R.; Sacerdote, C.; Panico, S.; et al. Dynamics of smoking-induced genome-wide methylation changes with time since smoking cessation. Hum. Mol. Genet. 2015, 28, 2349–2359. [Google Scholar] [CrossRef]
- Hilden, J. Commentary: On NRI, IDI, and “good-looking” statistics with nothing underneath. Epidemiology 2014, 25, 265–267. [Google Scholar] [CrossRef]
- Pencina, M.J.; D’Agostino, R.B.; Song, L. Quantifying discrimination of Framingham risk functions with different survival c statistics. Stat. Med. 2012, 31, 1543–1553. [Google Scholar] [CrossRef]
- Pencina, M.J.; Chipman, J.; Steyerberg, E.W.; Braun, D.; Fine, J.P.; D’Agostino, R.B. Authors’ response to comments. Stat. Med. 2017, 36, 4511–4513. [Google Scholar] [CrossRef]
- Bock, C.; Halbritter, F.; Carmona, F.J.; Tierling, S.; Datlinger, P.; Assenov, Y.; Berdasco, M.; Bergmann, A.K.; Booher, K.; Busato, F. Quantitative comparison of DNA methylation assays for biomarker development and clinical applications. Nat. Biotechnol. 2016, 34, 726–737. [Google Scholar] [CrossRef] [PubMed] [Green Version]
- Forey, B.A.; Thornton, A.J.; Lee, P.N. Systematic review with meta-analysis of the epidemiological evidence relating smoking to COPD, chronic bronchitis and emphysema. BMC Pulm. Med. 2011, 11, 36. [Google Scholar] [CrossRef] [PubMed]
- Florescu, A.; Ferrence, R.; Einarson, T.; Selby, P.; Soldin, O.; Koren, G. Methods for quantification of exposure to cigarette smoking and environmental tobacco smoke: Focus on developmental toxicology. Ther. Drug Monit. 2009, 31, 14–30. [Google Scholar] [CrossRef] [PubMed]
- Bortolotti, F.; De Paoli, G.; Tagliaro, F. Carbohydrate-deficient transferrin (CDT) as a marker of alcohol abuse: A critical review of the literature 2001–2005. J. Chromatogr. B Anal. Technol. Biomed. Life Sci. 2006, 841, 96–109. [Google Scholar] [CrossRef] [PubMed]
- Koch, C.M.; Wagner, W. Epigenetic-aging-signature to determine age in different tissues. Aging (Albany NY) 2011, 3, 1018. [Google Scholar] [CrossRef] [PubMed]


| All | Male | Female | |
|---|---|---|---|
| Number of Participants | 2256 | 1022 | 1234 |
| Age at Intake † | 66.3 ± 8.9 years | 66.1 ± 8.8 years | 66.5 ± 9.0 years |
| Current Smoking Status ‡ | |||
| Yes | 179 (8.0) | 75 (7.3) | 104 (8.4) |
| No | 2074 (91.9) | 944 (92.4) | 1130 (91.6) |
| Missing | 3 (0.1) | 3 (0.3) | 0 (0.0) |
| Past Smoking Status | |||
| Yes | 203 (9.0) | 86 (8.4) | 117 (9.5) |
| No | 2050 (90.9) | 933 (91.3) | 1117 (90.5) |
| Missing | 3 (0.1) | 3 (0.3) | 0 (0.0) |
| CHD | |||
| Yes | 322 (14.3) | 201 (19.7) | 121 (9.8) |
| No | 1934 (85.7) | 821 (80.3) | 1113 (90.2) |
| COPD | |||
| Yes | 47 (2.1) | 21 (2.1) | 26 (2.1) |
| No | 2174 (96.4) | 984 (96.3) | 1190 (96.4) |
| Missing | 35 (1.5) | 17 (1.6) | 18 (1.5) |
| Diabetes | |||
| Yes | 271 (12.0) | 144 (14.1) | 127 (10.3) |
| No | 1978 (87.7) | 874 (85.5) | 1104 (89.5) |
| Missing | 7 (0.3) | 4 (0.4) | 3 (0.2) |
| Stroke | |||
| Yes | 103 (4.6) | 47 (4.6) | 56 (4.5) |
| No | 2153 (95.4) | 975 (95.4) | 1178 (95.5) |
| Dementia | |||
| Present | 10 (0.4) | 3 (0.3) | 7 (0.6) |
| Maybe | 18 (0.8) | 9 (0.9) | 9 (0.7) |
| None | 2226 (98.7) | 1009 (98.7) | 1217 (98.6) |
| Missing | 2 (0.1) | 1 (0.1) | 1 (0.1) |
| LEA | 58.8 ± 9.4 years | 59.4 ± 9.5 years | 58.3 ± 9.4 years |
| Average Methylation | |||
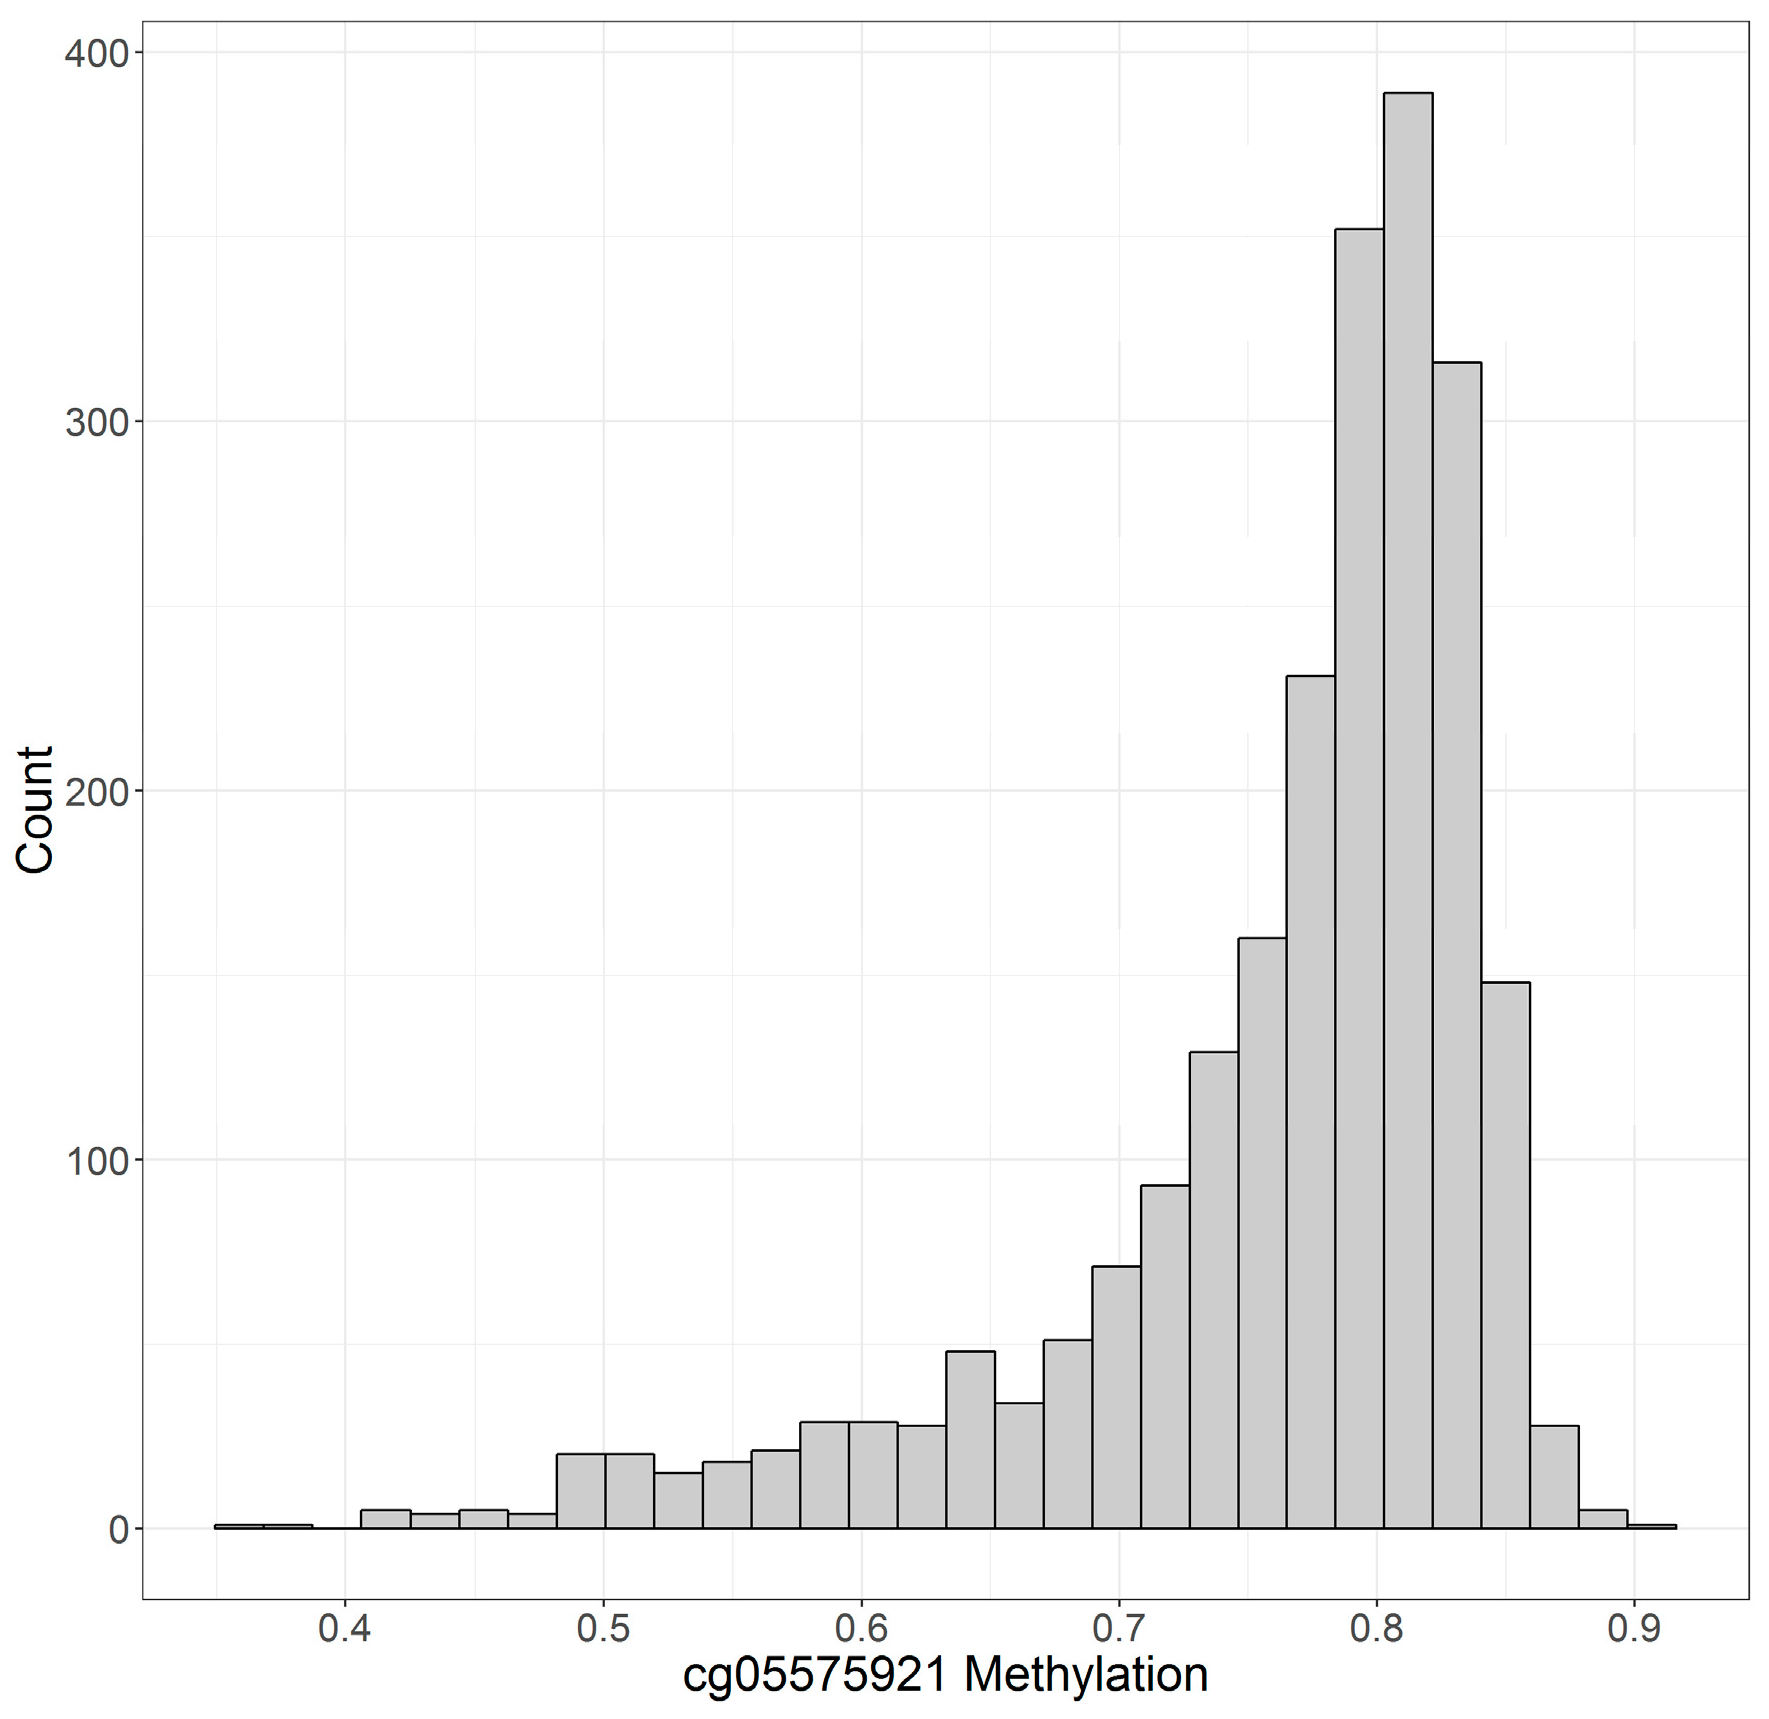
| cg05575921 | 76.4 ± 8.4% | 75.7 ± 9.0% | 77.0 ± 7.8% |
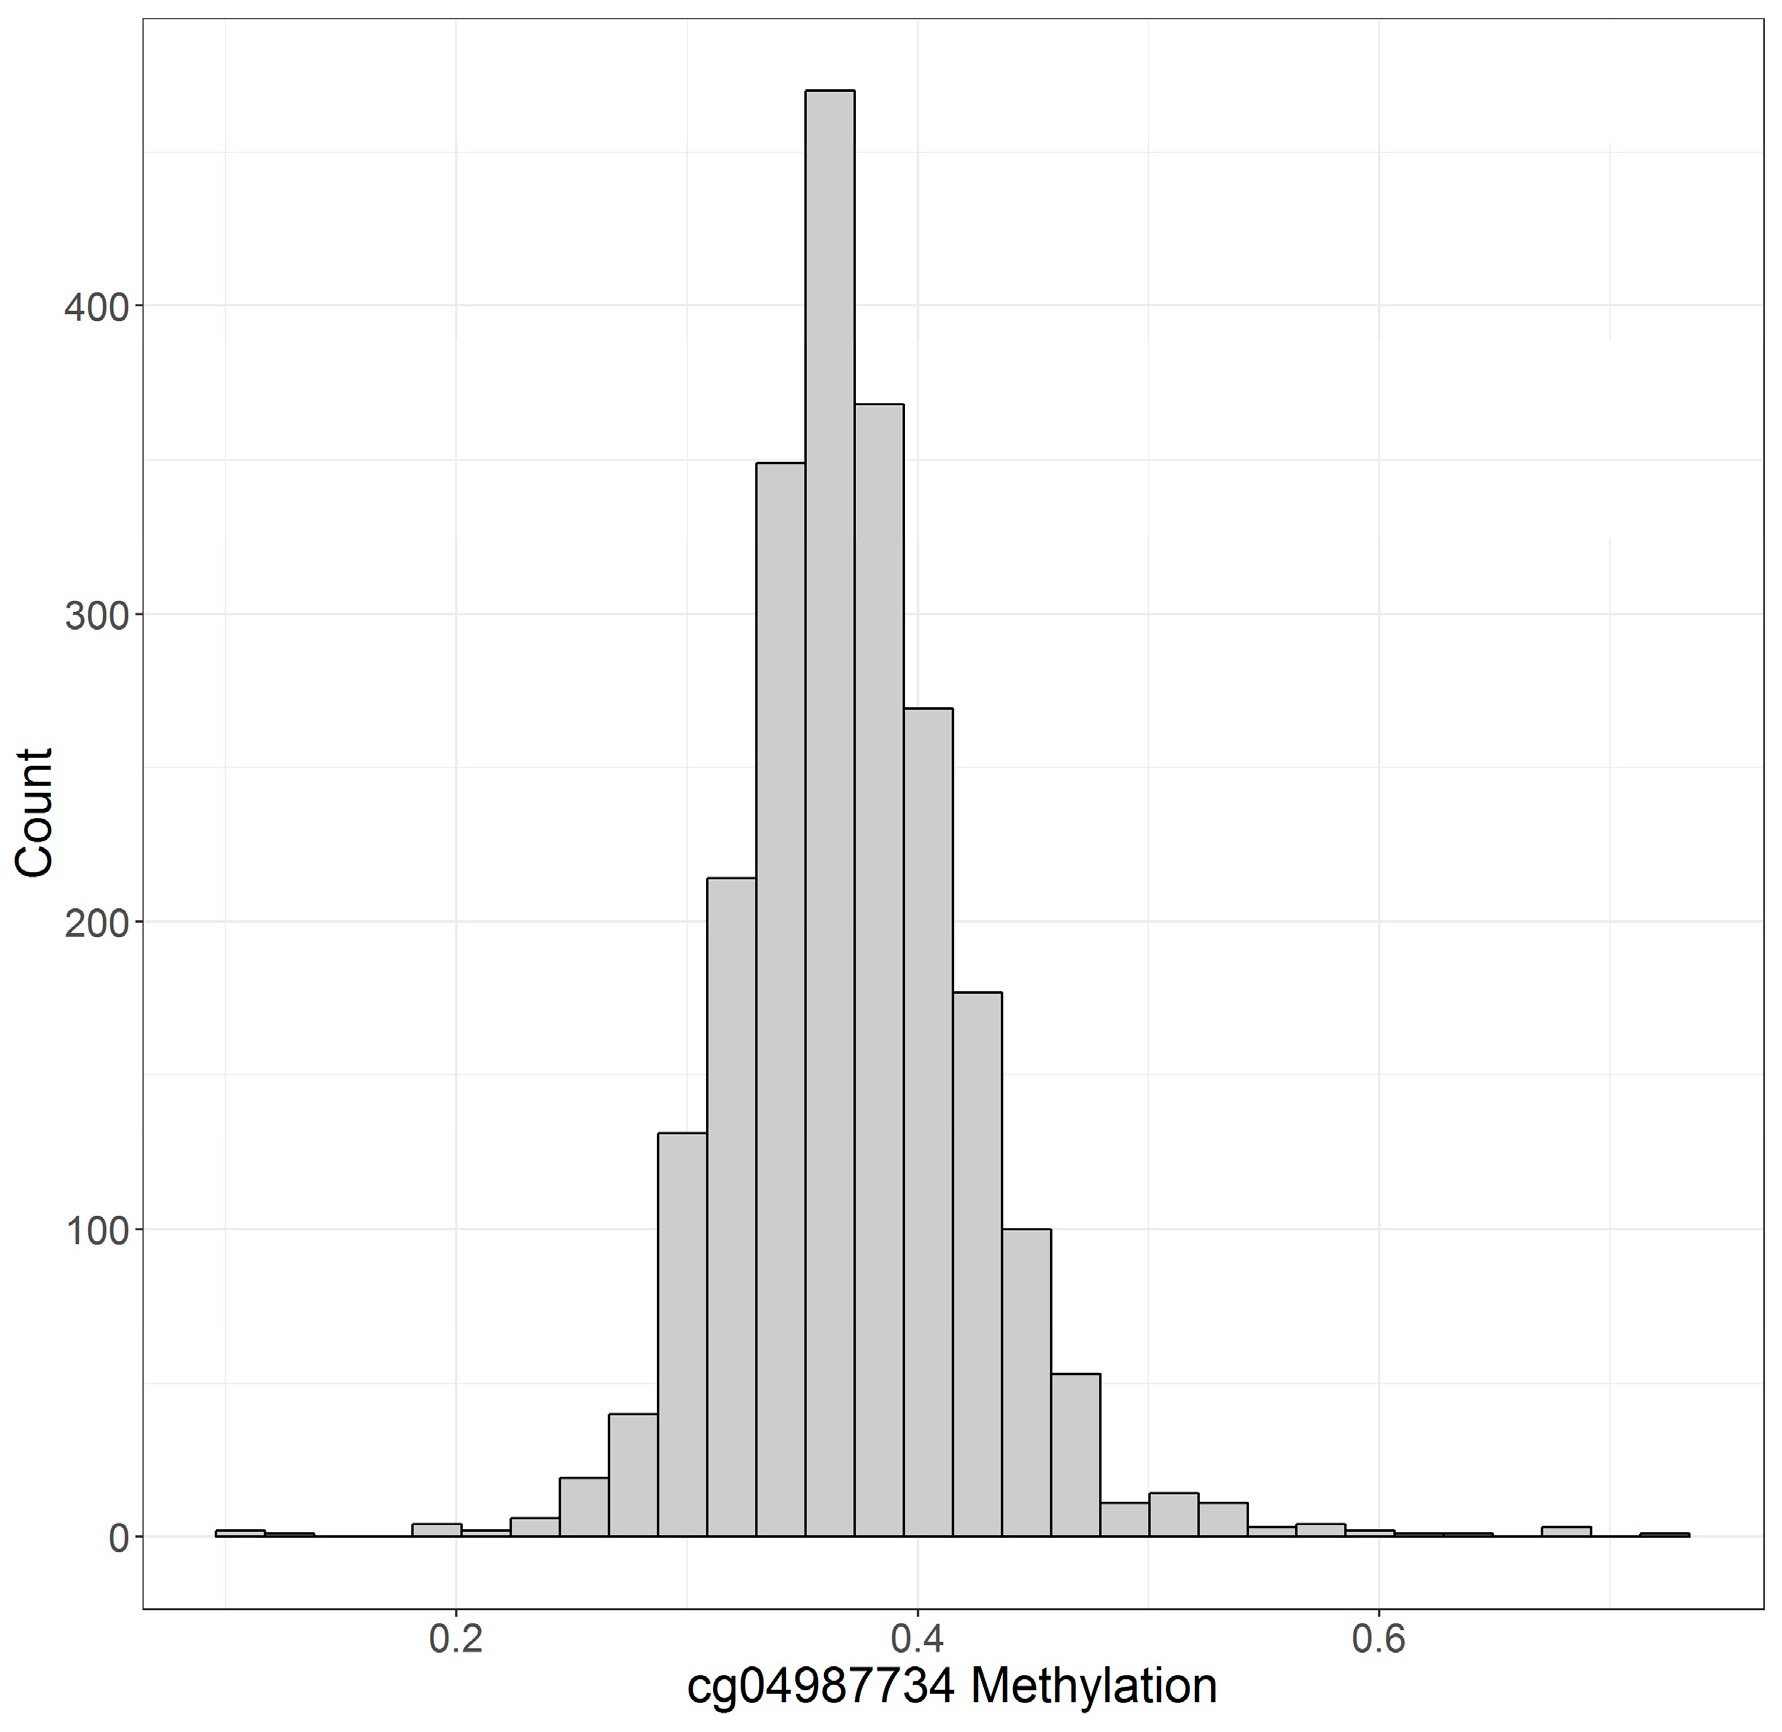
| cg04987734 | 37.1 ± 5.2% | 38.2 ± 5.0% | 36.2 ± 5.2% |
| Predictor | HR (95% CI) | N (Events) |
|---|---|---|
| Age at Intake † | 2.59 (2.28, 2.93) *** | 2256 (288) |
| Sex | ||
| Male vs. Female | 1.50 (1.19, 1.89) ** | 2256 (288) |
| CHD | ||
| Yes vs. No | 3.10 (2.42, 3.98) *** | 2256 (288) |
| COPD | ||
| Yes vs. No | 4.74 (3.07, 7.33)*** | 2221 (284) |
| Diabetes | ||
| Yes vs. No | 2.22 (1.67, 2.93) *** | 2249 (286) |
| Stroke | ||
| Yes vs. No | 4.77 (3.42, 6.65) *** | 2256 (288) |
| Dementia | ||
| Present vs. None | 5.83 (2.59, 13.11) *** | 2254 (286) |
| LEA † | 2.34 (2.12, 2.59) *** | 2256 (288) |
| Average Methylation † | ||
| cg05575921 | 0.70 (0.64, 0.76) *** | 2256 (288) |
| cg04987734 | 1.53 (1.40, 1.66) *** | 2256 (288) |
| Model † | Predictors | Harrell’s C | Pseudo R2 | IDI (95% CI) | NRI (95% CI) |
|---|---|---|---|---|---|
| 1 | Age, Sex | 0.742 | 0.105 | - | - |
| 2 | Model 1 + CHD | 0.755 | 0.113 | 0.0052 (−0.0011, 0.0201) | 0.157 (−0.0283, 0.261) |
| 3 | Model 1 + COPD | 0.752 | 0.116 | 0.0164 (0.0041, 0.0424) | 0.0784 (−0.168, 0.136) |
| 4 | Model 1 + Diabetes | 0.748 | 0.109 | 0.0002 (−0.0033, 0.0062) | 0.0820 (−0.0140, 0.150) |
| 5 | Model 1 + Stroke | 0.753 | 0.116 | 0.0157 (0.0021, 0.0361) | 0.0313 (−0.163, 0.145) |
| 6 | Model 1 + Dementia | 0.744 | 0.108 | 0.0018 (−0.0028, 0.0156) | −0.0590 (−0.249, 0.0404) |
| 7 | Model 1 + LEA | 0.760 | 0.119 | 0.0149 (0.0055, 0.0312) | 0.272 (0.160, 0.343) |
| 8 | Model 1 + cg04987734 | 0.754 | 0.114 | 0.0129 (0.0007, 0.0304) | 0.141 (−0.0409, 0.226) |
| 9 | Model 1 + cg05575921 | 0.774 | 0.130 | 0.0290 (0.0117, 0.0527) | 0.237 (0.147, 0.320) |
| 10 | Model 1 + cg04987734, cg05575921 | 0.779 | 0.135 | 0.0391 (0.0168, 0.0788) | 0.264 (0.152, 0.349) |
| 11 | Model 1 + LEA, cg04987734, cg05575921 | 0.787 | 0.142 | 0.0473 (0.0249, 0.0771) | 0.313 (0.204, 0.396) |
| 12 | Model 1 + CHD, COPD, Diabetes, Stroke, Dementia | 0.779 | 0.139 | 0.0352 (0.0151, 0.0711) | 0.277 (0.152, 0.374) |
| 13 | Model 1 + CHD, COPD, Diabetes, Stroke, Dementia, LEA | 0.788 | 0.151 | 0.0578 (0.0331, 0.0980) | 0.286 (0.195, 0.390) |
| 14 | Model 1 + CHD, COPD, Diabetes, Stroke, Dementia, cg05575921 | 0.801 | 0.161 | 0.0681 (0.0394, 0.117) | 0.326 (0.262, 0.417) |
| 15 | Model 1 + CHD, COPD, Diabetes, Stroke, Dementia, cg04987734, cg05575921 | 0.806 | 0.167 | 0.0836 (0.0528, 0.138) | 0.329 (0.257, 0.435) |
| 16 | Model 1 + CHD, COPD, Diabetes, Stroke, Dementia, LEA, cg04987734, cg05575921 | 0.810 | 0.173 | 0.0946 (0.0603, 0.145) | 0.358 (0.271, 0.451) |
| Predictors | z-Value | HR (95% CI) |
|---|---|---|
| Age at Intake † | 5.77 | 1.72 (1.43, 2.07) *** |
| Sex | ||
| Male vs. Female | 1.43 | 1.20 (0.94, 1.53) |
| CHD | ||
| Yes vs. No | 4.47 | 1.85 (1.41, 2.42) *** |
| COPD | ||
| Yes vs. No | 5.20 | 3.25 (2.09, 5.07) *** |
| Diabetes | ||
| Yes vs. No | 1.60 | 1.27 (0.95, 1.71) |
| Stroke | ||
| Yes vs. No | 6.38 | 3.10 (2.19, 4.39) *** |
| Dementia | ||
| Present vs. None | 2.90 | 3.37 (1.48, 7.69) ** |
| LEA † | 4.01 | 1.44 (1.20, 1.72) *** |
| Average Methylation † | ||
| cg05575921 | −6.45 | 0.71 (0.64, 0.79) *** |
| cg04987734 | 3.83 | 1.21 (1.10, 1.34) ** |
© 2019 by the authors. Licensee MDPI, Basel, Switzerland. This article is an open access article distributed under the terms and conditions of the Creative Commons Attribution (CC BY) license (http://creativecommons.org/licenses/by/4.0/).
Share and Cite
Mills, J.A.; Beach, S.R.H.; Dogan, M.; Simons, R.L.; Gibbons, F.X.; Long, J.D.; Philibert, R. A Direct Comparison of the Relationship of Epigenetic Aging and Epigenetic Substance Consumption Markers to Mortality in the Framingham Heart Study. Genes 2019, 10, 51. https://0-doi-org.brum.beds.ac.uk/10.3390/genes10010051
Mills JA, Beach SRH, Dogan M, Simons RL, Gibbons FX, Long JD, Philibert R. A Direct Comparison of the Relationship of Epigenetic Aging and Epigenetic Substance Consumption Markers to Mortality in the Framingham Heart Study. Genes. 2019; 10(1):51. https://0-doi-org.brum.beds.ac.uk/10.3390/genes10010051
Chicago/Turabian StyleMills, James A., Steven R.H. Beach, Meeshanthini Dogan, Ron L. Simons, Frederick X. Gibbons, Jeffrey D. Long, and Robert Philibert. 2019. "A Direct Comparison of the Relationship of Epigenetic Aging and Epigenetic Substance Consumption Markers to Mortality in the Framingham Heart Study" Genes 10, no. 1: 51. https://0-doi-org.brum.beds.ac.uk/10.3390/genes10010051