Article

Genome-Wide Identification and Expression Profiling of Sugar Transporter Protein (STP) Family Genes in Cabbage (Brassica oleracea var. capitata L.) Reveals their Involvement in Clubroot Disease Responses

Jiangsu Key Laboratory for Horticultural Crop Genetic Improvement, Institute of Vegetable Crops, Jiangsu Academy of Agricultural Sciences, Nanjing 210014, China
*
Author to whom correspondence should be addressed.
Submission received: 9 December 2018 / Revised: 12 January 2019 / Accepted: 18 January 2019 / Published: 21 January 2019
(This article belongs to the Section Plant Genetics and Genomics)

Abstract

:
Sugar transporter protein (STP) genes are involved in multiple biological processes, such as plant responses to various stresses. However, systematic analysis and functional information of STP family genes in Brassica oleracea are very limited. A comprehensive analysis was carried out to identify BoSTP genes and dissect their phylogenetic relationships and to investigate the expression profiles in different organs and in response to the clubroot disease. A total of 22 BoSTP genes were identified in the B. oleracea genome and they were further classified into four clades based on the phylogenetic analysis. All the BoSTP proteins harbored the conserved sugar transporter (Sugar_tr, PF00083) domain, and the majority of them contained 12 transmembrane helices (TMHs). Rates of synonymous substitution in B. oleracea relative to Arabidopsis thaliana indicated that STP genes of B. oleracea diverged from those of A. thaliana approximately 16.3 million years ago. Expression profiles of the BoSTP genes in different organs derived from RNA-Seq data indicated that a large number of the BoSTP genes were expressed in specific organs. Additionally, the expression of BoSTP4b and BoSTP12 genes were induced in roots of the clubroot-susceptible cabbage (CS-JF1) at 28 days after inoculation with Plasmodiophora brassicae, compared with mock-inoculated plants. We speculated that the two BoSTPs might be involved in monosaccharide unloading and carbon partitioning associated with P. brassicae colonization in CS-JF1. Subcellular localization analysis indicated that the two BoSTP proteins were localized in the cell membrane. This study provides insights into the evolution and potential functions of BoSTPs.

1. Introduction

Sugars (e.g., monosaccharides, sucrose, and polyols) act as carbohydrate molecules, main energy sources, precursors of cellular compounds, and signaling molecules for signal transduction as well as environmental stress responses, which are important for plant growth and development [1,2,3,4]. Sugars are mainly synthesized in leaves (source organs) and then translocated via phloem sap into the sink organs, such as modified leaves, roots, seeds, fruits, and other reproductive organs [5,6]. In plants, sugar transport is mediated by monosaccharide transporters (MSTs) and sucrose transporters (SUTs) and sugars will eventually be exported transporters (SWEETs) [7,8]. The sucrose can be transported from the phloem to sink cells via a symplastic pathway or an apoplastic pathway [6]. Apart from sucrose, the transport of glucose and fructose, which are hydrolyzed from the sucrose in the apoplast, is regulated by sugar transporter proteins (STPs) and hexose transporters (HTs) [9,10].
Sugar transporter proteins, belonging to the MST superfamily, commonly contain 12 transmembrane helices (TMHs) and are localized in the cell membrane [11]. Sugar transporter proteins are also regarded as H+/sugar symporters and can transport fructose, glucose, galactose, mannose, and xylose [12]. With the rapid development of whole-genome sequences, genome-wide identification of STP genes in various plant species have been reported, such as Arabidopsis thaliana [12], cassava (Manihot esculenta) [13], grape (Vitis vinifera) [14], rice (Oryza sativa) [15], tomato (Solanum lycopersicum) [16], pear (Pyrus bretschneideri Rehd) [17], and woodland strawberry (Fragaria vesca) [18]. In Arabidopsis, a total of 14 STP proteins (AtSTP1-14) have been identified and they were found to mediate the uptake of hexoses from the apoplastic space across the cell membrane [19,20]. In addition, AtSTP1 is the first monosaccharide transporter identified and it is expressed in guard cells of cotyledons, rosette leaves, sepals, ovaries, and stems [21,22]. Heterologous expression indicated that AtSTP1 protein is a high-affinity monosaccharide/H+ symporter and is able to transport a suite of hexoses, but not fructose [23]. Moreover, AtSTP4 protein is also a high-affinity hexose transporter and the AtSTP4 gene is expressed in leaves, root tips, and pollen tubes. The expression level of AtSTP4 is strongly increased in response to pathogen attack and wounding [24]. Furthermore, in response to powdery mildew infection, the AtSTP4 and the invertase gene, Atβfruct1, are coordinately expressed [25]. In addition, among the 14 characterized AtSTP proteins, all of them are high-affinity hexose transporters except AtSTP3, which is a low-affinity hexose transporter and is expressed in green leaves, but not in a sink organ [19]. Interestingly, the expression of the AtSTP3 gene is also induced by pathogen attack and wounding [20]. Although the expression profiles and functional analysis of AtSTP genes in Arabidopsis have been explored, the extensive expression profiles of the BoSTP genes in cabbage remain poorly characterized.
Cabbage (Brassica oleracea var. capitata L.) is one of the most economically important leafy vegetables worldwide. The harvested area of cabbages and other Brassicas was 2,513,707 ha in 2017, with an annual yield of 71.45 million tons [26]. Clubroot disease is a soil-borne disease caused by the obligate biotrophic protest, Plasmodiophora brassicae. Plasmodiophora brassicae can infect almost all Brassicaceae crops, and is one of the most devastating plant diseases in the world [27,28]. Clubroot disease is known to occur in more than 60 countries and results in a 10–15% reduction in yields on a global scale [27]. It is estimated that 3.2–4.0 million ha of Brassicaceae crops are infected by clubroot pathogen annually, accounting for more than one third of the total cultivation regions of Brassicaceae crops [29]. The life cycle of P. brassicae consists of three distinct stages: The survival of resting spores in the soil, the primary infection (root hair infection), and the secondary infection (root cortex infection) [30,31,32]. The survival resting spores germinate to release the primary zoospores and penetrate the root hairs to form primary plasmodia [33]. The primary plasmodia undergo a series of cell divisions to form secondary zoospores [34]. Then, the secondary zoospores form multinucleate secondary plasmodia within the root cortex, which leads to cell hypertrophy and hyperplasia in the cortex and stele, resulting in the development and formation of galls. Finally, after the galls disintegrate, the resting spores cleaved from the secondary plasmodia are released into the soil to complete the disease cycle [35]. The resting spores can survive in the soil for 6–12 years, making this clubroot disease hard to control once the soil is contaminated [36].
In this study, we performed a genome-wide analysis of the STP family genes in B. oleracea, and shed light on their gene structure, chromosomal localization, transmembrane regions, and conserved motifs. The expression profiles of BoSTP genes in different organs and in response to clubroot disease were analyzed using the RNA-Seq data, in an attempt to understand their possible roles in clubroot disease resistance.

2. Materials and Methods

2.1. Identification of Sugar Transporter Proteins in Brassica oleracea

The B. oleracea genome sequence, downloaded from the B. oleracea genome database (http://ocri-genomics.org/bolbase/), was used to identify the BoSTP genes [37]. The genome sequence of Brassica rapa was obtained from the Brassica database (http://brassicadb.org/brad/) [38]. The AtSTP gene sequences, downloaded from The Arabidopsis Information Resource (TAIR) database (http://www.arabidopsis.org/), were used as the seed sequences to search the orthologous and syntenic paralogous STP genes in B. oleracea and B. rapa using the online tool (http://brassicadb.org/brad/searchSyntenytPCK.php). The hmmscan tool [39] with the ‘gathering threshold’ and the SMART tool [40] were then used to predict the functional domains of the potential STP proteins. The identified STPs without the Sugar_tr domain (PF00083) were filtered out. The naming of STP proteins from B. oleracea and B. rapa was based on sequence similarity to the corresponding AtSTPs.

2.2. Characterization and Phylogenetic Analysis of BoSTPs

The ProtParam tool (https://web.expasy.org/protparam/) was used to analyze the physical and chemical parameters of the BoSTP proteins, including the molecular weight, theoretical isoelectric point (pI), instability index, aliphatic index, and grand average of hydropathicity (GRAVY). The Gene Structure Display Server 2.0 (GSDS 2.0, http://gsds.cbi.pku.edu.cn/) was used to generate a schematic diagram of the exon and intron organization by comparing the genome sequence and the corresponding coding sequence (CDS) of each BoSTP gene [41]. Multiple alignment of BoSTP, BrSTP, and AtSTP protein sequences was performed using ClustalW [42], and the maximum likelihood (ML) phylogenetic tree was constructed using MEGA7 with the bootstrap of 1000 replicates [43].

2.3. Chromosomal Localization and the Calculation of Ka/Ks

The MapChart 2.30 software [44] was used to determine the chromosomal localization of the BoSTP genes. The online tool (http://brassicadb.org/brad/searchSyntenytPCK.php) was used to identify orthologs and paralogs of the STP genes in B. oleracea and B. rapa [45]. The relationships of orthologs and paralogs were plotted using the Circos software [46]. To check whether positive selection has driven the evolution of STP genes, the synonymous substitution rate (Ks) and nonsynonymous substitution rate (Ka) values of orthologous genes were calculated using the DnaSP 6 software [47]. A Ka/Ks ratio greater than 1 indicates a positive selection of the gene pairs, less than 1 indicates a purifying selection, while approximately equal to 1 indicates a neutral evolution. The Ks values of syntenic orthologs between BoSTPs and AtSTPs were plotted as the density using an R package [48]. The divergence time was computed as T = Ks/(2 × 1.5 × 10−8) × 10−6 million years ago (MYA) [49].

2.4. Prediction of TMH, Putative Functional Domain, and Subcellular Localization

The TMHs of BoSTP proteins were predicted by the TMHMM Server v. 2.0 (http://www.cbs.dtu.dk/services/TMHMM/). The putative functional domains of the identified BoSTP proteins were predicted by hmmscan [39] and SMART [40]. The subcellular localization of STP proteins was predicted using Plant-mPLoc [50].

2.5. Expression Profile Analysis of BoSTP Genes

To analyze the expression profiles of BoSTP genes in different organs and in response to P. brassicae infection, RNA-Seq data of GSE42891 (GEO database) submitted by Liu et al. [37] and PRJNA453960 (BioProject accession) submitted by Chinese Academy of Agricultural Sciences (CAAS) were downloaded from the National Center for Biotechnology Information (NCBI, https://0-www-ncbi-nlm-nih-gov.brum.beds.ac.uk/). The GSE42891 dataset included gene expression profiles of seven different organs (bud, callus, flower, leaf, root, silique, and stem) in cabbage homozygous line 02-12 [37]. The PRJNA453960 dataset contained gene expression profiles of roots in clubroot-resistant cabbage Xiangan336 (CR-XG336) and clubroot-susceptible cabbage Jingfeng No. 1 (CS-JF1) after the inoculation with P. brassicae spores suspended in water at 7 (primary infection stage) and 28 (clubroot formation stage) days after inoculation (DAI), respectively. Furthermore, the corresponding root samples at 7 DAI and 28 DAI without inoculation were sampled as mock controls. Raw RNA-Seq reads with three biological replicates from the PRJNA453960 dataset were processed to trim the adapter and low-quality sequences using Trimmomatic [51]. The high-quality reads were aligned to the B. oleracea genome database using HISAT [52] allowing up to 3 edit distances. Following the alignments, raw counts for each gene were derived and normalized into FPKM (fragments per kilobase of exon model per million mapped fragments). Raw count data was then fed to DESeq2 [53] to identify differentially expressed genes with a cutoff of fold change >2 and FDR <0.05. The heatmap of BoSTPs expression profiles was generated using the R package pheatmap (http://rpackages.ianhowson.com/cran/pheatmap/) based on the log2 transformed FPKM values.

2.6. Subcellular Localization Analysis of BoSTPs in Tobacco

To investigate the subcellular localization of BoSTPs, transient transformation of translational GFP fusion vectors into tobacco leaf epidermal cells was used. The full-length CDS of BoSTP4b and BoSTP12 genes were amplified with the forward primer containing a Sma I restriction site and the reverse primer containing a Xba I restriction site. The primer sequences are listed in Supplementary File S1. The reaction mixture (50 µL) of the gene amplification consisted of 1 × PCR buffer (final concentrations, 10 mM Tris-HCl, 2.5 mM MgCl2, and 50 mM KCl [pH 8.3]), 0.2 mM dNTP, 0.5 µM forward and reverse primer, 50 ng of cDNA template and 2.5 U of Taq DNA polymerase (TaKaRa, Dalian, China). The amplification was performed at 95 °C for 3 min, followed by 35 cycles of 94 °C for 30 s, 56 °C for 30 s, and 72 °C for 50 s, with a final extension at 72 °C for 7 min and hold at 4 °C. The amplification products were digested with Sma I and Xba I, and ligated into the pCAMBIA1300-35S-GFP (35S-GFP) vector for constructing the translational GFP fusion constructs. The recombined plasmids were then transformed into Agrobacterium tumefaciens strain GV3101 [54]. The methods of preparing A. tumefaciens for transient expression and infiltrating into tobacco epidermal cells were carried out according to the previous protocols [55]. Leaves transformed with the vector of 35S-GFP (GFP alone) was used as the control. The fluorescence and bright-light images of transiently infected tobacco leaves were observed under a fluorescence microscope (BX41, Olympus, Rungis, France) after 48 h of infiltration.

3. Results

3.1. Identification and Phylogenetic Analysis of STPs in Brassica oleracea, Brassica rapa, and Arabidopsis thaliana

In the present study, a total of 22 BoSTP proteins and 22 BrSTP proteins were identified in the B. oleracea and B. rapa genomes, respectively (Supplementary File S2). These proteins were named BoSTP1 to BoSTP14 and BrSTP1 to BrSTP14, respectively, according to their A. thaliana homologs (Table 1). An unrooted phylogenetic tree of 58 STP proteins from B. oleracea, B. rapa, and A. thaliana was constructed to elucidate their evolutionary relationships (Figure 1). Phylogenetic analysis revealed that these STP proteins could be divided into four distinct clades (I–IV), and the BoSTPs were grouped with AtSTPs and BoSTPs in each clade. The clade I, II, III, and IV contained 14, 16, 15, and 13 members, respectively. Physical and chemical characteristics of BoSTP proteins were predicted. The length of the BoSTP proteins ranged from 345 amino acids (AA, BoSTP14) to 532 AA (BoSTP13b), with the corresponding open reading frames (ORFs) ranging from 1038 bp to 1599 bp (Table 1). The molecular weights ranged from 38.33 kDa (BoSTP14) to 58.04 kDa (BoSTP13b), and the theoretical isoelectric points (pI) ranged from 5.79 (BoSTP11) to 9.31 (BoSTP13a) (Table 1). In addition, the instability index, aliphatic index and GRAVY of BoSTP proteins ranged from 30.06 to 45.45, 97.50 to 112.94, and 0.45 to 0.69, respectively (Table 1).

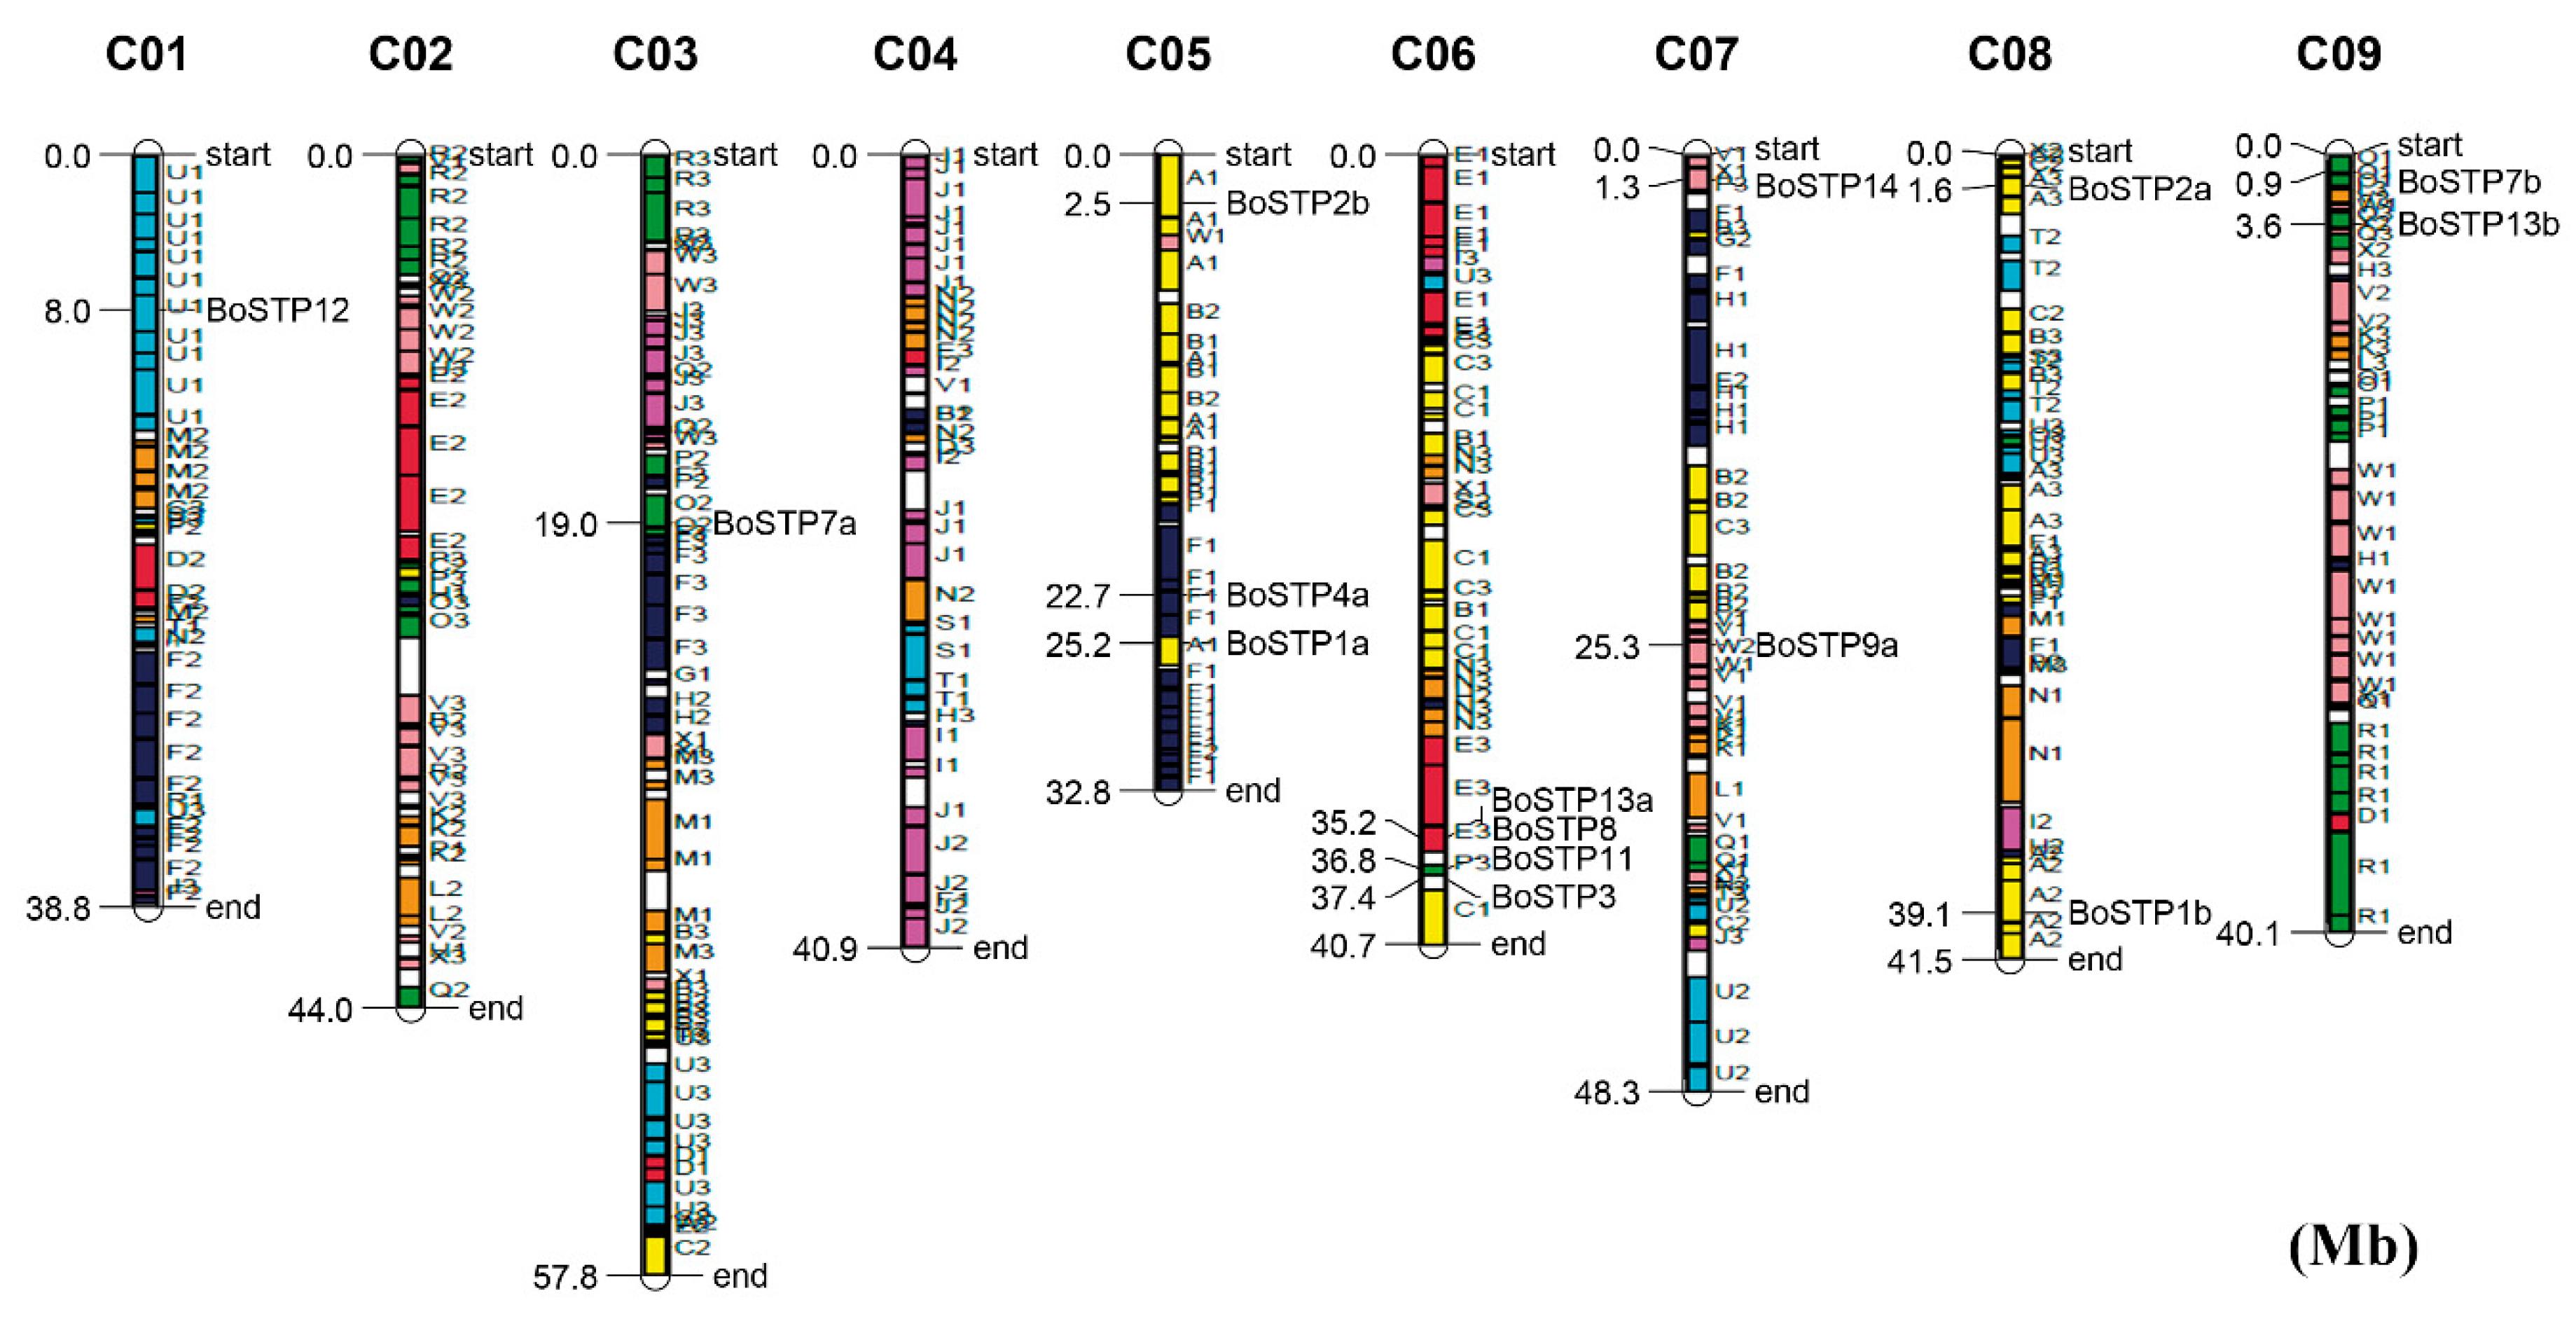
3.2. Chromosomal Distribution of BoSTP Genes

The BoSTP genes were distributed across the three sub-genomes (LF, the least fractionated blocks of Brassica; MF1, the medium fractionated blocks of Brassica; MF2, the most fractionated blocks of Brassica), with 12 BoSTP genes in LF, six in MF1, and four in MF2 (Table 1). Interestingly, all the STP genes were retained in B. oleracea after whole-genome triplication (WGT) and fractionation. In total, half of the BoSTP genes (7/14) were retained in one copy, while six BoSTP genes (BoSTP1, BoSTP2, BoSTP4, BoSTP7, BoSTP9, and BoSTP13) and only one (BoSTP6) from B. oleracea were retained in two and three copies, respectively (Table 1). The retained gene copies had the same conserved collinear blocks. In addition, according to the chromosomal localization of BoSTP genes (Figure 2), a total of 15 BoSTP genes (68.2%) were distributed across the nine chromosomes (C01-C09), with the exception of chromosomes C02 and C04, which had no members, and with the most (four) on chromosome C06 (Figure 2). Furthermore, seven BoSTP genes (BoSTP4b, BoSTP5, BoSTP6a, BoSTP6b, BoSTP6c, BoSTP9b, and BoSTP10) were not anchored on any of the B. oleracea chromosomes. The identified orthologous and paralogous STP genes were used to analyze the syntenic relationship between BoSTP and BrSTP genes. A total of 24 orthologous STP gene pairs between B. oleracea and B. rapa were identified (Figure 3). In addition, four and eight paralogous STP gene pairs were identified in B. oleracea and B. rapa, respectively.

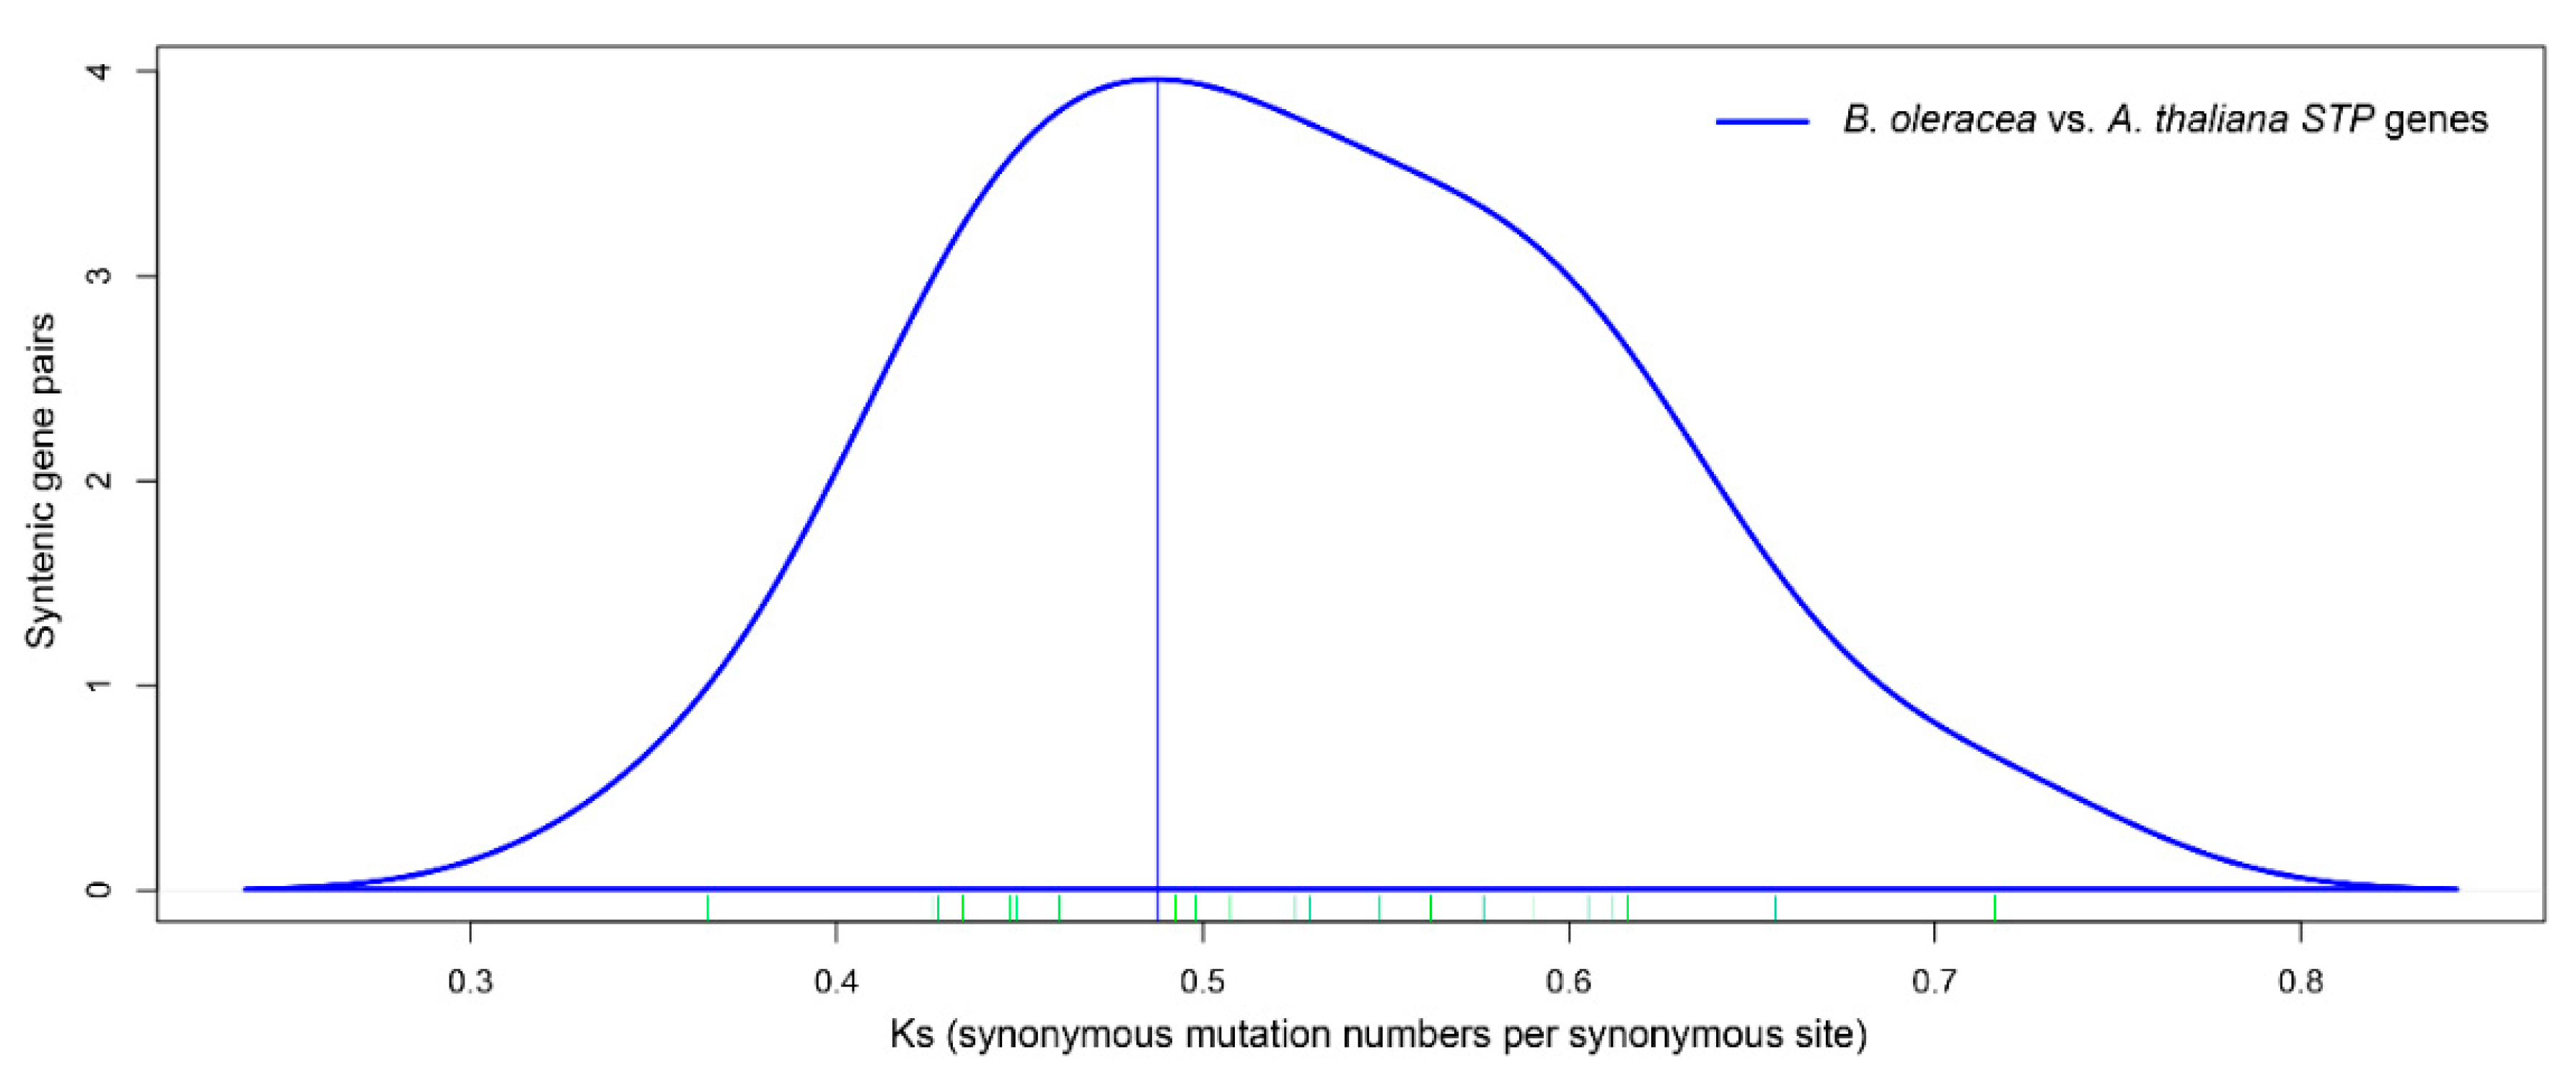
3.3. Ka and Ks Calculation of Orthologous STPs between Brassica oleracea and Arabidopsis thaliana

According to the 22 syntenic STP orthologous pairs between B. oleracea and A. thaliana, the Ks and Ka values of these homologous genes were calculated by DnaSP 6 software (Table 2; Supplementary File S3). The Ka/Ks values of all the syntenic STP orthologous pairs were far less than 1, suggesting that these STP genes have undergone purifying selection. The Ks values of B. oleracea relative to A. thaliana ranged from 0.43 to 0.60 and concentrated at 0.49 (Figure 4), which indicated that these STP genes of B. oleracea diverged from A. thaliana approximately 16.3 MYA. We concluded that these STP genes diverged following the Brassica-specific WGT event that occurred approximately 13–17 MYA [38,56].

3.4. Gene Structures, TMHs, and Putative Functional Domains of BoSTP Proteins

The exon-intron organizations are thought to play critical roles in the evolution of multiple gene families [57]. To gain insights into the structural evolution of the BoSTP genes, the exon-intron boundaries were dissected. The results indicated that the number and distribution of exons and introns were highly conserved in BoSTP genes (Figure 5). A total of 16 (72.7%) BoSTP genes were found to have four exons and three introns, while five BoSTP members possessed three exons and two introns, and only BoSTP14 had two exons and one intron (Figure 5). The results suggested that the gain and loss of exons might result in functional diversity of closely related STP genes during the evolutionary process of the STP gene family. Due to the significance of the sugar transporter domain for the catalytic activity, the functional domains of 22 BoSTP proteins were predicted, which revealed that all the BoSTP proteins harbored a Sugar_tr domain (PF00083) belonging to the clan major facilitator superfamily (MFS; CL0015). In addition, all the BoSTP proteins except BoSTP14 harbored an MFS domain (MFS_1 domain; PF07690) (Supplementary File S4). Among these BoSTP proteins, 15 harbored 12 conserved TMHs, five harbored 11 TMHs, and BoSTP10 and BoSTP14 harbored 10 and eight TMHs, respectively (Figure 5c). The majority of BoSTP proteins contained 12 TMHs, which is a typical feature of MFS, suggesting the activities were related to substance transportation [58].

3.5. Prediction of cis-Acting Elements of BoSTP Genes

In this study, the 1500-bp promoter sequences of 14 BoSTP genes were obtained. For the remaining eight BoSTP genes, the obtained promoter sequences were shorter than 1500 bp due to the presence of other genes located <1500 bp upstream. The PlantCARE web tool (http://bioinformatics.psb.ugent.be/webtools/plantcare/html/) was used to predict the cis-acting elements. As shown in Table 3, a total of 17 cis-acting elements were predicted in the promoters of the 22 BoSTP genes. The common cis-acting elements included those responsive to distinct plant hormones (ABA, auxin, ethylene, gibberellin, meJA, and salicylic acid) and stress factors (anaerobic, drought, light, low temperature, and wound) (Table 3). Among these elements, eight common cis-acting elements, including ABRE, ARE, CGTCA-motif, ERE, G-box, GT1-motif, STRE, and TGACG-motif, were highly conserved.

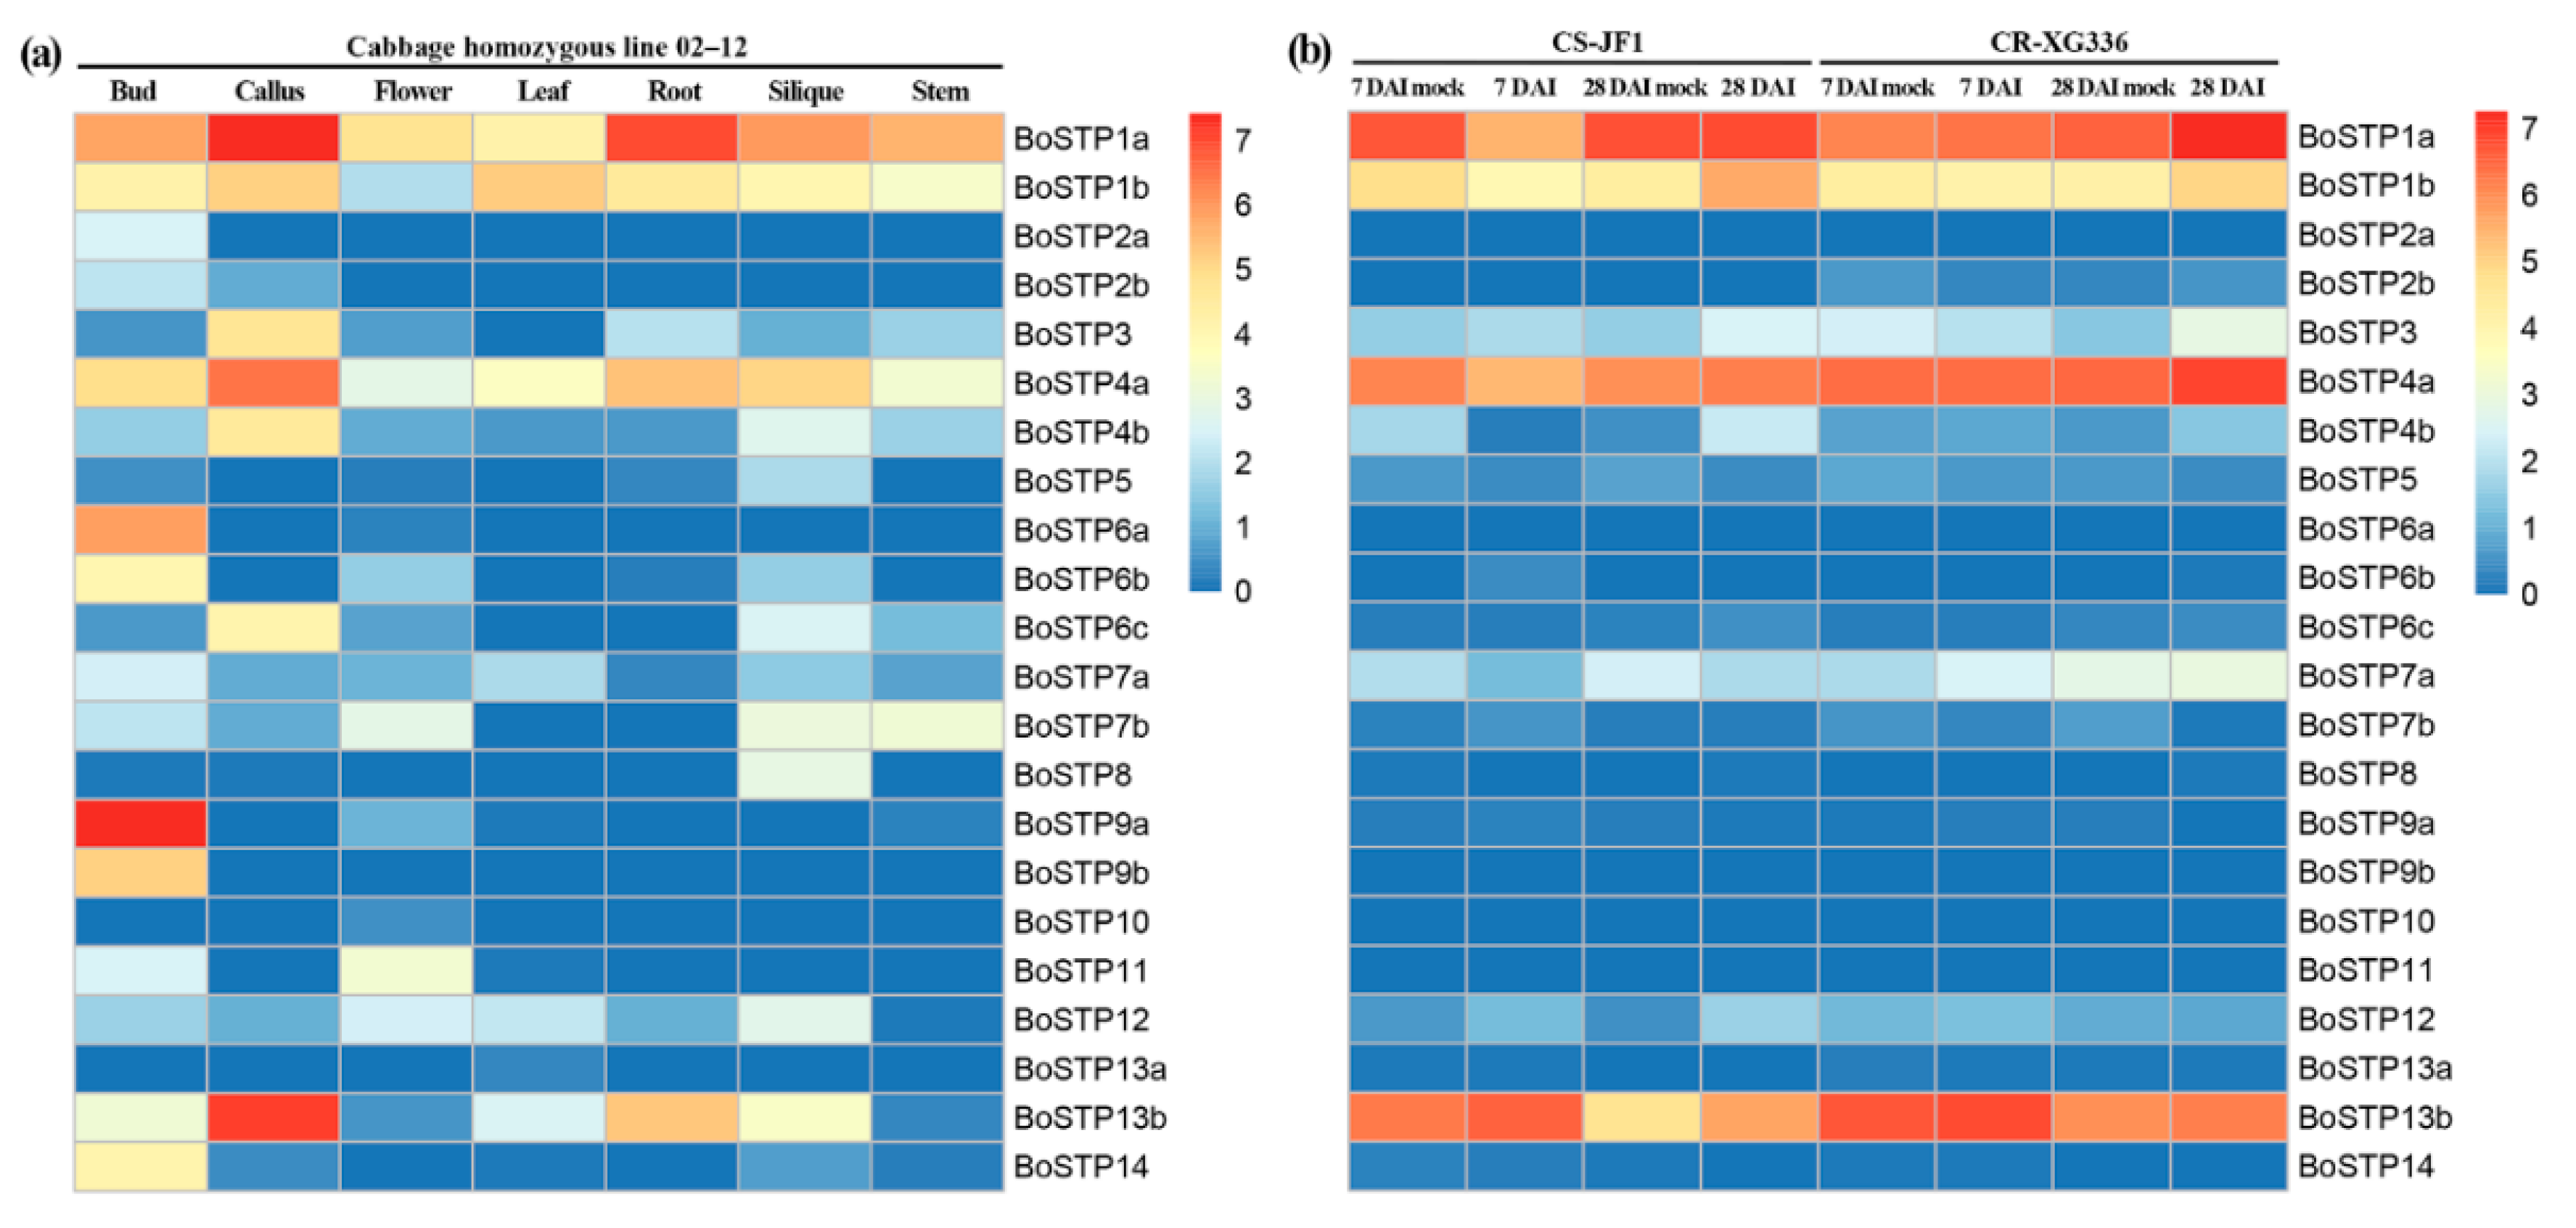
3.6. Expression Profiling of BoSTP Genes in Different Organs and in Response to P. brassicae Infection

Organ-specific gene expression can provide valuable information about the function of BoSTPs in different organs. Thus, the transcript levels of the BoSTP genes in the bud, callus, flower, leaf, root, silique, and stem of cabbage derived from the RNA-Seq dataset (GSE42891) were analyzed. The heatmap revealed that a large portion of BoSTP genes were organ-specific (Figure 6a; Supplementary File S5). For example, several BoSTP genes were expressed in only one or two organ types, such as BoSTP2a in buds, BoSTP13a in leaves, BoSTP2b in buds and calli, and BoSTP6a and BoSTP10 in buds and flowers (Figure 6a). A total of seven BoSTP genes were expressed in all the organs, including BoSTP1a, BoSTP1b, BoSTP4a, BoSTP4b, BoSTP7a, BoSTP12, and BoSTP13b. The diversity of the expression profiles of BoSTP genes suggested a broad range of biological functions during the growth and development of cabbage.
We also generated expression profiles of BoSTP genes in roots of CR-XG336 (clubroot-resistant line) and CS-JF1 (clubroot-susceptible line) infected by P. brassica, and observed the expression variation of BoSTP genes between the two different cultivars at two different infection stages (Figure 6b; Supplementary File S6). A total of five BoSTP genes (BoSTP2a, BoSTP6a, BoSTP9b, BoSTP10, and BoSTP11) were undetectable in both CR-XG336 and CS-JF1 under the two infection stages. In CS-JF1, compared with mock-inoculated plants, two BoSTPs (BoSTP4b and BoSTP12) and two BoSTPs (BoSTP1a and BoSTP1b) were significantly up- and down-regulated at 7 DAI and 28 DAI, respectively. No BoSTP genes were significantly up- or down-regulated in CR-XG336 at 7 DAI compared with mock-inoculated plants (Figure 6b; Supplementary File S6). Moreover, only the BoSTP3 gene was significantly up-regulated in CR-XG336 after infection at 28 DAI (Figure 5b; Supplementary File S6).

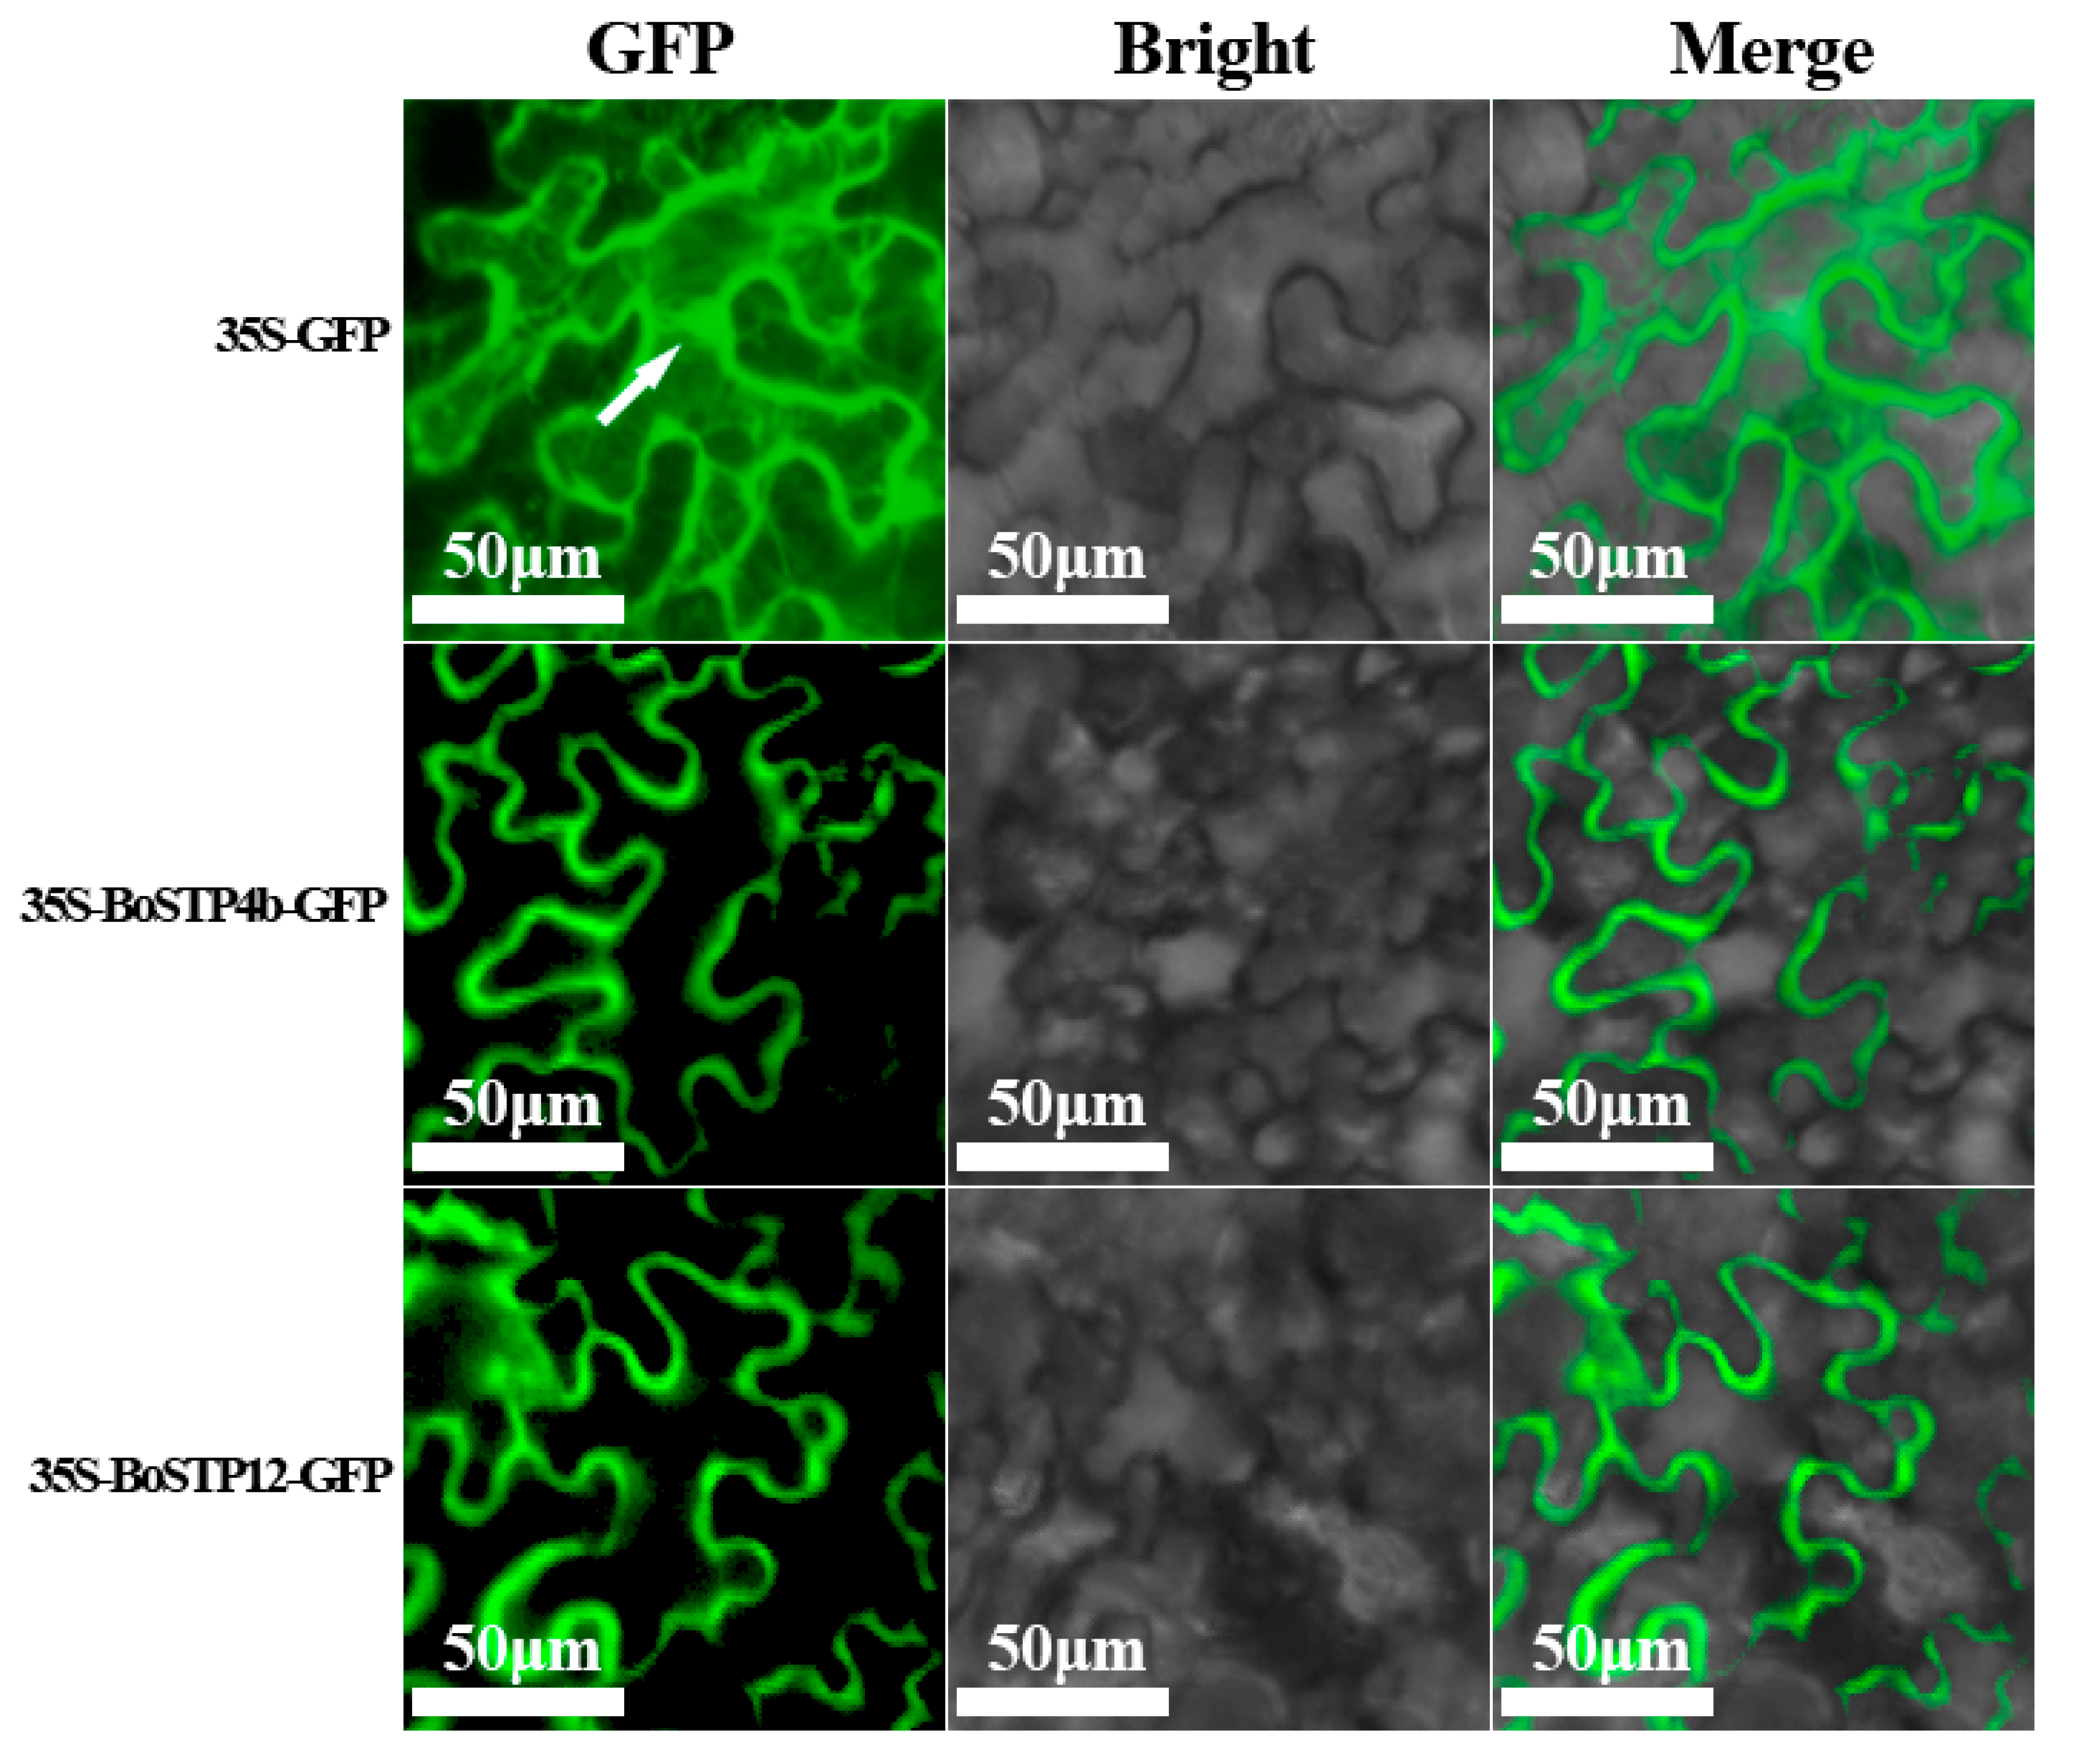
3.7. Subcellular Localization Analysis of BoSTP Proteins in Tobacco

In silico subcellular localization prediction using Plant-mPLoc [50] suggested that all the BoSTP proteins were localized in the cell membrane. To further characterize the subcellular localization of BoSTP proteins, BoSTP4b and BoSTP12 translational GFP fusion proteins were heterologously and transiently expressed in tobacco leaf epidermal cells. The GFP signal in epidermal cells transfected with the 35S-GFP was mainly found in the cell membrane, cytoplasm, and nucleus (Figure 7), whereas the GFP signals in epidermal cells transfected with 35S-BoSTP4b-GFP and 35S-BoSTP12-GFP fusion proteins were detected in the cell membrane (Figure 6), suggesting that the two BoSTPs are membrane proteins, consistent with the in silico prediction results.

4. Discussion

The availability of the B. oleracea genome sequence has provided great opportunity to explore the STP gene family members, and to investigate their phylogenetic relationships and potential functional roles. The STP gene family is widely distributed in the plant kingdom and plays critical roles in sugar transport, plant growth, and plant responses to pathogen attack and wounding [12,25,59]. To our knowledge, no systematic investigations on the STP gene family of B. oleracea have been reported, and the expression profiles and functional significances of the BoSTP genes should be further investigated.
In this study, we found that the number of STP genes among B. oleracea, B. rapa, and A. thaliana was variable, with 14 genes in A. thaliana and 22 in both B. oleracea and B. rapa. The number of BoSTP and BrSTP genes were more than that of AtSTP genes, possibly due to the Brassica-specific WGT and fractionation events [38]. Gene duplication is considered as a primary driving force for evolution, resulting in functional divergence and diversification [60,61]. In this study, we found evidence of gene replication and gene loss during polyploid speciation in the B. oleracea genome. After the split from A. thaliana, there were seven BoSTP genes with one separate orthologous gene, six BoSTP genes with two separate orthologous genes, and only one BoSTP6 gene with three separate orthologous genes (Table 1; Figure 1). These results may indicate functional redundancy among several BoSTP genes.
To investigate the extent of gene fractionation in sub-genomes of B. oleracea relative to A. thaliana, three sub-genomes of B. oleracea were established [37]. In this investigation, a total of 12 BoSTP genes belonged to the LF sub-genome, six belonged to the MF1 sub-genome, and four belonged to the MF2 sub-genome (Table 1). The results indicated that the LF sub-genome contains the most BoSTP genes, consistent with that the LF sub-genome retains 70% of the genes found in A. thaliana [38]. All the BoSTP proteins harbored the Sugar_tr domain, and the majority of BoSTP proteins contained 12 TMHs, a typical feature of the major facilitator superfamily (MFS). The 12-TMH structure of STP proteins has evolved from an ancestral six-TMH transporter following gene duplication and fusion [58]. The STP family members belonging to MFS transporters generally possess a large central loop within the two transmembrane domains, the N-domain (TMH1–TMH6) and the C-domain (TMH7–TMH12) [11,14], and transmembrane transport is driven by the proton motive force [62]. A total of 17 cis-acting elements responsive to plant hormones and various stresses were predicted in the upstream sequences of the 22 BoSTP genes. Furthermore, the identified cis-acting elements, such as G-box, GT1-motif, and MRE, were transcriptionally regulated under light responsiveness, consistent with the functions of STP genes in sugar allocation between sink and source organs [17]. The STP genes play critical roles in the distribution of monosaccharides, which were found to be involved in various metabolic processes during plant growth and development [63].
For the BoSTP gene members, we were particularly interested in those that might play crucial roles in clubroot disease responses. Previous studies revealed that P. brassicae obtains sugars from hosts to complete its life cycle, involving the development and formation of galls, which act as an additional sink [64]. In A. thaliana, it has been found that sucrose accumulates in uninfected leaves, but not in P. brassicae infected leaves because sucrose is exported from leaves into the clubroot galls [65]. The expression of sugar transporter genes may therefore influence plant-P. brassicae interactions. In this study, the RNA-Seq dataset (PRJNA453960) of cabbage were further analyzed for dissecting the expression profiles of the BoSTP genes. The expression of BoSTP4b and BoSTP12 were up-regulated in roots of the susceptible CS-JF1 upon P. brassicae inoculation at the clubroot formation stage (28 DAI) compared with mock-inoculated plants (Figure 5; Supplementary File S6). We inferred that the two BoSTP genes might play roles in sugar partitioning of clubroot-induced gall development and formation in CS-JF1. In Arabidopsis, the expression of the hexose transporter gene, AtSTP4, and the cell wall invertase gene, Atβfruct1, are induced after the powdery mildew infection. At the meantime, the uptake of glucose in host organs is enhanced substantially. The coordinated expression of AtSTP4 and Atβfruct1 might functionally interact for the supply of sink organs with hexoses [25]. In addition, the expression of AtSTP8 (transporting hexose) and AtSTP13 (transporting galactose) are up-regulated after infection. AtSTP8 and AtSTP13 are associated with programmed cell death in pathogen defense and cell wall remodeling [20,64]. We also noted that the expression of the BoSTP3 gene was 3.68-fold higher in CR-XG336 at 28 DAI than in the mock-inoculated plants (Supplementary File S6). Whether this increased expression of BoSTP3 contributes to CR-XG336 resistance to P. brassicae infection remains to be established.

5. Conclusions

In this study, a total of 22 BoSTP genes were identified in the B. oleracea genome and they were further classified into four clades based on a phylogenetic tree of 58 STP homologs from B. oleracea, B. rapa, and A. thaliana. The length of the BoSTP proteins ranged from 345 to 532 AA, and the Ks values of the orthologous STP genes in B. oleracea relative to A. thaliana ranged from 0.43 to 0.60 and concentrated at 0.49, suggesting that the estimated time of B. oleracea diverged from A. thaliana was approximately 16.3 MYA. RNA-Seq data analysis of seven organs in cabbage indicated that a large number of BoSTP genes exhibited organ-specific expression. The expression of two BoSTP genes (BoSTP4b and BoSTP12) were up-regulated in CS-JF1 at 28 DAI with P. brassicae infection compared with mock-inoculated plants, and we hypothesized that they might be involved in monosaccharide unloading and partitioning for the clubroot development and formation during P. brassicae colonization. These results help to understand the characteristics of BoSTP genes and their potential functions in regulating monosaccharide distribution during the clubroot disease responses in cabbage.

Supplementary Materials

The following are available online at https://0-www-mdpi-com.brum.beds.ac.uk/2073-4425/10/1/71/s1, Supplementary File S1: Primers used in this study; Supplementary File S2: Amino acid sequences of 58 STP proteins from B. oleracea, B. rapa and A. thaliana; Supplementary File S3: Nucleotide sequences of 58 STP genes without stop codons of B. oleracea, B. rapa and A. thaliana; Supplementary File S4: Predicted functional domains of BoSTP proteins; Supplementary File S5: Expression of BoSTP genes in different organs including bud, callus, flower, leaf, root, silique and stem in homozygous cabbage line 02-12; Supplementary File S6: Expression of BoSTP genes in roots of clubroot-resistant and susceptible cabbage lines at two different P. brassicae infection stages.

Author Contributions

J.L. conceived the and supervised the work. W.Z. did bioinformatics analyses and drafted the manuscript. F.Y., L.Y. and H.W. performed the experiments. S.W. and J.T. processed the transcriptome data. All authors read and approved the final manuscript.

Funding

This work was in part supported by the China Postdoctoral Science Foundation (2017M621669), National Natural Science Foundation of China (31701773), National Key Research and Development Program of China (2016YFD0101702), Key Research and Development Program of Jiangsu Province (BE2017379), Jiangsu Agriculture Science and Technology Innovation Fund (CX(18)2006) and National Modern Agriculture Industry Technology System (CARS-25).

Acknowledgments

The authors gratefully acknowledge Zhangjun Fei for his helpful advice and RNA-Seq data analysis.

Conflicts of Interest

The authors declare that they have no competing interests for this research.

References

  1. Rolland, F.; Baenagonzalez, E.; Sheen, J. Sugar sensing and signaling in plants: Conserved and novel mechanisms. Annu. Rev. Plant Biol. 2006, 57, 675–709. [Google Scholar] [CrossRef] [PubMed]
  2. Hellmann, H.A.; Smeekens, S. Sugar sensing and signaling in plants. Front. Plant Sci. 2014, 5, 113. [Google Scholar]
  3. Ramon, M.; Rolland, F.; Sheen, J. Sugar sensing and signaling. Arab. Book 2008, 6, e0117. [Google Scholar] [CrossRef] [PubMed]
  4. Walmsley, A.R.; Barrett, M.P.; Bringaud, F.; Gould, G.W. Sugar transporters from bacteria, parasites and mammals: Structure-activity relationships. Trends Biochem. Sci. 1998, 23, 476–481. [Google Scholar] [CrossRef]
  5. Lemoine, R.; La Camera, S.; Atanassova, R.; Dedaldechamp, F.; Allario, T.; Pourtau, N.; Bonnemain, J.; Laloi, M.; Coutosthevenot, P.; Maurousset, L. Source-to-sink transport of sugar and regulation by environmental factors. Front. Plant Sci. 2013, 4, 272. [Google Scholar] [CrossRef] [PubMed]
  6. Rennie, E.A.; Turgeon, R. A comprehensive picture of phloem loading strategies. Proc. Natl. Acad. Sci. USA 2009, 106, 14162–14167. [Google Scholar] [CrossRef] [PubMed] [Green Version]
  7. Chen, L.Q.; Hou, B.H.; Lalonde, S.; Takanaga, H.; Hartung, M.L.; Qu, X.Q.; Guo, W.J.; Kim, J.G.; Underwood, W.; Chaudhuri, B. Sugar transporters for intercellular exchange and nutrition of pathogens. Nature 2010, 468, 527–532. [Google Scholar] [CrossRef]
  8. Doidy, J.; Grace, E.; Kuhn, C.; Simonplas, F.; Casieri, L.; Wipf, D. Sugar transporters in plants and in their interactions with fungi. Trends Plant Sci. 2012, 17, 413–422. [Google Scholar] [CrossRef]
  9. Ludewig, F.; Flügge, U.I. Role of metabolite transporters in source-sink carbon allocation. Front. Plant Sci. 2013, 4, 231. [Google Scholar] [CrossRef]
  10. Sherson, S.M.; Alford, H.L.; Forbes, S.M.; Wallace, G.; Smith, S.M. Roles of cell-wall invertases and monosaccharide transporters in the growth and development of Arabidopsis. J. Exp. Bot. 2003, 54, 525–531. [Google Scholar] [CrossRef]
  11. Yan, N. Structural advances for the major facilitator superfamily (MFS) transporters. Trends Biochem. Sci. 2013, 38, 151–159. [Google Scholar] [CrossRef] [PubMed]
  12. Büttner, M. The Arabidopsis sugar transporter (AtSTP) family: An update. Plant Biol. 2010, 12, 35–41. [Google Scholar] [CrossRef] [PubMed]
  13. Liu, Q.; Dang, H.; Chen, Z.; Wu, J.; Chen, Y.; Chen, S.; Luo, L. Genome-wide identification, expression, and functional analysis of the sugar transporter gene family in Cassava (Manihot esculenta). Int. J. Mol. Sci. 2018, 19, 987. [Google Scholar] [CrossRef]
  14. Afoufabastien, D.; Medici, A.; Jeauffre, J.; Coutosthevenot, P.; Lemoine, R.; Atanassova, R.; Laloi, M. The Vitis vinifera sugar transporter gene family: Phylogenetic overview and macroarray expression profiling. BMC Plant Biol. 2010, 10, 245. [Google Scholar]
  15. Toyofuku, K.; Kasahara, M.; Yamaguchi, J. Characterization and expression of monosaccharide transporters (OsMSTs) in rice. Plant Cell Physiol. 2000, 41, 940–947. [Google Scholar] [CrossRef] [PubMed]
  16. Reuscher, S.; Akiyama, M.; Yasuda, T.; Makino, H.; Aoki, K.; Shibata, D.; Shiratake, K. The sugar transporter inventory of tomato: Genome-wide identification and expression analysis. Plant Cell Physiol. 2014, 55, 1123–1141. [Google Scholar] [CrossRef]
  17. Li, J.; Zheng, D.; Li, L.; Qiao, X.; Wei, S.; Bai, B.; Zhang, S.; Wu, J. Genome-wide function, evolutionary characterization and expression analysis of sugar transporter family genes in pear (Pyrus bretschneideri Rehd). Plant Cell Physiol. 2015, 56, 1721–1737. [Google Scholar] [CrossRef] [PubMed]
  18. Jiu, S.; Haider, M.S.; Kurjogi, M.M.; Zhang, K.; Zhu, X.; Fang, J. Genome-wide characterization and expression analysis of sugar transporter family genes in woodland strawberry. Plant Genome 2018, 11. [Google Scholar] [CrossRef]
  19. Büttner, M.; Truernit, E.; Baier, K.; Scholzstarke, J.; Sontheim, M.; Lauterbach, C.; Huss, V.A.R.; Sauer, N. AtSTP3, a green leaf-specific, low affinity monosaccharide-H+ symporter of Arabidopsis thaliana. Plant Cell Environ. 2000, 23, 175–184. [Google Scholar] [CrossRef]
  20. Büttner, M. The monosaccharide transporter (-like) gene family in Arabidopsis. FEBS Lett. 2007, 581, 2318–2324. [Google Scholar] [CrossRef]
  21. Sauer, N.; Friedländer, K.; Gräml-Wicke, U. Primary structure, genomic organization and heterologous expression of a glucose transporter from Arabidopsis thaliana. EMBO J. 1990, 9, 3045–3050. [Google Scholar] [CrossRef] [PubMed]
  22. Stadler, R.; Büttner, M.; Ache, P.; Hedrich, R.; Ivashikina, N.; Melzer, M.; Shearson, S.M.; Smith, S.M.; Sauer, N. Diurnal and light-regulated expression of AtSTP1 in guard cells of Arabidopsis. Plant Physiol. 2003, 133, 528–537. [Google Scholar] [CrossRef] [PubMed]
  23. Boorer, K.J.; Loo, D.; Wright, E.M. Steady-state and presteady-state kinetics of the H+/hexose cotransporter (STP1) from Arabidopsis thaliana expressed in Xenopus oocytes. J. Biol. Chem. 1994, 269, 20417–20424. [Google Scholar] [PubMed]
  24. Truernit, E.; Schmid, J.; Epple, P.; Illig, J.; Sauer, N. The sink-specific and stress-regulated Arabidopsis STP4 gene: Enhanced expression of a gene encoding a monosaccharide transporter by wounding, elicitors, and pathogen challenge. Plant Cell 1996, 8, 2169–2182. [Google Scholar] [CrossRef] [PubMed]
  25. Fotopoulos, V.; Gilbert, M.J.; Pittman, J.K.; Marvier, A.C.; Buchanan, A.J.; Sauer, N.; Hall, J.L.; Williams, L.E. The monosaccharide transporter gene, AtSTP4, and the cell-wall invertase, Atβfruct1, are induced in Arabidopsis during infection with the fungal biotroph Erysiphe cichoracearum. Plant Physiol. 2003, 132, 821–829. [Google Scholar] [CrossRef] [PubMed]
  26. FAO. Food and Agriculture Organization of the United Nations, Statistics Division. 2017. Available online: http://www.fao.org/faostat/en/#data (accessed on 20 November 2018).
  27. Dixon, G.R. The occurrence and economic impact of Plasmodiophora brassicae and clubroot disease. J. Plant Growth Regul. 2009, 28, 194–202. [Google Scholar] [CrossRef]
  28. Ludwigmuller, J.; Prinsen, E.; Rolfe, S.A.; Scholes, J.D. Metabolism and plant hormone action during clubroot disease. J. Plant Growth Regul. 2009, 28, 229–244. [Google Scholar] [CrossRef]
  29. Wang, J.; Huang, Y.; Li, X.L.; Li, H.Z. Research progress in clubroot of crucifers. Plant Prot. 2011, 37, 153–158. (In Chinese) [Google Scholar]
  30. Dixon, G.R. Clubroot (Plasmodiophora brassicae Woronin)—An agricultural and biological challenge worldwide. Can. J. Plant Pathol. 2014, 36, 5–18. [Google Scholar] [CrossRef]
  31. Gravot, A.; Deleu, C.; Wagner, G.; Lariagon, C.; Lugan, R.; Todd, C.D.; Wendehenne, D.; Delourme, R.; Bouchereau, A.; Manzanaresdauleux, M.J. Arginase induction represses gall development during clubroot infection in Arabidopsis. Plant Cell Physiol. 2012, 53, 901–911. [Google Scholar] [CrossRef]
  32. Zhang, H.; Feng, J.; Zhang, S.; Zhang, S.; Li, F.; Strelkov, S.E.; Sun, R.; Hwang, S.F. Resistance to Plasmodiophora brassicae in Brassica rapa and Brassica juncea genotypes from China. Plant Dis. 2014, 99, 776–779. [Google Scholar] [CrossRef]
  33. Feng, J.; Xiao, Q.; Hwang, S.F.; Strelkov, S.E.; Gossen, B.D. Infection of canola by secondary zoospores of Plasmodiophora brassicae produced on a nonhost. Eur. J. Plant Pathol. 2012, 132, 309–315. [Google Scholar] [CrossRef]
  34. Howard, R.J.; Strelkov, S.E.; Harding, M.W. Clubroot of cruciferous crops-new perspectives on an old disease. Can. J. Plant Pathol. 2010, 32, 43–57. [Google Scholar] [CrossRef]
  35. Rolfe, S.A.; Strelkov, S.E.; Links, M.G.; Clarke, W.E.; Robinson, S.J.; Djavaheri, M.; Malinowski, R.; Haddadi, P.; Kagale, S.; Parkin, I.A.P. The compact genome of the plant pathogen Plasmodiophora brassicae is adapted to intracellular interactions with host Brassica spp. BMC Genom. 2016, 17, 272. [Google Scholar] [CrossRef] [PubMed]
  36. Wallenhammar, A.C. Prevalence of Plasmodiophora brassicae in a spring oilseed rape growing area in central Sweden and factors influencing soil infestation levels. Plant Pathol. 1996, 45, 710–719. [Google Scholar] [CrossRef]
  37. Liu, S.; Liu, Y.; Yang, X.; Tong, C.; Edwards, D.; Parkin, I.A.P.; Zhao, M.; Ma, J.; Yu, J.; Huang, S. The Brassica oleracea genome reveals the asymmetrical evolution of polyploid genomes. Nat. Commun. 2014, 5, 3930. [Google Scholar] [CrossRef] [PubMed]
  38. Wang, X.; Wang, H.; Wang, J.; Sun, R.; Wu, J.; Liu, S.; Bai, Y.; Mun, J.; Bancroft, I.; Cheng, F. The genome of the mesopolyploid crop species Brassica rapa. Nat. Genet. 2011, 43, 1035–1039. [Google Scholar] [CrossRef]
  39. Finn, R.D.; Clements, J.; Eddy, S.R. HMMER web server: Interactive sequence similarity searching. Nucleic Acids Res. 2011, 39, 29–37. [Google Scholar] [CrossRef]
  40. Letunic, I.; Bork, P. 20 years of the SMART protein domain annotation resource. Nucleic Acids Res. 2018, 46, D493–D496. [Google Scholar] [CrossRef]
  41. Hu, B.; Jin, J.; Guo, A.; Zhang, H.; Luo, J.; Gao, G. GSDS 2.0: An upgraded gene feature visualization server. Bioinformatics 2015, 31, 1296–1297. [Google Scholar] [CrossRef]
  42. Larkin, M.A.; Blackshields, G.; Brown, N.P.; Chenna, R.; Mcgettigan, P.A.; Mcwilliam, H.; Valentin, F.; Wallace, I.M.; Wilm, A.; Lopez, R. Clustal W and Clustal X version 2.0. Bioinformatics 2007, 23, 2947–2948. [Google Scholar] [CrossRef] [PubMed] [Green Version]
  43. Kumar, S.; Stecher, G.; Tamura, K. MEGA7: Molecular evolutionary genetics analysis version 7.0 for bigger datasets. Mol. Biol. 2016, 33, 1870–1874. [Google Scholar] [CrossRef] [PubMed]
  44. Voorrips, R.E. MapChart: Software for the graphical presentation of linkage maps and QTLs. J. Hered. 2002, 93, 77–78. [Google Scholar] [CrossRef] [PubMed]
  45. Cheng, F.; Wu, J.; Fang, L.; Wang, X. Syntenic gene analysis between Brassica rapa and other Brassicaceae species. Front. Plant Sci. 2012, 3, 198. [Google Scholar] [CrossRef] [PubMed]
  46. Krzywinski, M.I.; Schein, J.E.; Birol, I.; Connors, J.; Gascoyne, R.; Horsman, D.; Jones, S.J.; Marra, M.A. Circos: An information aesthetic for comparative genomics. Genome Res. 2009, 19, 1639–1645. [Google Scholar] [CrossRef] [PubMed] [Green Version]
  47. Rozas, J.; Ferrermata, A.; Sanchezdelbarrio, J.C.; Guiraorico, S.; Librado, P.; Ramosonsins, S.E.; Sanchezgracia, A. DnaSP 6: DNA sequence polymorphism analysis of large data sets. Mol. Biol. Evol. 2017, 34, 3299–3302. [Google Scholar] [CrossRef] [PubMed]
  48. Ihaka, R.; Gentleman, R. R: A language for data analysis and graphics. J. Comput. Graph. Stat. 1996, 5, 299–314. [Google Scholar]
  49. Koch, M.A.; Haubold, B.; Mitchellolds, T. Comparative evolutionary analysis of chalcone synthase and alcohol dehydrogenase loci in Arabidopsis, Arabis, and related genera (Brassicaceae). Mol. Biol. Evol. 2000, 17, 1483–1498. [Google Scholar] [CrossRef]
  50. Chou, K.-C.; Shen, H.-B. Cell-PLoc: A package of Web servers for predicting subcellular localization of proteins in various organisms. Nat. Protoc. 2008, 3, 153–162. [Google Scholar] [CrossRef]
  51. Bolger, A.; Lohse, M.; Usadel, B. Trimmomatic: A flexible trimmer for Illumina sequence data. Bioinformatics 2014, 30, 2114–2120. [Google Scholar] [CrossRef]
  52. Kim, D.; Langmead, B.; Salzberg, S.L. HISAT: A fast spliced aligner with low memory requirements. Nat. Methods 2015, 12, 357–360. [Google Scholar] [CrossRef] [PubMed]
  53. Love, M.I.; Huber, W.; Anders, S. Moderated estimation of fold change and dispersion for RNA-seq data with DESeq2. Genome Biol. 2014, 15, 550. [Google Scholar] [CrossRef]
  54. Hellens, R.P.; Edwards, E.A.; Leyland, N.; Bean, S.J.; Mullineaux, P.M. pGreen: A versatile and flexible binary Ti vector for Agrobacterium-mediated plant transformation. Plant Mol. Biol. 2000, 42, 819–832. [Google Scholar] [CrossRef] [PubMed]
  55. Sparkes, I.; Runions, J.; Kearns, A.; Hawes, C. Rapid, transient expression of fluorescent fusion proteins in tobacco plants and generation of stably transformed plants. Nat. Protoc. 2006, 1, 2019–2025. [Google Scholar] [CrossRef] [PubMed]
  56. Cheng, F.; Mandakova, T.; Wu, J.; Xie, Q.; Lysak, M.A.; Wang, X. Deciphering the diploid ancestral genome of the mesohexaploid Brassica rapa. Plant Cell 2013, 25, 1541–1554. [Google Scholar] [CrossRef]
  57. Guo, C.; Guo, R.; Xu, X.; Gao, M.; Li, X.; Song, J.; Zheng, Y.; Wang, X. Evolution and expression analysis of the grape (Vitis vinifera L.) WRKY gene family. J. Exp. Bot. 2014, 65, 1513–1528. [Google Scholar] [CrossRef] [PubMed]
  58. Marger, M.D.; Saier, M.H., Jr. A major superfamily of transmembrane facilitators that catalyse uniport, symport and antiport. Trends Biochem. Sci. 1993, 18, 13–20. [Google Scholar] [CrossRef]
  59. Slewinski, T.L. Diverse functional roles of monosaccharide transporters and their homologs in vascular plants: A physiological perspective. Mol. Plant 2011, 4, 641–662. [Google Scholar] [CrossRef] [PubMed]
  60. Lynch, M.; Conery, J.S. The evolutionary fate and consequences of duplicate genes. Science 2000, 290, 1151–1155. [Google Scholar] [CrossRef]
  61. Moore, R.C.; Purugganan, M.D. The early stages of duplicate gene evolution. Proc. Natl. Acad. Sci. USA 2003, 100, 15682–15687. [Google Scholar] [CrossRef] [Green Version]
  62. Büttner, M.; Sauer, N. Monosaccharide transporters in plants: Structure, function and physiology. Biochim. Biophys. Acta Biomembr. 2000, 1465, 263–274. [Google Scholar] [CrossRef]
  63. Williams, L.E.; Lemoine, R.; Sauer, N. Sugar transporters in higher plants-a diversity of roles and complex regulation. Trends Plant Sci. 2000, 5, 283–290. [Google Scholar] [CrossRef]
  64. Walerowski, P.; Gündel, A.; Yahaya, N.; Truman, W.; Sobczak, M.; Olszak, M.; Rolfe, S.A.; Borisjuk, L.; Malinowski, R. Clubroot disease stimulates early steps of phloem differentiation and recruits SWEET sucrose transporters within developing galls. Plant Cell 2018. [Google Scholar] [CrossRef] [PubMed]
  65. Evans, J.L.; Scholes, J.D. How does clubroot alter the regulation of carbon metabolism in its host? Asp. Appl. Biol. 1995, 42, 125–132. [Google Scholar]
Figure 1. Phylogenetic tree of B. oleracea, Brassica rapa, and A. thaliana STP proteins. Phylogenetic analysis of 58 STP proteins from B. oleracea (22), B. rapa (22), and A. thaliana (14) showing similar groups in the three species. Four clades were marked with different background colors.
Genes 10 00071 g001
Figure 2. Distribution of BoSTP genes on the nine chromosomes of B. oleracea. The 24 conserved collinear blocks on each chromosome are labeled A–X and the three sub-genomes are plotted, based on a previous report [37].
Genes 10 00071 g002
Figure 3. Syntenic relationship of STP genes shown on chromosome maps between B. oleracea and B. rapa. Nine cabbage and 10 Chinese cabbage chromosomes are shown with different random colors. Lines in blue indicate orthologous gene pairs, green indicate cabbage paralogous gene pairs, and red indicate Chinese cabbage paralogous gene pairs.
Genes 10 00071 g003
Figure 4. Distribution of Ks values of STP orthologous gene pairs between B. oleracea and A. thaliana.
Genes 10 00071 g004
Figure 5. Gene structures and transmembrane helices (TMHs) of BoSTP genes. (a) An unrooted phylogenetic tree was constructed based on the full-length amino acid alignment of all the BoSTP proteins using the maximum likelihood (ML) method. (b) Structures of BoSTP genes. Exons and introns are represented by blue double-sided wedges and black lines, respectively. (c) TMHs of BoSTP proteins. Red rectangles signify the transmembrane regions, blue and carmine lines indicate the intracellular and extracellular regions, respectively.
Genes 10 00071 g005
Figure 6. Expression profiles of BoSTP genes. (a) Gene expression patterns of BoSTP genes in different organs (bud, callus, flower, leaf, root, silique, and stem). (b) Expression dynamics of BoSTP genes in cabbage roots following Plasmodiophora brassicae infection. Expression levels of the BoSTP genes are shown as the log2 transformed FPKM (fragments per kilobase of exon model per million mapped fragments) values obtained from the RNA-Seq data. DAI: days after inoculation.
Genes 10 00071 g006
Figure 7. Subcellular localization of BoSTP proteins in Nicotiana benthamiana leaves. BoSTP4b-GFP and BoSTP12-GFP fusion proteins, as well as GFP alone, were transiently expressed in N. benthamiana leaves using Agrobacterium tumefaciens infiltration. Protein localization was examined 48 h after infiltration and representative images are shown.
Genes 10 00071 g007
Table 1. STP family genes in Brassica oleracea and corresponding orthologs in Arabidopsis thaliana.
GrouptPCKChrCCBArabidopsis thalianaBrassica oleracea
Gene NameGene IDORF (bp)PL (aa)Gene NameGene IDChromosomeSubgenomeORF (bp)PL (aa)MW (kD)pIInstability IndexAliphatic IndexGRAVYSCLpred
Clade ItPCK1AAtSTP1AT1G112601569522BoSTP1aBol036657C05LF156952257.609.2238.45102.870.49cell membrane
BoSTP1bBol031302C08MF2156652157.479.2939.98102.150.48cell membrane
tPCK7XAtSTP3AT5G615201545514BoSTP3Bol017006C06LF151250354.769.1240.17100.950.45cell membrane
tPCK1BAtSTP5AT1G345801521506BoSTP5Bol009461Scaffold000233MF1152150654.439.2830.06109.130.69cell membrane
tPCK4UAtSTP12AT4G214801509502BoSTP12Bol028422C01LF154251356.628.7030.38106.570.56cell membrane
Clade IItPCK2FAtSTP4AT3G199301545514BoSTP4aBol018147C05LF154551457.128.7238.81102.800.58cell membrane
BoSTP4bBol000550Scaffold000531MF1154551456.998.9938.20102.800.56cell membrane
tPCK1CAtSTP9AT1G503101554517BoSTP9aBol010165C07LF155151656.276.8932.1599.010.53cell membrane
BoSTP9bBol014014Scaffold000180MF2155151656.156.8933.77101.670.54cell membrane
tPCK2FAtSTP10AT3G199401545514BoSTP10Bol000549Scaffold000531MF1153651156.168.6030.5197.500.48cell membrane
tPCK7QAtSTP11AT5G232701545514BoSTP11Bol017091C06LF156952257.175.7933.58105.500.55cell membrane
Clade IIItPCK1AAtSTP2AT1G073401497498BoSTP2aBol023380C08MF1149749855.489.2738.43105.520.50cell membrane
BoSTP2bBol041122C05LF150049955.429.2933.25105.510.52cell membrane
tPCK2FAtSTP6AT3G059601524507BoSTP6aBol002474Scaffold000387MF1152450755.868.7631.67109.980.65cell membrane
BoSTP6bBol002866Scaffold000372LF151550455.598.2931.06109.500.65cell membrane
BoSTP6cBol034076Scaffold000040MF2152750855.718.3330.72112.480.61cell membrane
tPCK7QAtSTP8AT5G262501524507BoSTP8Bol022297C06LF145248353.348.9432.79112.630.64cell membrane
Clade IVtPCK5OAtSTP7AT4G020501542513BoSTP7aBol030687C03MF1154251355.769.0332.99105.890.47cell membrane
BoSTP7bBol011395C09LF152750855.098.8335.14110.180.53cell membrane
tPCK7QAtSTP13AT5G263401581526BoSTP13aBol022294C06LF153651155.959.3134.63112.940.59cell membrane
BoSTP13bBol032462C09MF2159953258.049.3032.58106.650.49cell membrane
tPCK6EAtSTP14AT1G772101515504BoSTP14Bol027572C07LF103834538.338.4745.45112.460.51cell membrane
NottPCK Chr: Chromosome of translocation Proto-Calepineae Karyotype, ancestral genome of Brassica species, CCB: Conserved collinear block, LF: The least fractionated blocks of Brassica, MF1: The medium fractionated blocks of Brassica, MF2: The most fractionated blocks of Brassica, ORF: Open reading frame, PL: Protein length, MW: Molecular weight, pI: Isoelectric point, GRAVY: Aliphatic index and grand average of hydropathicity, SCLpred: Predicted subcellular localization; STP: Sugar transporter protein.
Table 2. Non-synonymous (Ka) and synonymous substitution rate (Ks) of orthologous STP gene pairs between B. oleracea and A. thaliana.
Orthologous Gene PairsKsKaKa/KsDuplication Date (MYA)
AtSTP1BoSTP1a0.4982 0.0193 0.0387 16.6
BoSTP1b0.4609 0.0189 0.0410 15.4
AtSTP2BoSTP2a0.6117 0.0981 0.1604 20.4
BoSTP2b0.6566 0.1081 0.1646 21.9
AtSTP3BoSTP30.4924 0.0737 0.1497 16.4
AtSTP4BoSTP4a0.4260 0.0261 0.0613 14.2
BoSTP4b0.4345 0.0336 0.0773 14.5
AtSTP5BoSTP50.6055 0.0930 0.1536 20.2
AtSTP6BoSTP6a0.5253 0.0452 0.0860 17.5
BoSTP6b0.5766 0.0408 0.0708 19.2
BoSTP6c0.5485 0.0560 0.1021 18.3
AtSTP7BoSTP7a0.5290 0.0360 0.0681 17.6
BoSTP7b0.7164 0.0476 0.0664 23.9
AtSTP8BoSTP80.5900 0.0573 0.0971 19.7
AtSTP9BoSTP9a0.4489 0.0348 0.0775 15.0
BoSTP9b0.4279 0.0392 0.0916 14.3
AtSTP10BoSTP100.3646 0.0653 0.1791 12.2
AtSTP11BoSTP110.6162 0.1001 0.1624 20.5
AtSTP12BoSTP120.5073 0.0500 0.0986 16.9
AtSTP13BoSTP13a0.4475 0.0574 0.1283 14.9
BoSTP13b0.4877 0.0203 0.0416 16.3
AtSTP14BoSTP140.5623 0.0300 0.0534 18.7
Table 3. Known hormone-responsive and stress-responsive cis-acting elements in the promoter regions of BoSTP genes.
ElementsABREARECGTCA-MotifEREG-BoxGT1-MotifLTRMBSMREP-BoxSTRETATC-BoxTC-Rich RepeatsTCA-ElementTGA-ElementTGACG-MotifWUN-MotifTotal
ABAAnaerobicMeJAEthyleneLightLightLow TemperatureDroughtLight GibberellinStress ResponseGibberellinDefense & StressSalicylic AcidAuxinMeJAWound
BoSTP1a23 22 1 1 112
BoSTP1b24 13 1 1 113
BoSTP2a 2 2
BoSTP2b 2 1 2 5
BoSTP312 1 4
BoSTP4a 1 1 1 3
BoSTP4b 31 1 2 7
BoSTP5111 11 2 119
BoSTP6a1 1 2
BoSTP6b11 233 111
BoSTP6c 2 3 1 2 1 1 3 13
BoSTP7a2 2431 11 1 2118
BoSTP7b4 216 11 1 2119
BoSTP8 321 1 3 2113
BoSTP9a231421 2 2 21 20
BoSTP9b 51 32 11 2 1 16
BoSTP102 322 4 114
BoSTP111 121 21 1 1 1 11
BoSTP1221 22 1 1 9
BoSTP13a52126 1 111 11 22
BoSTP13b322142 1 1 2119
BoSTP14 31 1 13 1 1 11

