Investigation of Precise Molecular Mechanistic Action of Tobacco-Associated Carcinogen ‘NNK’ Induced Carcinogenesis: A System Biology Approach


 ,
, 
Abstract
:1. Introduction
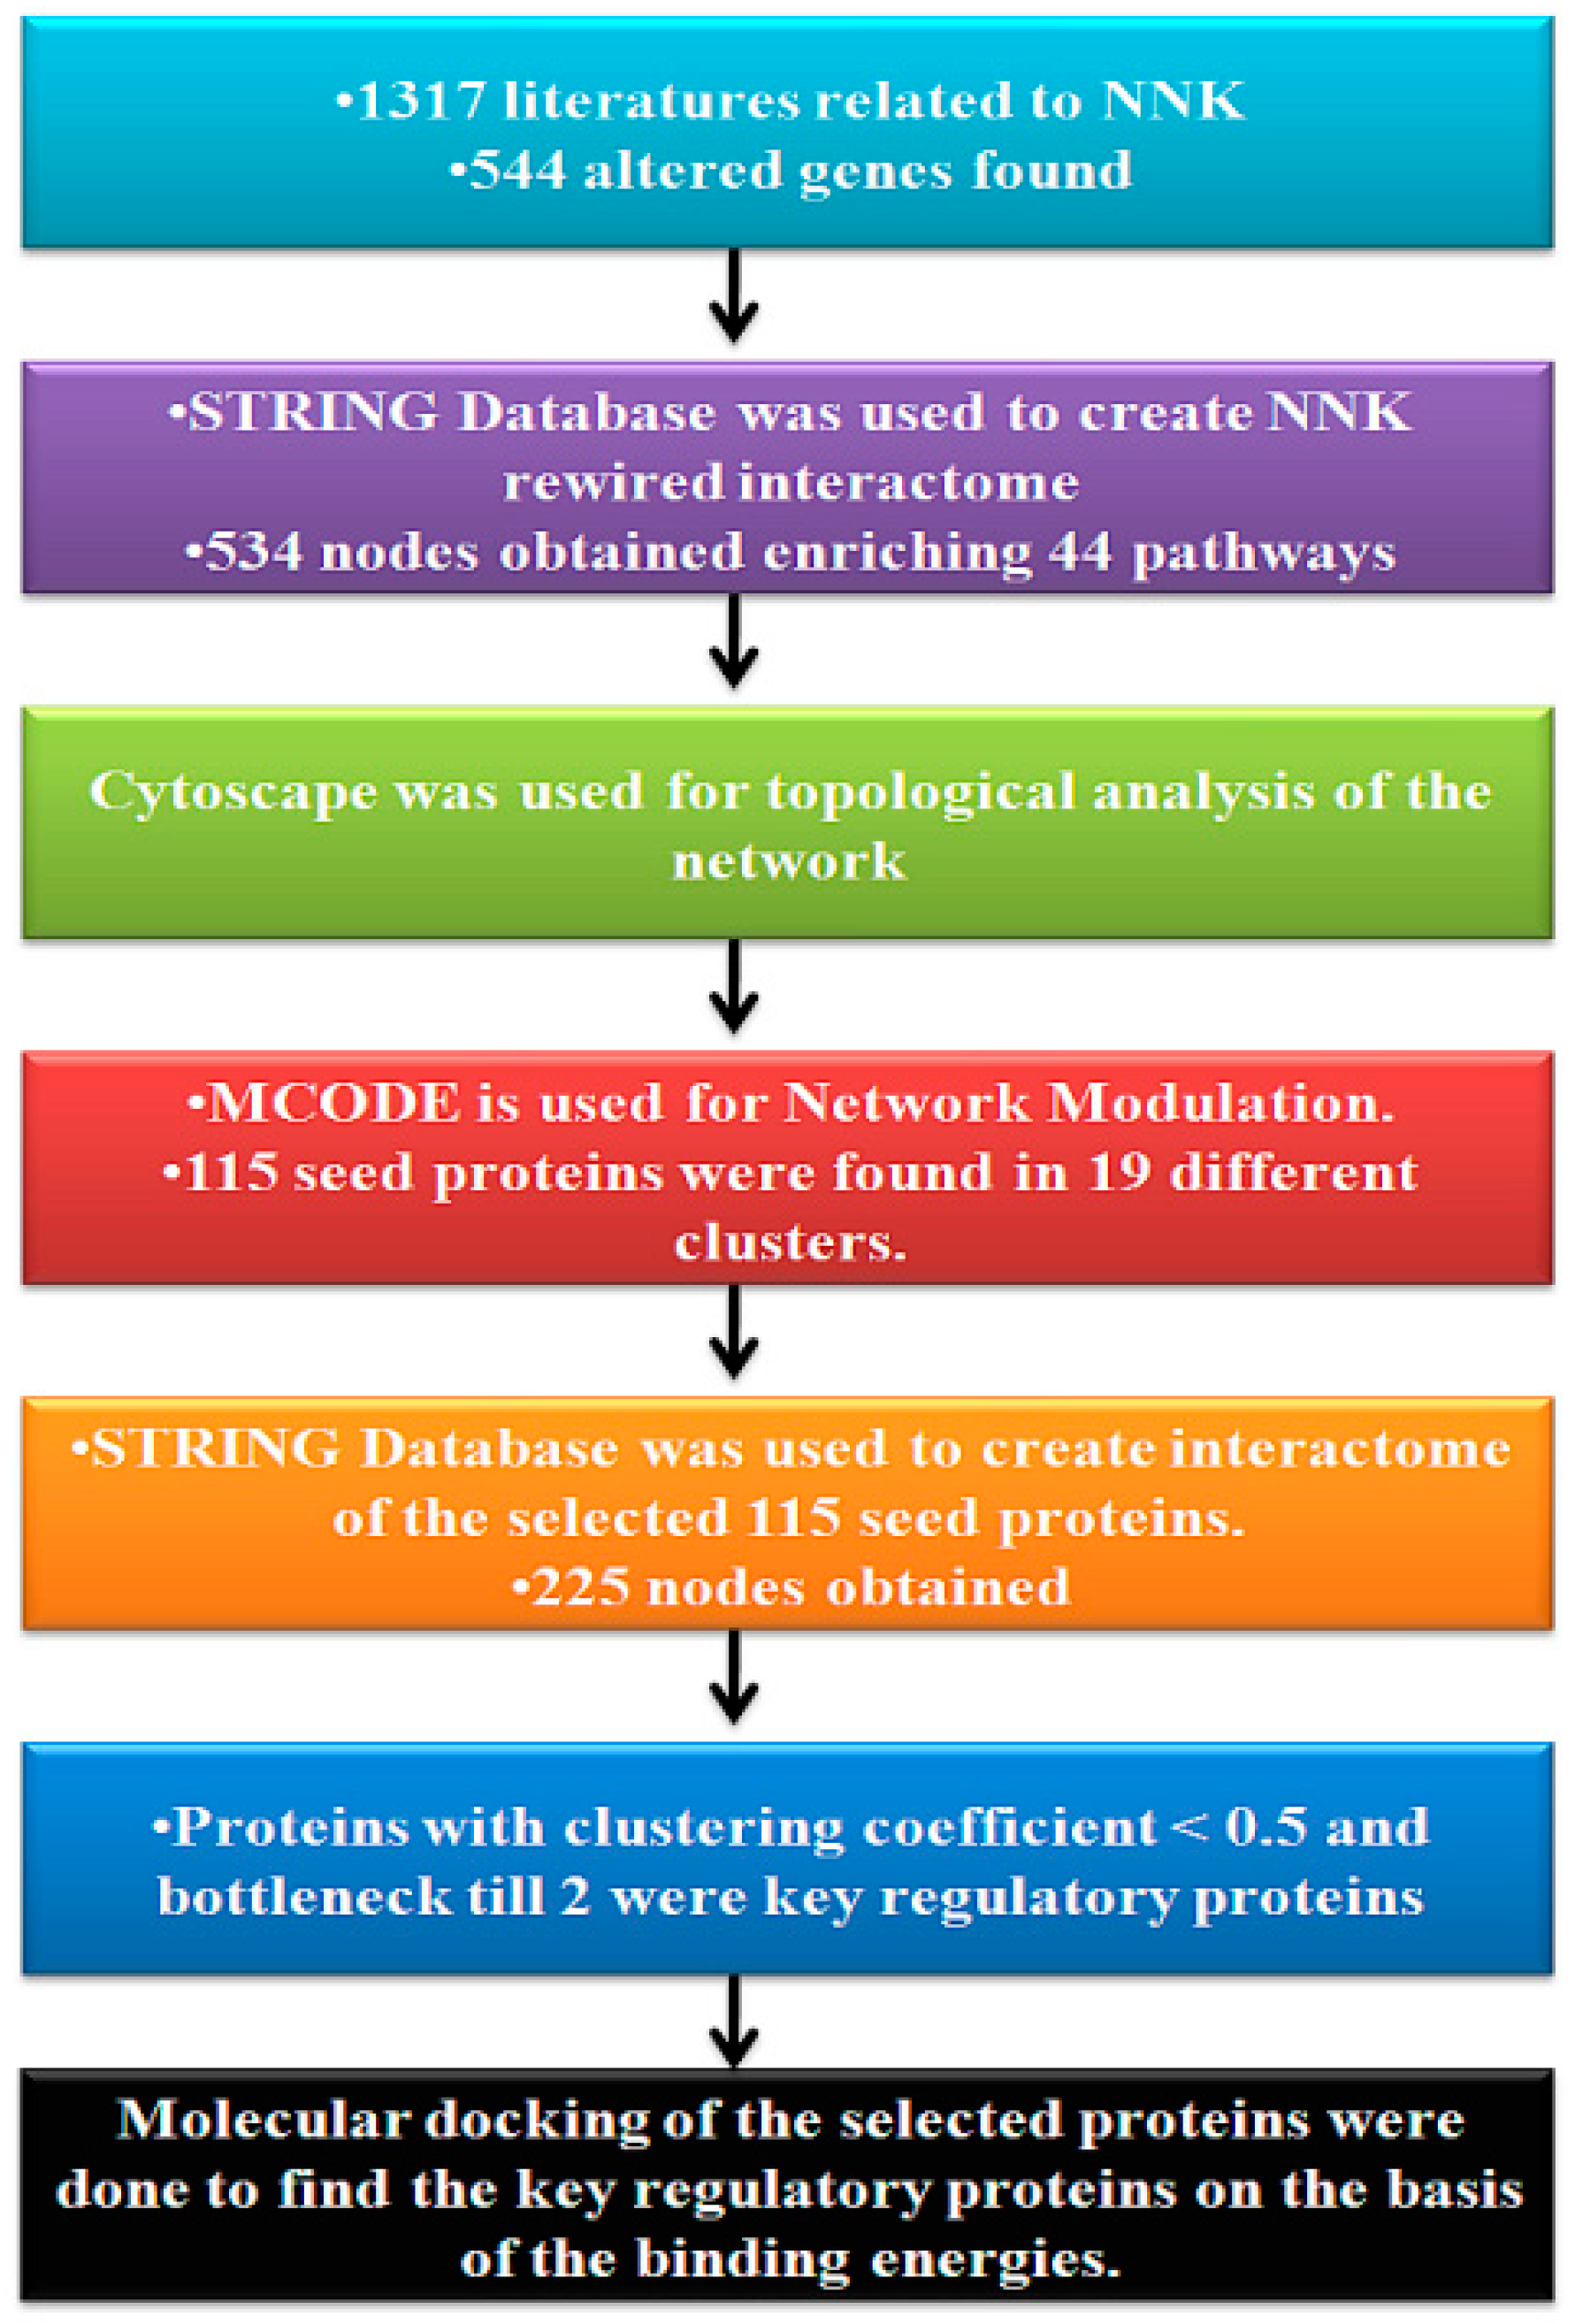
2. Materials and Methods
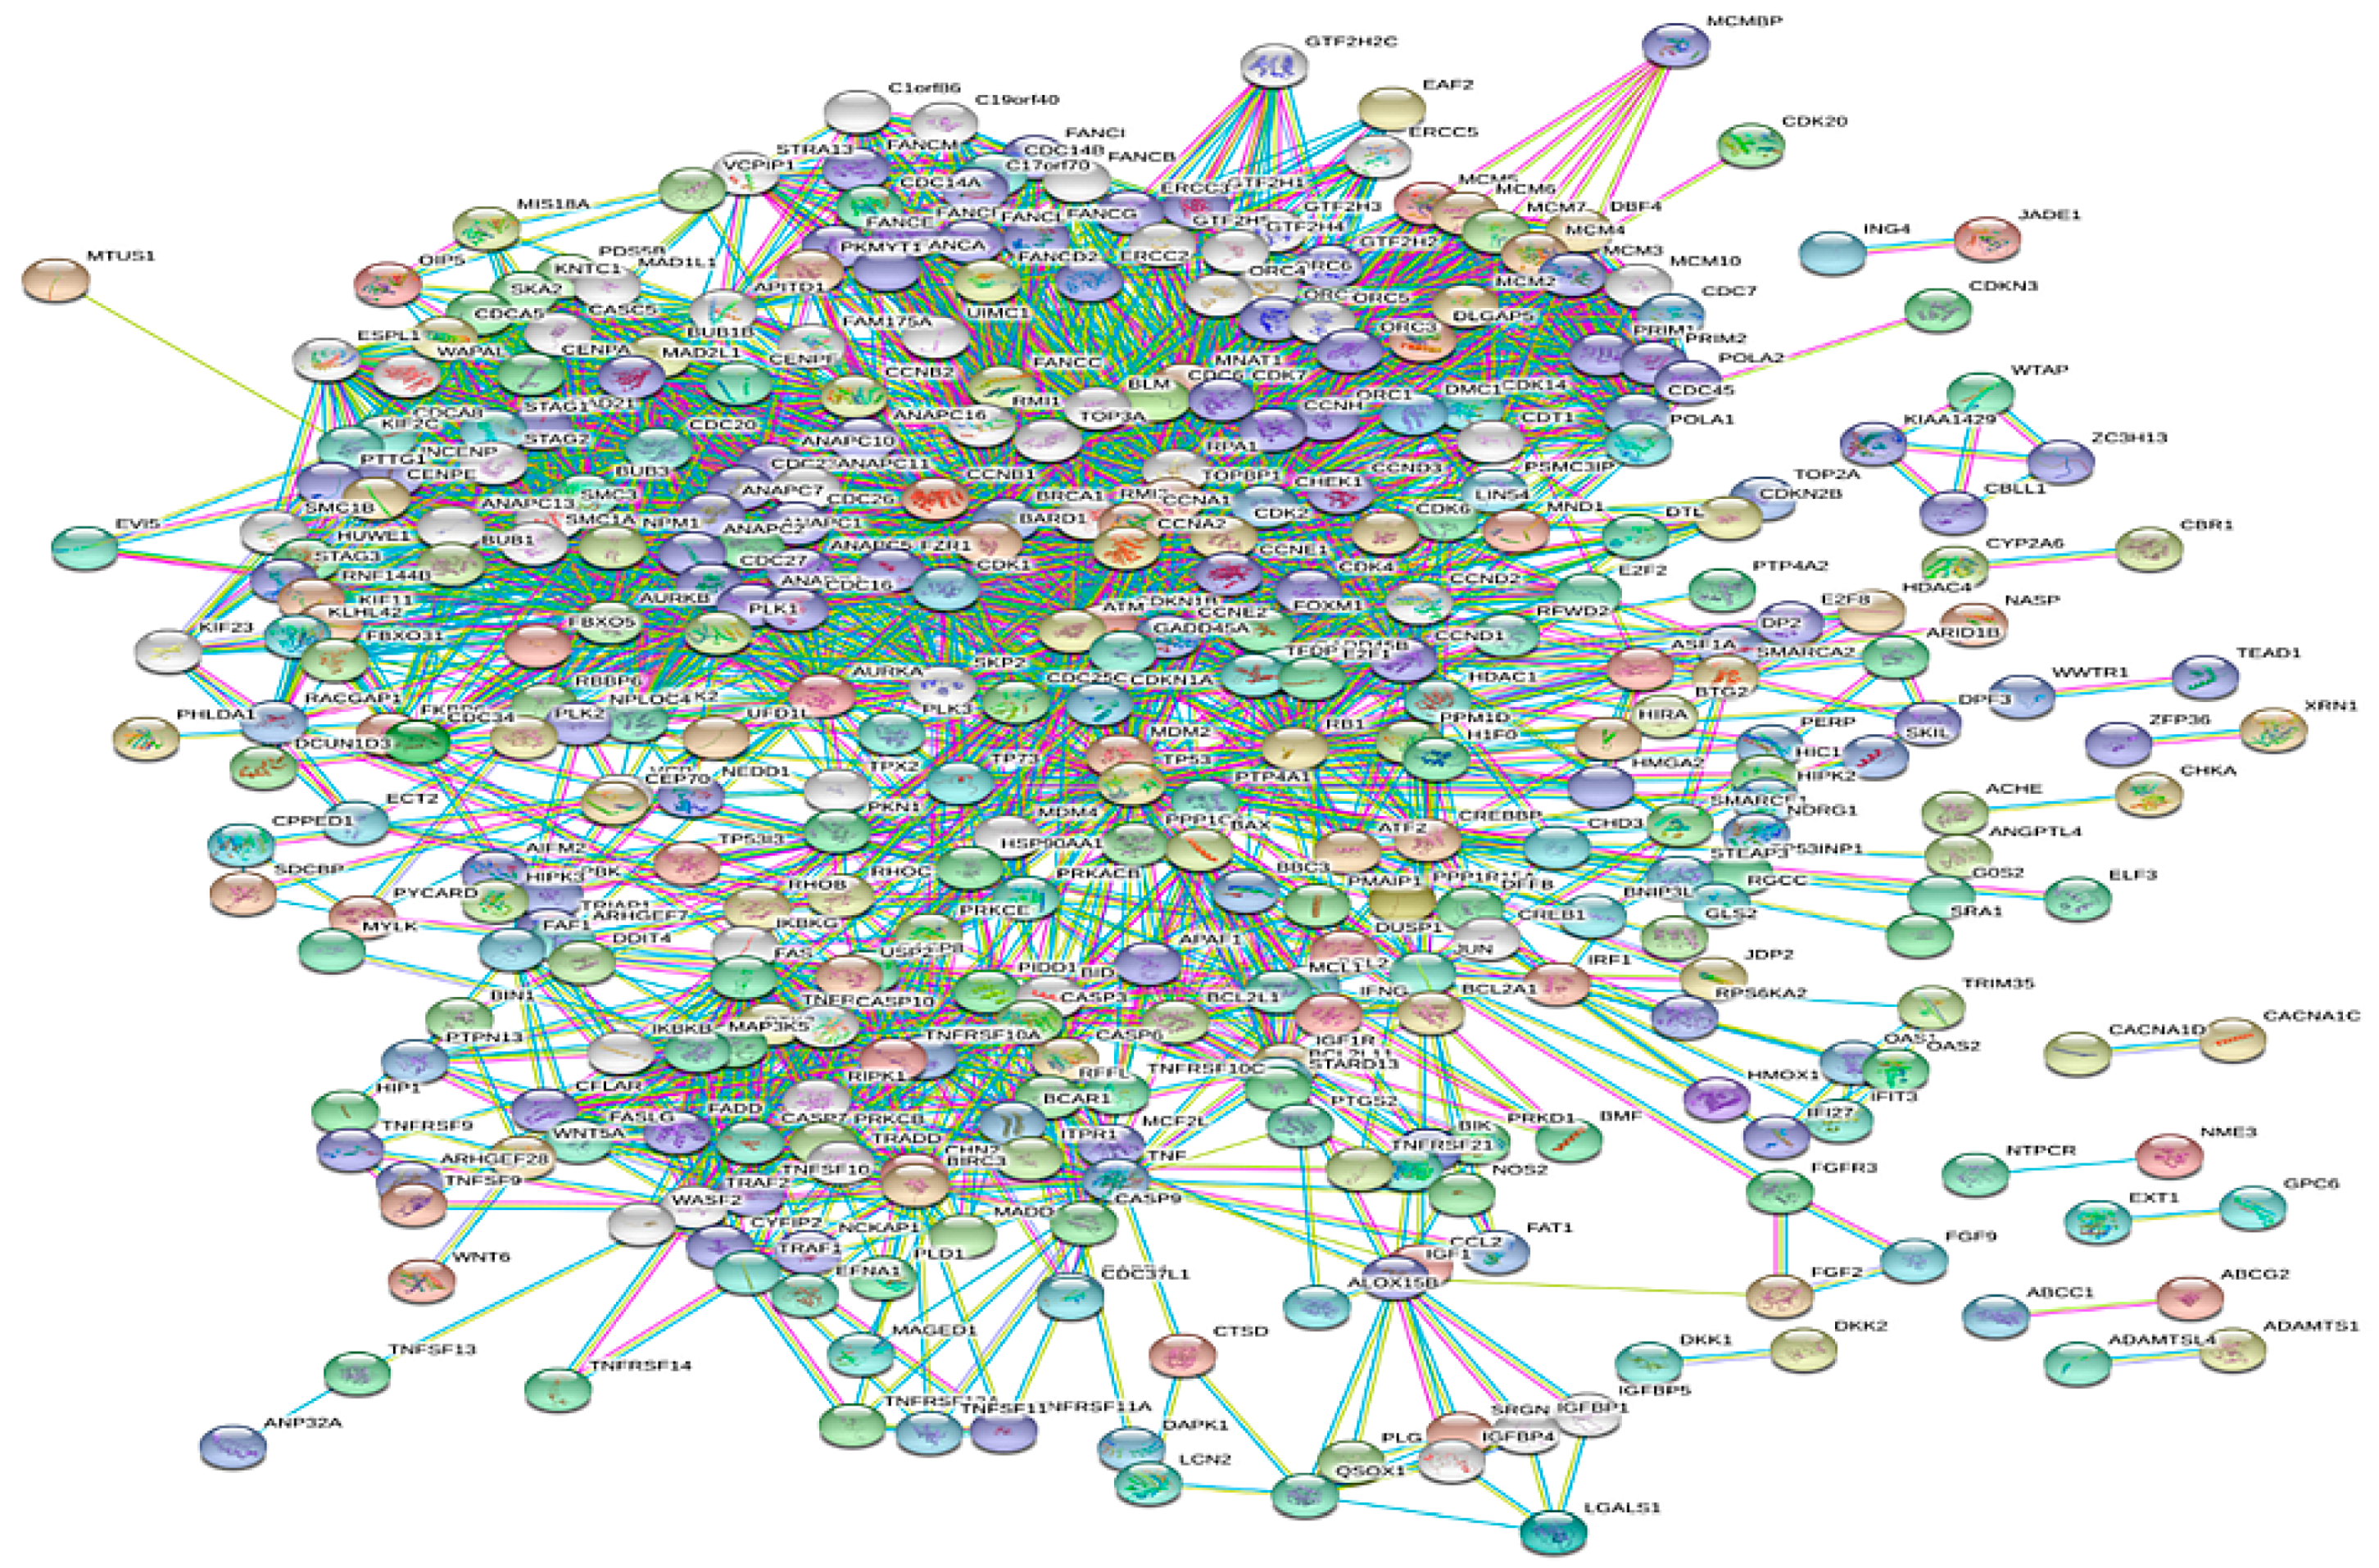
2.1. Construction and Visualization of Protein–Protein Interaction Network
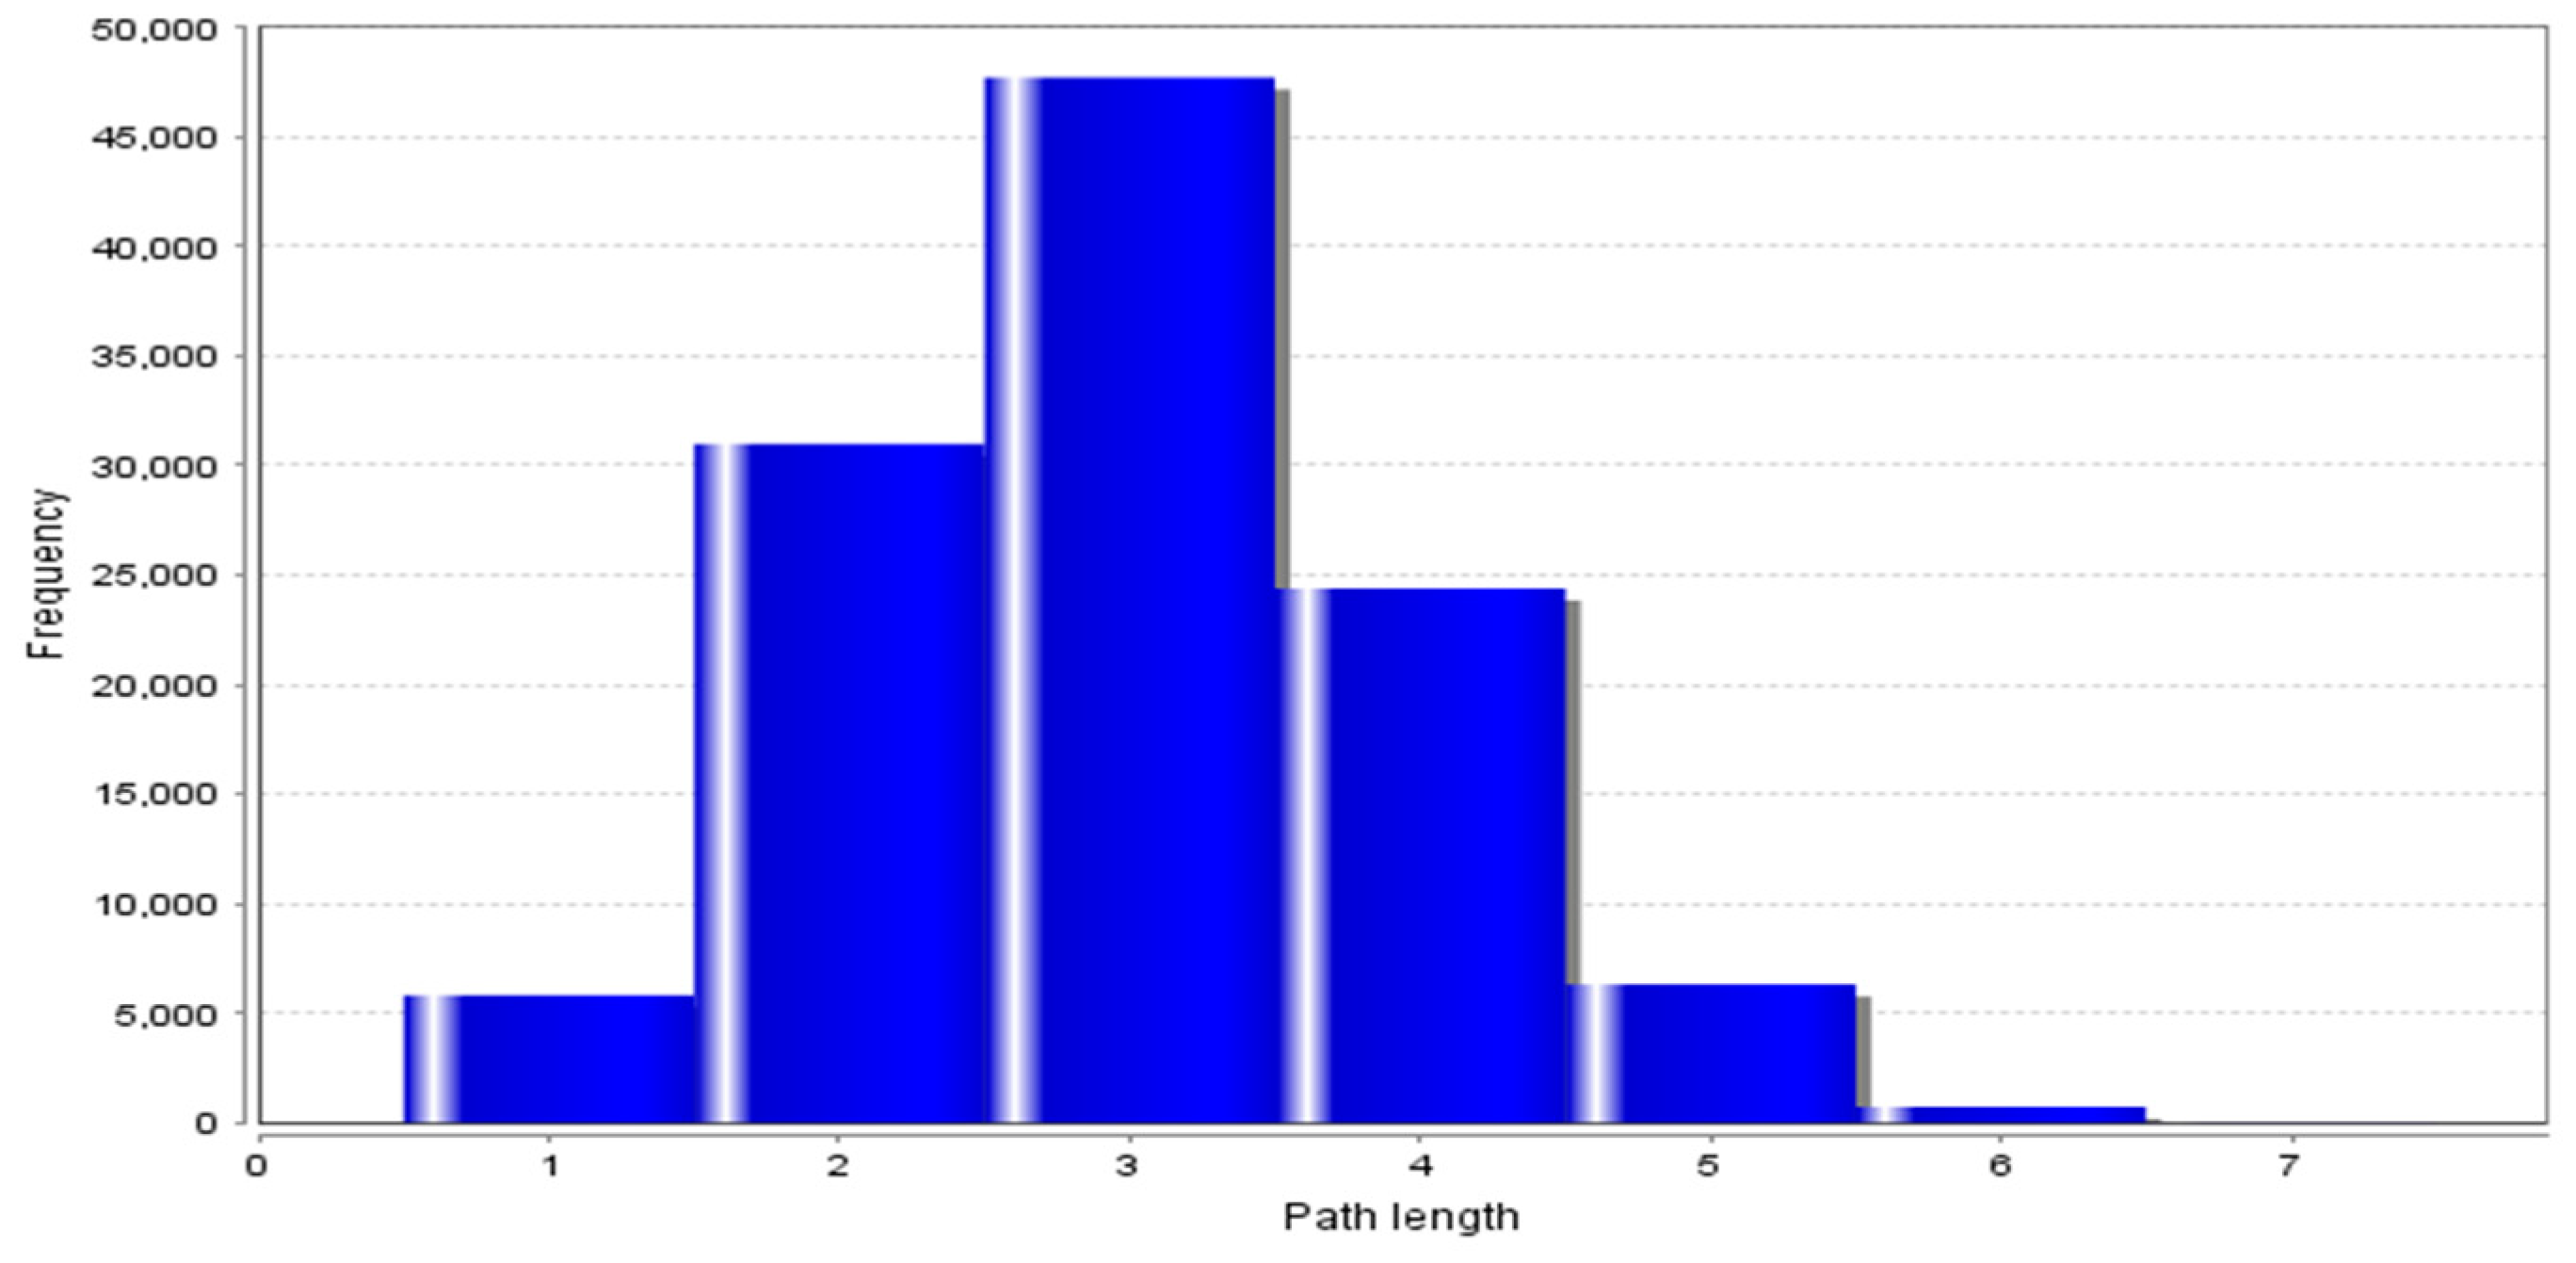
2.2. Protein–Protein Interaction Network (PPIN) Analysis
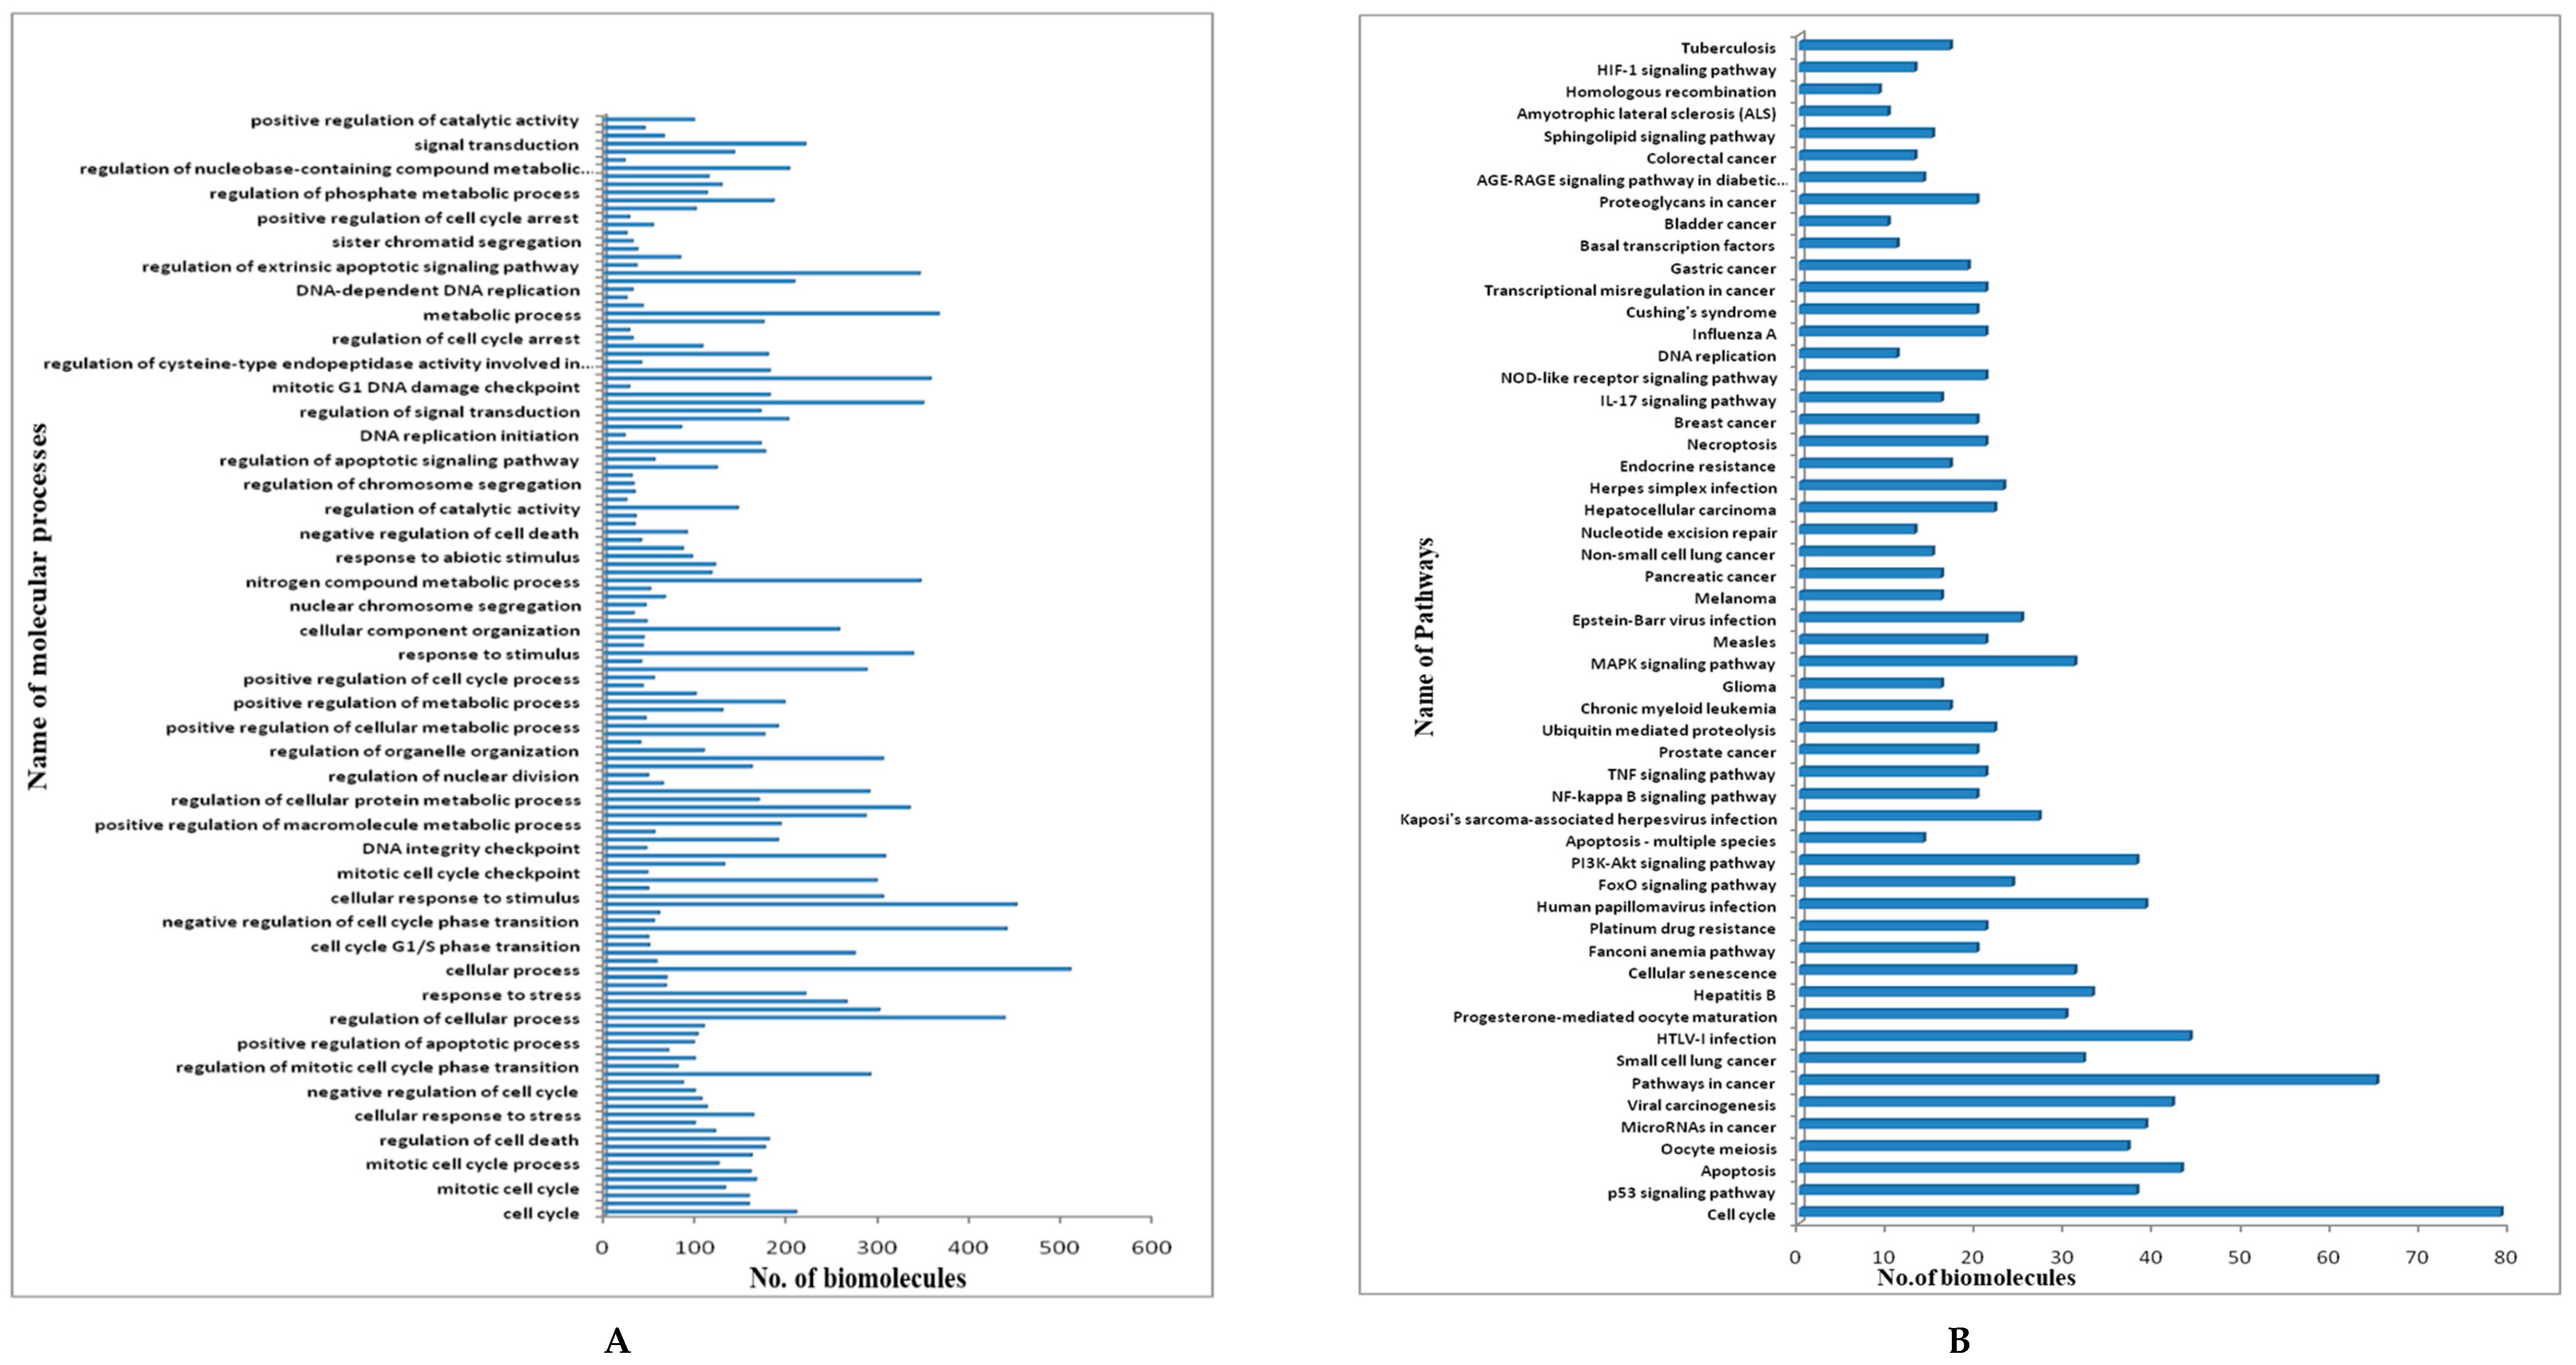
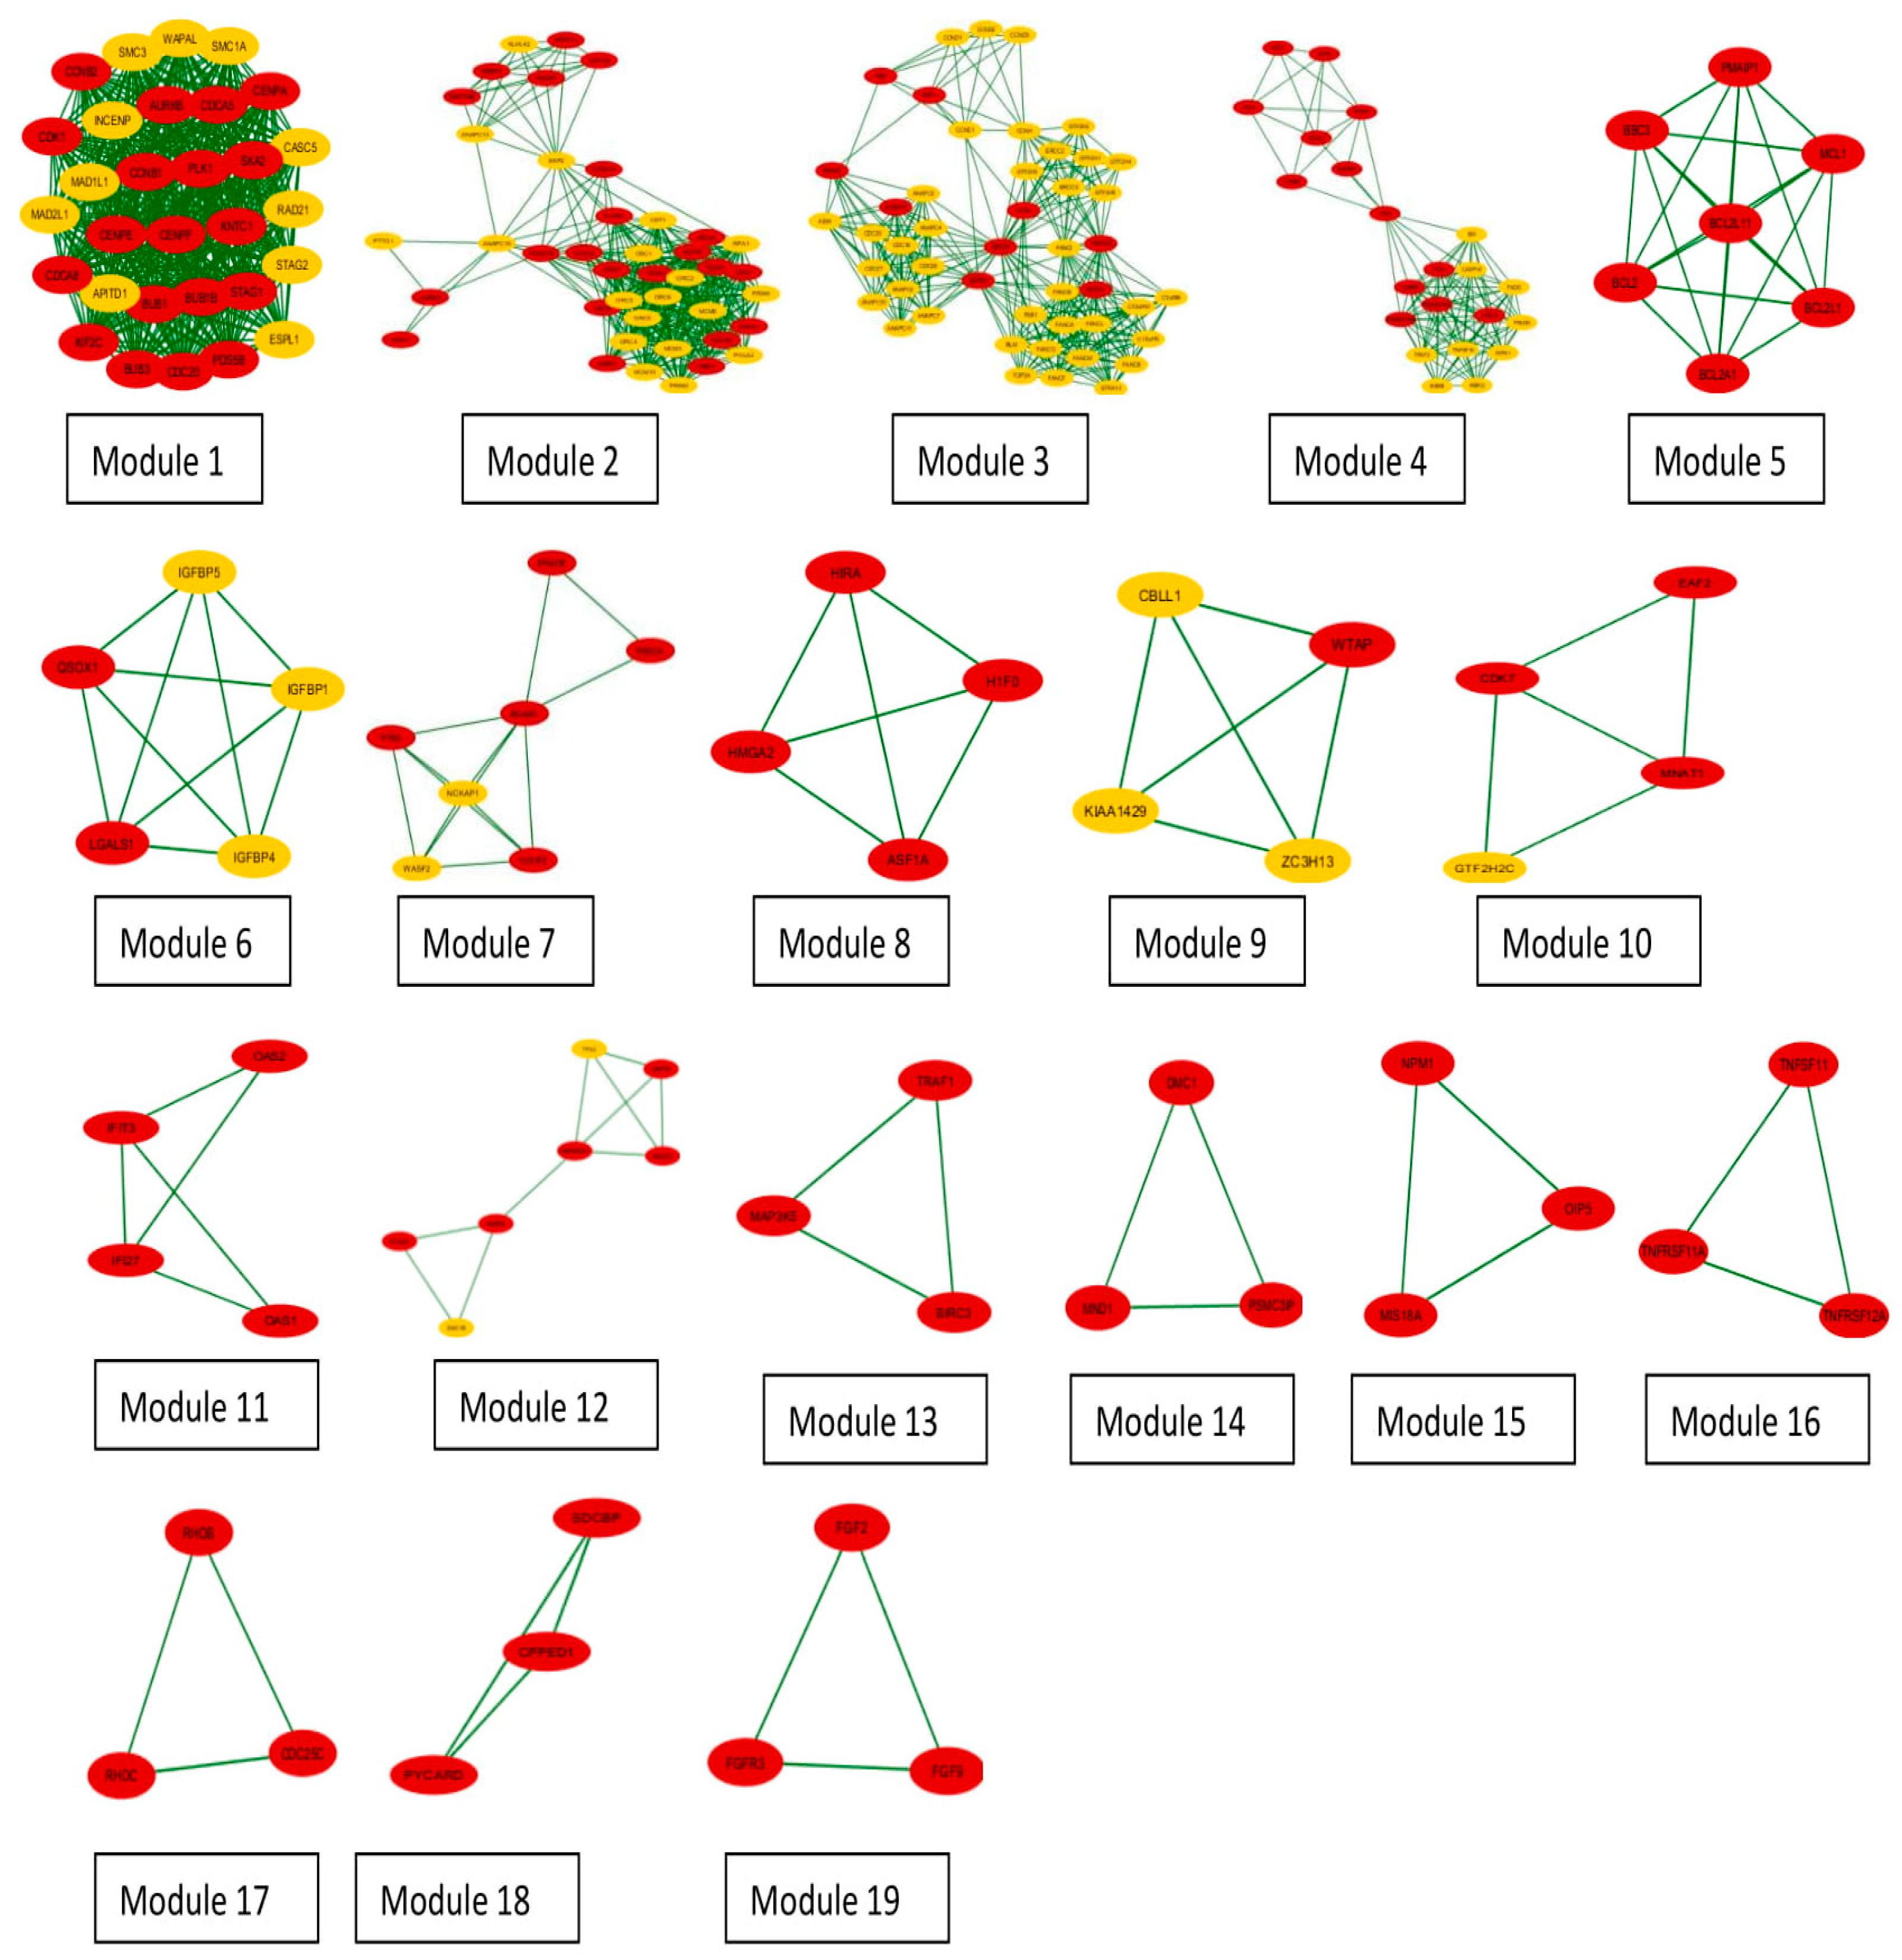
2.3. Protein Interaction Network Modular Analysis and Pathway Enrichment
2.4. Molecular Docking Analysis
3. Results
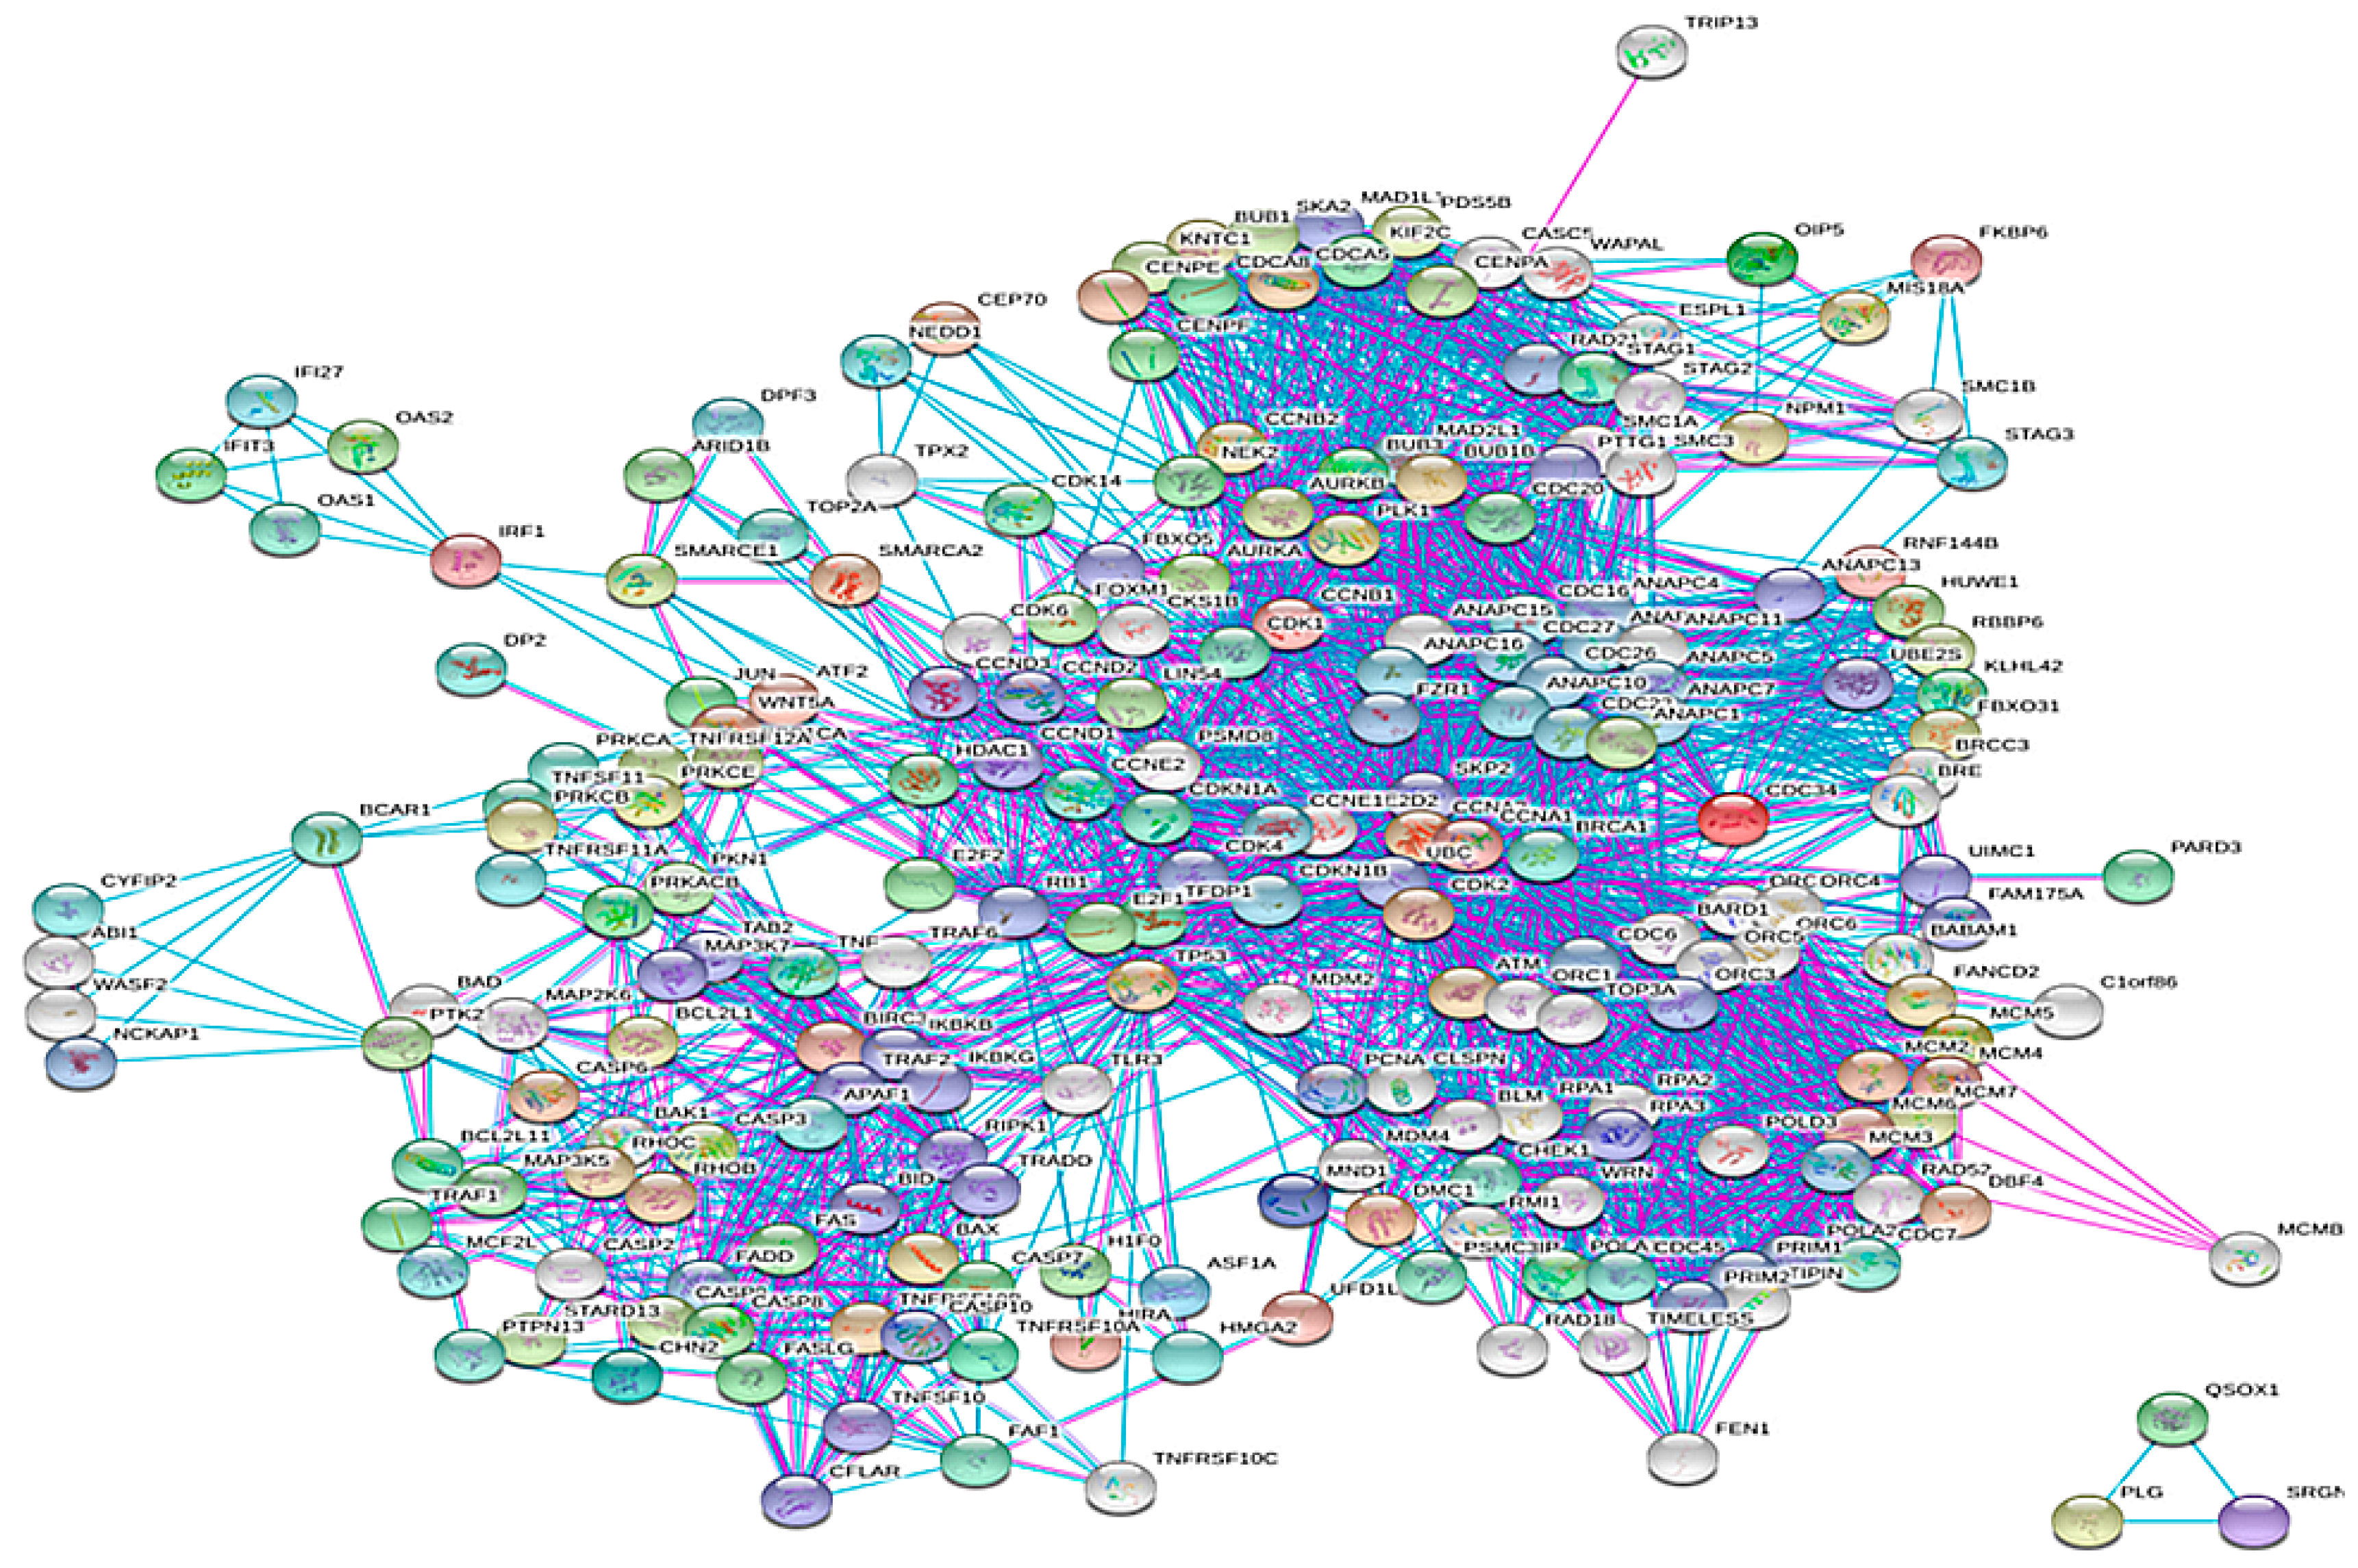
3.1. Construction of the Network
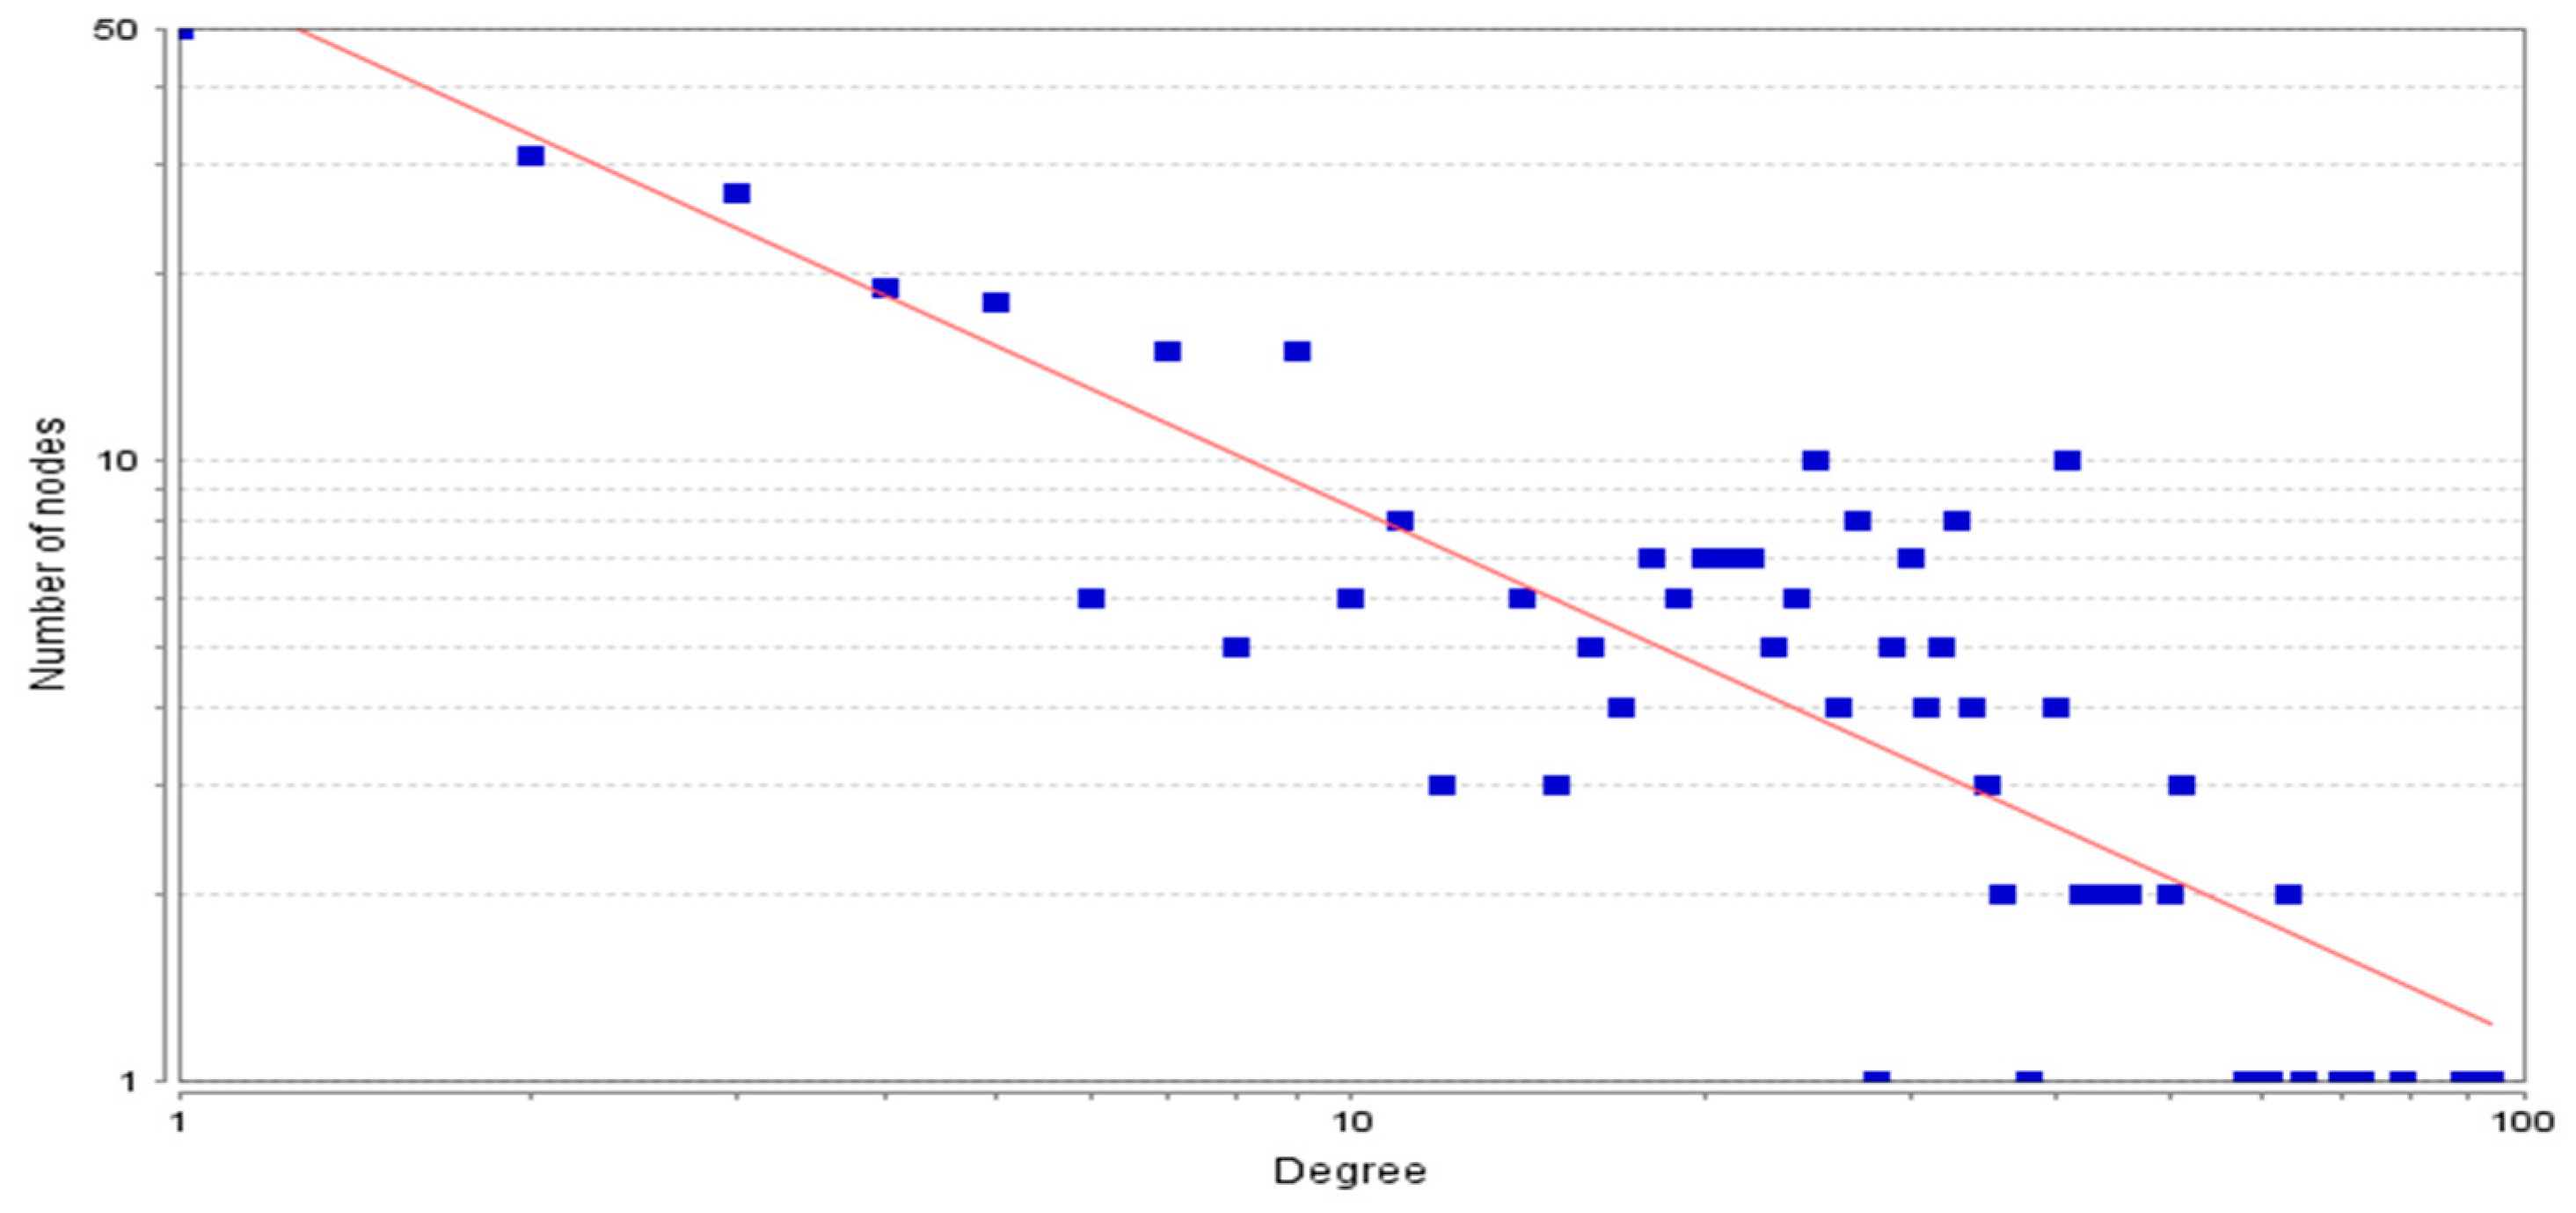
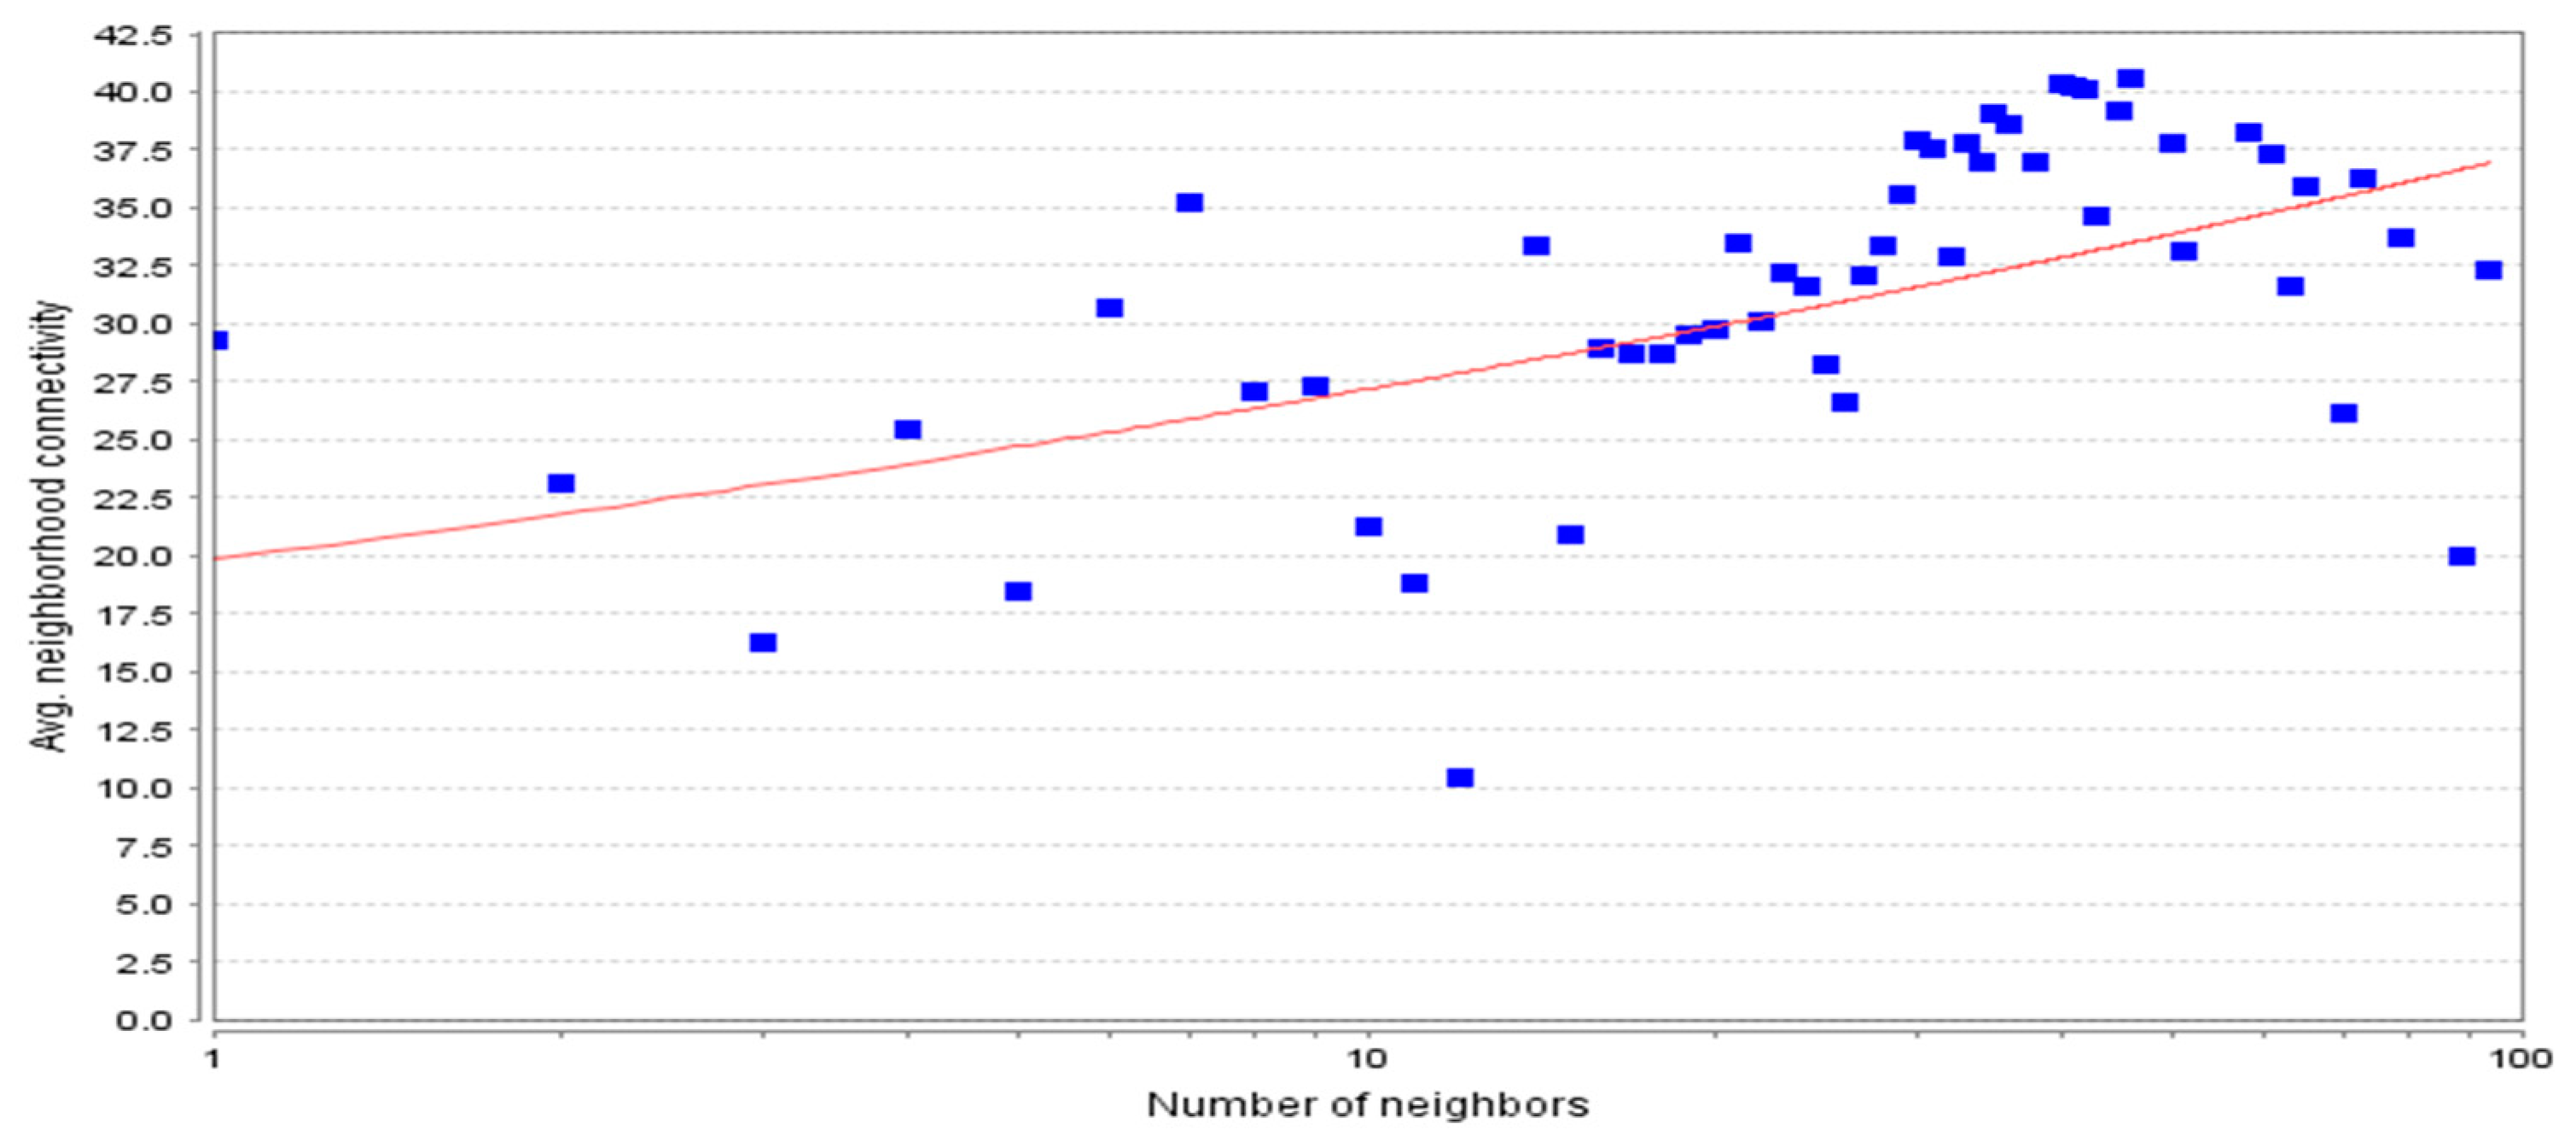
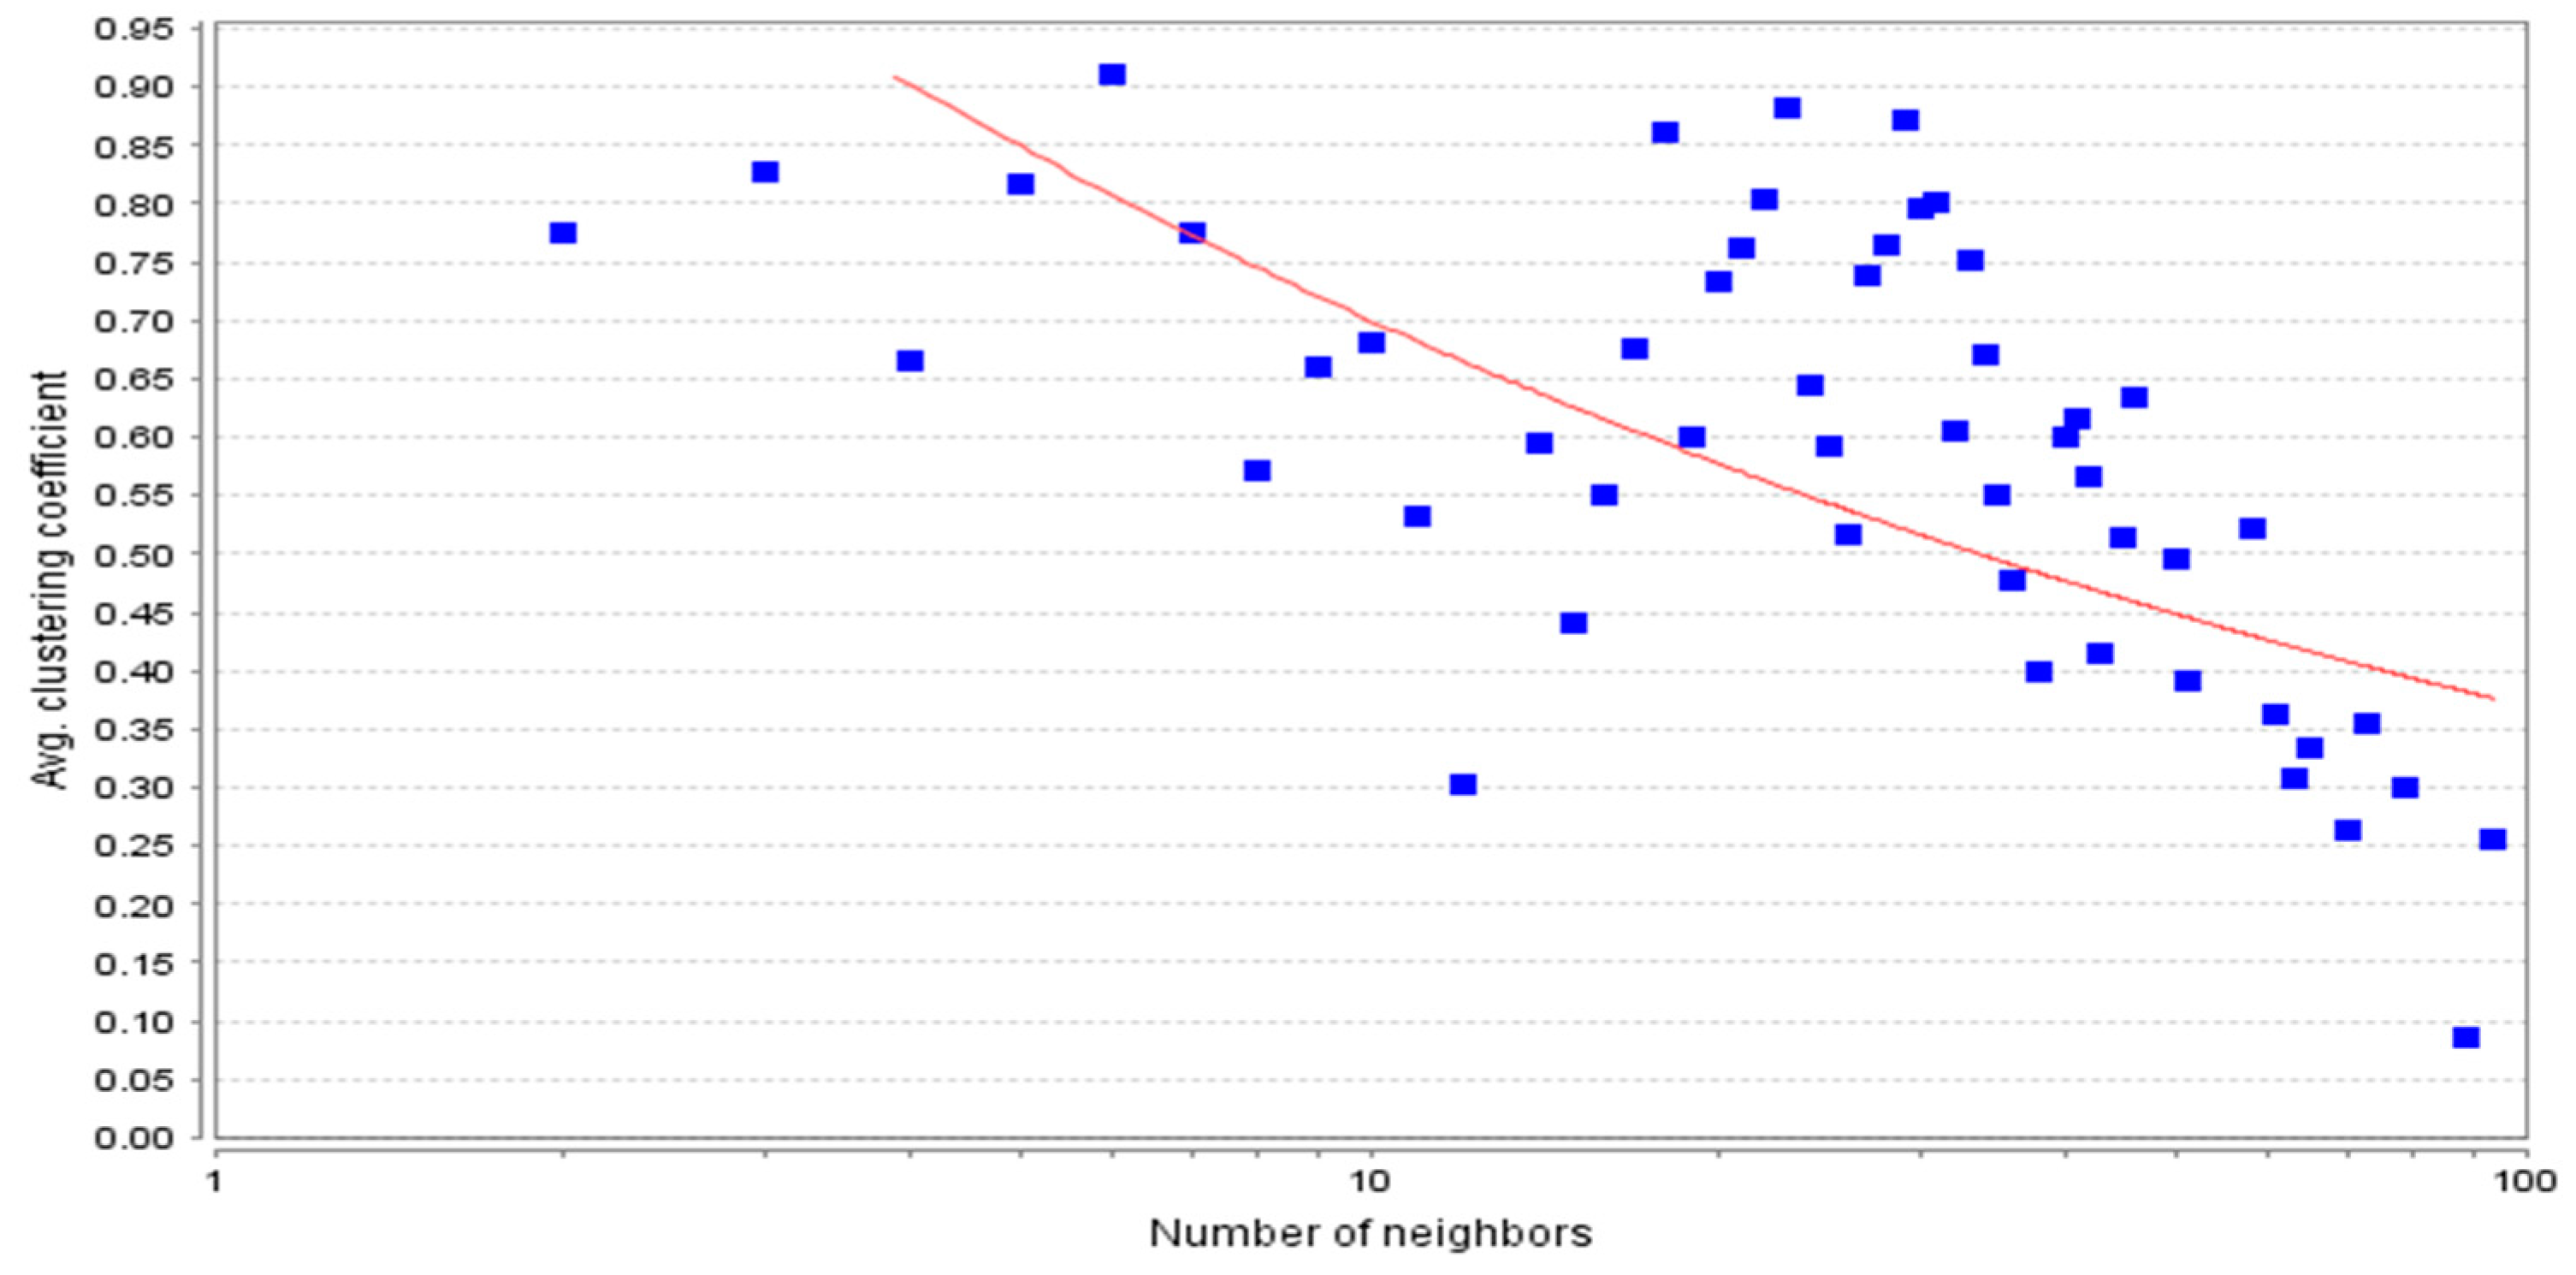
3.2. Topological Properties of the Network
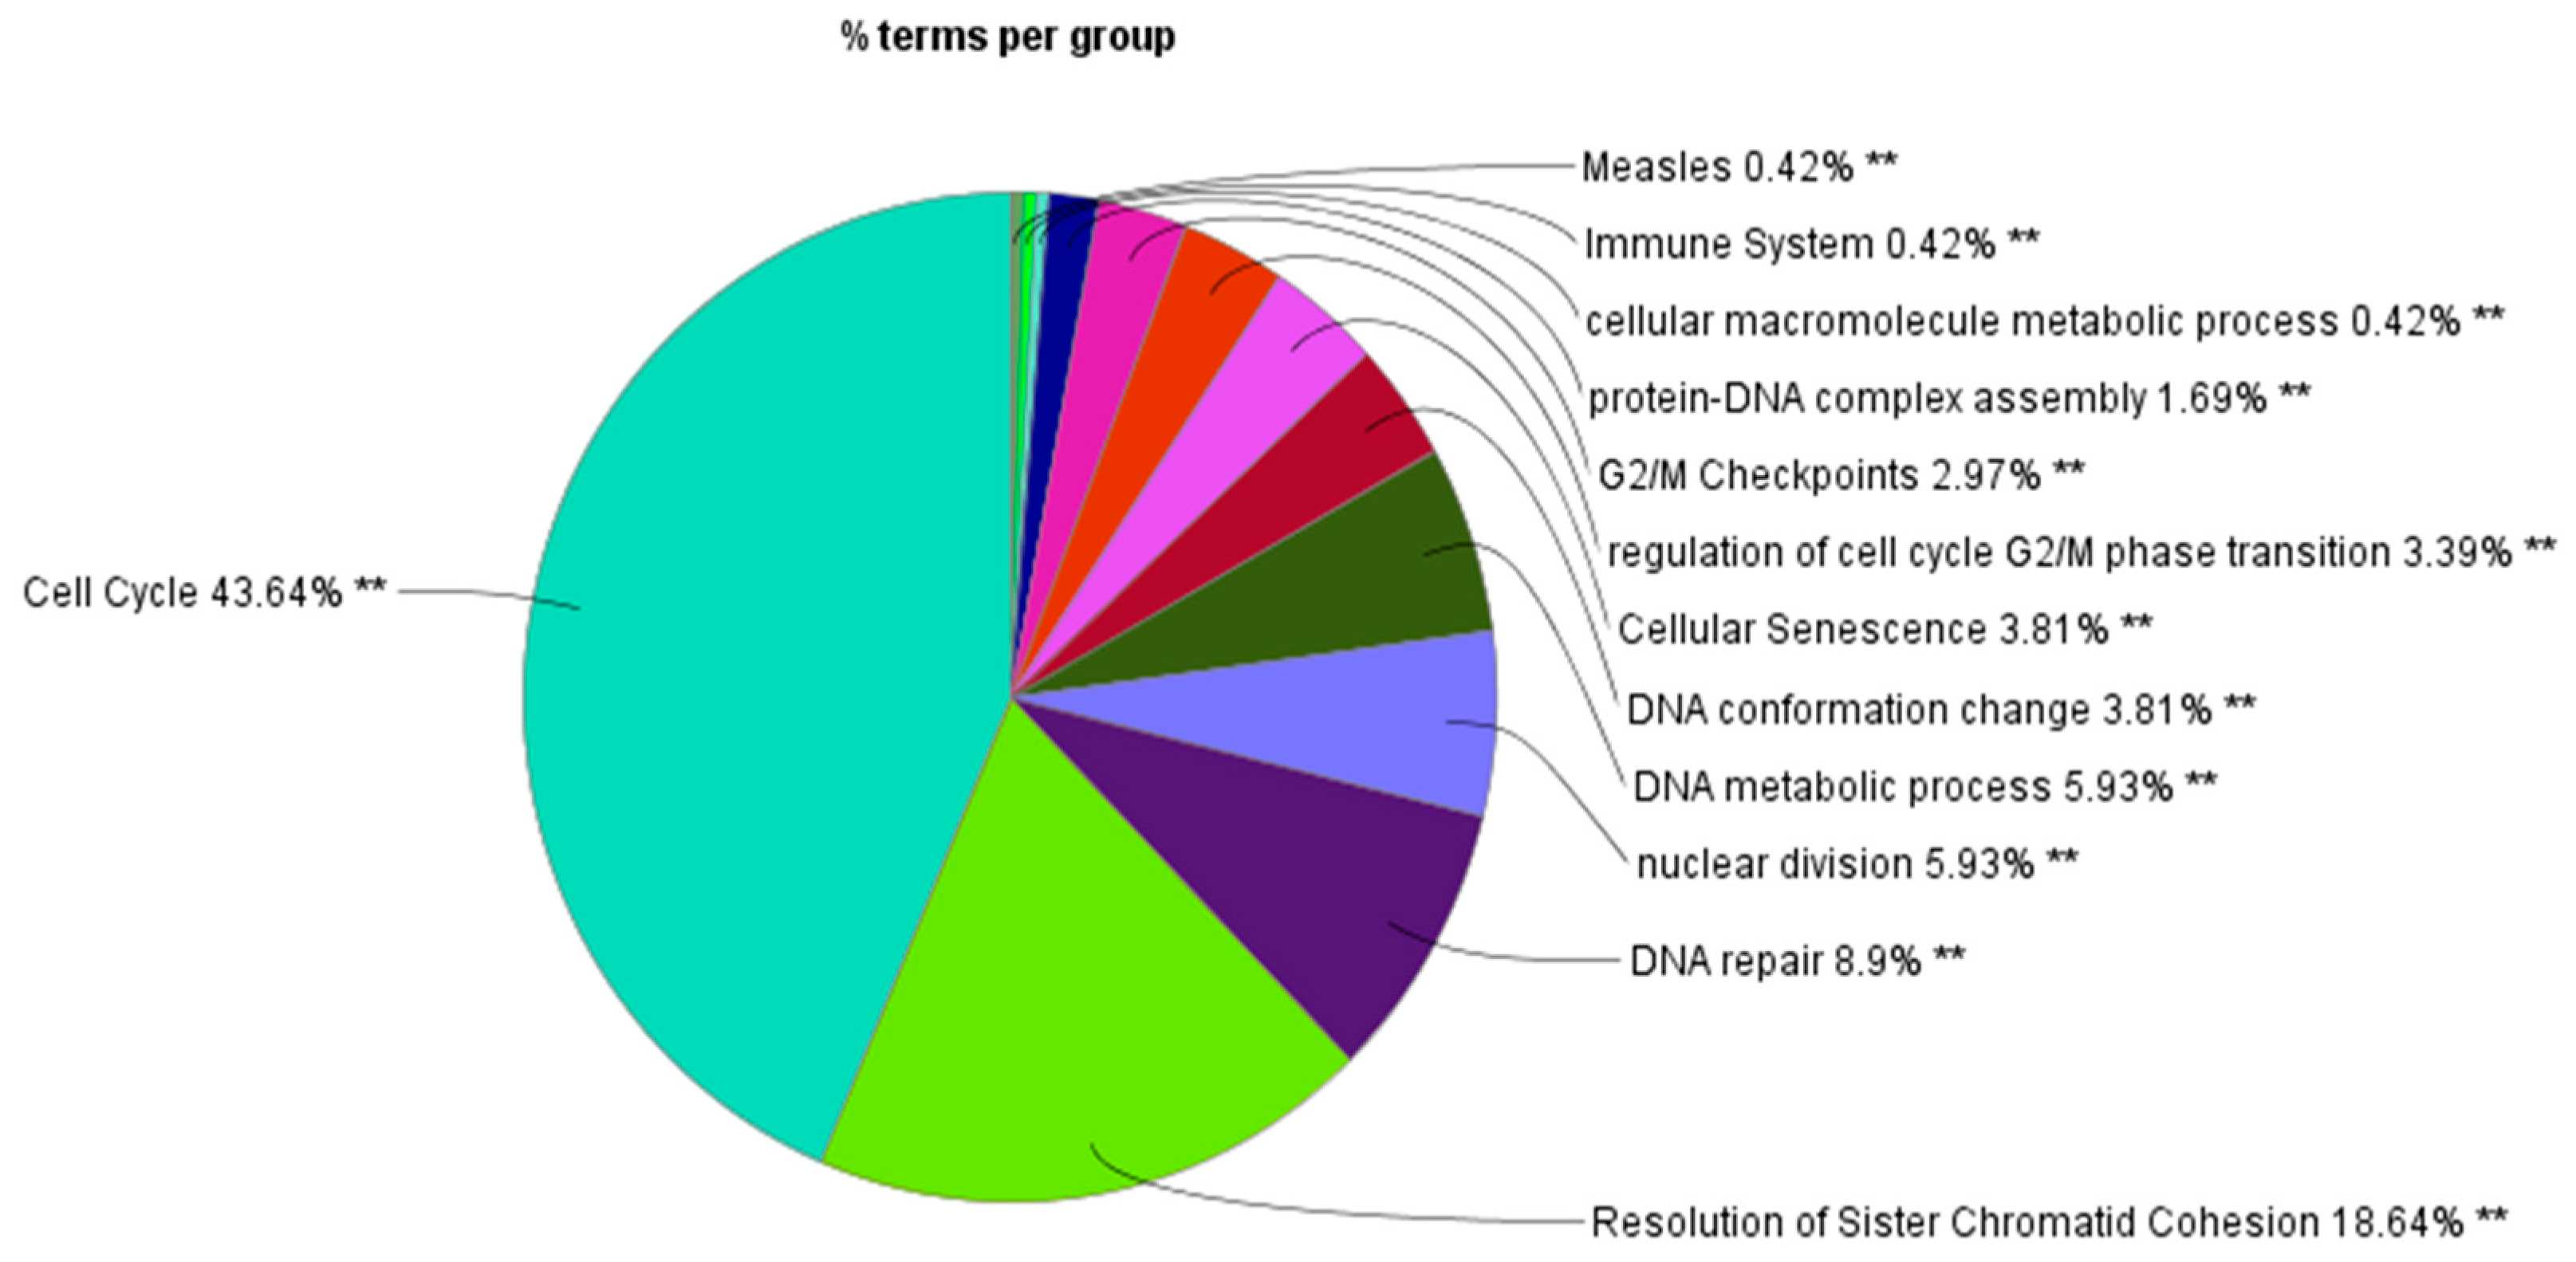
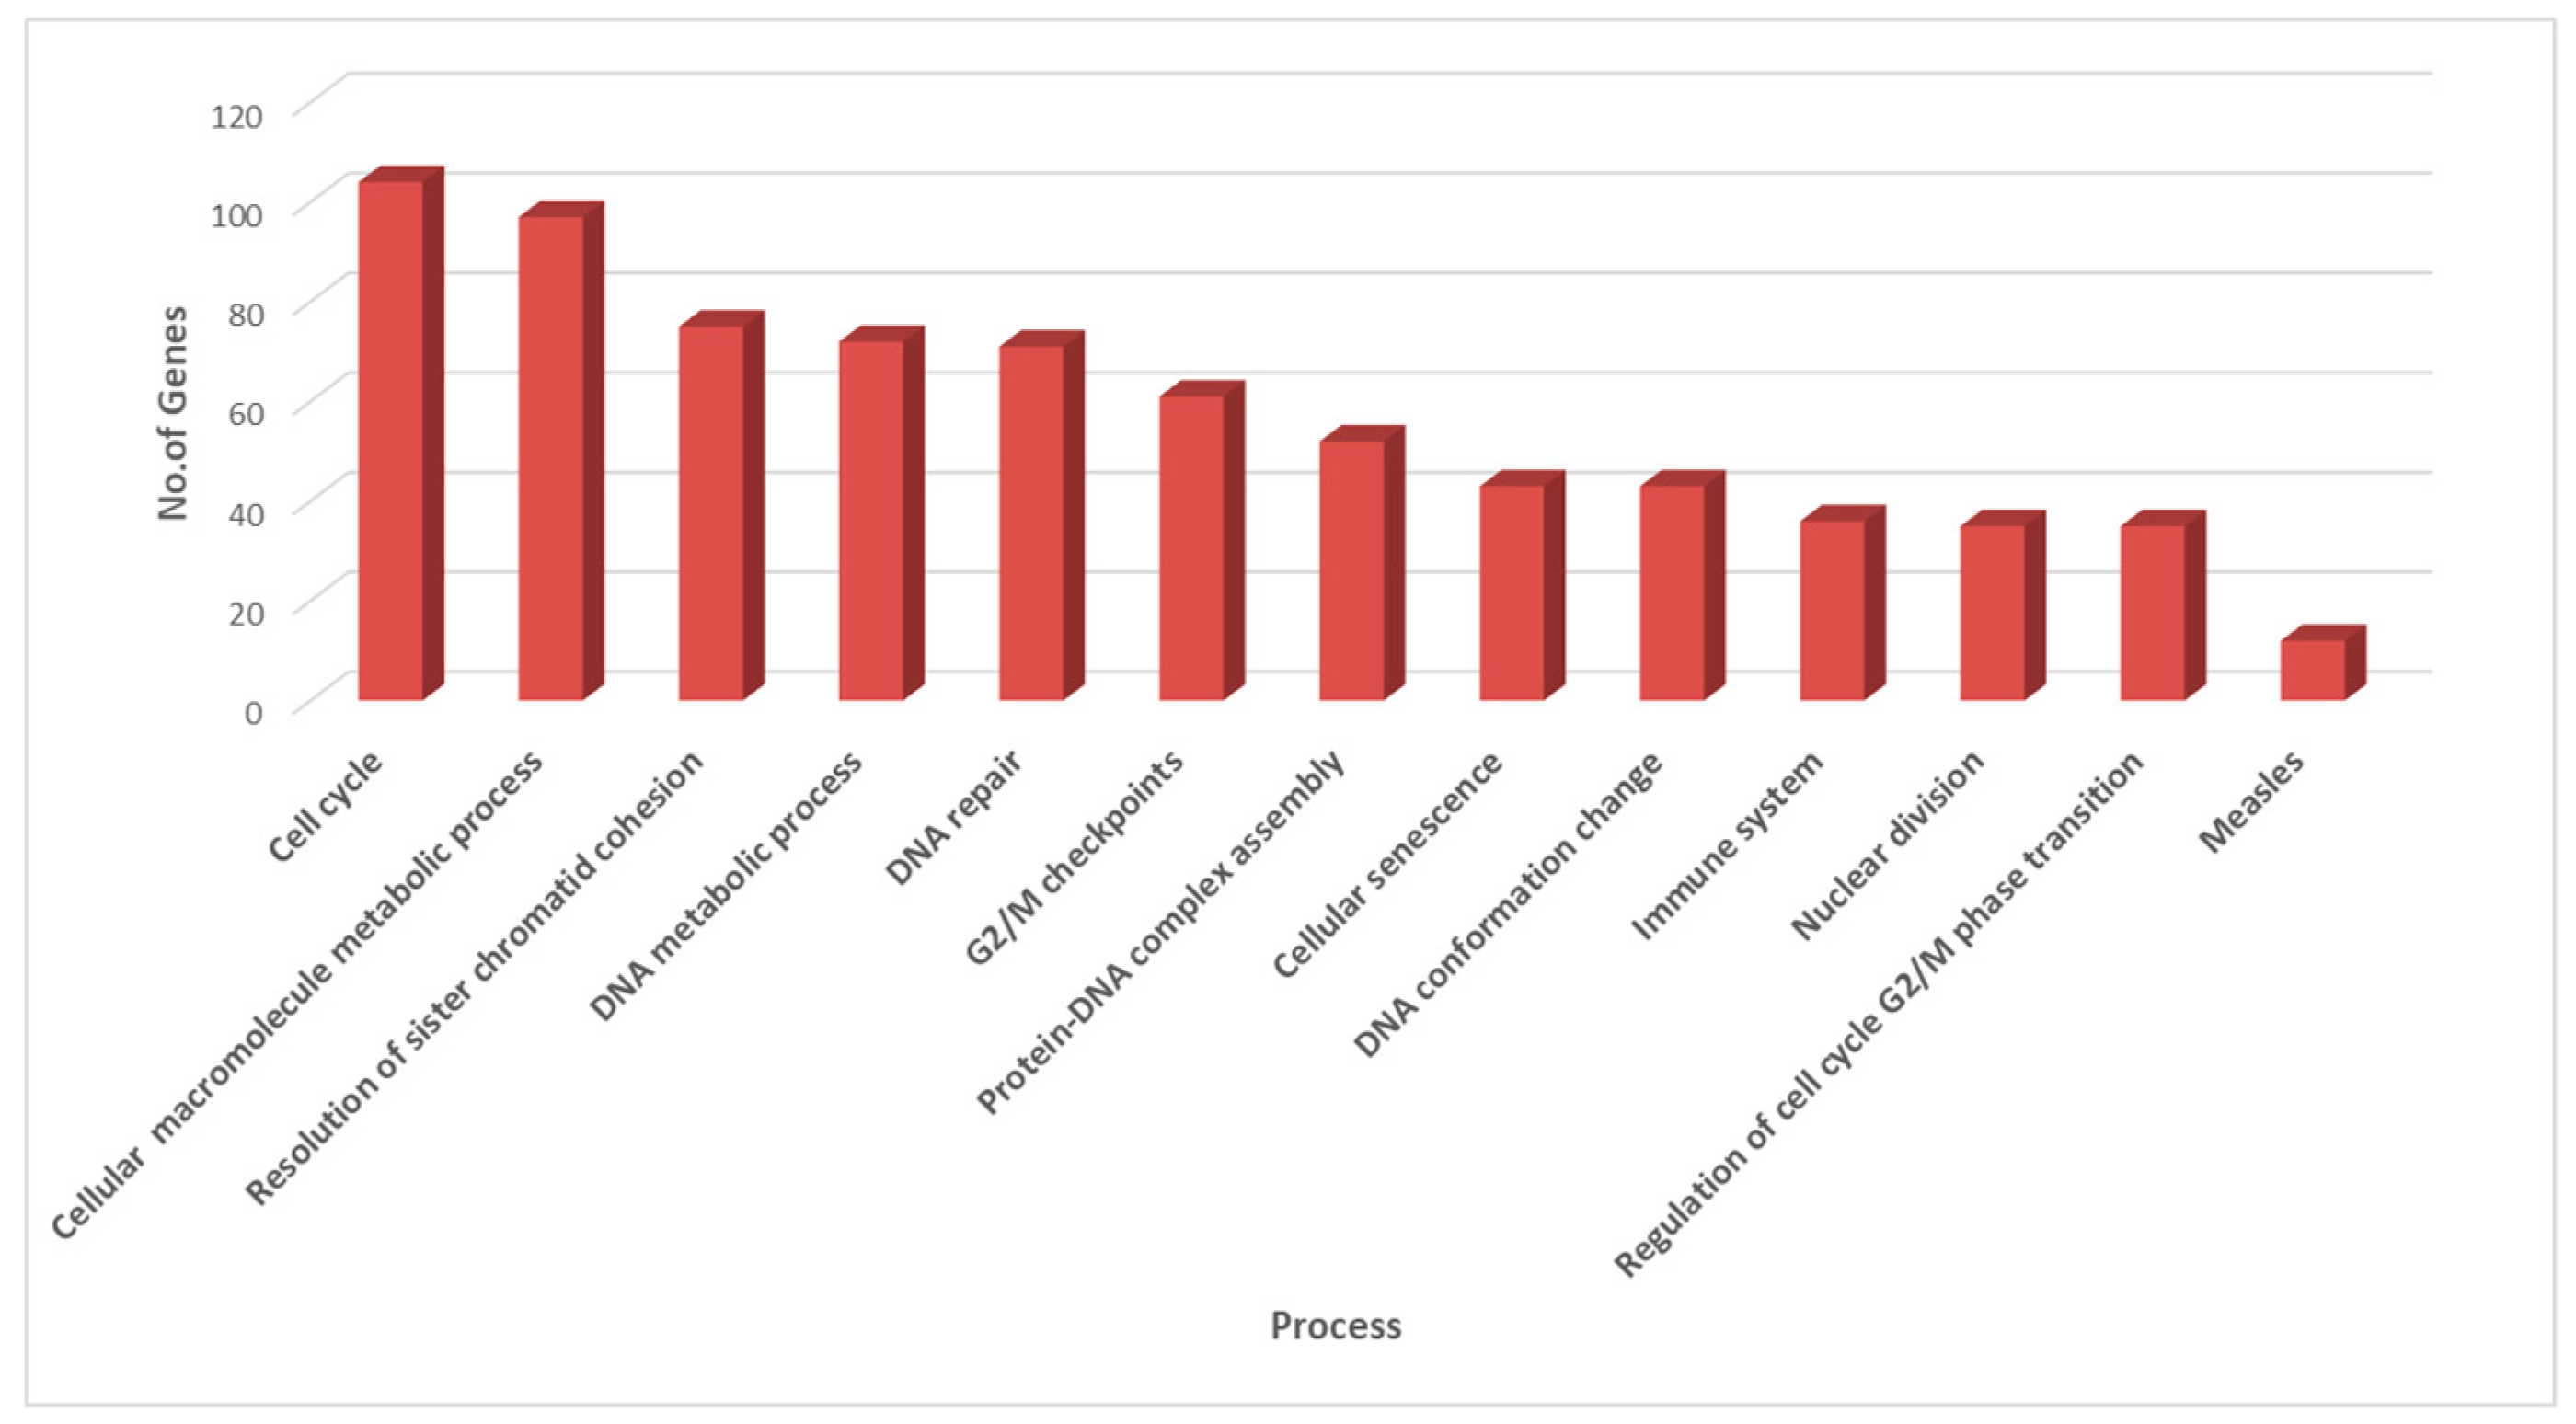
3.3. Clustering and GO Enrichment Analysis
3.4. PIN Construction and Topological and GO Analysis of Final Selected Seed Proteins
3.5. Molecular Docking Simulation of NNK with Key Proteins
4. Discussion
5. Conclusions
Supplementary Materials
Author Contributions
Acknowledgments
Conflicts of Interest
References
- Pavlopoulou, A.; Spandidos, D.A.; Michalopoulos, I. Human cancer databases (Review). Oncol. Rep. 2015, 33, 3–18. [Google Scholar] [CrossRef] [PubMed]
- Bray, F.; Colombet, M.; Mery, L.; Piñeros, M.; Znaor, A.; Zanetti, R.; Ferlay, J. Cancer Incidence in Five Continents; IARC: Lyon, France, 2017; Volume XI. [Google Scholar]
- Weinstein, I.B.; Joe, A.K. Mechanisms of Disease: Oncogene addiction—A rationale for molecular targeting in cancer therapy. Nat. Rev. Clin. Oncol. 2006, 3, 448–457. [Google Scholar] [CrossRef] [PubMed]
- Forouzanfar, M.H.; Afshin, A.; Alexander, L.T.; Anderson, H.R.; Bhutta, Z.A.; Biryukov, S.; Brauer, M.; Burnett, R.; Cercy, K.; Charlson, F.J.; et al. GBD 2015 Risk Factors Collaborators. Global, regional, and national comparative risk assessment of 79 behavioural, environmental and occupational, and metabolic risks or clusters of risks, 1990–2015: A systematic analysis for the Global Burden of Disease Study 2015. Lancet 2016, 388, 1659–1724. [Google Scholar]
- Hecht, S.S. Tobacco smoke carcinogens and breast cancer. Environ. Mol. Mutagen. 2002, 39, 119–126. [Google Scholar] [CrossRef] [PubMed]
- Haneef, M.; Lohani, M.; Dhasmana, A.; Jamal, Q.M.; Shahid, S.M.; Firdaus, S. Molecular Docking of Known Carcinogen 4-(Methyl-nitrosamino)-1-(3-pyridyl)-1-butanone (NNK) with Cyclin Dependent Kinases towards Its Potential Role in Cell Cycle Perturbation. Bioinformation 2014, 10, 526–532. [Google Scholar] [CrossRef]
- Xue, J.; Yang, S.; Seng, S. Mechanisms of Cancer Induction by Tobacco-Specific NNK and NNN. Cancers 2014, 6, 1138–1156. [Google Scholar] [CrossRef] [PubMed] [Green Version]
- Zabala, V.; Tong, M.; Yu, R.; Ramirez, T.; Yalcin, E.B.; Balbo, S.; Silbermann, E.; Deochand, C.; Nunez, K.; Hecht, S.; et al. Potential Contributions of the Tobacco Nicotine-Derived Nitrosamine Ketone (NNK) in the Pathogenesis of Steatohepatitis in a Chronic Plus Binge Rat Model of Alcoholic Liver Disease. Alcohol Alcohol. 2015, 50, 118–131. [Google Scholar] [CrossRef] [Green Version]
- Nunez, K.; Kay, J.; Krotow, A.; Tong, M.; Agarwal, A.R. Cigarette Smoke-Induced Alterations in Frontal White Matter Lipid Profiles Demonstrated by MALDI-Imaging Mass Spectrometry: Relevance to Alzheimer’s Disease. J. Alzheimers Dis. 2016, 51, 151–163. [Google Scholar] [CrossRef]
- Pai, M.; Mohan, A.; Dheda, K.; Leung, C.C.; Yew, W.W.; Christopher, D.J.; Sharma, S.K. Lethal Interaction: The colliding epidemics of tobacco and tuberculosis. Expert Rev. Anti Infect. Ther. 2007, 5, 385–391. [Google Scholar] [CrossRef]
- Wang, Y.; Zhang, X.S.; Chen, L. Modelling biological systems from molecules to dynamical networks. BMC Syst. Biol. 2012, 6 (Suppl. 1), 2–5. [Google Scholar] [CrossRef]
- Villaverde, A.F.; Ross, J.; Banga, J.R. Reverse engineering cellular networks with information theoretic methods. Cells 2013, 2, 306–329. [Google Scholar] [CrossRef] [PubMed]
- Szklarczyk, D.; Morris, J.H.; Cook, H.; Kuhn, M.; Wyder, S.; Simonovic, M.; Santos, A.; Doncheva, N.T.; Roth, A.; Bork, P.; et al. The STRING database in 2017: Quality-controlled protein-protein association networks, made broadly accessible. Nucleic Acids Res. 2017, 45, D362–D368. [Google Scholar] [CrossRef] [PubMed]
- Shannon, P.; Markiel, A.; Ozier, O.; Baliga, N.S.; Wang, J.T.; Ramage, D.; Amin, N.; Schwikowski, B.; Ideker, T. Cytoscape: A software environment for integrated models of biomolecular interaction networks. Genome Res. 2003, 13, 2498–2504. [Google Scholar] [CrossRef] [PubMed]
- Doncheva, N.T.; Assenov, Y.; Domingues, F.S.; Albrecht, M. Topological analysis and interactive visualization of biological networks and protein structures. Nat. Protoc. 2012, 7, 670–685. [Google Scholar] [CrossRef] [PubMed]
- Barabasi, A.L.; Oltvai, Z.N. Network biology: Understanding the cell’s functional organization. Nat. Rev. Genet. 2004, 5, 101–113. [Google Scholar] [CrossRef] [PubMed]
- Almaas, E. Biological impacts and context of network theory. J. Exp. Biol. 2007, 210, 1548–1558. [Google Scholar] [CrossRef] [PubMed] [Green Version]
- Klemm, K.; Bornholdt, S. Topology of biological networks and reliability of information processing. Proc. Natl. Acad. Sci. USA 2005, 102, 18414–18419. [Google Scholar] [CrossRef] [PubMed] [Green Version]
- Cingovska, I.; Kovachev, A.; Gmbh, A.T.; Trivodaliev, K.; Kalajdziski, S. Protein Function Prediction by Clustering of Protein-Protein Interaction Network. In Proceedings of the ICT Innovations 2011; Kocarev, L., Ed.; Advances in Intelligent and Soft Computing; Springer: Berlin, Germany, 2012; Volume 150. [Google Scholar] [CrossRef]
- Rajendran, P.; Thangavel, D. Clustering of Microarray Data to Identify Enriched Go Terms of Genes in Severe Asthma Dataset using Gene Enrichment Analysis. Ind. J. Sci. Tech. 2016, 9, 1–11. [Google Scholar] [CrossRef]
- Bindea, G.; Mlecnik, B.; Hackl, H.; Charoentong, P.; Tosolini, M.; Kirilovsky, A.; Fridman, W.H.; Pagès, F.; Trajanoski, Z.; Galon, J.; et al. Cytoscape plug-in to decipher functionally grouped gene ontology and pathway annotation networks. Bioinformatics 2009, 25, 1091–1093. [Google Scholar] [CrossRef] [PubMed]
- Dhasmana, A.; Jamal, Q.M.; Gupta, R.; Siddiqui, M.H.; Kesari, K.K.; Wadhwa, G.; Khan, S.; Haque, S.; Lohani, M. Titanium dioxide nanoparticles provide protection against polycyclic aromatic hydrocarbon BaP and chrysene-induced perturbation of DNA repair machinery: A computational biology approach. Biotechnol. Appl. Biochem. 2016, 63, 497–513. [Google Scholar] [CrossRef] [PubMed]
- Morris, G.M.; Huey, R.; Lindstrom, W.; Sanner, M.F.; Belew, R.K.; Goodsell, D.S.; Olson, A.J. AutoDock4 and AutoDockTools4: Automated docking with selective receptor flexibility. J. Comput. Chem. 2009, 30, 2785–2791. [Google Scholar] [CrossRef] [Green Version]
- Huberman, B.; Alto, P.; Kaneko, K.; Ouyang, Q. Handbook on Biological Networks; World Scientific Publishing Co. Pte. Ltd. 5 Toh Tuck Link: Singapore, 2009; Volume 10, ISBN 9789812838797. [Google Scholar]
- Junker, B.H.; Schreiber, F. Analysis of Biological Networks; A Wiley Interscience Publication: New York, NY, USA, 2008; ISBN 9780470041444. [Google Scholar]
- Pavlopoulos, G.A.; Maria Secrier, M.; Moschopoulos, C.N.; Soldatos, T.G.; Kossida, S.; Aerts, J.; Schneider, R.; Bagos, P.G. Using graph theory to analyze biological networks. BioData Min. 2011, 4, 10. [Google Scholar] [CrossRef]
- Chin, C.H.; Chen, S.H.; Wu, H.H.; Ho, C.W.; Ko, M.T.; Lin, C.Y. Cytohubba: Identifying hub objects and sub-networks from complex interactome. BMC Syst. Biol. 2014, 8 (Suppl. 4), S11. [Google Scholar] [CrossRef] [PubMed]
- Fisher, R.P. Secrets of a double agent: CDK7 in cell-cycle control and transcription. J. Cell Sci. 2005, 118, 5171–5180. [Google Scholar] [CrossRef] [PubMed] [Green Version]
- Bartkova, J.; Zemanova, M.; Bartek, J. Expression of CDK7/CAK in normal and tumor cells of diverse histogenesis, cell-cycleposition and differentiation. Int. J. Cancer. 1996, 66, 732–737. [Google Scholar] [CrossRef]
- Yang, R.; Müller, C.; Huynh, V.; Fung, Y.K.; Yee, A.S.; Koeffler, H.P. Functions of cyclin A1 in the cell cycle and its interactions with transcription factor E2F-1 and the Rb family of proteins. Mol. Cell. Biol. 1999, 19, 2400–2407. [Google Scholar] [CrossRef]
- Ray, A.; James, M.K.; Larochelle, S.; Fisher, R.P.; Blain, S.W. P27kip1 inhibits cyclin D-cyclin-dependent kinase 4 by two independent modes. Mol. Cell. Biol. 2009, 29, 986–999. [Google Scholar] [CrossRef] [PubMed]
- Liccardi, G.; Ramos, G.L.; Tenev, T.; Annibaldi, A.; Legrand, A.J.; Robertson, D.; Feltham, R.; Anderton, H.; Darding, M.; Peltzer, N.; et al. RIPK1 and Caspase-8 Ensure Chromosome Stability Independently of Their Role in Cell Death and Inflammation. Mol. Cell 2019, 73, 413–428. [Google Scholar] [CrossRef]
- Furusawa, Y.; Yamanouchi, Y.; Iizumi, T.; Zhao, Q.; Mitsuhashi, Y.; Morita, A.; Enomoto, A.; Tabuchi, Y.; Kondo, T. Checkpoint kinase 2 is dispensable for regulation of the p53 response but is required for G2/M arrest and cell survival in cells with p53 defects under heat stress. Apoptosis 2017, 22, 1225–1234. [Google Scholar] [CrossRef]
- Giráldez, S.; Galindo-Moreno, M.; Limón-Mortés, M.C.; Rivas, A.C.; Herrero-Ruiz, J.; Mora-Santos, M.; Sáez, C.; Japón, M.Á.; Tortolero, M.; Romero, F. G1/S phase progression is regulated by PLK1 degradation through the CDK1/βTrCP axis. FASEB J. 2017, 31, 2925–2936. [Google Scholar] [CrossRef]
- Renshaw, S.A.; Dempsey, C.E.; Barnes, F.A.; Bagstaff, S.M.; Dower, S.K.; Bingle, C.D.; Whyte, M.K. Three novel Bid proteins generated by alternative splicing of the human Bid gene. J. Biol. Chem. 2004, 279, 2846–2855. [Google Scholar] [CrossRef]
- Pennisi, R.; Antoccia, A.; Leone, S.; Ascenzi, P.; di Masi, A. Hsp90α regulates ATM and NBN functions in sensing and repair of DNA double-strand breaks. FEBS J. 2017, 284, 2378–2395. [Google Scholar] [CrossRef]
- Mullan, P.B.; Quinn, J.E.; Harkin, D.P. The role of BRCA1 in transcriptional regulation and cell cycle control. Oncogene 2006, 25, 5854–5863. [Google Scholar] [CrossRef] [Green Version]
- Timofeev, O.; Cizmecioglu, O.; Settele, F.; Kempf, T.; Hoffmann, I. Cdc25 phosphatases are required for timely assembly of CDK1-cyclin B at the G2/M transition. J. Biol. Chem. 2010, 285, 16978–16990. [Google Scholar] [CrossRef]
- Neganova, I.; Vilella, F.; Atkinson, S.P.; Lloret, M.; Passos, J.F.; von Zglinicki, T.; O’Connor, J.E.; Burks, D.; Jones, R.; Armstrong, L.; et al. An important role for CDK2 in G1 to S checkpoint activation and DNA damage response in human embryonic stem cells. Stem Cells 2011, 29, 651–659. [Google Scholar] [CrossRef]
- De Boer, L.; Oakes, V.; Beamish, H.; Giles, N.; Stevens, F.; Somodevilla-Torres, M.; Desouza, C.; Gabrielli, B. Cyclin A/cdk2 coordinates centrosomal and nuclear mitotic events. Oncogene 2008, 27, 4261–4268. [Google Scholar] [CrossRef] [Green Version]
- Brown, N.R.; Lowe, E.D.; Petri, E.; Skamnaki, V.; Antrobus, R.; Johnson, L.N. Cyclin B and cyclin A confer different substrate recognition properties on CDK2. Cell Cycle 2007, 6, 1350–1359. [Google Scholar] [CrossRef]
- Goto, H.; Natsume, T.; Kanemaki, M.T.; Kaito, A.; Wang, S.; Gabazza, E.C.; Inagaki, M.; Mizoguchi, A. Chk1-mediated Cdc25A degradation as a critical mechanism for normal cell cycle progression. J. Cell Sci. 2019, 132, jcs223123. [Google Scholar] [CrossRef]
- Sleeth, K.M.; Sørensen, C.S.; Issaeva, N.; Dziegielewski, J.; Bartek, J.; Helleday, T. RPA mediates recombination repair during replication stress and is displaced from DNA by checkpoint signalling in human cells. J. Mol. Biol. 2007, 373, 38–47. [Google Scholar] [CrossRef]
- Grudic, A.; Jul-Larsen, A.; Haring, S.J.; Wold, M.S.; Lønning, P.E.; Bjerkvig, R.; Bøe, S.O. Replication protein A prevents accumulation of single-stranded telomeric DNA in cells that use alternative lengthening of telomeres. Nucleic Acids Res. 2007, 35, 7267–7278. [Google Scholar] [CrossRef]
- Bakkenist, C.J.; Kastan, M.B. DNA damage activates ATM through intermolecular autophosphorylation and dimer dissociation. Nature 2003, 421, 499–506. [Google Scholar] [CrossRef] [PubMed]
- Taira, N.; Yamamoto, H.; Yamaguchi, T.; Miki, Y.; Yoshida, K. ATM augments nuclear stabilization of DYRK2 by inhibiting MDM2 in the apoptotic response to DNA damage. J. Biol. Chem. 2010, 285, 4909–4919. [Google Scholar] [CrossRef] [PubMed]
- Wang, Z.; Xie, Y.; Zhang, L.; Zhang, H.; An, X.; Wang, T.; Meng, A. Migratory localization of cyclin D2-Cdk4 complex suggests a spatial regulation of the G1-S transition. Cell Struct. Funct. 2008, 33, 171–183. [Google Scholar] [CrossRef] [PubMed]
- Zaragoza, K.; Bégay, V.; Schuetz, A.; Heinemann, U.; Leutz, A. Repression of transcriptional activity of C/EBPalpha by E2F-dimerization partner complexes. Mol. Cell. Biol. 2010, 30, 2293–2304. [Google Scholar] [CrossRef] [PubMed]
- Guo, A.; Salomoni, P.; Luo, J.; Shih, A.; Zhong, S.; Gu, W.; Pandolfi, P.P. The function of PML in p53-dependent apoptosis. Nat. Cell Biol. 2000, 2, 730–736. [Google Scholar] [CrossRef] [PubMed]
- Huarte, M.; Guttman, M.; Feldser, D.; Garber, M.; Koziol, M.J.; Kenzelmann-Broz, D.; Khalil, A.M.; Zuk, O.; Amit, I.; Rabani, M.; et al. A large intergenic noncoding RNA induced by p53 mediates global gene repression in the p53 response. Cell 2010, 142, 409–419. [Google Scholar] [CrossRef]
- Ren, S.; Rollins, B.J. Cyclin C/cdk3 promotes Rb-dependent G0 exit. Cell 2004, 117, 239–251. [Google Scholar] [CrossRef]
- Maréchal, A.; Li, J.M.; Ji, X.Y.; Wu, C.S.; Yazinski, S.A.; Nguyen, H.D.; Liu, S.; Jiménez, A.E.; Jin, J.; Zou, L. PRP19 transforms into a sensor of RPA-ssDNA after DNA damage and drives ATR activation via a ubiquitin-mediated circuitry. Mol. Cell 2014, 53, 235–246. [Google Scholar] [CrossRef]
- Jamal, Q.M.S.; Dhasmana, A.; Lohani, M.; Firdaus, S.; Ansari, M.Y.; Sahoo, G.C.; Haque, S. Binding pattern elucidation of NNK and NNAL cigarette smoke carcinogens with NER pathway enzymes: An onco-informatics study. Asian Pac. J. Cancer Prev. 2015, 16, 5311–5317. [Google Scholar] [CrossRef]
- Huang, R.Y.; Li, M.Y.; Hsin, M.K.; Underwood, M.J.; Ma, L.T.; Mok, T.S.; Warner, T.D.; Chen, G.G. 4-Methylnitrosamino-1-3-pyridyl-1-butanone (NNK) promotes lung cancer cell survival by stimulating thromboxane A 2 and its receptor. Oncogene 2011, 30, 106–116. [Google Scholar] [CrossRef]
- Boccaletti, S.; Latora, V.; Moreno, Y.; Chavez, M.; Hwang, D.U. Complex networks: Structure and dynamics. Phys. Rep. 2006, 424, 175–308. [Google Scholar] [CrossRef]
- Koutsogiannouli, E.; Papavassiliou, A.G.; Papanikolaou, N.A. Complexity in cancer biology: Is systems biology the answer? Cancer Med. 2013, 2, 164–177. [Google Scholar] [CrossRef] [PubMed]
- Kitano, H. Systems Biology: A brief overview. Science 2002, 295, 162–1664. [Google Scholar] [CrossRef] [PubMed]
- Bosley, A.D.; Das, S.; Andresson, T. A Role for Protein–Protein Interaction Networks in the Identification and Characterization of Potential Biomarkers. In Proteomic and Metabolomic Approaches to Biomarker Discovery; Issaq, H.J., Ed.; Academic Press: London, UK, 2013; Chapter 21; pp. 333–347. ISBN 9780123947956. [Google Scholar]
- Klipp, E.; Liebermeister, W.; Wierling, C.; Kowald, A.; Lehrach, H.; Herwig, R. Systems Biology: A Textbook; Wiley-VCH: Weinheim, Germany, 2009; ISBN 978-3-527-31874-2. [Google Scholar]
- Liu, J.; Xiong, Q.; Shi, W.; Shi, X.; Wang, K. Evaluating the importance of nodes in complex networks. Phys. A Stat. Mech. Appl. 2016, 452, 209–219. [Google Scholar] [CrossRef] [Green Version]
- Yu, H.; Kim, P.M.; Sprecher, E.; Trifonov, V.; Gerstein, M. The importance of bottlenecks in protein networks: Correlation with gene essentiality and expression dynamics. PLoS Comput. Biol. 2007, 3, 713–720. [Google Scholar] [CrossRef] [PubMed]
- Hustedt, N.; Durocher, D. The control of DNA repair by the cell cycle. Nat. Cell Boil. 2017, 19, 1–9. [Google Scholar] [CrossRef] [PubMed]
- Huang, R.Y.; Chen, G.G. Cigarette smoking, cyclooxygenase-2 pathway and cancer. Biochim. Biophys. Acta Rev. Cancer 2011, 1815, 158–169. [Google Scholar] [CrossRef]


| Cluster | Score | Nodes | Edges | Seeds | Connectors | Node IDs |
|---|---|---|---|---|---|---|
| 1 | 29.862 | 30 | 433 | 19 | 11 | PLK1, CASC5, BUB3, CDCA8, STAG1, BUB1B, CCNB2, CCNB1, BUB1, ESPL1, CENPF, KIF2C, CDCA5, MAD2L1, CDK1, PDS5B, WAPAL, APITD1, SKA2, RAD21, SMC1A, KNTC1, CDC20, CENPA, CENPE, SMC3, STAG2, MAD1L1, AURKB, INCENP |
| 2 | 19.3 | 41 | 386 | 22 | 19 | CDKN1A, FBXO31, CDC6, CDK2, RNF144B, KLHL42, CCNA1, DBF4, CDC7, MCM4, POLA2, PRIM2, CDC34, POLA1, SKP2, ORC3, MCM2, MCM5, ORC2, ORC6, MCM6, MCM3, ORC4, CHEK1, AURKA, PTTG1, CDC45, PRIM1, MCM10, CDT1, ORC1, HUWE1, ORC5, RBBP6, NEK2, MCM7, ANAPC16, ANAPC13, CDKN1B, RPA1, CCNA2 |
| 3 | 14.652 | 47 | 337 | 9 | 38 | ERCC2, E2F1, FBXO5, CDC23, ANAPC5, FANCE, FANCC, FANCG, BLM, ANAPC4, ANAPC1, BRCA1, RB1, FANCF, FANCL, C17orf70, CCNE1, C19orf40, FANCD2, FANCI, ANAPC10, FANCM, FANCB, GTF2H5, CCND2, FZR1, CDC26, RMI1, TOP3A, FANCA, GTF2H4, ANAPC11, CDC27, ANAPC2, GTF2H2, ANAPC7, GTF2H1, STRA13, CDC16, CCNH, C1orf86, ERCC3, ATM, CCND3, BARD1, GTF2H3, CCND1 |
| 4 | 10.762 | 22 | 113 | 13 | 9 | FAS, RIPK1, CASP8, IKBKG, BID, HDAC1, TNFRSF10B, TRADD, TP53, TFDP1, TRAF2, TNFSF10, FADD, FASLG, TNFRSF10A, CASP10, E2F2, TOPBP1, IKBKB, CDK4, CCNE2, CDK6 |
| 5 | 7 | 7 | 21 | 7 | 0 | BBC3, BCL2A1, BCL2L11, BCL2, MCL1, PMAIP1, BCL2L1 |
| 6 | 5 | 5 | 10 | 2 | 3 | IGFBP1, LGALS1, IGFBP4, QSOX1, IGFBP5 |
| 7 | 4.333 | 7 | 13 | 5 | 2 | NCKAP1, WASF2, CYFIP2, PRKCA, PTK2, PRKCB, BCAR1 |
| 8 | 4 | 4 | 6 | 4 | 0 | H1F0, HMGA2, ASF1A, HIRA |
| 9 | 4 | 4 | 6 | 1 | 3 | KIAA1429, WTAP, CBLL1, ZC3H13 |
| 10 | 3.333 | 4 | 5 | 3 | 1 | EAF2, GTF2H2C, CDK7, MNAT1 |
| 11 | 3.333 | 4 | 5 | 4 | 0 | OAS1, IFI27, OAS2, IFIT3 |
| 12 | 3.333 | 7 | 10 | 5 | 2 | STAG3, CEP70, FKBP6, SMC1B, NEDD1, HSP90AA1, TPX2 |
| 13 | 3 | 3 | 3 | 3 | 0 | MAP3K5, TRAF1, BIRC3 |
| 14 | 3 | 3 | 3 | 3 | 0 | PSMC3IP, MND1, DMC1 |
| 15 | 3 | 3 | 3 | 3 | 0 | OIP5, MIS18A, NPM1 |
| 16 | 3 | 3 | 3 | 3 | 0 | TNFRSF11A, TNFRSF12A, TNFSF11 |
| 17 | 3 | 3 | 3 | 3 | 0 | RHOB, RHOC, CDC25C |
| 18 | 3 | 3 | 3 | 3 | 0 | SDCBP, PYCARD, CPPED1 |
| 19 | 3 | 3 | 3 | 3 | 0 | FGF2, FGFR3, FGF9 |
| Name | Betweenness | Bottleneck | Closeness | Clustering Coefficient | Degree |
|---|---|---|---|---|---|
| CHEK1 | 835.45994 | 29 | 116.61667 | 0.36501 | 52 |
| TP53 | 8007.14223 | 27 | 126.41667 | 0.19394 | 55 |
| BRCA1 | 2686.48081 | 23 | 127.45 | 0.26346 | 65 |
| CDK1 | 3705.28949 | 19 | 140.41667 | 0.32157 | 85 |
| CDK4 | 935.26901 | 14 | 112.66667 | 0.42521 | 35 |
| HSP90AA1 | 3657.32532 | 13 | 101.66667 | 0.27273 | 22 |
| RPA2 | 1523.40238 | 9 | 125.78333 | 0.33978 | 64 |
| ATM | 1803.73545 | 8 | 115.36667 | 0.33718 | 40 |
| TFDP1 | 426.33754 | 6 | 111.78333 | 0.46702 | 34 |
| CDKN1B | 1218.04331 | 4 | 120.41667 | 0.44245 | 50 |
| CASP8 | 1842.98595 | 4 | 90.11667 | 0.44853 | 17 |
| PYCARD | 796 | 3 | 62.18333 | 0.33333 | 3 |
| CCNA1 | 894.78122 | 3 | 125.2 | 0.39548 | 60 |
| CCNB1 | 1208.39103 | 3 | 127.26667 | 0.40665 | 69 |
| RPA1 | 1657.28981 | 2 | 126.45 | 0.33269 | 65 |
| CDK2 | 1887.40725 | 2 | 134.2 | 0.34035 | 76 |
| CHEK2 | 126.13416 | 2 | 95.95 | 0.3619 | 15 |
| BID | 577.03969 | 2 | 90.78333 | 0.4269 | 19 |
| RB1 | 608.84911 | 2 | 107.66667 | 0.44138 | 30 |
| PLK1 | 1284.13385 | 2 | 121.25 | 0.49545 | 56 |
| CDK7 | 488.15015 | 2 | 108.78333 | 0.49733 | 34 |
| Function | Groups | Group Genes |
|---|---|---|
| Cell cycle | Group12 | ANAPC1|ASF1A|ATM|AURKA|AURKB|BARD1|BBC3|BCAR1|BCL2|BCL2A1|BCL2L1|BCL2L11| BIRC3|BRCA1|BUB1|BUB1B|BUB3|CASP8|CCNA1|CCNA2|CCNB1|CCNB2|CCNE2|CDC20|CDC25C| CDC34|CDC45|CDC6|CDC7|CDCA5|CDCA8|CDK1|CDK2|CDK6|CDKN1A|CENPA|CENPE|CENPF|CEP70|CHEK1|CYFIP2|DBF4|DMC1|E2F1|E2F2|EAF2|FANCC|FANCD2|FAS|FASLG|FBXO31|FBXO5|FGF2| FGF9|FGFR3|FKBP6|H1F0|HDAC1|HIRA|HMGA2|HSP90AA1|HUWE1|KIF2C|KNTC1|LGALS1|MCL1| MCM2|MCM4|MCM5|MCM6|MCM7|MDM2|MIS18A|MNAT1|MND1|NEDD1|NEK2|NPM1|OIP5| PDS5B|PLK1|PMAIP1|POLA1|PRKCA|PRKCB|PSMC3IP|PTK2|PYCARD|RBBP6|RHOB|RHOC|RNF144B|SDCBP|SKA2|STAG1|STAG3|TFDP1|TNFRSF10A|TNFRSF10B|TNFRSF10C|TNFRSF12A|TOPBP1|TP53|TRAF1 |
| Cellular senescence | Group06 | ANAPC1|ASF1A|ATM|BBC3|BCL2|BCL2L1|BCL2L11|BIRC3|BRCA1|CASP8|CCNA1| CCNA2|CCNE2|CDC20|CDC25C|CDCA5|CDK1|CDK2|CDK6|CDKN1A|CHEK1|E2F1|E2F2|FAS| FASLG|FGF2|FGF9|FGFR3|H1F0|HDAC1|HIRA|HMGA2|HSP90AA1|MAP3K5|MCL1|MDM2|PMAIP1| PRKCA|PRKCB|PTK2|TFDP1|TP53|TRAF1 |
| DNA conformation change | Group07 | ASF1A|ATM|BBC3|BCL2L11|BIRC3|CASP8|CCNB1|CDC45|CDCA5|CDK1|CENPA|CENPE|CENPF| DMC1|FANCC|FAS|FBXO5|H1F0|HDAC1|HIRA|HMGA2|HSP90AA1|KNTC1|MCM2|MCM4|MCM5| MCM6|MCM7|MDM2|MIS18A|MNAT1|NPM1|OAS1|OIP5|PMAIP1|POLA1|PRKCA|PTK2|PYCARD| RHOC|TNFSF11|TP53|TRAF1 |
| DNA metabolic process | Group08 | ASF1A|ATM|AURKA|AURKB|BARD1|BBC3|BCL2|BCL2A1|BCL2L1|BCL2L11|BRCA1|BUB1|BUB1B|BUB3|CCNA1|CCNA2|CCNB1|CCNE2|CDC25C|CDC34|CDC45|CDC6|CDC7|CDCA5|CDK1|CDK2|CDK6|CDKN1A|CENPF|CHEK1|DBF4|DMC1|E2F1|EAF2|FANCC|FANCD2|FAS|FBXO31|FBXO5|FKBP6|H1F0|HDAC1|HMGA2|HSP90AA1|HUWE1|KNTC1|MCL1|MCM2|MCM4|MCM5|MCM6|MCM7|MDM2|MIS18A|MNAT1|MND1|NEK2|NPM1|PDS5B|PLK1|PMAIP1|POLA1|PRKCB|PSMC3IP|PYCARD|RBBP6|TFDP1|TNFRSF10A|TNFRSF10B|TNFRSF10C|TOPBP1|TP53 |
| DNA repair | Group10 | ANAPC1|ASF1A|ATM|AURKA|AURKB|BARD1|BBC3|BCL2|BCL2L11|BRCA1|CASP8|CCNA1|CCNA2| CCNB1|CCNB2|CCNE2|CDC20|CDC25C|CDC34|CDC45|CDC6|CDC7|CDCA5|CDK1|CDK2|CDK6|CDKN1A|CENPF|CEP70|CHEK1|DBF4|DMC1|E2F1|E2F2|EAF2|FANCC|FANCD2|FAS|FASLG|H1F0|HDAC1| HIRA|HMGA2|HSP90AA1|HUWE1|MAP3K5|MCM2|MCM4|MCM5|MCM6|MCM7|MDM2|MNAT1| MND1|NEDD1|NEK2|NPM1|PDS5B|PLK1|PMAIP1|POLA1|PRKCA|PRKCB|RBBP6|TFDP1|TNFRSF10A|TNFRSF10B|TNFRSF10C|TOPBP1|TP53|TRAF1 |
| G2/M checkpoints | Group04 | ASF1A|ATM|AURKA|AURKB|BARD1|BBC3|BCL2|BCL2A1|BCL2L1|BCL2L11|BRCA1|CCNA1|CCNA2| CCNB1|CCNB2|CCNE2|CDC25C|CDC34|CDC45|CDC6|CDC7|CDCA5|CDK1|CDK2|CDKN1A|CENPF| CHEK1|DBF4|DMC1|E2F1|FANCC|FANCD2|FBXO31|FKBP6|H1F0|HDAC1|HMGA2|HSP90AA1|HUWE1|MCL1|MCM2|MCM4|MCM5|MCM6|MCM7|MDM2|MIS18A|MNAT1|MND1|NEK2|NPM1|PDS5B|PLK1|PMAIP1|POLA1|PSMC3IP|PYCARD|RBBP6|TFDP1|TOPBP1|TP53 |
| Immune system | Group01 | ANAPC1|BCL2|BCL2L1|BIRC3|CASP8|CDC20|CDC34|CDK1|CDKN1A|CENPE|CPPED1|CYFIP2|FASLG| FBXO31|FGF2|FGF9|FGFR3|HSP90AA1|HUWE1|IFI27|IFIT3|KIF2C|MCL1|OAS1|OAS2|PRKCB|PTK2| PYCARD|QSOX1|RBBP6|RNF144B|SDCBP|TNFRSF11A|TNFRSF12A|TNFSF11|TP53 |
| Measles | Group00 | BBC3|CCNE2|CDK2|CDK6|FAS|FASLG|OAS1|OAS2|TNFRSF10A|TNFRSF10B|TNFRSF10C|TP53 |
| Resolution of sister chromatid cohesion | Group11 | ANAPC1|ATM|AURKA|AURKB|BARD1|BBC3|BCL2|BCL2L11|BIRC3|BRCA1|BUB1|BUB1B|BUB3|CASP8|CCNA1|CCNA2|CCNB1|CCNB2|CCNE2|CDC20|CDC25C|CDC34|CDC6|CDC7|CDCA5|CDCA8|CDK1|CDK2|CDKN1A|CENPA|CENPE|CENPF|CEP70|CHEK1|CYFIP2|DMC1|E2F1|FANCD2|FAS|FASLG|FBXO31|FBXO5|FKBP6|HMGA2|HSP90AA1|HUWE1|IFI27|KIF2C|KNTC1|MAP3K5|MDM2|MNAT1|MND1|NEDD1|NEK2|NPM1|PDS5B|PLK1|PMAIP1|PRKCA|PRKCB|PSMC3IP|PTK2|PYCARD|RBBP6|RNF144B|SDCBP|SKA2|STAG1|STAG3|TFDP1|TNFRSF10A|TNFRSF10B|TOPBP1|TP53 |
| Cellular macromolecule metabolic process | Group02 | ANAPC1|ASF1A|ATM|AURKA|AURKB|BARD1|BBC3|BCL2|BCL2L11|BIRC3|BRCA1|BUB1|BUB1B|BUB3|CASP8|CCNA1|CCNA2|CCNB1|CCNE2|CDC20|CDC25C|CDC34|CDC45|CDC6|CDC7|CDCA5|CDCA8|CDK1|CDK2|CDK6|CDKN1A|CENPE|CENPF|CHEK1|CPPED1|CYFIP2|DBF4|DMC1|E2F1|E2F2|EAF2|FANCC|FANCD2|FAS|FASLG|FBXO31|FBXO5|FGF2|FGF9|FGFR3|FKBP6|H1F0|HDAC1|HIRA|HMGA2|HSP90AA1|HUWE1|IFI27|LGALS1|MAP3K5|MCM2|MCM4|MCM5|MCM6|MCM7|MDM2|MIS18A|MNAT1|MND1|NEK2|NPM1|OAS1|OAS2|PDS5B|PLK1|PMAIP1|POLA1|PRKCA|PRKCB|PSMC3IP|PTK2|PYCARD|QSOX1|RBBP6|RNF144B|SDCBP|STAG1|TFDP1|TNFRSF10A|TNFRSF10B|TNFRSF10C|TNFRSF11A|TNFSF11|TOPBP1|TP53|TRAF1|WTAP |
| Nuclear division | Group09 | ANAPC1|ATM|AURKA|AURKB|BRCA1|BUB1|BUB1B|BUB3|CCNA1|CCNA2|CCNB1|CCNE2|CDC20| CDC25C|CDC6|CDCA5|CDCA8|CDK1|CDK2|CENPE|CENPF|CHEK1|DMC1|FANCD2|FBXO5|FKBP6| KIF2C|KNTC1|MND1|NEK2|PDS5B|PLK1|PSMC3IP|STAG1|STAG3 |
| Protein–DNA complex assembly | Group03 | ASF1A|ATM|AURKA|AURKB|BBC3|BCL2|BCL2L11|BIRC3|BRCA1|CASP8|CCNB1|CDC20|CDC34|CDC45|CDK1|CDK2|CENPA|CENPE|CENPF|CEP70|DMC1|FANCC|FAS|FBXO5|H1F0|HDAC1|HIRA|HMGA2|HSP90AA1|KNTC1|MCM2|MCM7|MDM2|MIS18A|MNAT1|NEDD1|NEK2|NPM1|OAS1|OIP5|PLK1|PMAIP1|PRKCA|PTK2|PYCARD|RHOC|SDCBP|STAG1|STAG3|TNFSF11|TP53|TRAF1 |
| Regulation of cell cycle G2/M phase transition | Group05 | ANAPC1|ATM|AURKA|AURKB|BARD1|BRCA1|BUB1B|BUB3|CCNA1|CCNA2|CCNB1|CCNB2|CDC20| CDC25C|CDC7|CDK1|CDK2|CDK6|CDKN1A|CENPF|CEP70|CHEK1|FBXO5|HMGA2|HSP90AA1|MDM2|MNAT1|NEDD1|NEK2|NPM1|PLK1|PRKCA|PRKCB|TOPBP1|TP53 |
| S.No | Protein | Ligand | Binding Energy (Kcal/Mol) | Ki | Binding Residues | H-Bond | Distance |
|---|---|---|---|---|---|---|---|
| 1. | CDK7 | NNK | −5.93 | 45.31 μM | Leu18, Val26, Ala39, Lys41, Ile75, Phe91, Asp92, Phe93, Met94, Glu95, Thr96, Asp97, Leu144, Asp155 | CDK7:MET94:N - :NNK:O7 | 2.86224 |
| 2. | CCNA1 (connector) | NNK | −5.60 | 79.09 μM | Cys97, Gly98, Gln99, Gly100, Val164, Asp165, Thr166, Gly167, Thr168, Leu169, Lys170, Leu173, Tyr218 | :GLY98:H - :NNK:O7 :GLY167:H - :NNK:N10 :THR168:H - :ASP165:O :LYS170:H - :NNK:N14 :LYS170:H - :NNK:O15 :NNK:N14 - :THR168:O | 1.83311 1.98057 2.11393 2.36928 1.99807 3.02246 |
| 3. | CDKN1B | NNK | −5.42 | 106.27 μM | His573, Lys574, Pro575, Leu576, Glu581, Trp582, Gln583, Glu584 | CDKN1B:GLN583:N - :NNK:N14 CDKN1B:GLN583:N - :NNK:O15 :NNK:N14 - CDKN1B:GLN583:O | 2.84311 2.79833 2.96186 |
| 4. | CASP8 | NNK | −5.35 | 119.75 μM | Lys2224, Tyr2226, Gln2227, Asp2308, Gly2350, Lys2351, Pro2352, Asp2398, Arg2471, Lys2472 | CASP8:LYS2351:HZ1 - :NNK:N10 CASP8:ARG2471:HH21 - :NNK:N2 CASP8:ARG2471:HH21 - :NNK:N14 CASP8:ARG2471:HH21 - :NNK:O15 CASP8:LYS2472:HZ1 - :NNK:O7 | 1.9527 2.48624 2.19123 2.25672 1.82255 |
| 5. | CHEK2 (connector) | NNK | −5.35 | 120.25 μM | Ser228, Gly229, Ala230, Cys231, Gly232, Val234, Lys249, Leu301, Thr367, Asp368 | CHEK2:CYS231:N - :NNK:N10 CHEK2:GLY232:N - :NNK:N10 CHEK2:LYS249:NZ - :NNK:N14 CHEK2:ASP368:N - :NNK:O15 | 3.11295 3.11412 3.20168 2.86381 |
| 6. | PLK1 | NNK | −5.21 | 152.98 μM | Lys413, Trp414, Val415, Asp416, Leu490, Asn533, Lys540 | PLK1:TRP414:N - :NNK:O7 PLK1:ASP416:N - :NNK:N14 PLK1:ASP416:N - :NNK:O15 PLK1:ASN533:ND2 - :NNK:N10 | 2.97424 2.94596 2.71702 3.10323 |
| 7. | BID (connector) | NNK | −5.13 | 174.27 μM | Leu21, Phe24, Gly25, Gln28, Leu39, Asp40, Leu42, Gly43, Arg86, Ala89, Arg90, Phe173 | :NNK:N14 - BID:GLN28:OE1 BID:PHE24:HA - :NNK:O15 BID:ARG86:HA - :NNK:N10 :NNK:C3 - BID:GLN28:OE1 :NNK:C1 - BID:LEU39:O :NNK:C11 - BID:ARG86:O :NNK:O15 - BID:PHE24 :NNK:N14 - BID:GLN28:OE1 BID:PHE24:HA - :NNK:O15 BID:ARG86:HA - :NNK:N10 :NNK:C3 - BID:GLN28:OE1 :NNK:C1 - BID:LEU39:O :NNK:C11 - BID:ARG86:O :NNK:O15 - BID:PHE24 | 3.29101 2.94776 2.82375 3.41587 3.00214 3.32997 3.70686 3.29101 2.94776 2.82375 3.41587 3.00214 3.32997 3.70686 |
| 8. | HSP90AA1 | NNK | −5.10 | 183.46 μM | Leu48, Asn51, Ser52, Ala55, Asp93, Ile96, Gly97, Met98, Asn106, Phe138, Thr184, Val186 | HSP90AA1:ASN51:ND2 - :NNK:N14 HSP90AA1:ASN51:ND2 - :NNK:O15 HSP90AA1:THR184:OG1 - :NNK:O7 | 3.12471 2.99653 2.69827 |
| 9. | BRCA1 | NNK | −5.08 | 187.68 μM | Val1654, Ser1655, Gly1656, Leu1657, Thr1658, Pro1659, Phe1662, Thr1700, Leu1701, Lys1702 | BRCA1:SER1655:OG - :NNK:N14 BRCA1:GLY1656:N - :NNK:O7 BRCA1:LEU1657:N - :NNK:O7 BRCA1:LEU1701:N - :NNK:O15 BRCA1:LYS1702:N - :NNK:O15 :NNK:N14 - BRCA1:SER1655:OG | 3.19252 2.75464 2.77131 3.00037 2.75018 3.19252 |
| 10. | CDK1 | NNK | −5.00 | 217.06 μM | Lys88, Leu91, Asp92, Ile94, Pro95, Pro96, Glu196, Lys200 | CDK1:LYS200:NZ - :NNK:N14 CDK1:LYS200:NZ - :NNK:O15 :NNK:N14 - CDK1:ILE94:O | 3.0124 2.96559 2.89466 |
| 11. | CDK2 | NNK | −4.90 | 255.02 μM | Val29, Glu81, Phe82, Leu83, His84, Ile135, Asn136, Thr137 | CDK2:PHE82:N - :NNK:N10 CDK2:HIS84:N - :NNK:N14 CDK2:HIS84:N - :NNK:O15 CDK2:HIS84:ND1 - :NNK:N14 :NNK:O15 - CDK2:ILE135:O | 2.88593 2.95506 2.76842 3.18956 2.91961 |
| 12. | CCNB1 | NNK | −4.86 | 274.97 μM | Ile253, Lys256, Tyr257, Glu285, Leu289, Phe294, Gly295, Leu296, Gly297 | CCNB1:TYR257:N - :NNK:N10 CCNB1:LEU296:N - : NNK:N14 CCNB1:LEU296:N - : NNK:O15 CCNB1:GLY297:N - : NNK:O15 : NNK:N14 - CCNB1:PHE294:O | 3.14377 2.86319 2.81795 2.91169 3.10697 |
| 13. | CHEK1 | NNK | −4.80 | 303.50 μM | Val23, Val37, Ile39, Glu55, Asn59, Leu82, Phe149 | CHEK1:ILE39:N - :NNK:N10 CHEK1:ASN59:ND2 - :NNK:N14 CHEK1:ASN59:ND2 - :NNK:O15 CHEK1:PHE149:N - :NNK:O15 :NNK:N14 - CHEK1:GLU55:OE2 :NNK:O15 - CHEK1:GLU55:OE2 :NNK:O15 - CHEK1:PHE149:N | 2.8265 2.71952 3.02158 3.15867 3.05383 2.67183 3.15867 |
| 14. | RPA2 (connector) | NNK | −4.70 | 358.90 μM | Cys49, Thr50, Ile76, Val77, Asp96, Met97, Tyr125, Phe155, His158, Ile159 | RPA2:VAL77:N - :NNK:O15 :NNK:O15 - RPA2:CYS49:O :NNK:O15 - RPA2:VAL77:O :NNK:O15 - RPA2:HIS158:NE2 | 3.09031 3.06724 3.18087 2.98064 |
| 15. | ATM | NNK | −4.48 | 523.49 μM | Thr2059, Ala2062, Gly2063, Ile2065, Gln2066, Gln2069, Leu2077, Tyr2080, Leu2081, Leu2084, Glu2094, Leu2095, Leu2098 | ATM:GLN2066:N - :NNK:O7 | 3.06063 |
| 16. | CDK4 | NNK | −4.35 | 650.98 μM | Val44, Leu54, Pro55, Thr58, Val59, Val62, Ala63, Arg66, Val82, Ile92, Val94 | CDK4:PRO55:CD - :NNK:O15 CDK4:VAL59:CA - :NNK:O7 | 2.9883 2.92285 |
| 17. | TFDP1 | NNK | −4.20 | 833.96 μM | Val264, Phe285, Asn286, Phe287, Phe291 | TFDP1:PHE287:N - :NNK:O15 :NNK:O15 - TFDP1:PHE287:O | 2.78538 3.08744 |
| 18. | TP53 | NNK | −4.14 | 927.72 μM | Gln136, Leu137, Ala138, His179, Cys182, Asp184, Asn239, Cys275, Ala276 | TP53:LEU137:N - :NNK:O15 TP53:ASN239:ND2 - :NNK:N14 TP53:ASN239:ND2 - :NNK:O15 :NNK:O15 - TP53:CYS275:O | 2.93164 3.07617 2.87469 2.82627 |
| 19. | RB1 | NNK | −4.02 | 1.14 mM | Val434, Gly435, Gln436, Cys438, Asn505, Leu506, Asp507, Ser508, Gly509, Thr510 | RB1:GLN436:HN - :NNK:O15 RB1:SER508:HN - :NNK:O7 RB1:GLY509:HN - :NNK:O7 | 1.93726 2.36625 1.90514 |
| 20. | RPA1 (connector) | NNK | −3.67 | 2.03 mM | Val375, Asn402, Pro403, Ala408, Tyr409, Arg412, Gly413 | RPA1:ARG412:NH1 - :NNK:N14 :NNK:O15 - RPA1:ALA408:O | 3.06161 2.78707 |
| S.No | Protein | Role in Cell Cycle | References |
|---|---|---|---|
| 1. | CDK7 | Catalytic subunit of CAK complex which activates the cyclin-associated kinases CDK1, CDK2, CDK4, and CDK6 by threonine phosphorylation, thus regulating cell cycle progression | [28,29] |
| 2. | CCNA1 | Controls the cell cycle at the G1/S (start) and G2/M (mitosis) transitions | [30] |
| 3. | CDKN1B | Important regulator of cell cycle progression. Acts either as an inhibitor or an activator of cyclin type D-CDK4 complexes depending on its phosphorylation state and/or stoichometry. | [31] |
| 4. | CASP8 | Responsible for the positive and negative regulation of apoptosis and inflammation | [32] |
| 5. | CHEK2 | required for checkpoint-mediated cell cycle arrest in response to p53 defects | [33] |
| 6. | PLK1 | Regulates entry and exit from mitosis and cytokinesis. Regulates DNA replication | [34] |
| 7. | BID | induces apoptosis on interaction with BCl2 family proteins | [35] |
| 8. | HSP90AA1 | regulates the function of ATM in sensing and repairing the DNA damages | [36] |
| 9. | BRCA1 | Has role in DNA damage repair, cell cycle control and transcriptional regulation | [37] |
| 10. | CDK1 | Promotes G2-M transition and regulates G1 progress and G1-S transition via association with multiple interphase cyclins. | [38] |
| 11. | CDK2 | Essential for transition of cell cycle from G1 to S phase and then from S to G2 phase. | [39,40] |
| 12. | CCNB1 | Essential for the control of the cell cycle at the G2/M (mitosis) transition | [41] |
| 13. | CHEK1 | required for smooth cellular proliferation by inducing the degradation of cdc25a | [42] |
| 14. | RPA2 | Binds and stabilizes single-stranded DNA intermediates. Controls DNA repair and DNA damage checkpoint activation. | [43,44] |
| 15. | ATM | Activates checkpoint signaling upon double strand breaks (DSBs), apoptosis. May function as a tumor suppressor. | [45,46] |
| 16. | CDK4 | Hypophosphorylates RB1 in early G1 phase. Cyclin D-CDK4 complexes are major integrators of various mitogenic and antimitogenic signals. | [47] |
| 17. | TFDP1 | Can stimulate E2F-dependent transcription induces growth arrest. | [48] |
| 18. | TP53 | Prevents CDK7 kinase activity when associated to CAK complex in response to DNA damage, thus stopping cell cycle progression. | [49,50] |
| 19. | RB1 | Key regulator of entry into cell division that acts as a tumor suppressor. Promotes G0-G1 transition when phosphorylated by CDK3/cyclin-C. | [51] |
| 20. | RPA1 | controls DNA repair and DNA damage checkpoint activation | [52] |
© 2019 by the authors. Licensee MDPI, Basel, Switzerland. This article is an open access article distributed under the terms and conditions of the Creative Commons Attribution (CC BY) license (http://creativecommons.org/licenses/by/4.0/).
Share and Cite
Anukriti; Dhasmana, A.; Uniyal, S.; Somvanshi, P.; Bhardwaj, U.; Gupta, M.; Haque, S.; Lohani, M.; Kumar, D.; Ruokolainen, J.; et al. Investigation of Precise Molecular Mechanistic Action of Tobacco-Associated Carcinogen ‘NNK’ Induced Carcinogenesis: A System Biology Approach. Genes 2019, 10, 564. https://0-doi-org.brum.beds.ac.uk/10.3390/genes10080564
Anukriti, Dhasmana A, Uniyal S, Somvanshi P, Bhardwaj U, Gupta M, Haque S, Lohani M, Kumar D, Ruokolainen J, et al. Investigation of Precise Molecular Mechanistic Action of Tobacco-Associated Carcinogen ‘NNK’ Induced Carcinogenesis: A System Biology Approach. Genes. 2019; 10(8):564. https://0-doi-org.brum.beds.ac.uk/10.3390/genes10080564
Chicago/Turabian StyleAnukriti, Anupam Dhasmana, Swati Uniyal, Pallavi Somvanshi, Uma Bhardwaj, Meenu Gupta, Shafiul Haque, Mohtashim Lohani, Dhruv Kumar, Janne Ruokolainen, and et al. 2019. "Investigation of Precise Molecular Mechanistic Action of Tobacco-Associated Carcinogen ‘NNK’ Induced Carcinogenesis: A System Biology Approach" Genes 10, no. 8: 564. https://0-doi-org.brum.beds.ac.uk/10.3390/genes10080564