Comparative Genomics Analysis of Lactobacillus mucosae from Different Niches
by
 ,
,
Yan Jia
1,2, 
Bo Yang
1,2,3,*,
Paul Ross
3,4,
Catherine Stanton
3,5,
Hao Zhang
1,2,6,7,
Jianxin Zhao
1,2,6 and
Wei Chen
1,2,6,8 1
State Key Laboratory of Food Science and Technology, Jiangnan University, Wuxi 214122, China
2
School of Food Science and Technology, Jiangnan University, Wuxi 214122, China
3
International Joint Research Center for Probiotics & Gut Health, Jiangnan University, Wuxi 214122, China
4
APC Microbiome Ireland, University College Cork, T12 K8AF Cork, Ireland
5
Teagasc Food Research Centre, Moorepark, Fermoy, P61 C996 Cork, Ireland
6
National Engineering Research Center for Functional Food, Jiangnan University, Wuxi 214122, China
7
Wuxi Translational Medicine Research Center and Jiangsu Translational Medicine Research Institute Wuxi Branch, Wuxi 214122, China
8
Beijing Innovation Center of Food Nutrition and Human Health, Beijing Technology and Business University (BTBU), Beijing 102488, China
*
Author to whom correspondence should be addressed.
Genes 2020, 11(1), 95; https://0-doi-org.brum.beds.ac.uk/10.3390/genes11010095
Submission received: 5 December 2019
/
Revised: 30 December 2019
/
Accepted: 9 January 2020
/
Published: 14 January 2020
(This article belongs to the Section Microbial Genetics and Genomics)
Abstract
:The potential probiotic benefits of Lactobacillus mucosae have received increasing attention. To investigate the genetic diversity of L. mucosae, comparative genomic analyses of 93 strains isolated from different niches (human and animal gut, human vagina, etc.) and eight strains of published genomes were conducted. The results showed that the core genome of L. mucosae mainly encoded translation and transcription, amino acid biosynthesis, sugar metabolism, and defense function while the pan-genomic curve tended to be close. The genetic diversity of L. mucosae mainly reflected in carbohydrate metabolism and immune/competitive-related factors, such as exopolysaccharide (EPS), enterolysin A, and clustered regularly interspaced short palindromic repeats (CRISPR)-Cas. It was worth noting that this research firstly predicted the complete EPS operon shared among L. mucosae. Additionally, the type IIIA CRISPR-Cas system was discovered in L. mucosae for the first time. This work provided new ideas for the study of this species.
1. Introduction
Lactobacillus mucosae, as a potential probiotic, has attracted much attention. In industrial application, L. mucosae can produce not only propionic acid to improve the wet fermentation of beer, grain, and rumen [1] but could also generate exopolysaccharide (EPS) to serve as a thickener and stabilizer for yogurt [2] and cheese [3]. In addition, EPS also has associated healthy benefits, such as anti-inflammation, reducing blood fat, and lowering cholesterol [4], which provides a basis for the related animal model. It has been reported that L. mucosae has antitoxin and antibacterial activity, which could clear up the Zen toxin [5], and inhibit a variety of Gram-positive and negative pathogens [6], such as Escherichia coli, Salmonella typhimurium [7], and Staphylococcus [8].
L. mucosae was originally found in the small intestine of piglets [9], and often occurred in the rumen of cattle later [10]. A strain of L. mucosae isolated from goat milk was recently reported [11]. Although L. mucosae has been shown to have a number of benefits to human, only two human-derived strains have been reported yet, which were isolated from childhood feces [12,13]. This status quo may limit the excavation of other functions of L. mucosae, which requires more strains. With the rapid development of bioinformatics, comparative genomics provides a novel way to effectively assess the genetic diversity of bacteria [14], which could explore the origin of the strain and determine the genetic distribution of a particular species [15]. In 2017, Valeriano et al. [6] firstly analyzed the potential specific genes and intestinal adaptability of L. mucosae LM1 through genome comparison, such as the average nucleotide identity (ANI) analysis with other species and collinearity analysis within species; unfortunately, the number of strains involved was limited. Heretofore, the comparative genomic research on L. mucosae, particularly the genes involved in carbohydrate utilization, bacteriocin, and the CRISPR system, has not been conducted. In the current work, to explore the genetic diversity and potential host adaptation of L. mucosae, genome sequencing and comparative genomics analysis were performed for strains isolated from different niches.
2. Materials and Methods
2.1. Identification and General Genome Features
In total, 93 L. mucosae strains were isolated from different samples from different niches and regions among China previously in our lab. Genomic sketches of all those L. mucosae strains were sequenced by an Illumina Hiseq × 10 platform (Illumina, San Diego, CA, USA) to generate a 2 × 150 bp paired-end library and construct a paired-end library using an average read length. It used double-ended sequencing with a single-ended sequencing reading of 150 bp. The reads were assembled by SOAPde-novo and local inner gaps were filled with the software GapCloser [16]. The alignment was performed using eight L. mucosae strains of the currently disclosed genome, wherein LM1 isolated from the pig small intestine was used a model strain.
2.2. The Average Nucleotide Identity (ANI) Values and Phylogenetic Analyses
ANI analysis was carried out to evaluate the relationship among the species with a threshold greater than 95% being the same species. The method of calculating ANI was based on the average of the identity of the homologous genes of each pair of sequences [6]. The protein sequences extracted from those 101 strains were aligned using Orthomcl software (maintaining 50% identity; the cut-point parameter E-value was 1e–4) [17]. The Markov Cluster Algorithm (MCL) clustering algorithm (expansion index of 2.50) was used to cluster protein families with the same function [18]. After the orthologous genes (OGs) were extracted, Interactive Tree Of Life (iTOL) was performed to construct a phylogenetic tree [19].
2.3. Pan-Genome and Core-Genome Analysis
2.4. Genotype/Phenotype Association Applied to Carbohydrate Metabolism
Carbohydrate utilization gene annotations were performed by the Carbohydrate Active Enzyme Database (CAZy) [22]. The strains were clustered using HemI software [23].
The phenotype of carbohydrate utilization was tested for each strain and the steps were briefly described as follow. Twenty-four different carbohydrates, including D-galactose, D-lactose, maltose, fucose, D-ribose, D-fructose, L-arabinose, sucrose, D-xylose, raffinose, α-lactose, fructo-oligosaccharide (FOS), Xylo-oligosaccharide (XOS), gum arabic, celliboose, D-mannitol, D-mannose, 2′-fucosyllactose (2′-FL), D-sorbitol, trehalose, rhamnose, esculin, pinotriose, and salicin, were selected for carbohydrate utilization analysis. Then, 10% (w/v) aqueous solution of these carbohydrates were prepared, filtered using a 0.22-μm sterile membrane filter, and stored at 4 °C prior to use. The assay medium without glucose was freshly prepared while the ratio of the other substances was the same as that of the MRS medium, and bromocresol purple was added to the medium as an indicator. After autoclaving and cooling, the sterile carbohydrate aqueous solution was mixed to the medium at a final concentration of 1%. To test the sugar utilization capacity of each strain, after being sub-cultured twice, the strains were inoculated into test growth medium with a 1% inoculum, and each medium was supplemented with a different sugar. After anaerobic incubation for 12 h at 37 °C [24], the utilization was observed by color. All the test was performed in triplicate.
2.5. Prediction of the EPS Gene Operon
2.6. Prediction of Bacteriocin Operon
BAGEL3 was performed to mine genomes for potential bacteriocin operons [27]. The domains of bacteriocin were determined using BLASTP analysis against the non-redundant protein databases created by BLASTP based on National Center for Biotechnology Information (NCBI).
2.7. CRISPR-Cas Identification and Characterization
The Clustered Regularly Interspaced Short Palindromic Repeats (CRISPR) region and the CRISPR-related protein (Cas) were predicted using the CRISPR CasFinder [28], and neighbor-joining trees based on Cas protein were built [29]. The sequence of conserved direct repeats (DRs) were visualized by WebLogo [30].
3. Results
3.1. General Genome Features of L. mucosae
Previously in our lab, 93 L. mucosae strains were isolated from different samples, including fecal samples of humans at different ages, animal feces, human vaginal tract, and milk, etc. The draft genomes of all those strains were sequenced via the next generation sequencing (NGS) approach. The genome of L. mucosae was from 1.86 to 2.45 Mb, with a mean size of 1.79 Mb, and displayed an average G + C content of 48.1%. The number of tRNA genes in most strains was between 40 and 67, whereas one strain had tRNA genes less than 40 and one reached 79 (Table 1).
3.2. ANI and Phylogenetic Analyses of L. mucosae
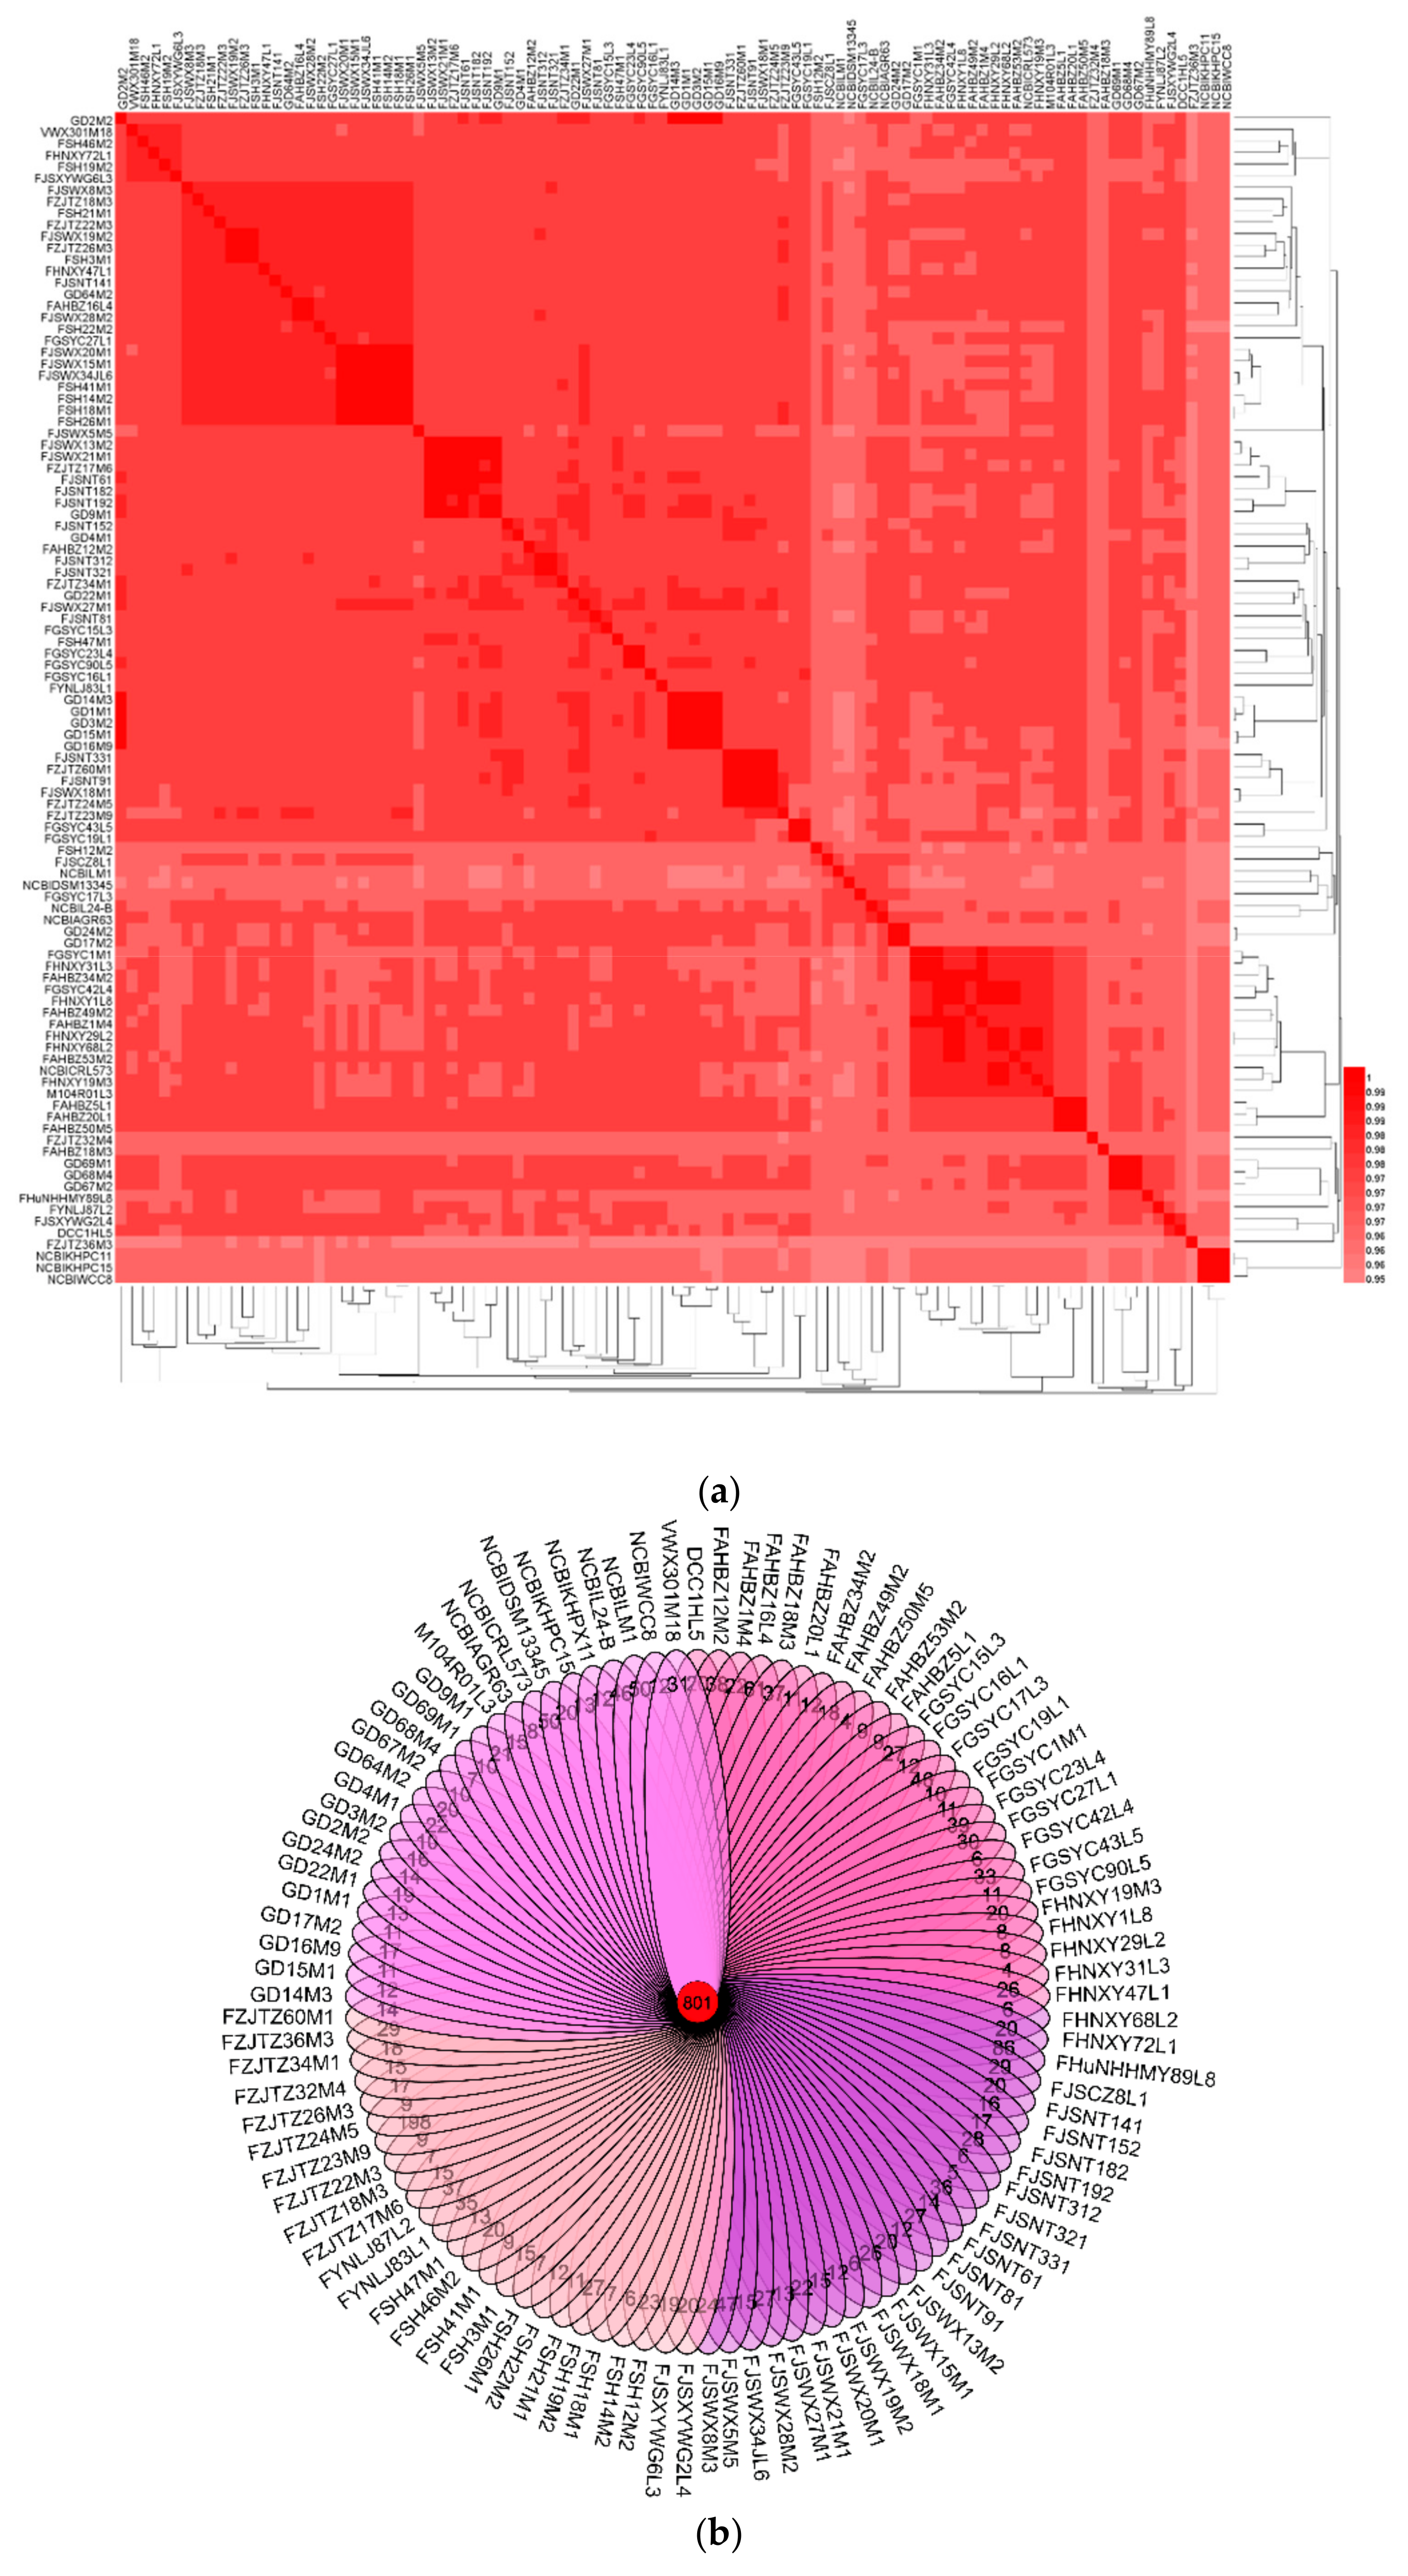
To explore the biology of L. mucosae, all those 93 newly sequenced genomes combined with eight publicly available L. mucosae genomes (LM1, DSM13345, DPC6424, WCC8, KHPC15, KHPX11, AGR63, and L24-B) were loaded to the ANI analysis. The results showed that the ANI valued from 0.953977 to 0.999552 (Figure 1a), which indicated that all of those strains were L. mucosae without any potential subspecies.
In order to evaluate the genetic distance among strains, the phylogenetic relationship among all those strains was studied. OGs among all those L. mucosae were 801 genes (Figure 1b). The phylogenetic tree was constructed using the protein-coding sequences of those 801 OGs (Figure 1c), which represented the relevance of the strains. The three strains, KHPC15, KHPX11, and WCC8, isolated from the rumen of cattle, were located in the same small branch in the phylogenetic tree. Additionally, similar results were found for LM1 and DSM13345, which were both originally from piglet small intestine and located in the same branch in the tree. However, some strains from different niches shared the same branch, such as FHNXY72L1 (dog derived) and SH46M2 (human derived), FHNXY68L2 (dog derived), and FHNXY29L2 (human derived), respectively.
In terms of human-derived strains, the geographical distance and age of the samples were considered as two potential key factors. Considering the geographical distance, the sampling points were mainly divided into three parts (Figure 1d): Henan, Jiangsu, Zhejiang, Shanghai, and Anhui (Area I); Guangdong (Area II); and Gansu (Area III). The strains isolated from Area II and Area III were concentrated in a large branch, and only a few strains were dispersed. The number of strains isolated from Area I was substantial. Most of the isolates from Jiangsu, Shanghai, and Zhejiang were concentrated (coastal region), and most of the isolates from Anhui and Henan were concentrated in a large branch (inland region). In addition, the strains isolated from humans with different ages were widely distributed, and the strains from the similar age group (minors, young, middle-aged, light-elderly, elderly, and longevity) did not show obvious aggregation. There was no significant correlation between the relationship of the diversity of strain and the age of the host.
3.3. Pan-Genome and Core Genes of L. mucosae
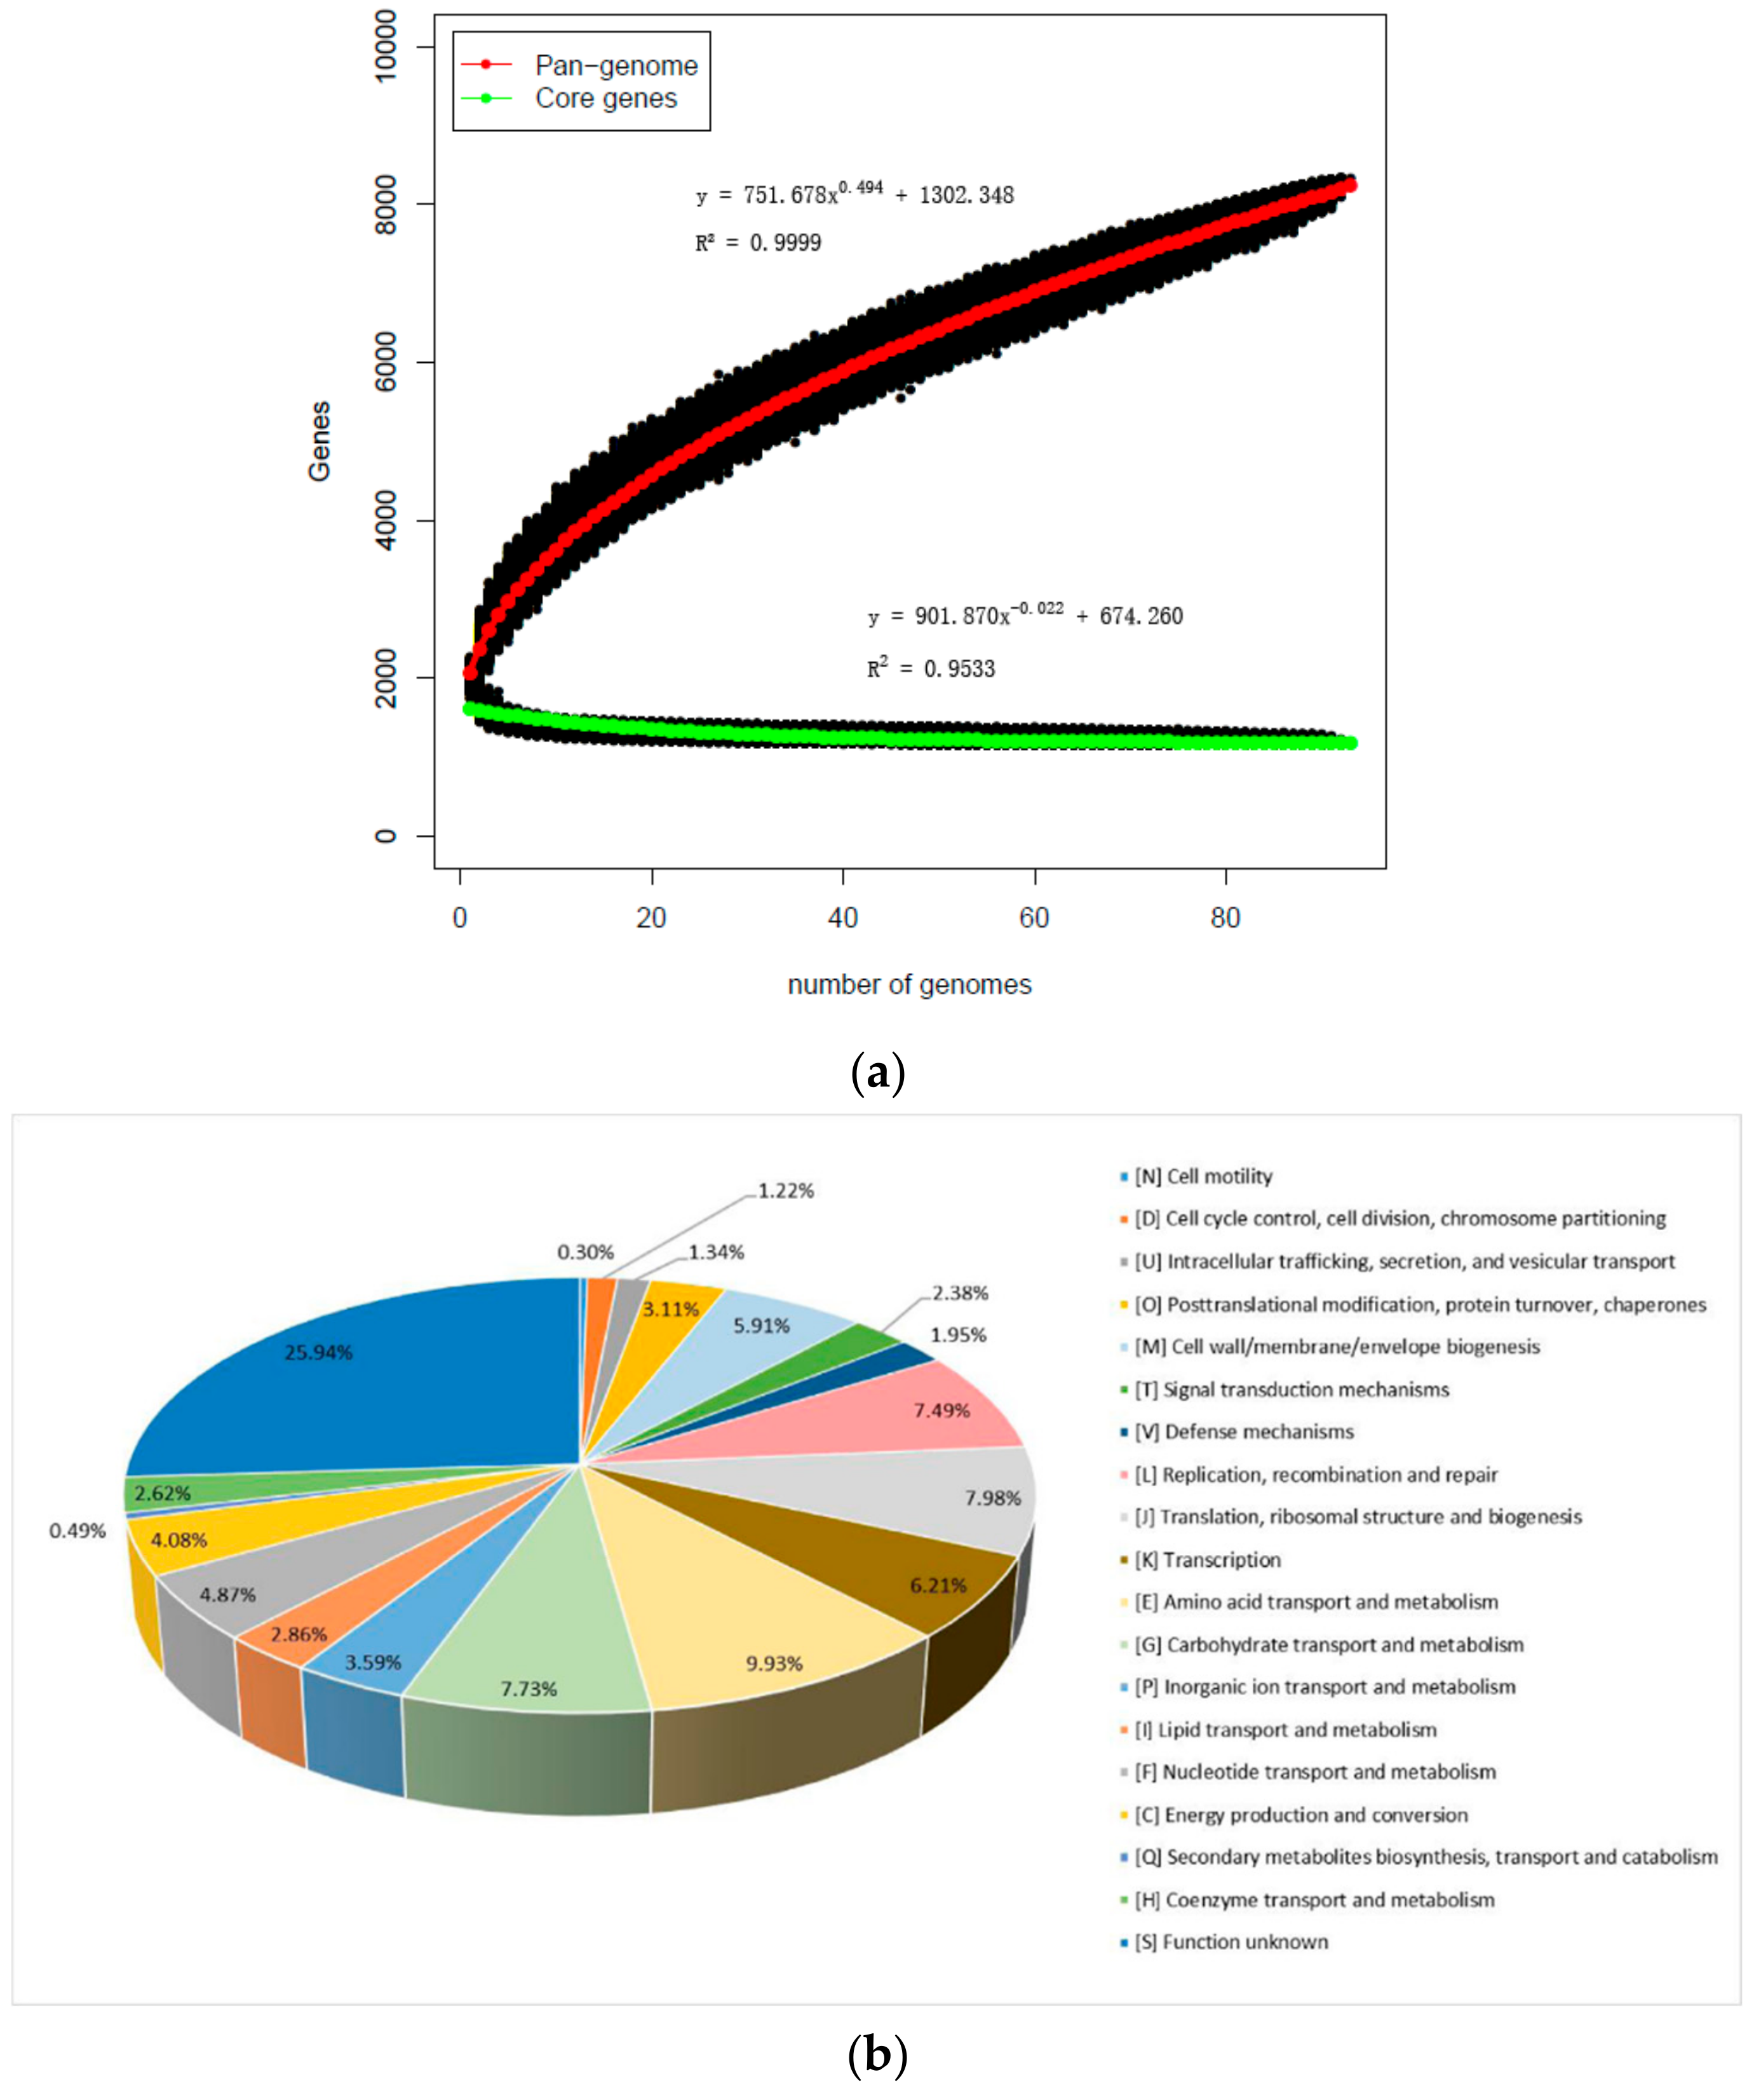
In order to further study the genetic diversity of L. mucosae, the pan-genome and core genes were analyzed. Based on those newly sequenced and eight publicly available genomes of L. mucosae, a total of 101 genomes were included. The number of core-genes and pan-genes, with the number of sequenced strains, were used to draw a functional relationship diagram. It showed that the slope of the number of core-genes was close to the asymptote, and even after the 101 genomes had been compiled, while the pan-genomic curve gradually closed. Specifically, in the first two iterations of the pan-genome curve, each genome increased with an average of 302 gene families, and reduced to 35 genes with the average of the last two additions, generating a total of 8753 pan-genes. Consistently, the core genome reached the value of 755 genes in the last iteration (Figure 2a). With functional analysis for the core genes of L. mucosae, the core genome included genes for replication, transcription, translation, central and cell wall metabolism, biosynthesis of amino acids and metabolism of nucleotides, fatty acids, and phospholipids. Among them, the genes related to carbohydrate metabolism of L. mucosae accounted for ~32.10% of the core genome while the role of ≈25.95% of the core-genome was unknown. Those unknown genes were found to be uncharacteristic as conserved proteins. In addition, 1.94% out of the core genes was involved in the defense function of bacteria (Figure 2b).
3.4. In Silico Gene–Trait Matching for Carbohydrate Utilization
In order to expand the understanding of carbohydrates utilization of L. mucosae, the CAZy database was used to analyze all the 93 sequenced genomes. The results revealed that L. mucosae contained genes encoding predicted carbohydrate-active enzymes, including 25 glycosyl hydrolase (GH) families and 17 glycosyl transferase (GT) families (Figure 3a). GH2 (β-galactosidase (EC 3.2.1.23)), GH13 (α-glucosidase (EC 3.2.1.20)), GH32 (invertase (EC 3.2.1.26)), GH36 (α-galactosidase (EC 3.2.1.22)), GH42 (β-galactosidase (EC 3.2.1.23)), GH43 (β-xylosidase (EC 3.2.1.37); α-L-arabinofuranosidase (EC 3.2.1.55)), GH65 (maltose phosphorylase (EC 2.4.1.8)), GH73 (lysozyme (EC 3.2.1.17)), GH109 (α-N-acetylgalactosaminease (EC 3.2.1.49)), and GH120 (β-xylosidase (EC 3.2.1.37)) were distributed among all the strains. The remaining 15 GHs have different distributions in those strains. Among them, GH13 and GH43 accounted for a relatively high proportion in the GH family. They were associated with the degradation of alpha-glucopyranose units and long-chain carbohydrates, respectively. Additionally, among all the predicted GT families, GT2 and GT4 were the most abundant, which were mainly involved in the synthesis of EPS. However, according to the clustering results of carbohydrate utilization enzymes, there was no obvious relationship with the sampling region, age, and habitat of the host; meanwhile, some strains had no obvious regularity in the clustering results.
To verify the genotype, the utilization phenotype of L. mucosae on 24 sugars as a unique carbon source was tested individually. All the strains were found to be able to grow with glucose, which was used as a positive control in the test. While all the tested strains were able to ferment D-galactose, D-lactose, maltose, fucose, D-ribose, sucrose, D-xylose, raffinose, α-lactose, FOS, and XOS, they were unable to utilize gum arabic, celliboose, D-mannitol, D-mannose, 2′-FL, D-sorbitol, trehalose, rhamnose, esculin, pinotriose, and salicin (Figure 3b). However, the metabolic levels of D-xylose, D-lactose, α-lactose, D-fructose, and L-arabinose were different. Among them, 79.6% strains did not use arabinose completely, and only 13.9% strains could utilize fructose. In addition, with those results, the ability of strains utilizing different carbohydrates were independent of the habitat, geographical distance, and age of the host.
An in silico assessment of the role of specific genes associated with sugar metabolism was performed with the gene–trait matching (GTM) analysis according to the association between the presence or absence of gene families, and growth or non-growth phenotype of the 93 L. mucosae strains. The β-galactosidase belonging to the GH2 and GH42 families was responsible for the metabolism of D-galactose, D-lactose, and α-lactose. Although some strains differed in the utilization of each sugar, all the strains containing GH2 and GH42 were able to utilize these three sugars. The genotype and phenotype reached a 100% match. Further analysis of the lactose gene cluster revealed that all the strains contained intact lactose operons, involving lacS (PTS sugar transporter subunit IIA), lacZ (β-galactosidase), and lacI (LacI family transcriptional regulator) (Figure 3c).
The key enzyme for hydrolyzing trehalose was alpha-phosphotrehalase, which belonged to the GH65_29 family. Although all the strains contained the GH65 family, the gene treC encoding alpha-phosphotrehalase was only found in the strain of FGSYC17L3. By investigating the genome of the strain FGSYC17L3, a complete trehalose operon that presented in L. mucosae was found, which was mainly composed of treC, treR2 (trehalose operon repressor), and bglF (PTS trehalose transporter subunit IIBC) (Figure 3d). However, the strain FGSYC17L3 did not utilize trehalose, which was inconsistent with the genotype.
In addition, considering the significant difference in the metabolic capacity of L-arabinose and D-fructose, the gene clusters of these two sugars were analyzed. The usage of L-arabinose was mainly related to L-ribose-5-phosphate-4-isomerase (araD), L-arabinose isomerase (araA), and related transcriptional regulators (Figure 3e). Although all the strains contained araA, 19 strains lacked transcriptional regulators, hence, no strains were observed to grow in the medium with arabinose as the sole carbon source. The utilization of D-fructose required fructokinase (fruK), phosphoglucose isomerase (fruI), and the intact ABC transport system (Figure 3f). Fructokinase phosphorylated intracellular fructose to fructose-6-phosphate, which was isomerized to glucose 6-phosphate by phosphoglucose isomerase. However, those functions were carried out under the premise of the ABC transport system. In total, 86% of the strains in this study could not metabolize fructose due to the absence of the ABC transport system.
3.5. Prediction of the EPS Operon in L. mucosae
EPS production was one of the characteristics of L. mucosae. To explore whether the newly genome-sequenced L. mucosae could produce EPS, the gene operon was predicted by BlastN. The results showed that 16 out of 93 L. mucosae strains consisted of the EPS-producing operons, and all of those were the same type. The EPS gene cluster in L. mucosae mainly composed of extracellular polysaccharide biosynthesis protein, chain length-determining protein, rfbA (glucose-1-phosphate thymidyltranseferase), rfbC (dTDP-4-dehydrorhamnose 3,5-epimerase), rfbB (dTDP-glucose 4,6-dehydratase), rfbD (NAD(P)-dependent oxidoreductase), glycosyltransferase (GT2), ribonuclease, and flipping enzyme (Figure 4). Except for the individual differences in the third hypothetical proteins, the number and order of key genes for EPS production among 16 strains were matched. Glucose-1-phosphate thymidyltranseferase was responsible for the first step of catalyzing the synthesis of polysaccharides by transferring a sugar-1-phosphate molecule to a lipid carrier located on the cell membrane. Other GT was responsible for catalyzing the synthesis of glycosidic bonds between the new monosaccharide molecule and the sugar molecule on the lipid carrier, thereby forming a repeating unit of the polysaccharide. After the unit structure of the polysaccharide was synthesized, it was exported to the cell surface through a polymer transfer pathway, which was catalyzed by a flippase.
3.6. Prediction of Bacteriocin Production in L. mucosae
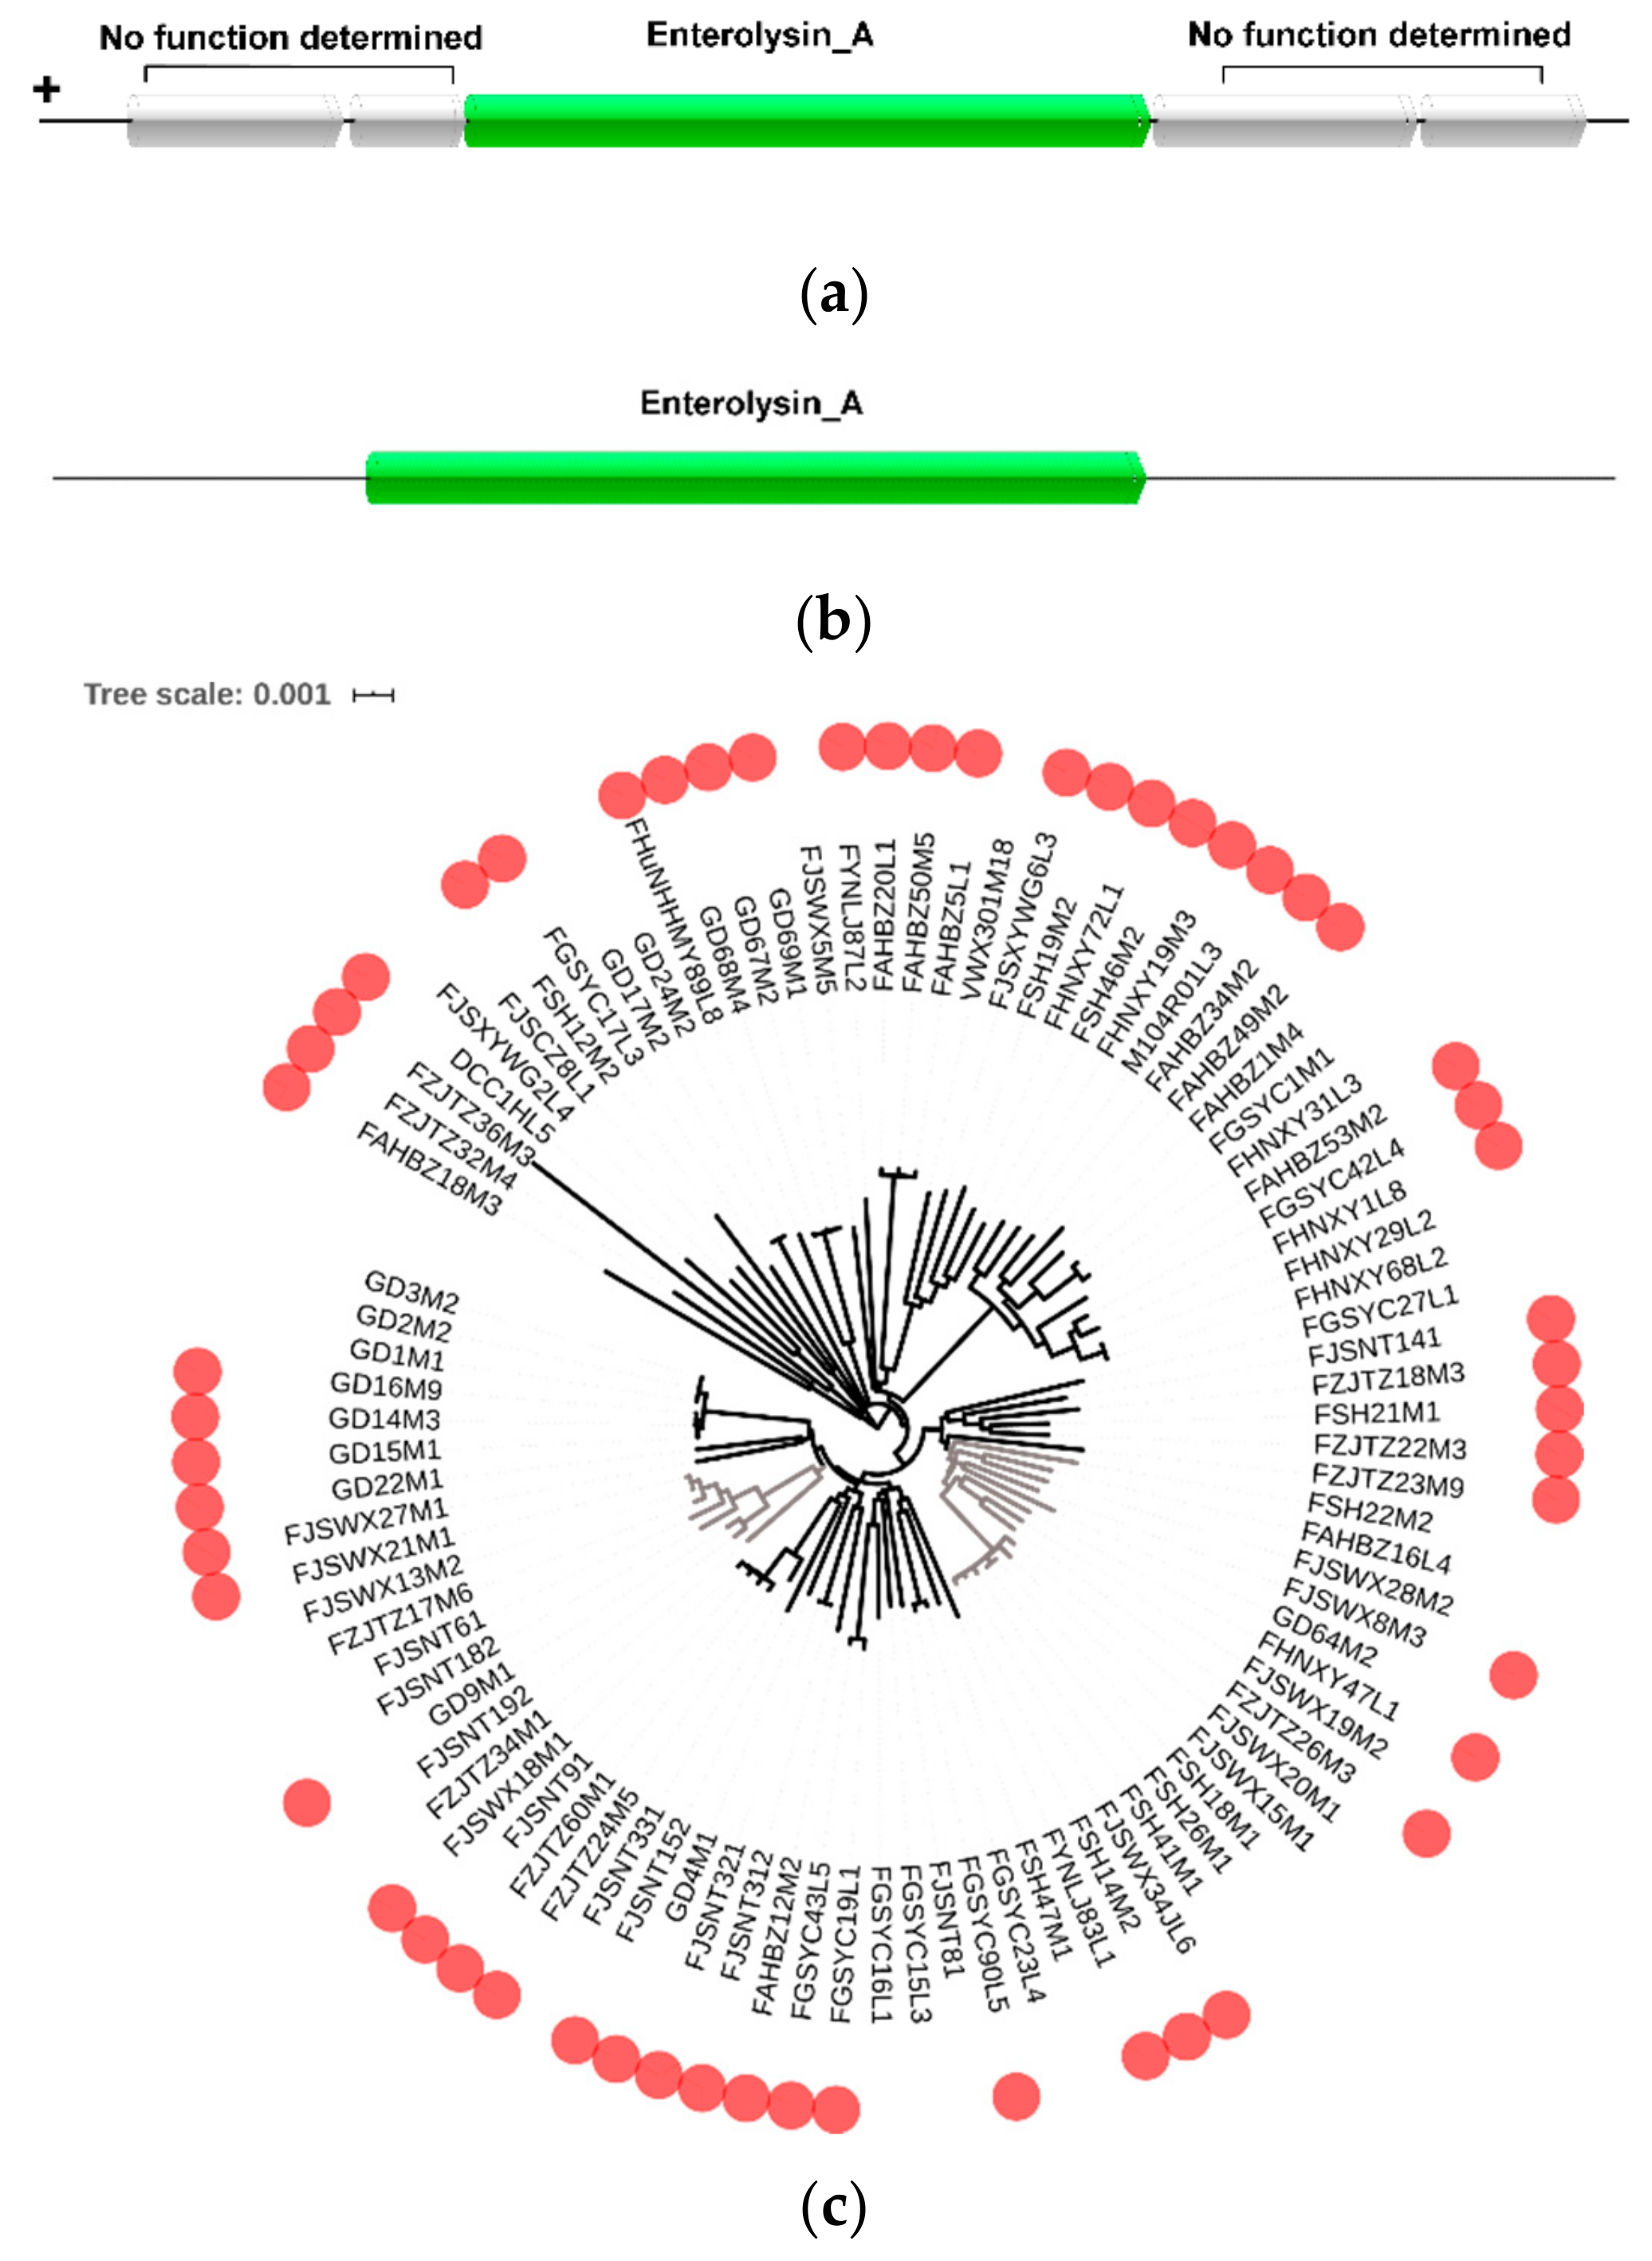
In order to investigate the potential bacteriocin produced by L. mucosae, BAGEL was used to predict the bacteriocin operon. Totally, 77 enterolysin A operons were found in those 93 genomes. Among them, seven strains contained 2–4 enterolysin A operons. The enlA gene was a key gene for the synthesis of enterolysin A. Through observation of the strain gene cluster, the upstream and downstream genes of the enlA were hypothetical proteins that were not related to the synthesis of enterolysin A (Figure 5a). There was even only a single enlA gene in the gene cluster of the strain DCC1HL5 (Figure 5b). It was speculated that the single enlA gene can synthesize enterolysin A. In addition, according to the results from BAGEL, the bacterial bacteriocin production was further analyzed based on the phylogenetic tree (Figure 5c). Although the strains encoding enterolysin A had relatively large clusters in phylogenetic trees, such as from FSH22M2 to FSH14M2 and from FJSWX21M1 to FZJTZ34M1, they appeared to be independent on the host.
3.7. CRISPR-Cas Systems in L. mucosae
To explore the acquired immunity, the presence of the CRISPR-Cas system was investigated through in silico analyses. CRISPR was found in all those 93 genomes, and only those with higher levels of evidence were considered in the current study. On the other hand, the CRISPRs without Cas protein were ignored due to the lack of ability to silence foreign DNA. In total, 41 strains carrying 47 total CRISPR-Cas systems were identified. Among those strains, four CRISPR-Cas subtypes were found, including type IE (12 strains), type IC (three strains), type IIA (23 strains), and type IIIA (nine strains). However, the existence and subtypes of the CRISPR-Cas system seemed to have little correlation with the source of the strain. The species and locus of Cas protein in the four subtypes were predicted using CRISPRCasFinder, showing that they were identical in each subtype. Therefore, four strains were selected as representatives to display each CRISPR-Cas subtype (Figure 6a). The Cas3, Cas9, and Cas10 proteins were characteristic genes of type I, type II, and type III, respectively, which were labeled to distinguish different subtypes and were key proteins for the CRISPR-Cas system to target interference. In addition, Cas1 and Cas2 proteins were contained in each CRISPR-Cas system, which were responsible for the insertion of new spacer sequences as an important adaptive protein.
To analyze the functional coupling of the direct repeat (DR) sequence and the accompanying Cas protein, phylogenetic analysis was performed using the Cas1 and DR sequences. It showed that the same subtype concentrated on the same large branch, except for the IC subtype in the phylogenetic tree of Cas1 (Figure 6b). In addition, different DR sequences could be found by observing the CRISPR locus, with only individual base differences between them (Figure 6b). The WebLogo was used to visualize different repeats in the same CRISPR locus and two strains were selected as representatives for the display (Figure 6c). It showed that, although the repeat sequence was usually highly conserved throughout the locus, polymorphisms could be observed, notably for the terminal repeat. Specifically, sequence degeneracy was observed at the terminal repeat.
4. Discussion
L. mucosae is one of the potential probiotics colonized in the gut of humans and animals, and is also present in the human vagina. It has been reported that L. mucosae was not only used as a thickener and stabilizer in fermented food production [2] but also has health-associated benefits, such as improving immunity [36] and lowering cholesterol [10]. The currently published genomes of L. mucosae were limited and not sufficient for comparative genomic analysis. However, with the development of comparative genomics, the increase in genomic tools has provided strong support for subsequent diversity analysis. In the current work, the genetic diversity of 93 L. mucosae strains from different niches was analyzed with eight published L. mucosae genomes, and their functional diversity was explored.
The average genomic size of 93 L. mucosae was 2.11 Mb with a 48.07% average of the GC content, which was consistent with previous reports [12,13]. Unprecedented, the current work on the genome-wide 101 L. mucosae showed a trend of gradual closure of the genome [37]. This suggested that the genetic diversity or host adaptation of L. mucosae had reached its limitation, which supported the hypothesis that the relative size and contents of the pan-genome were potential indicators of the genetic plasticity and environmental adaptation potential of the species. In addition, by annotating the core genes, it revealed the functions and translations, defense mechanism, and general functional predictions.
A species was usually defined according to features encoded by the core genes, but did not adequately describe the genetic diversity specific to a particular species [38,39]. In 2012, Chan et al. [40] clearly distinguished 13 strains of Acinetobacter by ANI analysis (threshold 95%–96%) in combination with core gene phylogenetic trees, which had been shown to be suitable for different groups of bacteria. Therefore, the current study followed their method to identify L. mucosae with certain credibility. The ANI value of L. mucosae was between 0.955 and 0.999, which was consistent with a previous result [6]. Compared with other Lactobacilli, the ANI value span of L. mucosae was relatively large, indicating that the proportion of variable genes was large, and the diversity was rich. This may increase the bacterial selection advantage, such as adaptability to the different niches. By constructing a phylogenetic tree of 101 L. mucosae strains, it appeared to be some correlation between the phylogenetic relatedness and isolation origin of those strains but much less was anticipated. One possible reason for the phenomenon was that the number of non-human isolates was limited and not representative. Then, putting the gaze on the physical distance and age of the human source, it was found that the phylogenetic tree had a certain correlation with the physical distance, though without any obvious correlation with the age of the host. Specifically, with a smaller horizontal distance, the similarity among the strains was much higher. Under similar horizontal distances, coastal and inland areas were also factors influencing the genetic relationship of strains, which could not be ignored. Odamaki and colleagues [41] studied the isolates of Bifidobacterium longum subspecies and found no significant correlation with host age, which was similar to the current results. This could explain the wide adaptability of L. mucosae in different age groups. Unfortunately, considering that the strains isolated from middle-aged subjects accounted for a large proportion in this study, more strains from other age groups need to be added for further verification.
The ability to metabolize carbohydrates was an important indicator for the cultivation and selection of bacteria. Therefore, the ability of 93 strains to metabolize 24 sugars was determined. The utilization of 12 sugars (cellobiose, D-galactose, L-arabinose, maltose, D-mannose, melezitose, melibiose, raffinose, D-ribose, sucrose, trehalose, and D-xylose) was consistent with Bergey’s Manual of Systemic Bacteriology [42]. Contrary to the phenotypic results of esculin metabolism herein, it had been previously reported that eight strains of L. mucosae may utilize esculin [9]. The esculin operon consisted of two structural genes (bglB and bglC) and two regulatory genes (bglR and bglS) [43], which were not detected in L. mucosae. It was speculated that this difference may be caused by the insufficient strains in previous study, or the functional genes involved in esculin metabolism was lost during the host adaptation of those strains. Computer simulations of 25 GH families involved in carbohydrate metabolism revealed that GH13 and GH43 accounted for a relatively high proportion of the GHs, which were primarily involved in the degradation of starchy carbohydrates [44] and non-digestible dietary fibers [45,46]. This reflected to some extent the survival adaptability of L. mucosae in the intestine. In addition, the gene clusters associated with lactose [43], trehalose [47], D-fructose [48], and L-arabinose [49,50], emphasizing the importance of glycosyl hydrolase (lacZ and treC), isomerase (araA and araD), and kinases (fruK) in the corresponding operons. It was worth noting that fruK-encoded fructokinase was also important in the degradation of sucrose [51]. In addition, the strain FGSYC17L3, although containing the key gene, treC, was unable to utilize trehalose. It was probably due to the repression of transcription by trehalose operon repressor (treR2) located upstream, which mediated negative regulation. The PTS system or the ABC transporter was required in the metabolic system of fructose [48]. Although there was no complete PTS system in 13 strains of L. mucosae, the transport of fructose can be carried by ABC transporter permease. For arabinose, the transcriptional regulator was equivalent to the optical switch mechanism of the operon, and without it, the transcription of the arabinose operon cannot be promoted [52].
In recent years, EPS produced by lactic acid bacteria has attracted much attention. L. mucosae DPC6426 [2,3,4,10] and LM1 [6] were reported to generate EPS significantly, but the EPS gene cluster was not explored in depth. Genomic studies on lactic acid bacteria indicated that the biosynthetic pathway of EPS was controlled by several housekeeping genes and a series of EPS-related genes that were involved in regulating EPS production, chain-length, biosynthesis of repeating units, and aggregation and export of repeating unit [53,54,55,56]. In the current work, it was found that 82% of the strains lacked the chain length-determining protein, and it was speculated that these strains lost the ability to synthesize EPS. The glycosyltransferases involved in EPS synthesis were the GT2 family, which participated in the process of adding glycosyl groups to the growing EPS chain and directly determined that L. mucosae only produced a unique type of EPS [57]. It was worth noting that the third putative protein of the EPS gene cluster in some strains was missing. However, since the contribution of the hypothetical protein was not significant, it did not affect the synthesis of EPS [55]. Although discussion of EPS was still open, the fact that EPS clusters in L. mucosae has little change in the presence of particular genes should be highlighted.
L. mucosae AGR63 was reported to have the ability to produce only class III bacteriocin [58], and L. mucosae CRL573 was found to contain two potential enterostatin A operons (>10 kDa) [13]. Heretofore, little research has been done on the bacteriocin produced by L. mucosae. In the current work, 58.1% of L. mucosae contained the gene encoding bacteriocin, which was enterostatin A. This was consistent with the results reported previously. Enterolysin A is a heat-labile protein produced by Enterococcus faecalis LMG2333 and belongs to class III bacteriocin [59]. EnlA was identified as a key structural gene, which encoded enterolysin A [60], and all its upstream and downstream genes had no role in the synthesis of enterolysin A [58], revealing that the enlA gene was the unique gene in charge of producing enterolysin A. The evidence was provided for the structure of enterolysin A in L. mucosae. The presence of bacteriocin helped the strain to survive in a complex environment and provided it with a competitive advantage [61,62,63], which might be one of the advantages of L. mucosae as a potential probiotic in the intestine.
CRISPR loci presents in a large number of prokaryote genomes that provides acquired immunity against foreign genetic elements. Previously, little research had focused on CRISPR in L. mucosae, and only two strains were analyzed. In L. mucosae LM1, two CRISPR-Cas loci (type I and type II) were found [6] while only CRISPR elements were detected in L. mucosae CRL573 [13]. Therefore, the current work specifically analyzed the CRISPR-Cas system in all those 93 strains of L. mucosae, of which 44% contained the complete CRISPR-Cas system. The presence of the remaining incomplete loci may be due to genetic recombination, loss of activity to acquire other CRISPR loci, or incomplete assembly of the genomic sketches of these strains. The diversity of Cas protein was significant [64,65], but the CRISPR-Cas system could be easily classified (type I–III) by identifying the characteristic protein (Cas3, Cas9, and Cas10) in the gene composition [66]. The locus structure of the three subtypes (IE, IC, and IIA) of the CRISPR-Cas system was identical to the previously reported typical CRISPR-Cas system structure [67]. It was worth noting that type III was detected in nine strains of L. mucosae, which was firstly found, which will provide a new perspective for the future investigation of the CRISPR-Cas system in L. mucosae.
Previous studies have identified phylogeny of Cas1 as one of the key factors to subtype classification [68]. Additionally, the tree showed the aggregation of the Cas1 sequences was on the same big branch according to subtype IE, IIA, and IIIA, which was roughly the same as the phylogeny of the DR sequence, confirming the trend of co-evolution of components in the immune system [29]. The most frequent repeats were usually defined as typical repeats. Previous studies have defined two other types, namely “repeat variants” and “terminal repeats” [69]. The result was extremely important for proper annotation and orientation of the CRISPR locus, because the last repeat unit (which often contains degenerate terminal repeats) was frequently lost, or regularly repeated on the opposite DNA strand. In addition, transpositions have occurred at different positions of the CRISPR locus while transposases were associated with the frequent HGT in prokaryotes and had huge impacts on bacterial adaptation [70]. The existence of transposases showed the acquisition of a related gene structure to a certain extent, and it was an adaptive advantage for the survival of a complex niche, such as the human intestine.
5. Conclusions
A comparative genomics analysis for 101 strains of L. mucosae isolated from different niches was performed. The results showed that the genetic diversity of L. mucosae was related to the niches and physical distance but may be less affected by host age. Additionally, the genetic diversity of L. mucosae was reflected in carbohydrate metabolism and immune/competitive-related factors (EPS, enterolysin A and CRISPR-Cas). Among them, both the EPS operon and the IIIA-type CRISPR-Cas system were elaborated and discovered for the first time in L. mucosae. All the current results provide new information and a framework for the inheritance and diversity of L. mucosae.
Author Contributions
Conceptualization, B.Y. and J.Z.; methodology, Y.J. and J.Z.; software, H.Z.; validation, Y.J., B.Y. and C.S.; formal analysis, Y.J., B.Y. and P.R.; investigation, C.S. and J.Z.; resources, B.Y., J.Z. and W.C.; data curation, Y.J. and J.Z.; writing—original draft preparation, Y.J. and B.Y.; writing—review and editing, B.Y., C.S., P.R., and J.Z.; visualization, B.Y.; supervision, H.Z. and W.C; project administration, W.C.; funding acquisition, W.C. All authors have read and agreed to the published version of the manuscript.
Funding
This research was supported by the National Natural Science Foundation of China (Nos. 31771953, 31820103010), national first-class discipline program of Food Science and Technology (JUFSTR20180102), Collaborative innovation center of food safety and quality control in Jiangsu Province.
Acknowledgments
2′-FL was kindly shared by FrieslandCampina DOMO, The Netherlands.
Conflicts of Interest
The authors declare no conflict of interest.
References
- Mamuad, L.L.; Kim, S.H.; Choi, Y.J.; Soriano, A.P.; Cho, K.K.; Lee, K.; Bae, G.S.; Lee, S.S. Increased propionate concentration in Lactobacillus mucosae-fermented wet brewers grains and during in vitro rumen fermentation. J. Appl. Microbiol. 2017, 123, 29–40. [Google Scholar] [CrossRef] [PubMed]
- London, L.E.E.; Chaurin, V.; Auty, M.A.E.; Fenelon, M.A.; Fitzgerald, G.F.; Ross, R.P.; Stanton, C. Use of Lactobacillus mucosae DPC 6426, an exopolysaccharide-producing strain, positively influences the techno-functional properties of yoghurt. Int. Dairy J. 2015, 40, 33–38. [Google Scholar] [CrossRef]
- Ryan, P.M.; Burdikova, Z.; Beresford, T.; Auty, M.A.; Fitzgerald, G.F.; Ross, R.P.; Sheehan, J.J.; Stanton, C. Reduced-fat Cheddar and Swiss-type cheeses harboring exopolysaccharide-producing probiotic Lactobacillus mucosae DPC 6426. J. Dairy Sci. 2015, 98, 8531–8544. [Google Scholar] [CrossRef] [PubMed] [Green Version]
- Ryan, P.M.; Stolte, E.H.; London, L.E.E.; Wells, J.M.; Long, S.L.; Joyce, S.A.; Gahan, C.G.M.; Fitzgerald, G.F.; Ross, R.P.; Caplice, N.M.; et al. Lactobacillus mucosae DPC 6426 as a bile-modifying and immunomodulatory microbe. BMC Microbiol. 2019, 19, 33. [Google Scholar] [CrossRef]
- Long, M.; Zang, J.; Peng, L.I.; Zhang, W.K.; Liu, G.W.; Wang, Z. The removal capability of zearalenone by Lactobacillus mucosae in vitro. Chin. J. Vet. Sci. 2013, 33, 458–461. [Google Scholar]
- Valeriano, V.D.V.; Oh, J.K.; Bagon, B.B.; Kim, H.; Kang, D.K. Comparative genomic analysis of Lactobacillus mucosae LM1 identifies potential niche-specific genes and pathways for gastrointestinal adaptation. Genomics 2017, 111, 24–33. [Google Scholar] [CrossRef] [Green Version]
- Valeriano, V.D.; Parungao-Balolong, M.M.; Kang, D.K. In vitro evaluation of the mucin-adhesion ability and probiotic potential of Lactobacillus mucosae LM1. J. Appl. Microbiol. 2014, 117, 485–497. [Google Scholar] [CrossRef]
- Soriano, A.P.; Mamuad, L.L.; Kim, S.H.; Choi, Y.J.; Jeong, C.D.; Bae, G.S.; Chang, M.B.; Lee, S.S. Effect of Lactobacillus mucosae on in vitro rumen fermentation characteristics of dried brewers grain, methane production and bacterial diversity. Asian-Australas. J. Anim. Sci. 2014, 27, 1562–1570. [Google Scholar] [CrossRef] [Green Version]
- Roos, S.; Karner, F.; Axelsson, L.; Jonsson, H. Lactobacillus mucosae sp. nov., a new species with in vitro mucus-binding activity isolated from pig intestine. Int. J. Syst. Evol. Microbiol. 2000, 50(Pt. 1), 251–258. [Google Scholar] [CrossRef]
- London, L.E.; Price, N.P.; Ryan, P.; Wang, L.; Auty, M.A.; Fitzgerald, G.F.; Stanton, C.; Ross, R.P. Characterization of a bovine isolate Lactobacillus mucosae DPC 6426 which produces an exopolysaccharide composed predominantly of mannose residues. J. Appl. Microbiol. 2014, 117, 509–517. [Google Scholar] [CrossRef]
- De Moraes, G.M.D.; de Abreu, L.R.; do Egito, A.S.; Salles, H.O.; da Silva, L.M.F.; Nero, L.A.; Todorov, S.D.; dos Santos, K.M.O. Functional properties of lactobacillus mucosae strains isolated from Brazilian goat milk. Probiotics Antimicrob. Proteins 2017, 9, 235–245. [Google Scholar] [CrossRef] [PubMed]
- Drissi, F.; Labas, N.; Merhej, V.; Raoult, D. Draft genome sequence of the Lactobacillus agilis strain marseille. Genome Announc. 2015, 3. [Google Scholar] [CrossRef] [PubMed] [Green Version]
- Bleckwedel, J.; Teran, L.C.; Bonacina, J.; Saavedra, L.; Mozzi, F.; Raya, R.R. Draft genome sequence of the mannitol-producing strain Lactobacillus mucosae CRL573. Genome Announc. 2014, 2. [Google Scholar] [CrossRef] [PubMed] [Green Version]
- Kant, R.; Blom, J.; Palva, A.; Siezen, R.J.; de Vos, W.M. Comparative genomics of Lactobacillus. Microb. Biotechnol. 2011, 4, 323–332. [Google Scholar] [CrossRef] [PubMed] [Green Version]
- Kelleher, P.; Bottacini, F.; Mahony, J.; Kilcawley, K.N.; van Sinderen, D. Comparative and functional genomics of the Lactococcus lactis taxon; insights into evolution and niche adaptation. BMC Genomics 2017, 18, 267. [Google Scholar] [CrossRef] [PubMed] [Green Version]
- Ruibang, L.; Binghang, L.; Yinlong, X.; Zhenyu, L.; Weihua, H.; Jianying, Y.; Guangzhu, H.; Yanxiang, C.; Qi, P.; Yunjie, L. SOAPdenovo2: An empirically improved memory-efficient short-readde novoassembler. GigaScience 2012, 1, 18. [Google Scholar]
- Li, L.; Stoeckert, C.J., Jr.; Roos, D.S. OrthoMCL: identification of ortholog groups for eukaryotic genomes. Genome Res. 2003, 13, 2178–2189. [Google Scholar] [CrossRef] [Green Version]
- Chen, F.; Mackey, A.J.; Stoeckert, C.J.; Roos, D.S. OrthoMCL-DB: Querying a comprehensive multi-species collection of ortholog groups. Nucleic Acids Res. 2006, 34, D363–D368. [Google Scholar] [CrossRef]
- Letunic, I.; Bork, P. Interactive tree of life (iTOL) v3: an online tool for the display and annotation of phylogenetic and other trees. Nucleic Acids Res. 2016, 44, W242–W245. [Google Scholar] [CrossRef]
- Zhao, Y.B.; Wu, J.Y.; Yang, J.H.; Sun, S.X.; Xiao, J.F.; Yu, J. PGAP: pan-genomes analysis pipeline. Bioinformatics 2012, 28, 416–418. [Google Scholar] [CrossRef] [Green Version]
- Jensen, L.J.; Julien, P.; Kuhn, M.; von Mering, C.; Muller, J.; Doerks, T.; Bork, P. eggNOG: Automated construction and annotation of orthologous groups of genes. Nucleic Acids Res. 2008, 36, D250–D254. [Google Scholar] [CrossRef] [PubMed]
- Lombard, V.; Ramulu, H.G.; Drula, E.; Coutinho, P.M.; Henrissat, B. The carbohydrate-active enzymes database (CAZy) in 2013. Nucleic Acids Res. 2014, 42, D490–D495. [Google Scholar] [CrossRef] [PubMed] [Green Version]
- Deng, W.; Wang, Y.; Liu, Z.; Cheng, H.; Xue, Y. HemI: A toolkit for illustrating heatmaps. PLoS ONE 2014, 9, e111988. [Google Scholar] [CrossRef] [PubMed]
- McLaughlin, H.P.; Motherway, M.O.; Lakshminarayanan, B.; Stanton, C.; Ross, R.P.; Brulc, J.; Menon, R.; O’Toole, P.W.; van Sinderen, D. Carbohydrate catabolic diversity of bifidobacteria and lactobacilli of human origin. Int. J. Food Microbiol. 2015, 203, 109–121. [Google Scholar] [CrossRef] [PubMed]
- Wang, J.R.; Tang, W.; Zheng, Y.N.; Xing, Z.Q.; Wang, Y.P. Functional and bioinformatics analysis of an exopolysaccharide-related gene (epsN) from Lactobacillus kefiranofaciens ZW3. Arch. Microbiol. 2016, 198, 611–618. [Google Scholar] [CrossRef]
- Petrova, M.I.; Macklaim, J.M.; Wuyts, S.; Verhoeven, T.; Vanderleyden, J.; Gloor, G.B.; Lebeer, S.; Reid, G. Comparative Genomic and Phenotypic Analysis of the Vaginal Probiotic Lactobacillus rhamnosus GR-1. Front. Microbiol. 2018, 9, 1278. [Google Scholar] [CrossRef]
- Van Heel, A.J.; de Jong, A.; Montalban-Lopez, M.; Kok, J.; Kuipers, O.P. BAGEL3: automated identification of genes encoding bacteriocins and (non-)bactericidal posttranslationally modified peptides. Nucleic Acids Res. 2013, 41, W448–W453. [Google Scholar] [CrossRef]
- Couvin, D.; Bernheim, A.; Toffano-Nioche, C.; Touchon, M.; Michalik, J.; Neron, B.; Rocha, E.P.C.; Vergnaud, G.; Gautheret, D.; Pourcel, C. CRISPRCasFinder, an update of CRISRFinder, includes a portable version, enhanced performance and integrates search for Cas proteins. Nucleic Acids Res. 2018, 46, W246–W251. [Google Scholar] [CrossRef] [Green Version]
- Hidalgo-Cantabrana, C.; Crawley, A.B.; Sanchez, B.; Barrangou, R. Characterization and exploitation of crispr loci in Bifidobacterium longum. Front. Microbiol. 2017, 8, 1851. [Google Scholar] [CrossRef]
- Crooks, G.E.; Hon, G.; Chandonia, J.M.; Brenner, S.E. WebLogo: A sequence logo generator. Genome Res. 2004, 14, 1188–1190. [Google Scholar] [CrossRef] [Green Version]
- Lee, J.H.; Valeriano, V.D.; Shin, Y.R.; Chae, J.P.; Kim, G.B.; Ham, J.S.; Chun, J.; Kang, D.K. Genome sequence of Lactobacillus mucosae LM1, isolated from piglet feces. J. Bacteriol. 2012, 194, 4766. [Google Scholar] [CrossRef] [PubMed] [Green Version]
- Sun, Z.H.; Harris, H.M.B.; McCann, A.; Guo, C.Y.; Argimon, S.; Zhang, W.Y.; Yang, X.W.; Jeffery, I.B.; Cooney, J.C.; Kagawa, T.F.; et al. Expanding the biotechnology potential of Lactobacilli through comparative genomics of 213 strains and associated genera. Nat. Commun. 2015, 6, 8322. [Google Scholar] [CrossRef] [PubMed]
- Seshadri, R.; Leahy, S.C.; Attwood, G.T.; Teh, K.H.; Lambie, S.C.; Cookson, A.L.; Eloe-Fadrosh, E.A.; Pavlopoulos, G.A.; Hadjithomas, M.; Varghese, N.J.; et al. Cultivation and sequencing of rumen microbiome members from the Hungate1000 Collection. Nat. Biotechnol. 2018, 36, 359–367. [Google Scholar] [CrossRef] [PubMed]
- Ryan, P.M.; Guinane, C.M.; London, L.E.E.; Kelleher, P.R.; Fitzgerald, G.F.; Caplice, N.M.; Ross, R.P.; Stanton, C. Genome sequence of the heteropolysaccharide-producing strain Lactobacillus mucosae DPC 6426. Microbiol. Resour. Ann. 2015, 3. [Google Scholar] [CrossRef] [Green Version]
- Ayala, D.I.; Cook, P.W.; Franco, J.G.; Bugarel, M.; Kottapalli, K.R.; Loneragan, G.H.; Brashears, M.M.; Nightingale, K.K. A systematic approach to identify and characterize the effectiveness and safety of novel probiotic strains to control foodborne pathogens. Front. Microbiol. 2019, 10, 1108. [Google Scholar] [CrossRef] [Green Version]
- Tzortzis, G.; Baillon, M.L.; Gibson, G.R.; Rastall, R.A. Modulation of anti-pathogenic activity in canine-derived Lactobacillus species by carbohydrate growth substrate. J. Appl. Microbiol. 2004, 96, 552–559. [Google Scholar] [CrossRef]
- Zhuang, X.R.; Zhu, Y.Z. Research progress of bacterial pan-genome. J. Shanghai Jiaotong Univ. (Medical Science) 2012, 32, 1440–1443. [Google Scholar]
- Riley, M.A.; Lizotte-Waniewski, M. Population genomics and the bacterial species concept. Methods Mol. Biol. 2009, 532, 367–377. [Google Scholar] [CrossRef] [Green Version]
- Tettelin, H.; Masignani, V.; Cieslewicz, M.J.; Donati, C.; Medini, D.; Ward, N.L.; Angiuoli, S.V.; Crabtree, J.; Jones, A.L.; Durkin, A.S.; et al. Genome analysis of multiple pathogenic isolates of Streptococcus agalactiae: Implications for the microbial “pan-genome”. Proc. Natl. Acad. Sci. USA 2005, 102, 13950–13955. [Google Scholar] [CrossRef] [Green Version]
- Chan, Z.M.; Halachev, M.R.; Loman, N.J.; Constantinidou, C.; Pallen, M.J. Defining bacterial species in the genomic era: Insights from the genusAcinetobacter. BMC Microbiol. 2012, 12, 302. [Google Scholar] [CrossRef] [Green Version]
- Odamaki, T.; Bottacini, F.; Kato, K.; Mitsuyama, E.; Yoshida, K.; Horigome, A.; Xiao, J.Z.; van Sinderen, D. Genomic diversity and distribution of Bifidobacterium longum subsp. longum across the human lifespan. Sci. Rep. 2018, 8, 85. [Google Scholar] [CrossRef] [PubMed] [Green Version]
- Hammes, W.P.; Hertel, C. Lactobacillus. In Bergey’s Manual of Systematics of Archaea and Bacteria; Whitman, W.B., Ed.; John Wiley & Sons, Inc.: Hoboken, NJ, USA, 2015; pp. 1–76. [Google Scholar] [CrossRef]
- Wheatley, R.W.; Lo, S.; Jancewicz, L.J.; Dugdale, M.L.; Huber, R.E. Structural explanation for allolactose (lac operon inducer) synthesis by lacz beta-galactosidase and the evolutionary relationship between allolactose synthesis and the lac repressor. J. Biol. Chem. 2013, 288, 12993–13005. [Google Scholar] [CrossRef] [PubMed] [Green Version]
- Odamaki, T.; Horigome, A.; Sugahara, H.; Hashikura, N.; Minami, J.; Xiao, J.Z.; Abe, F. Comparative genomics revealed genetic diversity and species/strain-level differences in carbohydrate metabolism of three probiotic Bifidobacterial species. Int. J. Genomics 2015, 2015, 12. [Google Scholar] [CrossRef] [PubMed] [Green Version]
- Makarova, K.; Slesarev, A.; Wolf, Y.; Sorokin, A.; Mirkin, B.; Koonin, E.; Pavlov, A.; Pavlova, N.; Karamychev, V.; Polouchine, N.; et al. Comparative genomics of the lactic acid bacteria. Proc. Natl. Acad. Sci. USA 2006, 103, 15611–15616. [Google Scholar] [CrossRef] [Green Version]
- Arboleya, S.; Bottacini, F.; O’Connell-Motherway, M.; Ryan, C.A.; Ross, R.P.; van Sinderen, D.; Stanton, C. Gene-trait matching across the Bifidobacterium longum pan-genome reveals considerable diversity in carbohydrate catabolism among human infant strains. BMC Genomics 2018, 19, 33. [Google Scholar] [CrossRef]
- Schluepmann, H.; Pellny, T.; van Dijken, A.; Smeekens, S.; Paul, M. Trehalose 6-phosphate is indispensable for carbohydrate utilization and growth in Arabidopsis thaliana. Proc. Natl. Acad. Sci. USA 2003, 100, 6849–6854. [Google Scholar] [CrossRef] [Green Version]
- Helanto, M.; Aarnikunnas, J.; Palva, A.; Leisola, M.; Nyyssola, A. Characterization of genes involved in fructose utilization by Lactobacillus fermentum. Arch. Microbiol. 2006, 186, 51–59. [Google Scholar] [CrossRef]
- Okano, K.; Yoshida, S.; Tanaka, T.; Ogino, C.; Fukuda, H.; Kondo, A. Homo-d-Lactic acid fermentation from arabinose by redirection of the phosphoketolase pathway to the pentose phosphate pathway in L-Lactate dehydrogenase gene-deficient Lactobacillus plantarum. Appl. Environ. Microbiol. 2009, 75, 5175. [Google Scholar] [CrossRef] [Green Version]
- Franco, I.S.; Mota, L.J.; Soares, C.M.; de Sa-Nogueira, I. Functional domains of the bacillus subtilis transcription factor arar and identification of amino acids important for nucleoprotein complex assembly and effector binding. J. Bacteriol. 2006, 188, 3024–3036. [Google Scholar] [CrossRef] [Green Version]
- Prechtl, R.M.; Janssen, D.; Behr, J.; Ludwig, C.; Kuster, B.; Vogel, R.F.; Jakob, F. Sucrose-induced proteomic response and carbohydrate utilization of Lactobacillus sakei TWM 1.411 during dextran formation. Front. Microbiol. 2018, 9, 2796. [Google Scholar] [CrossRef]
- Hendrickson, W.; Schleif, R.F. Regulation of the Escherichia coli L-arabinose operon studied by gel electrophoresis DNA binding assay. J. Mol. Biol. 1984, 178, 611–628. [Google Scholar] [CrossRef]
- Dan, T.; Fukuda, K.; Sugai-Bannai, M.; Takakuwa, N.; Motoshima, H.; Urashima, T. Characterization and expression analysis of the exopolysaccharide gene cluster in Lactobacillus fermentum TDS030603. Biosci. Biotech. Biochem. 2009, 73, 2656–2664. [Google Scholar] [CrossRef] [PubMed]
- Lebeer, S.; Verhoeven, T.L.A.; Francius, G.; Schoofs, G.; Lambrichts, I.; Dufrene, Y.; Vanderleyden, J.; De Keersmaecker, S.C.J. Identification of a gene cluster for the biosynthesis of a long, galactose-rich exopolysaccharide in Lactobacillus rhamnosus GG and functional analysis of the priming glycosyltransferase. Appl. Environ. Microbiol. 2009, 75, 3554–3563. [Google Scholar] [CrossRef] [PubMed] [Green Version]
- Vastano, V.; Perrone, F.; Marasco, R.; Sacco, M.; Muscariello, L. Transcriptional analysis of exopolysaccharides biosynthesis gene clusters in Lactobacillus plantarum. Arch. Microbiol. 2016, 198, 295–300. [Google Scholar] [CrossRef] [PubMed]
- Dertli, E.; Mayer, M.J.; Colquhoun, I.J.; Narbad, A. EpsA is an essential gene in exopolysaccharide production in Lactobacillus johnsonii FI9785. Microb. Biotechnol. 2016, 9, 496–501. [Google Scholar] [CrossRef] [PubMed] [Green Version]
- Song, X.; Xiong, Z.Q.; Kong, L.H.; Wang, G.Q.; Ai, L.Z. Relationship between putative eps genes and production of exopolysaccharide in Lactobacillus casei LC2W. Front. Microbiol. 2018, 9. [Google Scholar] [CrossRef] [Green Version]
- Azevedo, A.C.; Bento, C.B.; Ruiz, J.C.; Queiroz, M.V.; Mantovani, H.C. Distribution and genetic diversity of bacteriocin gene clusters in rumen microbial genomes. Appl. Environ. Microbiol. 2015, 81, 7290–7304. [Google Scholar] [CrossRef] [Green Version]
- Nilsen, T.; Nes, I.F.; Holo, H. Enterolysin A, a cell wall-degrading bacteriocin from Enterococcus faecalis LMG 2333. Appl. Environ. Microbiol. 2003, 69, 2975–2984. [Google Scholar] [CrossRef] [Green Version]
- Veljovic, K.; Terzic-Vidojevic, A.; Tolinacki, M.; Kojic, M.; Topisirovic, L. Molecular analysis of enterolysin a and entl gene cluster from natural isolate Enterococcus faecalis bgpt1-10p. Genetika-Belgrade 2013, 45, 479–492. [Google Scholar] [CrossRef]
- Cotter, P.D.; Ross, R.P.; Hill, C.; Dobson, A. Bacteriocin production: A probiotic trait? Appl. Environ. Microbiol. 2011, 78, 1–6. [Google Scholar] [CrossRef] [Green Version]
- Walsh, M.C.; Gardiner, G.E.; Hart, O.M.; Lawlor, P.G.; Daly, M.; Lynch, B.; Richert, B.T.; Radcliffe, S.; Giblin, L.; Hill, C.; et al. Predominance of a bacteriocin-producing Lactobacillus salivarius component of a five-strain probiotic in the porcine ileum and effects on host immune phenotype. FEMS Microbiol. Ecol. 2008, 64, 317–327. [Google Scholar] [CrossRef] [PubMed] [Green Version]
- Gillor, O.; Giladi, I.; Riley, M.A. Persistence of colicinogenic Escherichia coli in the mouse gastrointestinal tract. BMC Microbiol. 2009, 9, 165. [Google Scholar] [CrossRef] [PubMed] [Green Version]
- Haft, D.H.; Selengut, J.; Mongodin, E.F.; Nelson, K.E. A guild of 45 CRISPR-associated (Cas) protein families and multiple CRISPR/Cas subtypes exist in prokaryotic genomes. PLoS Comput. Biol. 2005, 1, e60. [Google Scholar] [CrossRef] [PubMed]
- Makarova, K.S.; Grishin, N.V.; Shabalina, S.A.; Wolf, Y.I.; Koonin, E.V. A putative RNA-interference-based immune system in prokaryotes: computational analysis of the predicted enzymatic machinery, functional analogies with eukaryotic RNAi, and hypothetical mechanisms of action. Biol. Direct 2006, 1, 7. [Google Scholar] [CrossRef] [Green Version]
- Makarova, K.S.; Haft, D.H.; Barrangou, R.; Brouns, S.J.; Charpentier, E.; Horvath, P.; Moineau, S.; Mojica, F.J.; Wolf, Y.I.; Yakunin, A.F.; et al. Evolution and classification of the CRISPR-Cas systems. Nat. Rev. Microbiol. 2011, 9, 467–477. [Google Scholar] [CrossRef] [Green Version]
- Koonin, E.V.; Makarova, K.S.; Zhang, F. Diversity, classification and evolution of CRISPR-Cas systems. Curr. Opin. Microbiol. 2017, 37, 67–78. [Google Scholar] [CrossRef]
- Chylinski, K.; Makarova, K.S.; Charpentier, E.; Koonin, E.V. Classification and evolution of type II CRISPR-Cas systems. Nucleic Acids Res. 2014, 42, 6091–6105. [Google Scholar] [CrossRef] [Green Version]
- Horvath, P.; Romero, D.A.; Coute-Monvoisin, A.C.; Richards, M.; Deveau, H.; Moineau, S.; Boyaval, P.; Fremaux, C.; Barrangou, R. Diversity, activity, and evolution of CRISPR loci in Streptococcus thermophilus. J. Bacteriol. 2008, 190, 1401–1412. [Google Scholar] [CrossRef] [Green Version]
- Boto, L. Horizontal gene transfer in evolution: Facts and challenges. Proc. Biol. Sci. 2010, 277, 819–827. [Google Scholar] [CrossRef] [Green Version]
Figure 1.
The Average Nucleotide Identity (ANI) and phylogenetic analysis of L. mucosae: (a) Heatmap showing the ANI value among 101 L. mucosae strains. Proposed species cut-off boundary was around 95% to 96%. (b) Venn diagram based on homologous genes. (c) Phylogenetic tree based on orthologous genes, taking into account factors, such as distance, age, and habitat. Th different colored strain numbers represent the strains isolated from different sampling points. Green, orange, cyan, blue, pink, brown, and purple representing Gansu, Jiangsu, Zhejiang, Anhui, Shanghai, Henan, and Guangdong, respectively. (d) Display of the sampling area in the Chinese map. Yellow representing Area I, red representing Area II, and green representing Area III.


Figure 2.
Pan-genome and core genes of L. mucosae: (a) Numbers of total features in the core (green) and pan (red) genome as a function of the number of strains sequenced. (b) Percentage of genes associated with general cluster of orthologous groups (COGs) of proteins’ functional categories.
Figure 2.
Pan-genome and core genes of L. mucosae: (a) Numbers of total features in the core (green) and pan (red) genome as a function of the number of strains sequenced. (b) Percentage of genes associated with general cluster of orthologous groups (COGs) of proteins’ functional categories.

Figure 3.
Genotype-phenotype analysis of carbohydrate utilization of 93 L. mucosae strains: (a) Utilization of 24 kinds of carbohydrates. (b) Predicted glycoside hydrolases and transferase\prediction of gene cluster for utilization of lactose (c), trehalose (d), L-arabinose (e), and D-fructose (f).
Figure 3.
Genotype-phenotype analysis of carbohydrate utilization of 93 L. mucosae strains: (a) Utilization of 24 kinds of carbohydrates. (b) Predicted glycoside hydrolases and transferase\prediction of gene cluster for utilization of lactose (c), trehalose (d), L-arabinose (e), and D-fructose (f).


Figure 4.
Prediction of exopolysaccharide (EPS) synthesis gene cluster in L. mucosae.

Figure 5.
Prediction of bacteriocin operon in L. mucosae: (a) Predicted gene cluster for enterolysin A synthesis in most strains of L. mucosae. (b) Predicted gene cluster for enterolysin A synthesis in the strain DCC1HL5. (c) Distribution of complete bacteriocin operons.
Figure 5.
Prediction of bacteriocin operon in L. mucosae: (a) Predicted gene cluster for enterolysin A synthesis in most strains of L. mucosae. (b) Predicted gene cluster for enterolysin A synthesis in the strain DCC1HL5. (c) Distribution of complete bacteriocin operons.

Figure 6.
CRISPR-Cas systems in L. mucosae: (a) CRISPR loci in L. mucosae (four subtypes). The CRISPR locus was annotated and depicted with signature Cas genes colored in red, Cas3 for Type I, Cas9 for Type II, and Cas10 for Type III, and the universal Cas1 and Cas2 were colored in blue and green, respectively. Accessory genes were colored in a gray scale. CRISPR is represented using the fence graphics on the right side of each locus. (b) The phylogenetic tree constructed with Cas1 and DR sequences with four different subtypes in four colors. (c) Three kinds of Direct Repeats (DR) sequences in the same strain were visualized by using WebLogo. The height of the letter represented the frequency of the corresponding base at that position.


Table 1.
Host information and general genome features of 101 strains of L. mucosae.
| Strain | Region (City/Province) | Origin/Age | Gene Size | GC (%) | tRNA | Accession No. | Reference |
|---|---|---|---|---|---|---|---|
| (Mb) | |||||||
| DCC1HL5 | Dali, Yunnan | Bovine Feces | 1.96 | 48.17 | 57 | SAMN13220078 | This work |
| FAHBZ1M4 | Bozhou, Anhui | Human feces, 24y | 2.22 | 48.14 | 66 | SAMN13220079 | This work |
| FAHBZ5L1 | Bozhou, Anhui | Human feces, 77y | 2.05 | 48.17 | 62 | SAMN13220080 | This work |
| FAHBZ12M2 | Bozhou, Anhui | Human feces, 6m | 2.21 | 47.95 | 62 | SAMN13220081 | This work |
| FAHBZ16L4 | Bozhou, Anhui | Human feces, 63y | 2.02 | 47.85 | 52 | SAMN13220082 | This work |
| FAHBZ18M3 | Bozhou, Anhui | Human feces, 26y | 2.07 | 48.09 | 48 | SAMN13220083 | This work |
| FAHBZ20L1 | Bozhou, Anhui | Human feces, 52y | 2.00 | 47.84 | 54 | SAMN13220084 | This work |
| FAHBZ34M2 | Bozhou, Anhui | Human feces, 51y | 2.11 | 48.12 | 61 | SAMN13220085 | This work |
| FAHBZ49M2 | Bozhou, Anhui | Human feces, 53y | 2.01 | 48.21 | 53 | SAMN13220086 | This work |
| FAHBZ50M5 | Bozhou, Anhui | Human feces, 14y | 1.97 | 47.89 | 59 | SAMN13220087 | This work |
| FAHBZ53M2 | Bozhou, Anhui | Human feces, 54y | 2.01 | 48.08 | 47 | SAMN13220088 | This work |
| FGSYC1M1 | Yongchang, Gansu | Human feces, 77y | 2.13 | 48.07 | 50 | SAMN13220089 | This work |
| FGSYC15L3 | Yongchang, Gansu | Human feces, 78y | 2.07 | 47.84 | 52 | SAMN13220090 | This work |
| FGSYC16M1 | Yongchang, Gansu | Human feces, 77y | 2.07 | 47.68 | 55 | SAMN13220091 | This work |
| FGSYC17L3 | Yongchang, Gansu | Human feces, 53y | 2.11 | 47.73 | 48 | SAMN13220092 | This work |
| FGSYC19L1 | Yongchang, Gansu | Human feces, 66y | 2.17 | 47.98 | 54 | SAMN13220093 | This work |
| FGSYC23L4 | Yongchang, Gansu | Human feces, 67y | 2.14 | 47.98 | 54 | SAMN13220094 | This work |
| FGSYC27L1 | Yongchang, Gansu | Human feces, 54y | 2.07 | 48.23 | 50 | SAMN13220095 | This work |
| FGSYC42L4 | Yongchang, Gansu | Human feces, 57y | 2.09 | 47.96 | 48 | SAMN13220096 | This work |
| FGSYC43L5 | Yongchang, Gansu | Human feces, 55y | 2.33 | 48.08 | 58 | SAMN13220097 | This work |
| FGSYC90L5 | Yongchang, Gansu | Human feces, 67y | 2.22 | 48.1 | 52 | SAMN13220098 | This work |
| FHNXY1L8 | Xiayi, Henan | Human feces, 65y | 2.06 | 48.06 | 60 | SAMN13220099 | This work |
| FHNXY19M3 | Xiayi, Henan | Human feces, 85y | 2.14 | 47.98 | 49 | SAMN13220100 | This work |
| FHNXY29L2 | Xiayi, Henan | Human feces, 66y | 2.07 | 47.56 | 65 | SAMN13220101 | This work |
| FHNXY31L3 | Xiayi, Henan | Human feces, 33y | 2.06 | 48.08 | 44 | SAMN13220102 | This work |
| FHNXY47L1 | Xiayi, Henan | Human feces, 86y | 2.01 | 48.12 | 46 | SAMN13220103 | This work |
| FHNXY68L2 | Xiayi, Henan | Dog feces | 2.06 | 48.06 | 47 | SAMN13220104 | This work |
| FHNXY72L1 | Xiayi, Henan | Dog feces | 2.01 | 48.15 | 53 | SAMN13220105 | This work |
| FHuNHHMY89L8 | Mayang, Hunan | Pig feces | 2.25 | 47.84 | 53 | SAMN13220106 | This work |
| FJSCZ8L1 | Changzhou, Jiangsu | Dog feces | 1.99 | 48.23 | 42 | SAMN13220107 | This work |
| FJSNT61 | Nantong, Jiangsu | Human feces, 82y | 2.13 | 48.38 | 48 | SAMN13220108 | This work |
| FJSNT81 | Nantong, Jiangsu | Human feces, 60y | 2.20 | 48.1 | 47 | SAMN13220109 | This work |
| FJSNT91 | Nantong, Jiangsu | Human feces, 79y | 2.14 | 48.36 | 55 | SAMN13220110 | This work |
| FJSNT141 | Nantong, Jiangsu | Human feces, 82y | 2.05 | 48.26 | 61 | SAMN13220111 | This work |
| FJSNT152 | Nantong, Jiangsu | Human feces, 95y | 2.08 | 47.91 | 48 | SAMN13220112 | This work |
| FJSNT182 | Nantong, Jiangsu | Human feces, 85y | 2.27 | 47.65 | 56 | SAMN13220113 | This work |
| FJSNT192 | Nantong, Jiangsu | Human feces, 84y | 2.23 | 48.01 | 56 | SAMN13220114 | This work |
| FJSNT312 | Nantong, Jiangsu | Human feces, 64y | 2.04 | 48.04 | 59 | SAMN13220115 | This work |
| FJSNT321 | Nantong, Jiangsu | Human feces, 63y | 2.04 | 48.04 | 45 | SAMN13220116 | This work |
| FJSNT331 | Nantong, Jiangsu | Human feces, 92y | 2.18 | 48.1 | 66 | SAMN13220117 | This work |
| FJSWX5M5 | Wuxi, Jiangsu | Human feces, 81y | 2.12 | 48.22 | 50 | SAMN13220118 | This work |
| FJSWX8M3 | Wuxi, Jiangsu | Human feces, 88y | 2.08 | 48.07 | 50 | SAMN13220119 | This work |
| FJSWX13M2 | Wuxi, Jiangsu | Human feces, 79y | 2.17 | 48.21 | 56 | SAMN13220120 | This work |
| FJSWX15M1 | Wuxi, Jiangsu | Human feces, 82y | 2.08 | 47.81 | 59 | SAMN13220121 | This work |
| FJSWX18M1 | Wuxi, Jiangsu | Human feces, 81y | 2.2 | 48.15 | 56 | SAMN13220122 | This work |
| FJSWX19M2 | Wuxi, Jiangsu | Human feces, 78y | 2.12 | 47.83 | 62 | SAMN13220123 | This work |
| FJSWX20M1 | Wuxi, Jiangsu | Human feces, 90y | 2.16 | 47.84 | 57 | SAMN13220124 | This work |
| FJSWX21M1 | Wuxi, Jiangsu | Human feces, 90y | 2.17 | 48.08 | 49 | SAMN13220125 | This work |
| FJSWX27M1 | Wuxi, Jiangsu | Human feces, 88y | 2.05 | 47.68 | 60 | SAMN13220126 | This work |
| FJSWX28M2 | Wuxi, Jiangsu | Human feces, 83y | 2.05 | 47.84 | 62 | SAMN13220127 | This work |
| FJSWX34JL6 | Wuxi, Jiangsu | Human feces, 3y | 2.19 | 48.27 | 48 | SAMN13220128 | This work |
| FJSXYWG2L4 | Xuyi, Jiangsu | Silage | 1.97 | 48.33 | 41 | SAMN13220129 | This work |
| FJSXYWG6L3 | Xuyi, Jiangsu | Cow feces | 1.94 | 48.1 | 54 | SAMN13220130 | This work |
| FSH3M1 | Shanghai | Human feces, 83y | 1.99 | 48.37 | 41 | SAMN13220131 | This work |
| FSH12M2 | Shanghai | Human feces, 84y | 2.02 | 48.25 | 57 | SAMN13220132 | This work |
| FSH14M2 | Shanghai | Human feces, 85y | 2.10 | 48.17 | 54 | SAMN13220133 | This work |
| FSH18M1 | Shanghai | Human feces, 85y | 2.03 | 48.04 | 60 | SAMN13220134 | This work |
| FSH19M2 | Shanghai | Human feces, 86y | 2.04 | 48.23 | 59 | SAMN13220135 | This work |
| FSH21M1 | Shanghai | Human feces, 87y | 1.94 | 48.15 | 60 | SAMN13220136 | This work |
| FSH22M2 | Shanghai | Human feces, 78y | 2.02 | 48.16 | 60 | SAMN13220137 | This work |
| FSH26M1 | Shanghai | Human feces, 71y | 2.03 | 47.88 | 59 | SAMN13220138 | This work |
| FSH41M1 | Shanghai | Human feces, 86y | 2.09 | 48.24 | 59 | SAMN13220139 | This work |
| FSH46M2 | Shanghai | Human feces, 84y | 1.99 | 47.87 | 59 | SAMN13220140 | This work |
| FSH47M1 | Shanghai | Human feces, 85y | 2.08 | 47.88 | 58 | SAMN13220141 | This work |
| FYNLJ83L1 | Lijiang, Yunnan | Pig feces | 2.11 | 48.15 | 56 | SAMN13220142 | This work |
| FYNLJ87L2 | Lijiang, Yunnan | Pig feces | 2.10 | 47.97 | 49 | SAMN13220143 | This work |
| FZJTZ17M6 | Taizhou, Zhejiang | Human feces, 67y | 2.2 | 48.1 | 59 | SAMN13220144 | This work |
| FZJTZ18M3 | Taizhou, Zhejiang | Human feces, 79y | 1.86 | 48.03 | 64 | SAMN13220145 | This work |
| FZJTZ22M3 | Taizhou, Zhejiang | Human feces, 55y | 1.93 | 47.84 | 64 | SAMN13220146 | This work |
| FZJTZ23M9 | Taizhou, Zhejiang | Human feces, 76y | 2.45 | 47.71 | 46 | SAMN13220147 | This work |
| FZJTZ24M5 | Taizhou, Zhejiang | Human feces, 62y | 2.28 | 48.29 | 64 | SAMN13220148 | This work |
| FZJTZ26M3 | Taizhou, Zhejiang | Human feces, 40y | 1.97 | 48.59 | 44 | SAMN13220149 | This work |
| FZJTZ32M4 | Taizhou, Zhejiang | Human feces, 58y | 1.99 | 47.95 | 60 | SAMN13220150 | This work |
| FZJTZ34M1 | Taizhou, Zhejiang | Human feces, 76y | 2.20 | 48.16 | 50 | SAMN13220151 | This work |
| FZJTZ36M3 | Taizhou, Zhejiang | Human feces, 80y | 2.05 | 48.37 | 58 | SAMN13220152 | This work |
| FZJTZ60M1 | Taizhou, Zhejiang | Human feces, 78y | 2.25 | 48.3 | 53 | SAMN13220153 | This work |
| GD1M1 | Lianzhou, Guangdong | Human feces, 75y | 2.33 | 48.28 | 51 | SAMN13220154 | This work |
| GD2M2 | Lianzhou, Guangdong | Human feces, 84y | 2.33 | 48.15 | 58 | SAMN13220155 | This work |
| GD3M2 | Lianzhou, Guangdong | Human feces, 76y | 2.32 | 47.97 | 79 | SAMN13220156 | This work |
| GD4M1 | Lianzhou, Guangdong | Human feces, 5y | 2.13 | 48.06 | 38 | SAMN13220157 | This work |
| GD9M1 | Lianzhou, Guangdong | Human feces, 76y | 2.21 | 48.17 | 52 | SAMN13220158 | This work |
| GD14M3 | Lianzhou, Guangdong | Human feces, 10y | 2.36 | 48.18 | 55 | SAMN13220159 | This work |
| GD15M1 | Lianzhou, Guangdong | Human feces, 10y | 2.36 | 48.3 | 67 | SAMN13220160 | This work |
| GD16M9 | Lianzhou, Guangdong | Human feces, 81y | 2.36 | 48.23 | 56 | SAMN13220161 | This work |
| GD17M2 | Lianzhou, Guangdong | Human feces, 8y | 2.14 | 48.36 | 66 | SAMN13220162 | This work |
| GD22M1 | Lianzhou, Guangdong | Human feces, 73y | 2.15 | 48.23 | 57 | SAMN13220163 | This work |
| GD24M2 | Lianzhou, Guangdong | Human feces, 58y | 2.13 | 48.25 | 58 | SAMN13220164 | This work |
| GD64M2 | Lianzhou, Guangdong | Human feces, 64y | 2.05 | 48.19 | 55 | SAMN13220165 | This work |
| GD67M2 | Lianzhou, Guangdong | Human feces, 9y | 2.01 | 48.19 | 56 | SAMN13220166 | This work |
| GD68M4 | Lianzhou, Guangdong | Human feces, 10y | 2.00 | 48.31 | 53 | SAMN13220167 | This work |
| GD69M1 | Lianzhou, Guangdong | Human feces, 63y | 2.03 | 47.87 | 67 | SAMN13220168 | This work |
| M104R01L3 | Dangxiong, Tibet | Yak milk | 2.07 | 47.92 | 57 | SAMN13220169 | This work |
| VWX301M18 | Wuxi, Jiangsu | Human vagina | 2.01 | 47.84 | 61 | SAMN13220170 | This work |
| LM1 | Brazil | Pig small intestine | 2.43 | 46.13 | 91 | SAMN02470226 | [31] |
| DSM13345 | Sweden | Pig small intestine | 2.25 | 46.40 | - | SAMN02369406 | [32] |
| KHPC15 | United States | Bovine rumen | 1.88 | 46.70 | 46 | SAMN05216545 | [33] |
| KHPX11 | United States | Bovine rumen | 1.88 | 46.70 | 64 | SAMN05216461 | [33] |
| WCC8 | United States | Bovine rumen | 1.88 | 46.70 | 59 | SAMN05216430 | [33] |
| DPC6426 | Ireland | Bovine rumen | 2.80 | 47.00 | 89 | SAMN03145820 | [34] |
| AGR63 | United States | Bovine rumen | 1.94 | 47.00 | 94 | SAMN02744693 | [33] |
| L24-B | United States | Bovine rumen | 2.00 | 46.90 | 88 | SAMN10744154 | [35] |
© 2020 by the authors. Licensee MDPI, Basel, Switzerland. This article is an open access article distributed under the terms and conditions of the Creative Commons Attribution (CC BY) license (http://creativecommons.org/licenses/by/4.0/).
Share and Cite
MDPI and ACS Style
Jia, Y.; Yang, B.; Ross, P.; Stanton, C.; Zhang, H.; Zhao, J.; Chen, W. Comparative Genomics Analysis of Lactobacillus mucosae from Different Niches. Genes 2020, 11, 95. https://0-doi-org.brum.beds.ac.uk/10.3390/genes11010095
AMA Style
Jia Y, Yang B, Ross P, Stanton C, Zhang H, Zhao J, Chen W. Comparative Genomics Analysis of Lactobacillus mucosae from Different Niches. Genes. 2020; 11(1):95. https://0-doi-org.brum.beds.ac.uk/10.3390/genes11010095
Chicago/Turabian StyleJia, Yan, Bo Yang, Paul Ross, Catherine Stanton, Hao Zhang, Jianxin Zhao, and Wei Chen. 2020. "Comparative Genomics Analysis of Lactobacillus mucosae from Different Niches" Genes 11, no. 1: 95. https://0-doi-org.brum.beds.ac.uk/10.3390/genes11010095
Note that from the first issue of 2016, this journal uses article numbers instead of page numbers. See further details here.