Article

Identification of a Novel Imprinted Transcript in the Porcine GNAS Complex Locus Using Methylome and Transcriptome of Parthenogenetic Fetuses

1
Functional Genomics Laboratory, Department of Animal Sciences, The Ohio State University, Columbus, OH 43210, USA
2
College of Veterinary Medicine, Yangzhou University, Yangzhou 225009, China
3
Joint International Research Laboratory of Agriculture and Agri-Product Safety, the Ministry of Education of China, Yangzhou University, Yangzhou 225009, China
4
Animal Biotechnology Division, National Institute of Animal Science, RDA, Jeonbuk 55365, Korea
5
Department of Animal Breeding & Genetics, College of Animal Science & Technology, Nanjing Agricultural University, Nanjing 210095, China
6
Biotherapeutics Translational Research Center, Korea Research Institute of Bioscience and Biotechnology, Daejeon 34141, Korea
*
Authors to whom correspondence should be addressed.
These authors contributed equally to this work.
Submission received: 9 December 2019 / Revised: 10 January 2020 / Accepted: 13 January 2020 / Published: 14 January 2020
(This article belongs to the Section Animal Genetics and Genomics)

Abstract

:
Genomic imprinting in domestic animals contributes to the variance of performance traits. However, research remains to be done on large-scale detection of epigenetic landscape of porcine imprinted loci including the GNAS complex locus. The purpose of this study was to generate porcine parthenogenetic fetuses and comprehensively identify imprinting patterns of the GNAS locus in transcript levels. To this end, both normally fertilized and bimaternal (uniparental) parthenogenetic porcine fetuses were generated, and whole genome bisulfite sequencing (WGBS) and RNA sequencing (RNA-seq) were performed to construct methylome and transcriptome, respectively. Differentially methylated regions (DMRs) between the fetuses were identified through methylome analysis, and parental-origin-specific expression patterns of transcripts were examined with transcriptome. As a result, three major DMRs were identified: paternally methylated Nesp DMR, maternally methylated Nespas-Gnasxl DMR, and maternally methylated Exon1B–Exon1A DMR. Parental-origin-specific expressions of those five DMR-affected transcripts were found, including a novel imprinted transcript, Exon1B, in pigs. In conclusion, using parthenotes, parental-origin-specific imprinting patterns in the porcine GNAS locus was comprehensively identified, and our approach paves the way for the discovery of novel imprinted genes and loci in a genomic context across species.

1. Introduction

Genomic imprinting in mammals occurs in a subset of genes, often in clusters, and results in epigenetic regulation of monoallelical gene expression in a parental-origin-specific manner [1]. Imprinting has been extensively studied in mice and humans to understand epigenetic architecture of complex diseases and traits [2,3,4,5,6,7]. For example, allele-specific deficiency of imprinted guanine nucleotide-binding protein, α-stimulating (GNAS) gene products led to various metabolic phenotypes: obesity and hypometabolic states (in maternal knockout of Gsα, or Gnas) and leanness with increased metabolic rate (in paternal knockout of XLαs, or Gnasxl) [5,6,7]. Studies on domestic animals have further reported the contribution of genomic imprinting to the variance in performance traits [8,9]. Considering the economic importance of those traits and the possible translation of animal studies to human biology, comprehensive examination of imprinted genes and loci is of great interest to both animal and biomedical industries. However, previous approaches of identifying imprinted genes in animals based on single nucleotide polymorphisms (SNPs) or sequence deletions/insertions might face efficiency limitation when there is a lack of informative variations. To overcome this issue, the generation of uniparental fetuses followed by genome-wide detection of epigenetic landscape may be a definitive approach to pursue, especially for complex loci such as the locus of GNAS. The GNAS complex locus has a complicated imprinting pattern due to alternative promoter usage and extensive differentially methylated regions (DMRs) on the promoters [10]. Among multiple groups of transcripts, the maternal expression pattern of Nesp in the pig has been reported [11]. Nevertheless, comprehensive expression patterns of multiple groups of transcripts on the porcine GNAS locus remain to be elucidated.
By comparing parthenogenetic (PA) and control (CN) fetuses, we performed whole genome bisulfite sequencing (WGBS) for methylome profiling of the imprinting control region (ICR) in the GNAS locus and conducted RNA sequencing (RNA-Seq) for comprehensive transcriptome analysis. Our results revealed the full-scale imprinting status of the GNAS locus, including the discovery of a novel imprinted transcript, and confirmed the appropriateness of the strategy to identifying imprinting patterns using WGBS and RNA-Seq of parthenogenetic fetuses.

2. Materials and Methods

2.1. Ethics Statement

Our study protocol and standard operating procedures for the treatment of the pigs used in this study were reviewed and approved by the Institutional Animal Care and Use Committee of the National Institute of Animal Science, Rural Development Administration of Korea (approval number NIAS2015-670).

2.2. Porcine Oocyte Collection and In Vitro Maturation

Pig oocyte collection and in vitro maturation (IVM) were performed following previously described procedures [12]. Briefly, porcine ovaries were obtained from a local slaughterhouse (Nonghyup Moguchon, Gimje, Korea), immediately transported to a laboratory in normal saline solution supplemented with penicillin, and maintained in a thermos at 30–35 °C. Cumulus-oocyte complexes (COCs) were collected and washed in Tyrode’s lactate-Hepes containing 0.1% (w/v) polyvinyl alcohol. Oocytes with several layers of cumulus cells were selected and washed three times in TCM-199 (GIBCO, Grand Island, NY, USA) supplemented with 0.1% polyvinyl alcohol (w/v), 3.05 mM D-glucose, 0.91 mM sodium pyruvate, 0.57 mM cysteine, 0.5 µg/mL luteinizing hormone, 0.5 µg/mL follicle stimulating hormone, 10 ng/mL epidermal growth factor, 10% porcine follicular fluid (pFF), 75 µg/mL penicillin G, and 50 µg/mL streptomycin. For IVM, 50 COCs were transferred into 500 µL of maturation medium in a four-well dish (Nunc, Roskilde, Denmark). The oocytes were matured for 40–42 h at 38.5 °C in an incubator with 5% CO2.

2.3. Production of Parthenogenetic Embryos

After 40–42 h of IVM, cumulus cells were removed and oocytes with the first polar body were selected for activation. Those chosen oocytes were placed into 250 µm diameter wire electrodes of a fusion chamber (BLS Fusion = Eelctrode, Budapest, Hungary) covered with 0.3 M mannitol solution containing 0.1 mM MgSO4, 1.0 mM CaCl2, and 0.5 mM Hepes. For fusion, two DC pulses (1 s interval) of 1.2 kV/cm were applied for 30 µs using an LF101 Electro Cell Fusion Generator (Nepa Gene Co., Ltd., Chiba, Japan). After electric stimulation, 200 parthenogenetic embryos were transferred into both oviducts of each of the two LY (Landrace X Yorkshire) surrogate gilts aged 12 months at onset of estrus to produce parthenogenetic fetuses.

2.4. Collection of Fertilized and Parthenogenetic Fetuses

Two LY gilts were mated with boars to provide fertilized control fetuses for this study. Gilts were naturally mated twice with a 6 h interval during their natural heat (onset of estrus = day 0). Considering that the monoallelic expression of some imprinted genes does not occur until after the blastocyst stage [13] and porcine parthenogenetic conceptus dies at approximately day 32 of gestation [14], both normally fertilized and parthenogenetic fetuses were recovered at day 21 from the gilts and surrogates, respectively, that had been confirmed pregnant by an ultrasound examination. For the recovery of fetuses, the gilts were euthanized and their reproductive tracts were dissected. Fetuses surrounded by placenta were then gently separated from the uterus using two pairs of forceps. Subsequently, fetuses were removed from the placenta and placed on a piece of clean, dry tissue using a pair of forceps in order to dry liquid on the surface of the fetus. Only fetuses with intact morphology and comparable sizes were selected. Lengths of fetuses were 2.2, 2.1, and 2.1 cm for normal control (CN) and 2.0, 2.0, and 1.6 cm for parthenotes (PA). The collected fetuses were stored in liquid nitrogen until further use.

2.5. Whole Genome Bisulfite Sequencing (WGBS)

Pig genomic DNA was isolated from the whole collected fetuses of CN and PA (n = 3 for each) and fragmented. Accel-NGS Methyl-Seq DNA Library Kit (Swift Biosciences, Inc. Ann Arbor, MI, USA) was used for optimized bisulfite conversion of genomic DNA according to the manufacturer`s instructions. To amplify the bisulfite-treated DNA, PCR was conducted with adapter primers and Diastar™ EF-Taq DNA polymerase (Solgent, Daejeon, Korea). The thermal PCR conditions are: 3 min at 95 °C followed by 35 cycles of 30 s at 95 °C, 30 s at 60 °C, and 30 s at 72 °C, and a final 5 min at 72 °C. The PCR products were subjected to bead-based clean-up and then sequenced using HiSeqX sequencer by Macrogen (Seoul, Korea).

2.6. Analysis of WGBS

Total raw bases ranging from 127.10 to 131.13 Gbp were generated for each of the samples (3 CN and 3 PA groups). After data filtering and trimming using Trim Galore (v0.4.5), clean reads (ranged 839.71–866.48 Mbp) for each sample were left. Those reads were mapped to the reference genome (Sscrofa11.1/susScr11) with BSMAP (v2.87) and uniquely mapped reads were selected to sort and index. The methylation ratio of every single cytosine location was extracted from the mapping results using ‘methylatio.py’ script in BSMAP (Supplementary Table S1). Analysis of DMRs was performed using the program metilene (v0.2-8) [15] on the methylation ratios at all CpGs to identify DMRs with >10 CpGs, a genomic distance between CpGs < 300 bp, and a mean methylation difference between groups of >0.2. Significant DMRs with false discovery rate (FDR) < 0.05 were retained (Supplementary Table S2). The R/Bioconductor package Gviz (v1.28.3) [16] were used to visualize the methylation ratios and significant DMRs in relation to genomic coordinates of the GNAS locus.

2.7. RNA Extraction from the Fetuses

Total RNA from whole CN fetuses (n = 3) and whole PA fetuses (n = 3) samples was isolated with TRIzol reagent (Sigma-Aldrich, USA) according to the manufacturer’s instructions. The RNA samples were first treated with DNase I to degrade any possible DNA contamination. The RNA integrity was evaluated by 1.2% agarose gel electrophoresis and calculated by the ratio of 28S/18S rRNA (>2) and the RNA integrity number (RIN) (RIN > 7) using an Agilent 2100 BioAnalyzer. The RNA concentrations were assessed by the ratios of A260/A280 and A260/A230 (1.8–2.0).

2.8. cDNA Library Construction and RNA-Sequencing

In order to construct cDNA libraries with the TruSeq RNA Sample Prep Kit v.2 (Illumina, San Diego, CA, USA), 1ug of total RNA was used. Using the protocol consisted of polyA-selected RNA extraction, RNA fragmentation, random hexamer primed reverse transcription and amplification, the final cDNA library was generated. The libraries were quantified using quantitative Real-Time PCR (qPCR) according to the qPCR Quantification Protocol Guide and qualified using an Agilent Technologies 2100 Bioanalyzer. The library products (100nt paired-end) were sequenced by Illumina HiSeq2500.

2.9. De novo Assembly of Sequencing Reads

The raw sequencing reads were filtered, and the reference genome sequence of Sus scrofa (Sscrofa11.1/susScr11) and annotation files were downloaded from the Assembly database at the National Center for Biotechnology Information (NCBI) (http://0-www-ncbi-nlm-nih-gov.brum.beds.ac.uk/assembly/). The clean sequencing reads were then aligned to the reference genome using HISAT2 (v2.1.0) [17] with default parameter settings, except for the parameter—dta for tailored transcriptome assembly. RNA-Seq alignments in BAM format were generated and sorted by SAMtools (v1.9), and then the read coverage extracted from BAM files was plotted in alignment tracks and visualized using the R/Bioconductor package Gviz (v1.28.3) [16].

2.10. Analysis of Differential Expression of Exonic Regions

Using the R/Bioconductor package DEXSeq (v1.30.0) [18], RNA-seq reads were counted and analyzed. To prepare non-overlapping exon counting bins in GFF format, the Python script ‘dexseq_prepare_annotation.py’ from the DEXSeq package and the annotation file were used. Then, the ‘dexseq_count.py’ script was used to count reads at each counting bin using each BAM file as an input and generate count tables. The count tables and GFF file were used as the input files in DEXSeq for differential analysis. The counts from individual fetal samples were normalized for different sequencing depth by estimated size factors [18]. Exonic regions that are differentially expressed between CN and PA, also termed differential exon usage (DEU) [18], were identified with default settings and the function testForDEU of DEXSeq at a FDR of 0.05 (Supplementary Table S3). The term “E” was used to denote an exon counting bin (e.g., E001 for Nesp 1st exon).

3. Results

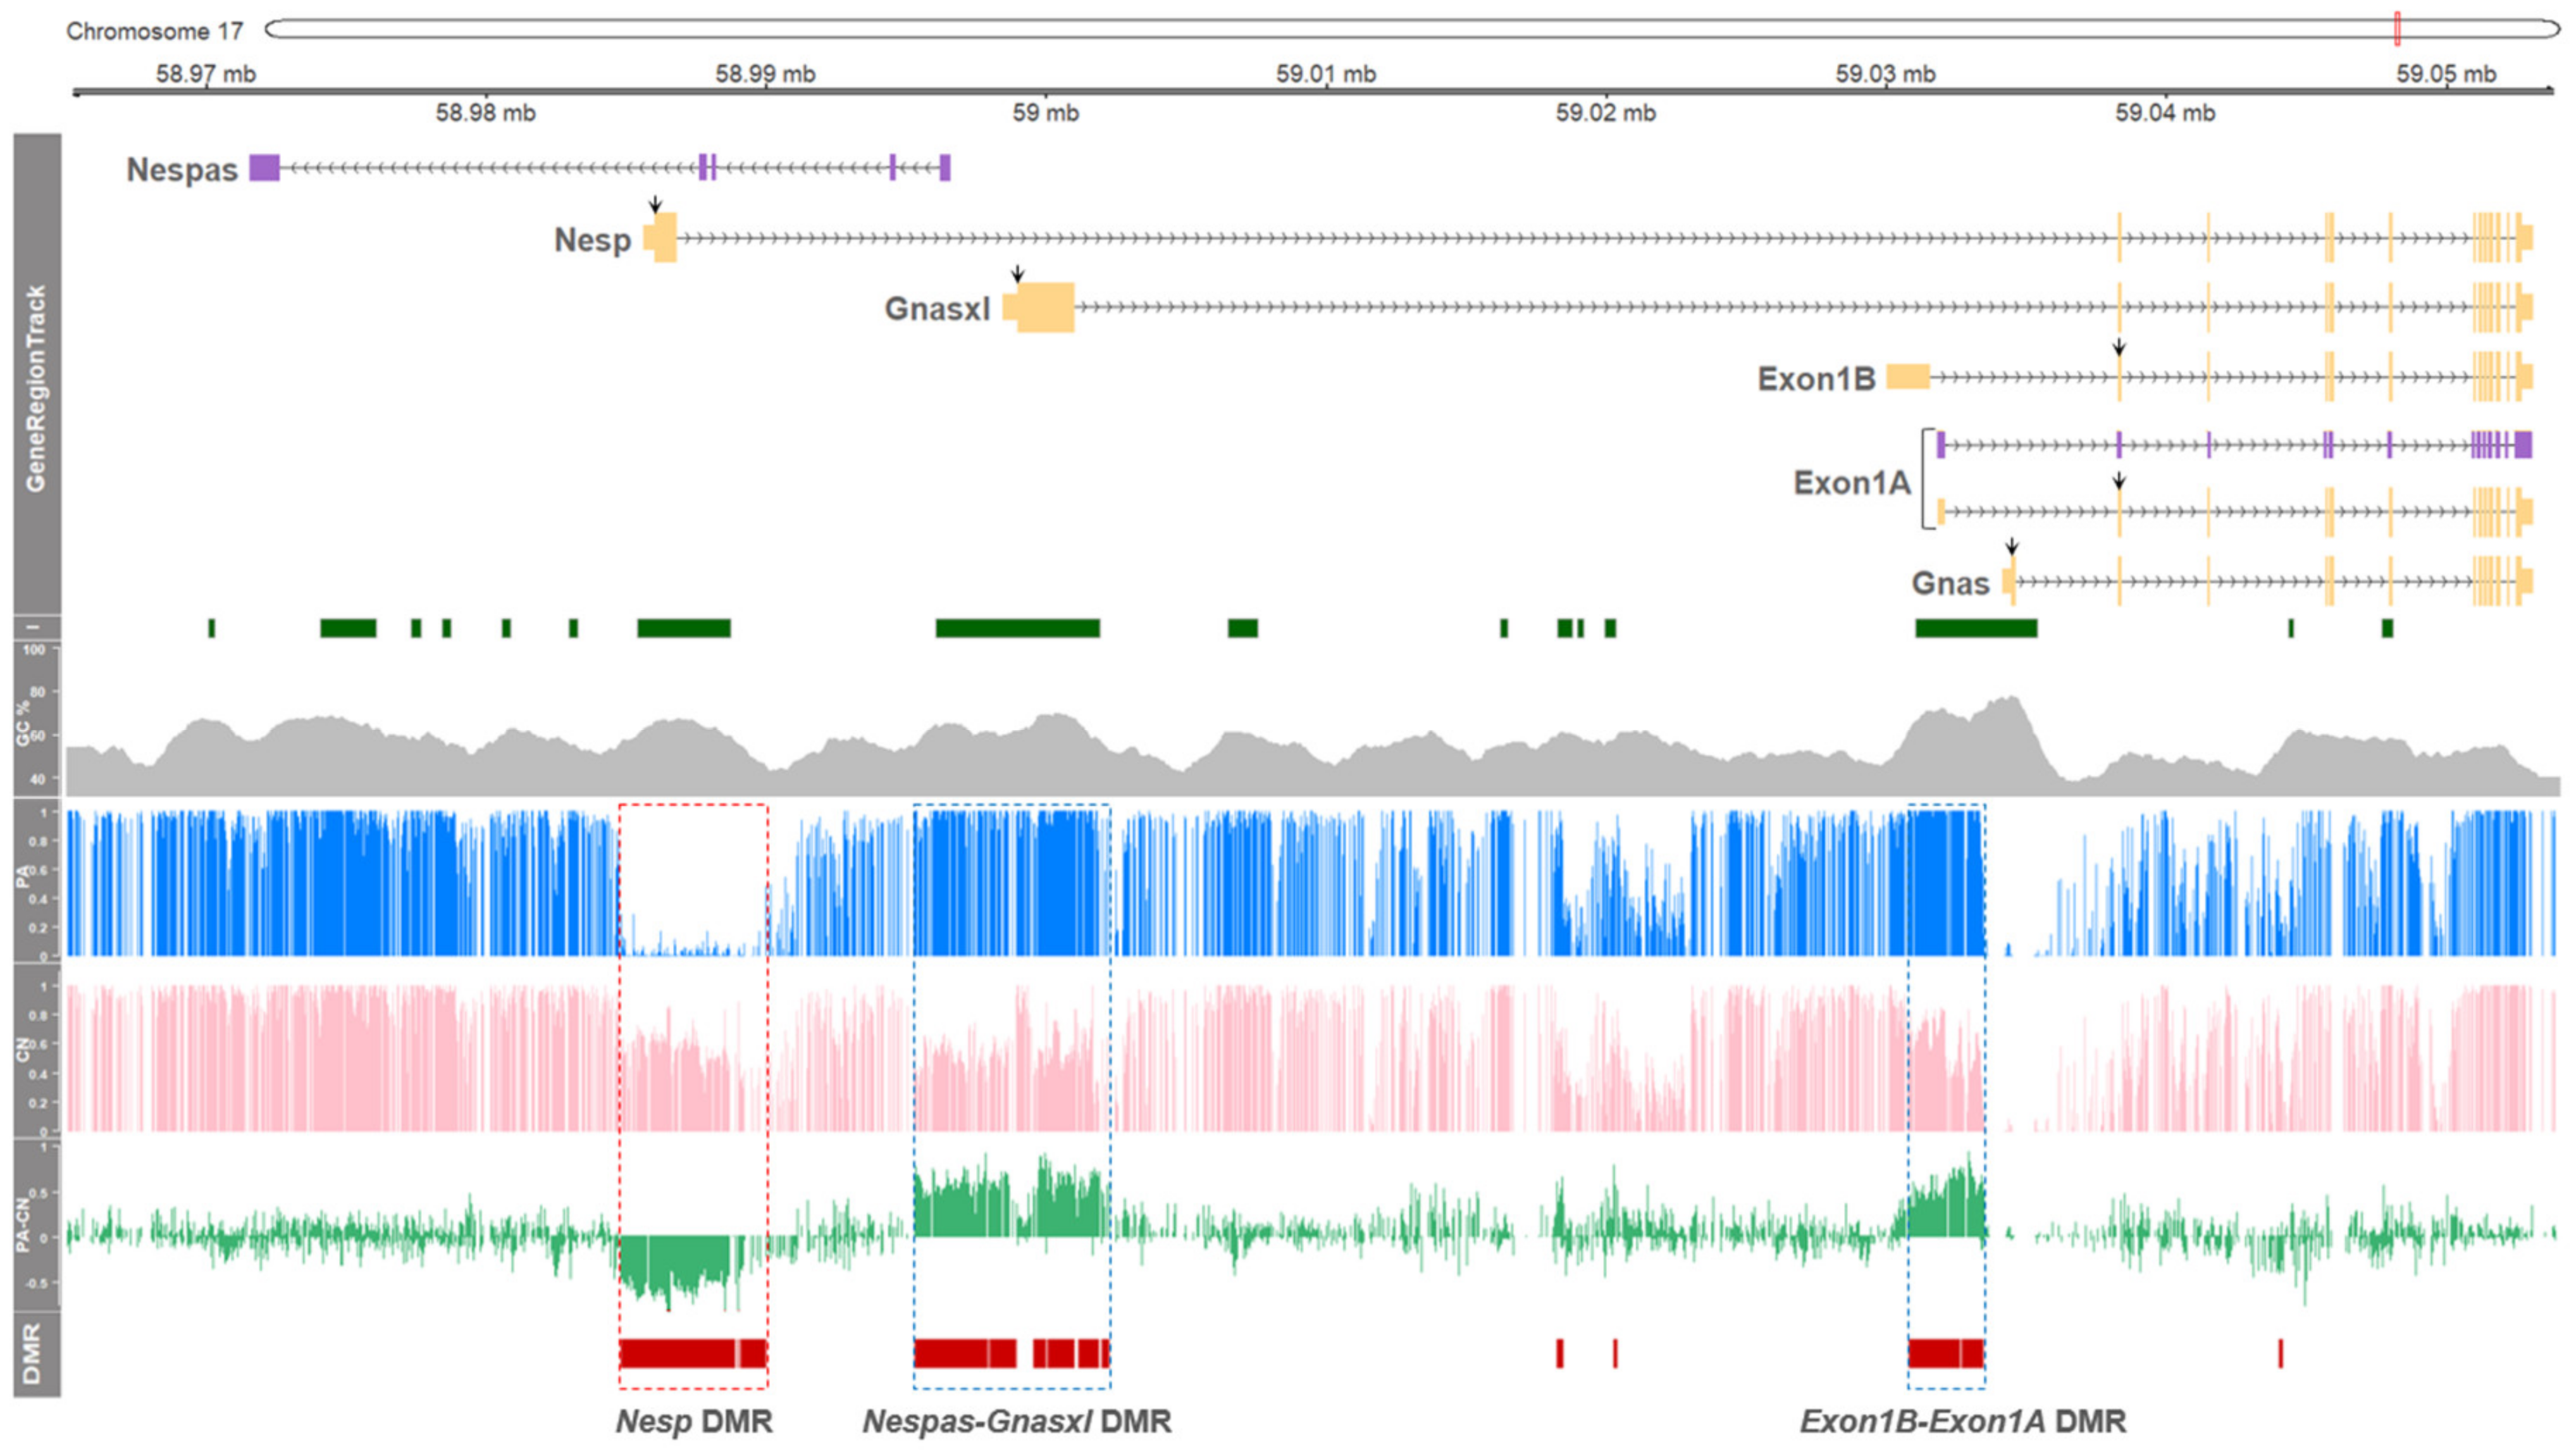
3.1. DNA Methylation in the GNAS Locus of Porcine Parthenogenetic Fetuses is Regulated in an Exon- Specific Manner

To investigate the parental-origin effect on DNA methylation in the GNAS locus, methylation status between parthenotes (PA) and normal controls (CN) were compared. Using whole genome bisulfite sequencing (WGBS), DNA methylome was produced at single-base resolution. In the locus, major DMRs were grouped into three large clusters (Figure 1). In PA, hypermethylated regions in the vicinity of the promoter regions, or in the vicinity of the 1st exons, of Gnasxl, Nespas, Exon1B, and Exon1A, were identified (Figure 1; dotted blue boxes). Since CN has one paternal and one maternal allele and PA has two copies of maternal alleles, this hypermethylation in PA could be derived from the presence of an extra maternal allele. Especially, paternal allele-specific expression of Exon1B was first identified in the porcine species in this study (as shown below in Figure 2), and maternal methylation in the promoter region of Exon1B was identified (Figure 1). The corresponding transcript of Exon1B was absent in other mammals such as humans, mice, and cattle based on our PubMed, Ensembl, and UCSC database search. In addition, a large methylation “canyon” was shown in the vicinity of promoter regions of Nesp from the PA model, indicating unmethylated or hypomethylated CpGs in the two maternal alleles of PA (Figure 1; a dotted red box). Hypermethylation in the corresponding promoter region of Nesp in CN was detected and it indicates paternal methylation occcurred at this locus. All reported transcripts from this region in the NCBI Gene database (https://0-www-ncbi-nlm-nih-gov.brum.beds.ac.uk/gene) were grouped into transcripts depicted in Figure 1 based on their alternative promoter usages (Supplementary Figure S1), and Nespas (LOC106506734; GenBank assession number XR_001302255.1) was derived from the NCBI Nucleotide database (https://0-www-ncbi-nlm-nih-gov.brum.beds.ac.uk/nuccore).

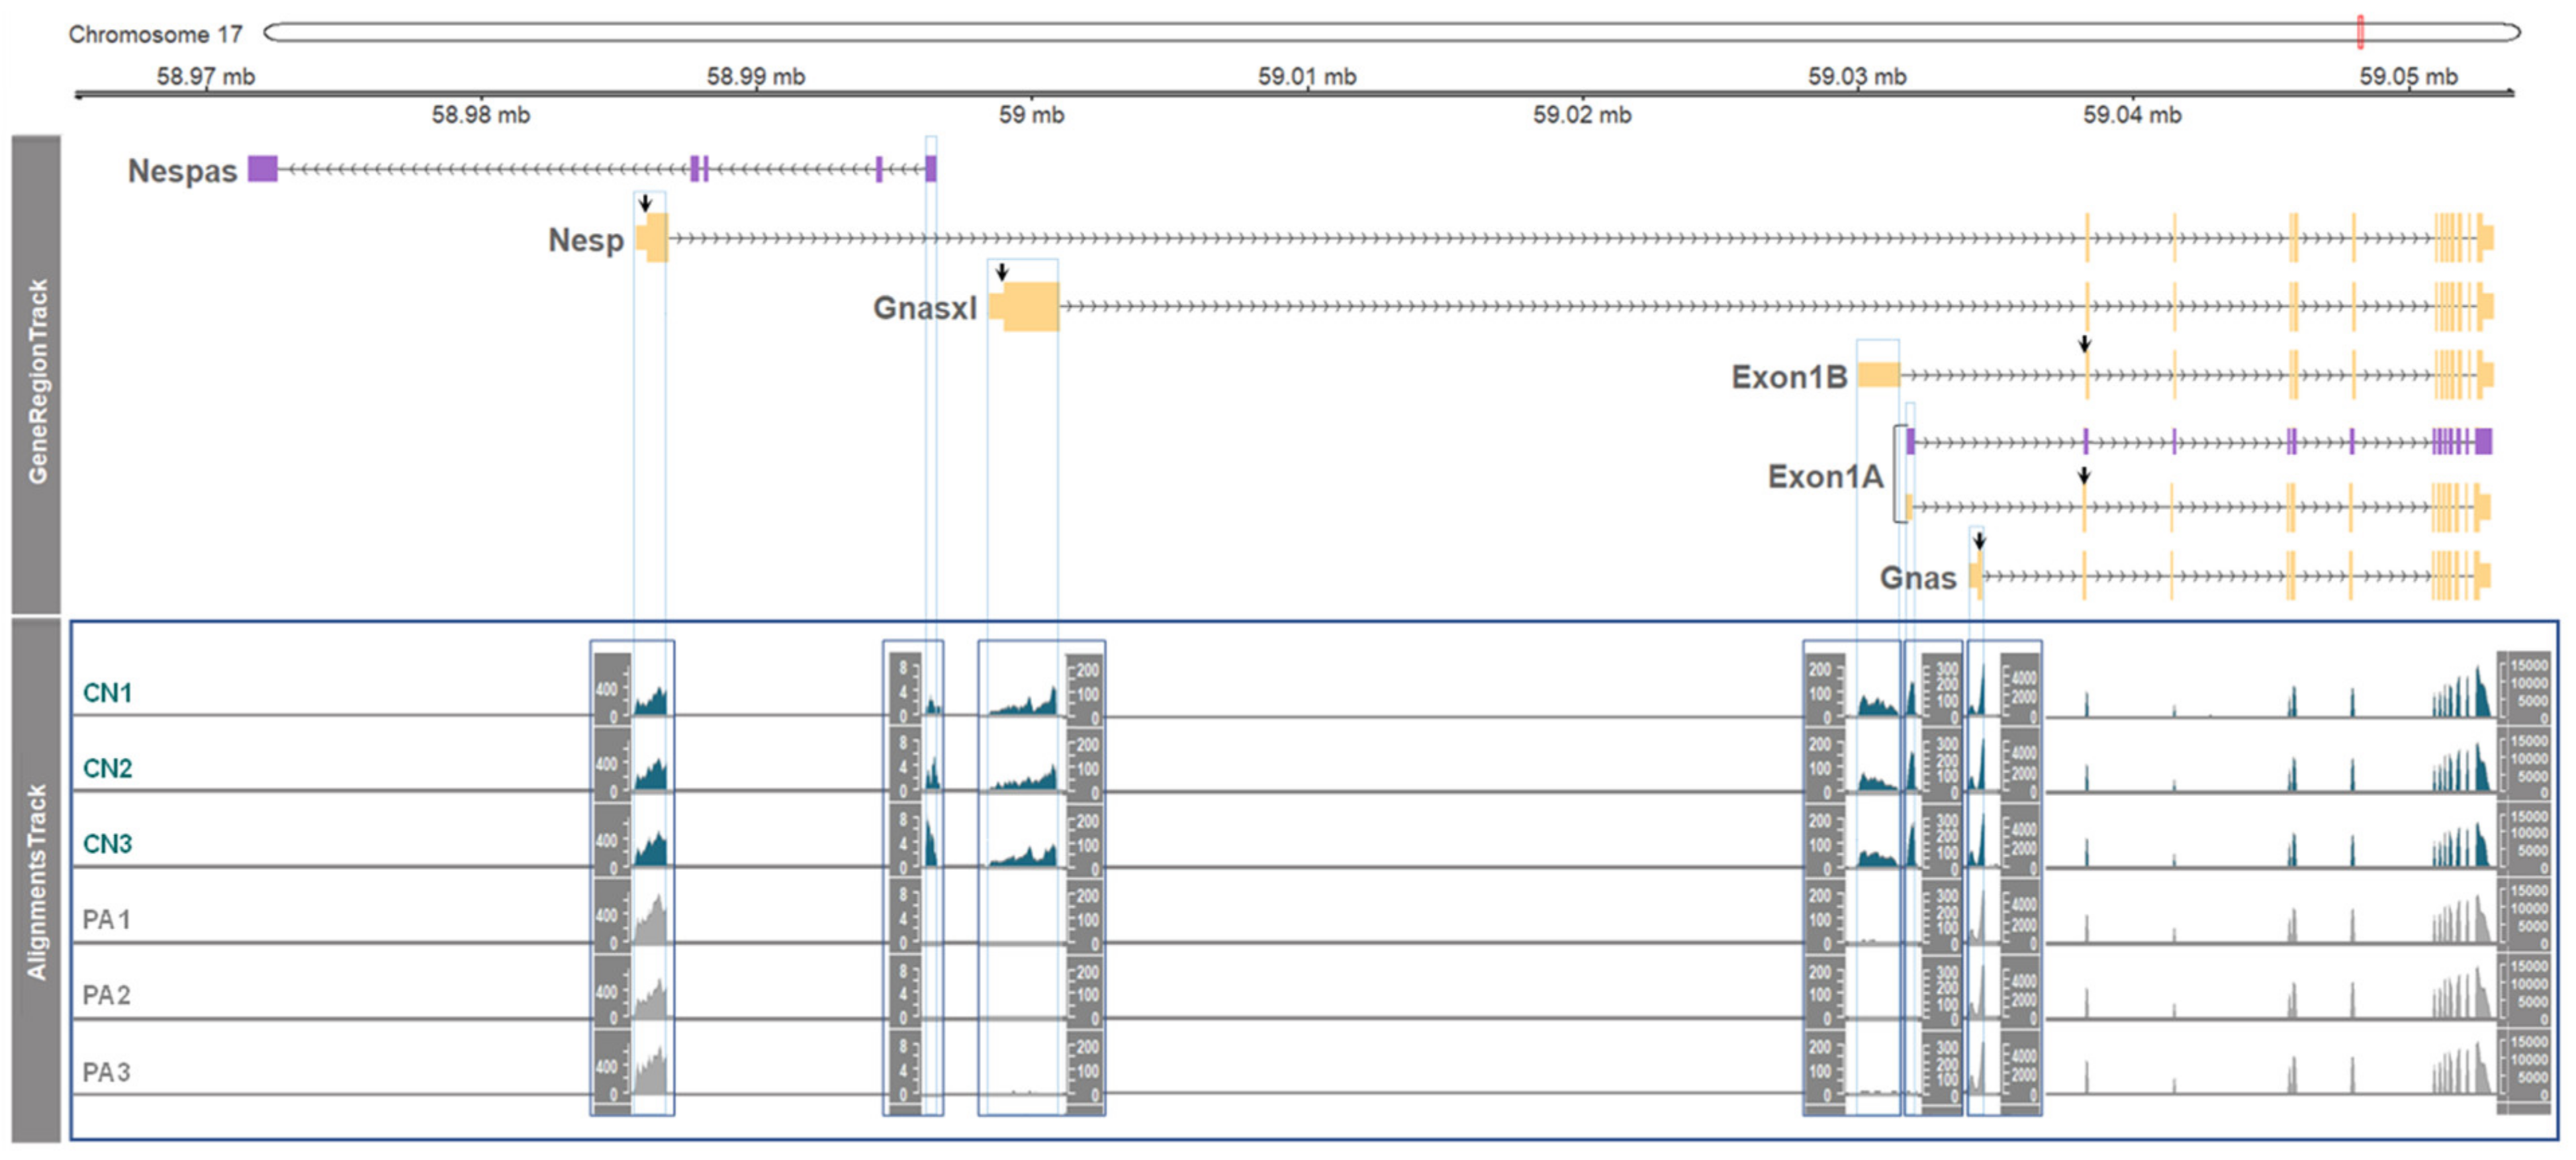
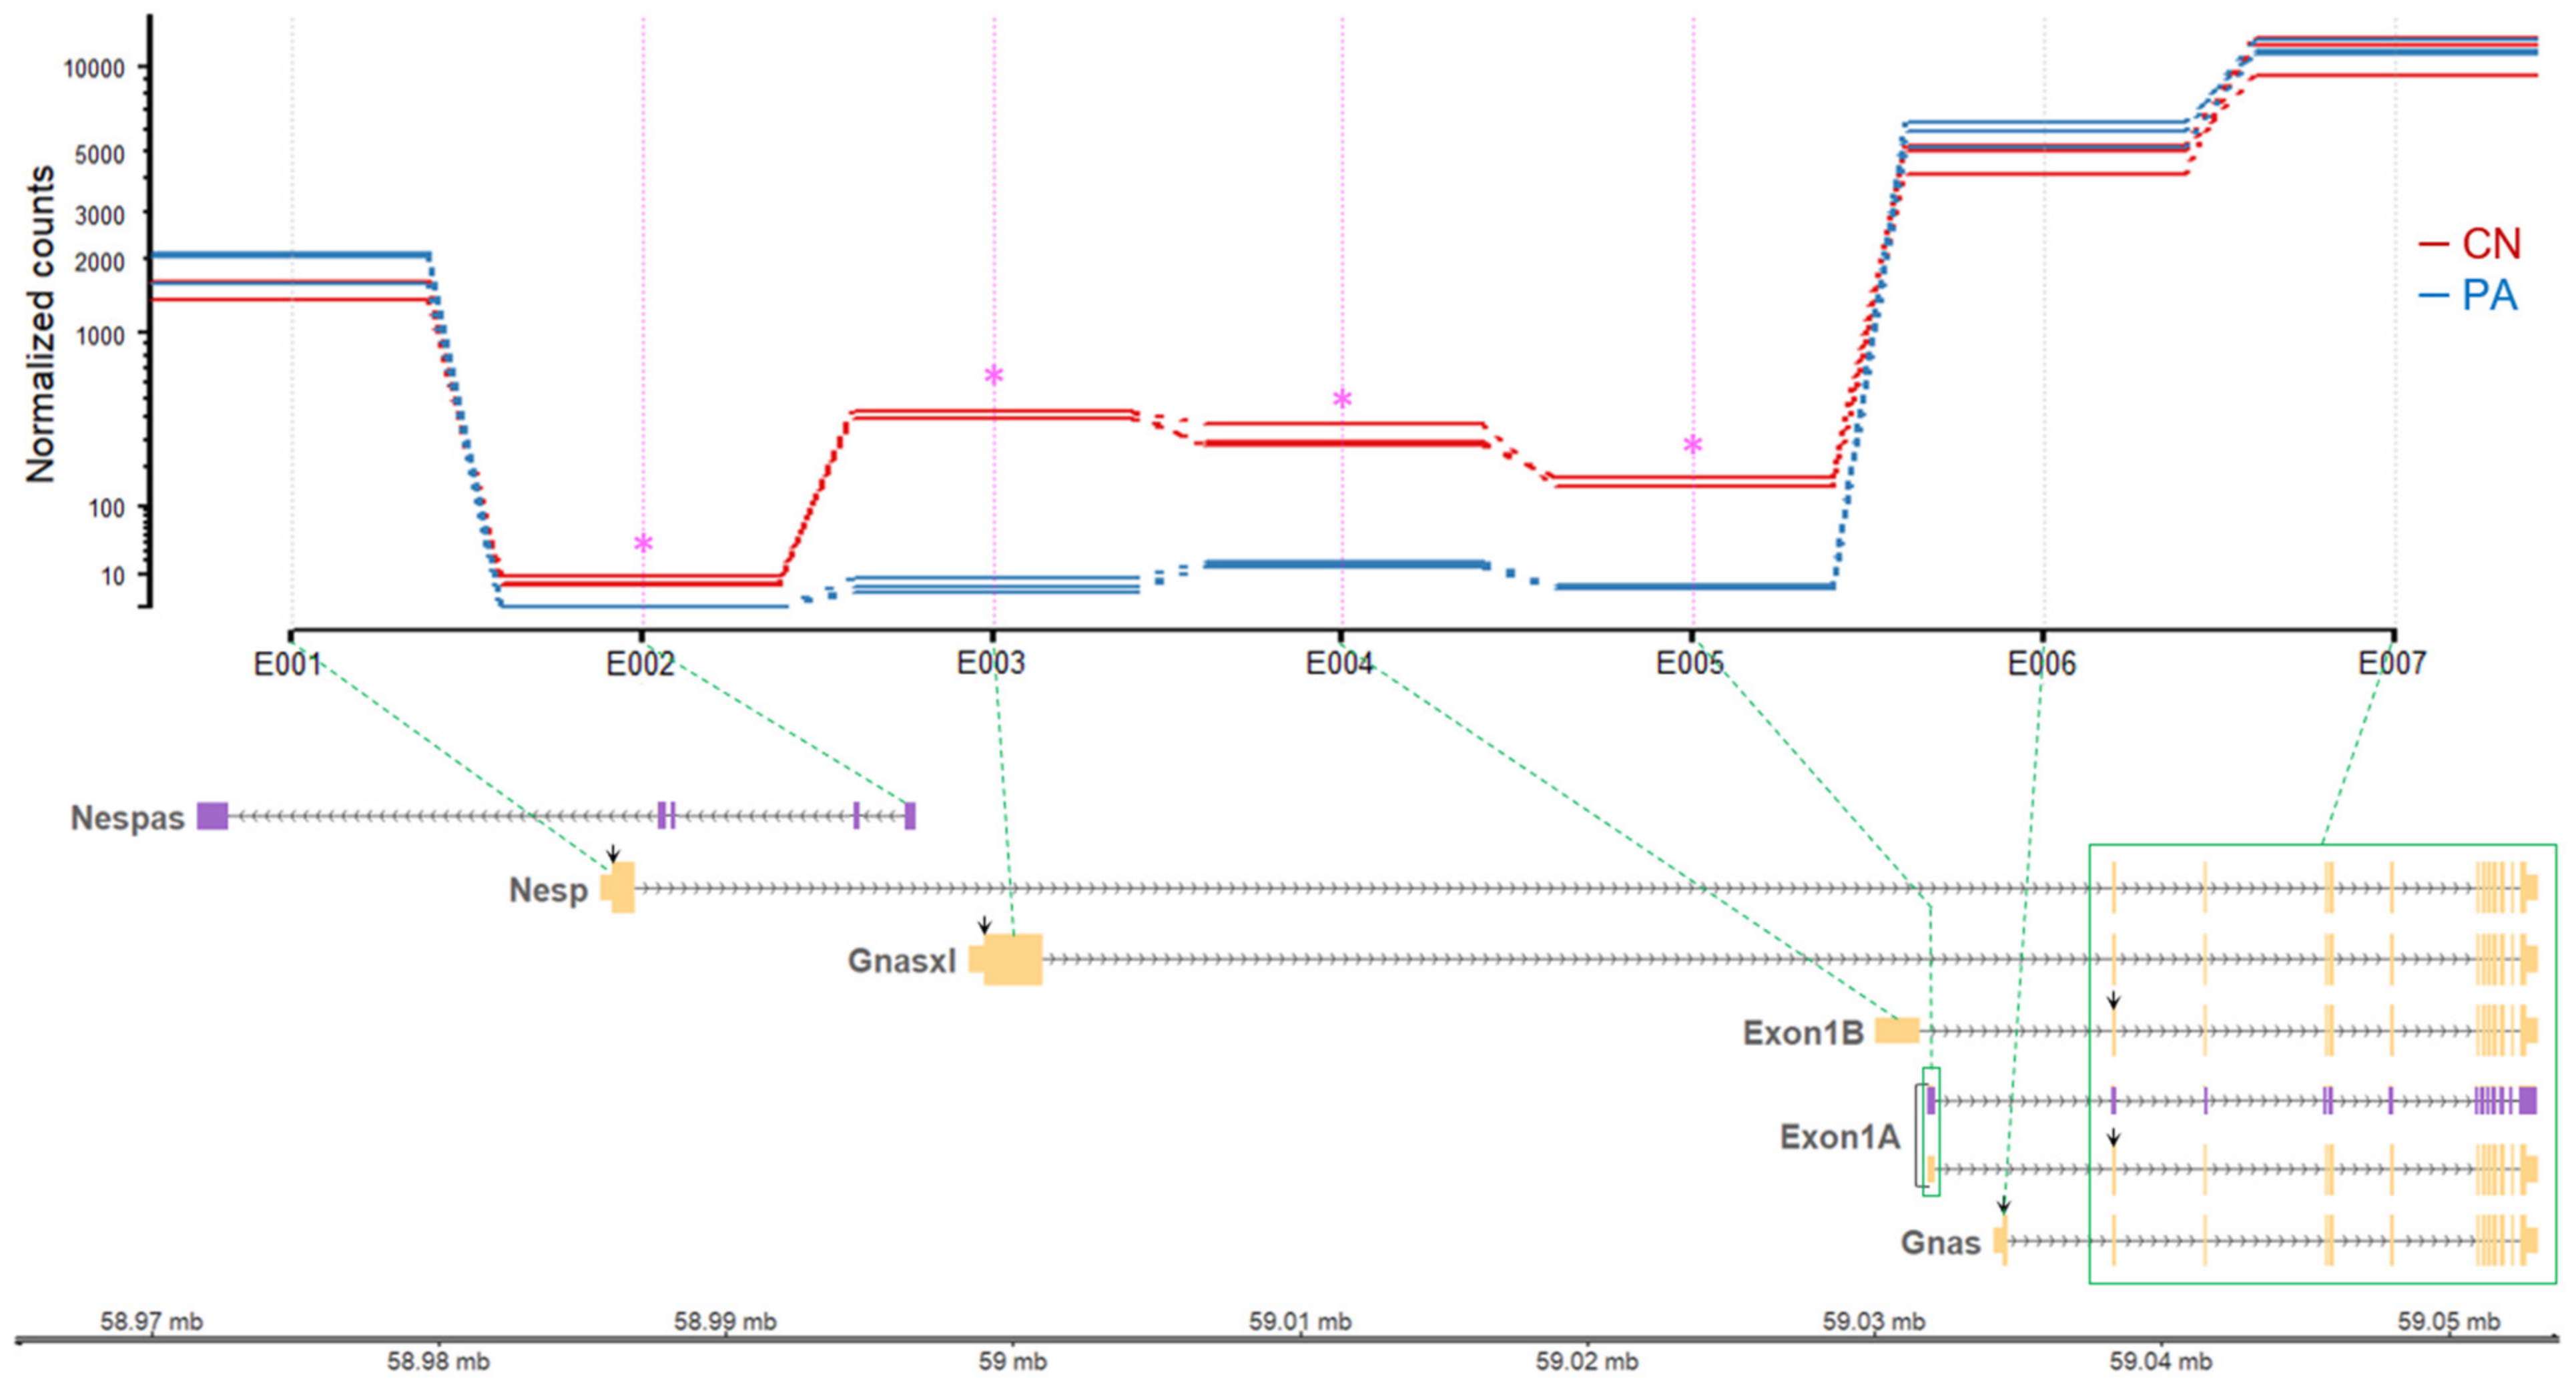
3.2. Paternal or Maternal Gene Expression in the GNAS Locus

Next, expression levels of each transcript from the GNAS locus were examined by RNA-seq. To this end, the read coverage of unique exons (i.e., the non-overlapping first exons as displayed in Figure 1) from the six transcripts was compared. The height and coverage of bars displayed accumulated numbers of reads spanning the indicated exons of each transcript (Figure 2). As visualized, there were three patterns: paternal expression (as the expression occurred only in CN of Nespas, Gnasxl, Exon1B, and Exon 1A), maternal expression (as the level of expression in PA with two copies of maternal alleles was approximately two-fold higher in Nesp compared to CN with one maternal allele) and biallelical expression (as the level of expression in CN and PA was equivalent in Gnas and shared 2nd–13th exons).
To validate these expression patterns, differentially expressed exonic regions were screened using the DEXSeq package [18]. In the GNAS locus, four significant differential exonic regions were found which are corresponding to the 1st exons of Nespas, Gnasxl, Exon1B, and Exon 1A (Table 1 and Figure 3). All of those four exons showed significantly higher expression in CN, indicating paternal expression of the corresponding transcripts containing those four exons. In addition, the expression of the 1st exon of Nesp tended to increase in PA although it was statistically nonsignificant, suggesting higher expression of the corresponding Nesp transcript in maternal alleles (Table 1 and Figure 3). The exonic regions corresponding to the 1st exon of Gnas and other exonic regions toward the 3ʹ end did not show difference between CN and PA, indicating biallelic expression (Table 1). As shown in Figure 3, the expression of Gnas transcript in both CN and PA was substantially higher than other transcripts, as the number of normalized counts mapped to the 1st exon of Gnas was more than 3-fold higher compared to the 1st exon of Nesp and at least 48-fold higher on average than other 1st exons.

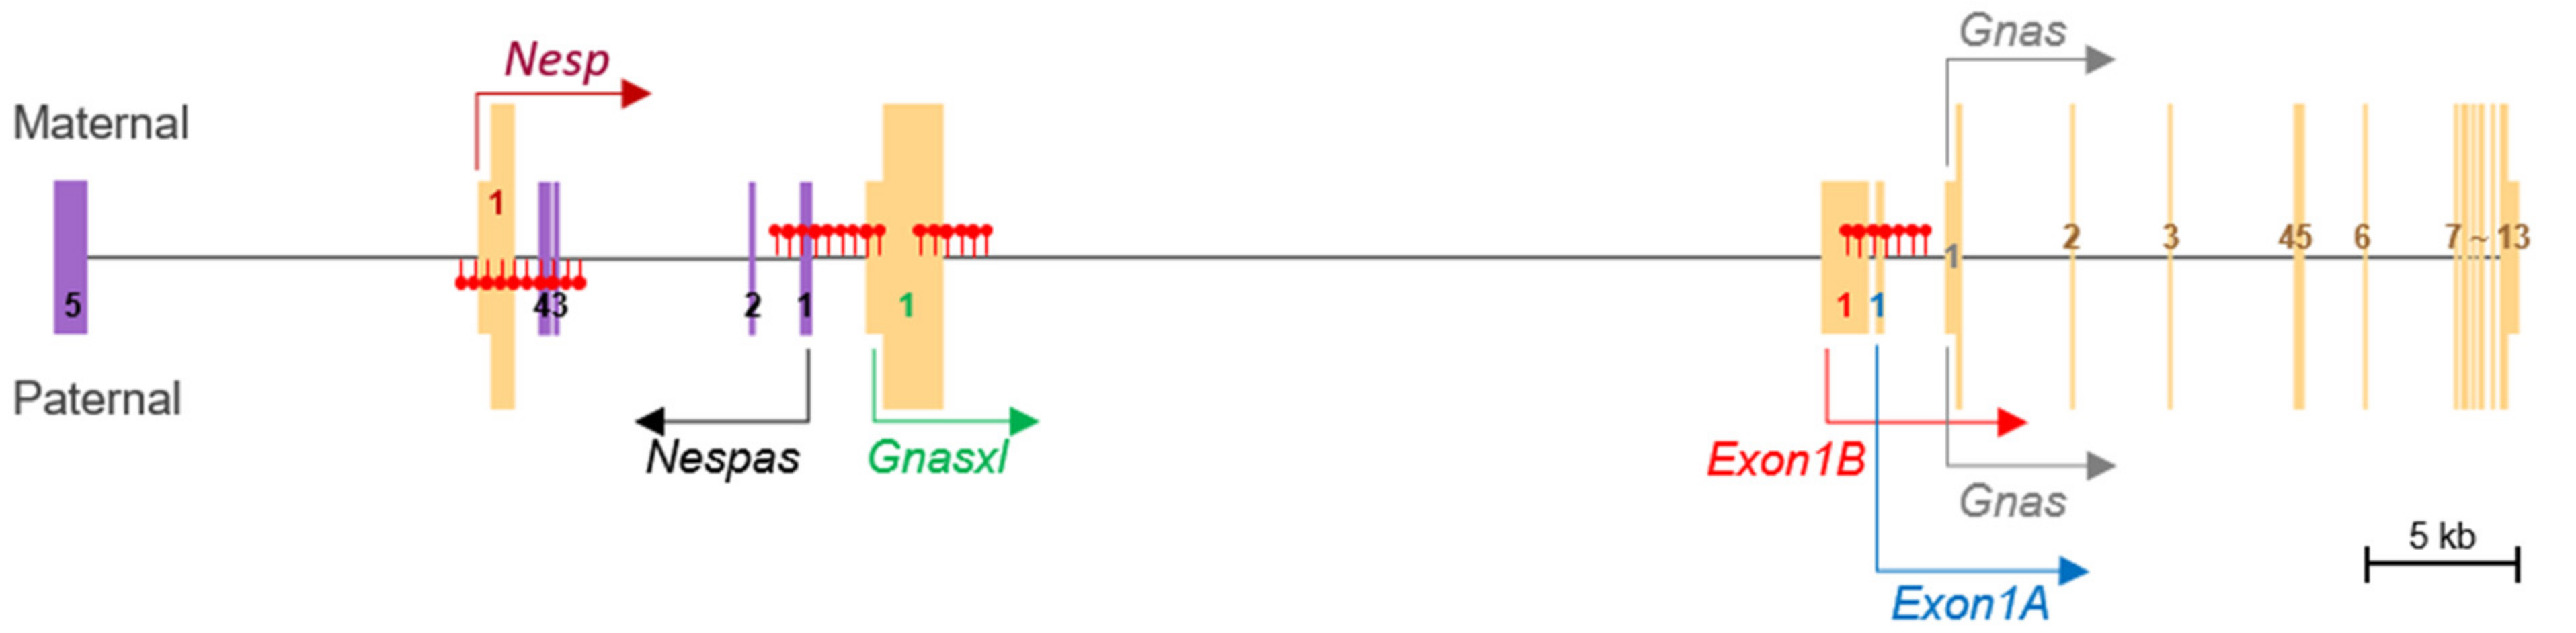
3.3. DNA Methylation and Allele-Specific Expression in the Porcine GNAS Locus Showed a Conserved Pattern

Overall, DNA methylation and maternal, paternal, and biallelical expression patterns of transcripts were conserved between humans and pigs. The three expression patterns, along with differentially methylated regions, were summarized and depicted (Figure 4). In addition, biallelical expression of the upstream STX16 gene (approx. 120 kb upstream of Nespas), which contains a regulatory element for the GNAS locus in humans [19,20], was detected, as CN and PA expressed STX16 equivalently (Supplementary Figure S2).

4. Discussion

Here we report a novel imprinted transcript, Exon1B, in the GNAS locus of the pigs through methylome and transcriptome analyses on parthenogenetic fetuses. In addition, our findings on parental-origin-specific methylation status and exon-based transcription patterns emphasized the adequacy of the animal model and subsequent evaluating strategies for imprinting in a genomic context. Therefore, subsequent studies may employ this approach to reveal parental origin-specific imprinting landscape, through examining expression of particular imprinted transcripts by unique exons when multiple overlapping exonic regions are present. For imprinting research, uniparental embryos and placenta having solely maternal or paternal genome have been generated using reproductive technologies and are useful models to discover the roles of imprinted genes [21,22]. Our generation of parthenogenetic porcine fetuses, combining whole genome bisulfite sequencing and RNA sequencing of each individual in control and parthenote groups, further decreased genetic variations that could affect gene expression patterns independent from genomic imprinting status.
The GNAS locus produces various transcripts due mainly to alternative promoter usage in humans, mice, and pigs [23,24] (Supplementary Figure S1). Among those transcripts are five major transcripts (Nesp, Gnasxl, Exon1B, Exon 1A, and Gnas) and one antisense transcript (Nespas). Mutations and/or epigenetic changes in the Gnas transcript are implicated in pseudohypoparathyroidism (PHP) which is characterized by resistance to parathyroid hormone (PTH) and developmental abnormalities [25]. Noticeably, symptomatic differences are present between maternal and paternal mutations of Gnas, where maternal mutations are further related to obesity and neurocognitive defects [25]. On the other hand, regarding epigenetic state, the promoter and first exon of mouse Gnas were reported to be non-methylated on either paternal or maternal allele, indicating biallelical expression of the Gnas transcript [26]. Thus, the Exon1A germline DMR (gDMR) reported in the upstream region of Gnas transcript (approximately from positions −3400 to −939 relative to the Gnas transcription start site) on the maternal allele might not affect the Gnas transcript in most mouse tissues, leading to biallelical Gnas expression (reviewed in [27]). Exceptionally, in some tissues, allele-specific imprinting patterns of Gnas also exist (e.g., maternal allele-specific expression of Gsα in renal proximal tubules, white adipose tissue, brown adipose tissue, and a specific brain region such as the paraventricular nucleus of the hypothalamus (PVN)) [28,29]. It was further shown, in a tissue in which exceptional maternal allele-specific expression of Gnas occurs, that depletion of the Exon1A gDMR on a paternal allele gave rise to derepression of Gnas on a paternal allele and subsequent biallelical Gnas expression [30], indicating the additional role of Exon1A gDMR on the Gnas transcript in particular tissues besides its effect on the Exon1A transcript in most tissues. In our study on whole porcine fetuses, the Exon1B-Exon1A DMR located approximately from positions ‒3663 to ‒921 relative to the Gnas transcriptional start site (Figure 1). This 921-bp-gap between the Exon1B-Exon1A DMR and the porcine Gnas transcription start site and non-methylation of the promoter of Gnas which lies in the gap are probable causes of non-imprinting status of the Gnas transcript in porcine fetuses as shown in its biallelical expression (Figure 2 and Figure 3, and Table 1).
Rather, maternal hypermethylation at this Exon1B-Exon1A DMR might affect the promoter and first exon of Exon1A and Exon 1B transcripts due to the proximity, and subsequent paternal expression of those transcripts was confirmed by transcriptome analysis in this study. Furthermore, consistent with previous mouse and human studies [24,26], the Nespas-Gnasxl gDMR and Nesp DMR were identified in the vicinity of the promoters and first exons of each of those transcripts. In mouse studies, depletion of the Nespas-Gnasxl gDMR on paternal allele led to deregulation of all transcription in the locus and a loss of Nesp DMR which is a secondary DMR that is normally established during early embryogenesis [31]. In our porcine study, the paternal expression patterns of Nespas and Gnasxl transcripts might be due to maternal hypermethylation at the Nespas-Gnasxl gDMR, and paternal hypermethylation at the Nesp DMR might further resulted in a tendency to maternal expression of the Nesp transcript. Of note, as mentioned in Introduction, opposing phenotypes derived from deficiency of the paternally expressed Gnasxl (leanness) and maternal depletion of Gnas (obesity) [5,6,7] imply essential roles of those transcripts in the regulation of metabolic states. In the pigs, their roles on the performance traits will need to be investigated while considering a substantial expression difference between Gnasxl and Gnas transcripts (Figure 3). Nespas, also named Gnas-as1, is a paternally expressed macro noncoding RNA (ncRNA) transcript (~1.5 kb) which runs antisense to Nesp [24]. Besides DNA methylation, long or macro ncRNAs also regulate imprinted gene clusters [32]. However, in our study, the absolute amount of Nespas transcript was very limited in the porcine fetuses, although its differential expression between PA and CN was detected (Table 1). In this sense, the paternal methylation in Nesp DMR, instead of paternal expression of Nespas, was probably the main cause of maternal, or paternally down-regulated, expression of Nesp.
In addition, it has been reported that the biallelically expressed upstream STX16 gene consists of cis-acting regulatory element for the GNAS locus, such that maternally inherited microdeletion in around exon 4 of the STX16 gene led to a loss of methylation at the Exon1A DMR (approx. 220 kb downstream of the STX16 exon 4) and biallelical Exon1A expression which are associated with autosomal-dominant PHP type Ib (AD-PHP1B) [19,20]. In the pigs, the distance between exon 4 of STX16 and Exon1B-Exon1A DMR is shorter (approx. 175 kb), but according to our literature search there was no report on maternally inherited microdeletion in the porcine STX16 gene that reduced methylation at Exon1B-Exon1A DMR. In our PA model (i.e., a model of maternal uniparental disomy, or UPD), bimaternal expression of STX16, did not affect the methylation status and expression of Exon1A as well as Exon1B. Furthermore, in comparison with other UPD-related imprinted loci that are significantly associated with genetic diseases [33,34], the overall effect of maternal UPD on the GNAS locus might not be substantial, because of biallelical expression of the predominant Gnas transcript and lower amounts of other parental-origin-specific transcripts (i.e., Nesp, Nespas, Gnasxl, Exon1B, and Exon 1A). One limitation of the current study was that the tissue- or region-specific imprinting status mentioned above could not be examined because whole fetuses were sampled for the analysis due to their small size.
Taken together, the parthenogenetic fetuses were used as a model to explore the imprinting status of the porcine GNAS locus. Our results indicated that the GNAS locus produces paternally expressed Nespas, Gnasxl, Exon1B, Exon 1A, maternally expressed Nesp, and biallelically expressed Gnas in the pig fetus. Our findings also include identification of three DMRs, which are ICRs of the GNAS locus: paternally methylated Nesp DMR, and maternally methylated Nespas-Gnasxl DMR and Exon1B–Exon1A DMR. Overall, this study provided an efficient strategy of identifying imprinted genes or transcripts for future studies.

Supplementary Materials

The following are available online at https://0-www-mdpi-com.brum.beds.ac.uk/2073-4425/11/1/96/s1, Supplementary Figure S1: Alternative promoter usages and subsequently generated splicing isoforms in the porcine GNAS complex locus. Supplementary Figure S2: Transcriptome and methylome profiling of the upstream region of the GNAS complex locus. Supplementary Table S1: Whole genome bisulfite sequencing (WGBS) data containing methylation ratio. Supplementary Table S2: Differentially methylated region (DMR) called by the metilene software. Supplementary Table S3: Analysis of differential exon usage (DEU) by the DEXSeq program.

Author Contributions

Conceptualization, K.L. and S.H.; methodology, J.A.; software, J.A.; validation, J.A. and H.W.; formal analysis, J.A.; investigation, J.A., H.W., J.L., and D.Y.; resources, I.-S.H., J.-S.A., and J.-W.L.; writing—original draft preparation, J.A. and H.W.; writing—review and editing, J.A. and K.L.; visualization, J.A.; supervision, S.H. and K.L.; funding acquisition, H.W., S.H., and K.L. All authors have read and agreed to the published version of the manuscript.

Funding

This work was partially supported by the United States Department of Agriculture National Institute of Food and Agriculture Hatch Grant (Project No. OHO01304), National Natural Science Foundation of China (Grant No.31660648), the Priority Academic Program Development of Jiangsu Higher Education Institutions (PAPD), and Animal Science & Technology Development (PJ01319002) from Rural Development Administration, Republic of Korea.

Acknowledgments

We are grateful to Michelle Milligan for her invaluable assistance by proofreading of this manuscript.

Conflicts of Interest

The authors declare no conflict of interest.

References

  1. Reik, W.; Walter, J. Genomic imprinting: Parental influence on the genome. Nat. Rev. Genet. 2001, 2, 21–32. [Google Scholar] [CrossRef]
  2. Portela, A.; Esteller, M. Epigenetic modifications and human disease. Nat. Biotechnol. 2010, 28, 1057–1068. [Google Scholar] [CrossRef]
  3. Babak, T.; DeVeale, B.; Tsang, E.K.; Zhou, Y.; Li, X.; Smith, K.S.; Kukurba, K.R.; Zhang, R.; Li, J.B.; van der Kooy, D.; et al. Genetic conflict reflected in tissue-specific maps of genomic imprinting in human and mouse. Nat. Genet. 2015, 47, 544–549. [Google Scholar] [CrossRef] [Green Version]
  4. Babak, T.; Deveale, B.; Armour, C.; Raymond, C.; Cleary, M.A.; van der Kooy, D.; Johnson, J.M.; Lim, L.P. Global survey of genomic imprinting by transcriptome sequencing. Curr. Biol. 2008, 18, 1735–1741. [Google Scholar] [CrossRef] [Green Version]
  5. Plagge, A.; Gordon, E.; Dean, W.; Boiani, R.; Cinti, S.; Peters, J.; Kelsey, G. The imprinted signaling protein XL alpha s is required for postnatal adaptation to feeding. Nat. Genet. 2004, 36, 818–826. [Google Scholar] [CrossRef]
  6. Chen, M.; Gavrilova, O.; Liu, J.; Xie, T.; Deng, C.; Nguyen, A.T.; Nackers, L.M.; Lorenzo, J.; Shen, L.; Weinstein, L.S. Alternative Gnas gene products have opposite effects on glucose and lipid metabolism. Proc. Natl. Acad. Sci. USA 2005, 102, 7386–7391. [Google Scholar] [CrossRef] [PubMed] [Green Version]
  7. Xie, T.; Plagge, A.; Gavrilova, O.; Pack, S.; Jou, W.; Lai, E.W.; Frontera, M.; Kelsey, G.; Weinstein, L.S. The alternative stimulatory G protein alpha-subunit XLalphas is a critical regulator of energy and glucose metabolism and sympathetic nerve activity in adult mice. J. Biol. Chem. 2006, 281, 18989–18999. [Google Scholar] [CrossRef] [PubMed] [Green Version]
  8. Neugebauer, N.; Luther, H.; Reinsch, N. Parent-of-origin effects cause genetic variation in pig performance traits. Animal 2010, 4, 672–681. [Google Scholar] [CrossRef] [Green Version]
  9. Tian, X.C. Genomic imprinting in farm animals. Annu. Rev. Anim. Biosci. 2014, 2, 23–40. [Google Scholar] [CrossRef]
  10. Hayward, B.E.; Moran, V.; Strain, L.; Bonthron, D.T. Bidirectional imprinting of a single gene: GNAS1 encodes maternally, paternally, and biallelically derived proteins. Proc. Natl. Acad. Sci. USA 1998, 95, 15475–15480. [Google Scholar] [CrossRef] [Green Version]
  11. Oczkowicz, M.; Piestrzyńska-Kajtoch, A.; Ropka-Molik, K.; Rejduch, B.; Eckert, R. Expression and imprinting analysis of the NESP55 gene in pigs. Gene Expr. Patterns 2012, 12, 18–23. [Google Scholar] [CrossRef]
  12. Kwon, D.J.; Kim, D.H.; Hwang, I.S.; Kim, D.E.; Kim, H.J.; Kim, J.S.; Lee, K.; Im, G.S.; Lee, J.W.; Hwang, S. Generation of alpha-1,3-galactosyltransferase knocked-out transgenic cloned pigs with knocked-in five human genes. Transgenic Res. 2017, 26, 153–163. [Google Scholar] [CrossRef] [PubMed] [Green Version]
  13. Thurston, A.; Taylor, J.; Gardner, J.; Sinclair, K.D.; Young, L.E. Monoallelic expression of nine imprinted genes in the sheep embryo occurs after the blastocyst stage. Reproduction 2008, 135, 29–40. [Google Scholar] [CrossRef] [PubMed] [Green Version]
  14. Bischoff, S.; Tsai, S.; Hardison, N.; Motsinger-Reif, A.; Freking, B.; Piedrahita, J. Functional genomic approaches for the study of fetal/placental development in swine with special emphasis on imprinted genes. Control Pig Reprod. VIII 2010, 66, 245. [Google Scholar]
  15. Juhling, F.; Kretzmer, H.; Bernhart, S.H.; Otto, C.; Stadler, P.F.; Hoffmann, S. metilene: Fast and sensitive calling of differentially methylated regions from bisulfite sequencing data. Genome Res. 2016, 26, 256–262. [Google Scholar] [CrossRef] [PubMed] [Green Version]
  16. Hahne, F.; Ivanek, R. Visualizing Genomic Data Using Gviz and Bioconductor. Methods Mol. Biol. 2016, 1418, 335–351. [Google Scholar] [CrossRef]
  17. Kim, D.; Langmead, B.; Salzberg, S.L. HISAT: A fast spliced aligner with low memory requirements. Nat. Methods 2015, 12, 357–360. [Google Scholar] [CrossRef] [Green Version]
  18. Anders, S.; Reyes, A.; Huber, W. Detecting differential usage of exons from RNA-seq data. Genome Res. 2012, 22, 2008–2017. [Google Scholar] [CrossRef]
  19. Linglart, A.; Gensure, R.C.; Olney, R.C.; Juppner, H.; Bastepe, M. A novel STX16 deletion in autosomal dominant pseudohypoparathyroidism type Ib redefines the boundaries of a cis-acting imprinting control element of GNAS. Am. J. Hum. Genet. 2005, 76, 804–814. [Google Scholar] [CrossRef] [Green Version]
  20. Elli, F.M.; de Sanctis, L.; Peverelli, E.; Bordogna, P.; Pivetta, B.; Miolo, G.; Beck-Peccoz, P.; Spada, A.; Mantovani, G. Autosomal dominant pseudohypoparathyroidism type Ib: A novel inherited deletion ablating STX16 causes loss of imprinting at the A/B DMR. J. Clin. Endocrinol. Metab. 2014, 99, E724–E728. [Google Scholar] [CrossRef] [Green Version]
  21. Hu, M.; TuanMu, L.C.; Wei, H.; Gao, F.; Li, L.; Zhang, S. Development and imprinted gene expression in uniparental preimplantation mouse embryos in vitro. Mol. Biol. Rep. 2015, 42, 345–353. [Google Scholar] [CrossRef] [PubMed]
  22. Arena, R.; Zacchini, F.; Toschi, P.; Palazzese, L.; Czernik, M.; Ptak, G.E. Developmental peculiarities in placentae of ovine uniparental conceptuses. PLoS ONE 2017, 12, e0188278. [Google Scholar] [CrossRef] [PubMed] [Green Version]
  23. Kozasa, T.; Itoh, H.; Tsukamoto, T.; Kaziro, Y. Isolation and characterization of the human Gs alpha gene. Proc. Natl. Acad. Sci. USA 1988, 85, 2081–2085. [Google Scholar] [CrossRef] [Green Version]
  24. Williamson, C.M.; Ball, S.T.; Dawson, C.; Mehta, S.; Beechey, C.V.; Fray, M.; Teboul, L.; Dear, T.N.; Kelsey, G.; Peters, J. Uncoupling antisense-mediated silencing and DNA methylation in the imprinted Gnas cluster. PLoS Genet. 2011, 7, e1001347. [Google Scholar] [CrossRef] [Green Version]
  25. Tafaj, O.; Juppner, H. Pseudohypoparathyroidism: One gene, several syndromes. J. Endocrinol. Invest. 2017, 40, 347–356. [Google Scholar] [CrossRef]
  26. Liu, J.; Yu, S.; Litman, D.; Chen, W.; Weinstein, L.S. Identification of a methylation imprint mark within the mouse Gnas locus. Mol. Cell. Biol. 2000, 20, 5808–5817. [Google Scholar] [CrossRef] [Green Version]
  27. Weinstein, L.S.; Xie, T.; Zhang, Q.H.; Chen, M. Studies of the regulation and function of the Gs alpha gene Gnas using gene targeting technology. Pharmacol. Ther. 2007, 115, 271–291. [Google Scholar] [CrossRef] [Green Version]
  28. Yu, S.; Yu, D.; Lee, E.; Eckhaus, M.; Lee, R.; Corria, Z.; Accili, D.; Westphal, H.; Weinstein, L.S. Variable and tissue-specific hormone resistance in heterotrimeric Gs protein alpha-subunit (Gsalpha) knockout mice is due to tissue-specific imprinting of the gsalpha gene. Proc. Natl. Acad. Sci. USA 1998, 95, 8715–8720. [Google Scholar] [CrossRef] [Green Version]
  29. Chen, M.; Wang, J.; Dickerson, K.E.; Kelleher, J.; Xie, T.; Gupta, D.; Lai, E.W.; Pacak, K.; Gavrilova, O.; Weinstein, L.S. Central nervous system imprinting of the G protein G(s)alpha and its role in metabolic regulation. Cell Metab. 2009, 9, 548–555. [Google Scholar] [CrossRef] [Green Version]
  30. Williamson, C.M.; Ball, S.T.; Nottingham, W.T.; Skinner, J.A.; Plagge, A.; Turner, M.D.; Powles, N.; Hough, T.; Papworth, D.; Fraser, W.D.; et al. A cis-acting control region is required exclusively for the tissue-specific imprinting of Gnas. Nat. Genet. 2004, 36, 894–899. [Google Scholar] [CrossRef]
  31. Williamson, C.M.; Turner, M.D.; Ball, S.T.; Nottingham, W.T.; Glenister, P.; Fray, M.; Tymowska-Lalanne, Z.; Plagge, A.; Powles-Glover, N.; Kelsey, G.; et al. Identification of an imprinting control region affecting the expression of all transcripts in the Gnas cluster. Nat. Genet. 2006, 38, 350–355. [Google Scholar] [CrossRef] [PubMed]
  32. Huang, R.; Jaritz, M.; Guenzl, P.; Vlatkovic, I.; Sommer, A.; Tamir, I.M.; Marks, H.; Klampfl, T.; Kralovics, R.; Stunnenberg, H.G.; et al. An RNA-Seq strategy to detect the complete coding and non-coding transcriptome including full-length imprinted macro ncRNAs. PLoS ONE 2011, 6, e27288. [Google Scholar] [CrossRef] [PubMed]
  33. Ogata, T.; Kagami, M. Kagami-Ogata syndrome: A clinically recognizable upd(14)pat and related disorder affecting the chromosome 14q32.2 imprinted region. J. Hum. Genet 2016, 61, 87–94. [Google Scholar] [CrossRef] [PubMed]
  34. Eggermann, T.; Perez de Nanclares, G.; Maher, E.R.; Temple, I.K.; Tumer, Z.; Monk, D.; Mackay, D.J.; Gronskov, K.; Riccio, A.; Linglart, A.; et al. Imprinting disorders: A group of congenital disorders with overlapping patterns of molecular changes affecting imprinted loci. Clin. Epigenetics 2015, 7, 123. [Google Scholar] [CrossRef] [Green Version]
Figure 1. DNA methylation profiles of the GNAS locus in porcine parthenotes determined by WGBS. The 81.5-kilobase-pair region of GNAS locus on porcine chromosome 17 (chr17:58,971,522 – 59,053,022) is schematically represented in GeneRegionTrack. Six transcripts are indicated by yellow boxes for protein-coding transcripts (tall boxes: coding region; short boxes: noncoding region; black downward arrows: ATG start codon) or by purple boxes for noncoding transcripts, and directions are marked by black horizontal arrows. The transcript information including protein-coding and noncoding was based on the NCBI Gene and Nucleotide databases (https://0-www-ncbi-nlm-nih-gov.brum.beds.ac.uk/ gene and https://0-www-ncbi-nlm-nih-gov.brum.beds.ac.uk/nuccore). From I track to DMR track: CpG islands (I; dark green boxes), GC content (GC %; grey area), mean methylation ratios of parthenotes (PA, blue histogram lines), mean methylation ratios of controls (CN, pink histogram lines), mean methylation differences between PA and AI (PA-AI, green histogram lines), and significant DMRs (DMR, red horizontal bars; FDR < 0.05) are illustrated. A hypomethylated DMR in PA is indicated by a dotted red box, and hypermethylated DMRs in PA are indicated by dotted blue boxes.
Genes 11 00096 g001
Figure 2. Allelic gene expression in unique 1st exons of six transcripts from the GNAS locus. In GeneRegionTrack, the non-overlapping 1st exons are surrounded by blue lines which are extended through AlignmentsTrack. The RNA-seq read coverages (or depths) extracted from BAM files are shown as counts (Y axis) in each AlignmentsTrack of CN (n = 3) and PA (n = 3). The track for shared exons 2–13 (toward the 3’ end) showed the highest coverage as indicated in the Y axis (far right). Due to the difference in the AlignmentsTrack height, separate AlignmentsTracks were generated and enclosed by rectangles.
Genes 11 00096 g002
Figure 3. Differential usage of unique exons from the GNAS locus. The read counts from individual fetus samples were normalized by estimated size factors and presented on the log scale (Y axis). The size factors were estimated by relative sequencing depth. The exon counting bins (E00X; X axis) correspond to the 1st exons of six transcripts and merged shared exons 2 through 13 (a green box) from the GNAS locus. Each exon counting bin and its corresponding exon are linked by green dotted lines. Differential exon usage was tested by the function test for DEU in the DEXSeq package. Shown in pink stars are the exons that showed significant differential exon usage. CN, control; PA, parthenote.
Genes 11 00096 g003
Figure 4. Schematic representation of methylation and expression patterns of the porcine GNAS locus. All transcripts were combined into a single merged transcript. Filled red lollipops denote either paternal or maternal methylation in the corresponding genomic regions. Maternal (Nesp), paternal (Nespas, Gnasxl, Exon1B, and Exon 1A), and biallelical (Gnas) expressions and the direction of transcription are represented. Exon numbers are displayed in unique 1st exons, exons from Nespas (toward the 5’ end), and shared exons (2nd–13th) between transcripts.
Genes 11 00096 g004
Table 1. Analysis of differential exon usage (DEU) in the GNAS locus performed by DEXSeq.
ECB 1Width 2ExonM.N.count 3
(CN)
M.N.count
(PA)
log2fold 4
(PA/CN)
p-Value 5Padjust 6
E0011220Nesp 1st exon1473.00 ± 115.11 b2017.00 ± 176.12 b0.450.180.92
E002350Nespas l 1st exon6.00 ± 1.53 a0.0033 ± 0.0033 a−10.811.59E − 067.32E − 04
E0031972Gnasxl 1st exon402.00 ± 4.04 ab5.00 ± 2.08 a−6.330.00E + 00 70.00E + 00
E0041506Exon1B 1st exon298.00 ± 21.96 ab17.33 ± 1.86 a−4.103.74E − 822.07E − 77
E005205Exon1A 1st exon155.67 ± 11.89 ab3.67 ± 0.67 a−5.416.63E − 844.88E − 79
E006481Gnas 1st exon4621.00 ± 423.42 c6147.67 ± 536.13 c0.410.130.88
E00714,754Shared exons (2nd–13th) 810,757.33 ± 610.78 d12,251.00 ± 568.18 d0.190.811.00
1 Exon counting bin. 2 Width of exon counting bins in base pairs that correspond to exons listed in the 3rd column. 3 Mean of normalized count (M.N.count) which is presented as mean ± SEM. 4 Log 2 fold changes of averaged normalized counts that are mapped to exon counting bins for PA against CN. 5 p-value from the test for differential exon usage conducted by the function testForDEU in the DEXSeq package. 6 Benjamini–Hochberg (BH) adjusted p-value. 7 p-value of 0.00E + 00 represents that the significance was not measurable because it reached a maximum significance set by the program. 8 Shared exons 2 through 13 which were merged into one exon counting bin. Different alphabets a–d in M.N.count colums denote statistical significance at p < 0.05 in one way ANOVA followed by Tukey’s post hoc test.

