Classification of Changes in the Fecal Microbiota Associated with Colonic Adenomatous Polyps Using a Long-Read Sequencing Platform

 ,
,  , , , , and
Abstract
: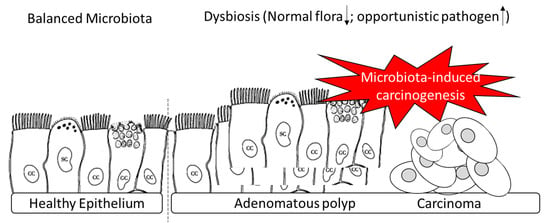
1. Introduction
2. Materials and Methods
2.1. Ethics Statement of Clinical Enrollments
2.2. Bacterial DNA Extraction
2.3. 16S rRNA Gene Sequencing
2.4. Bioinformatic Analysis
2.5. Statistical Analysis
3. Results
3.1. Metadata of Recruited Subjects in This Study
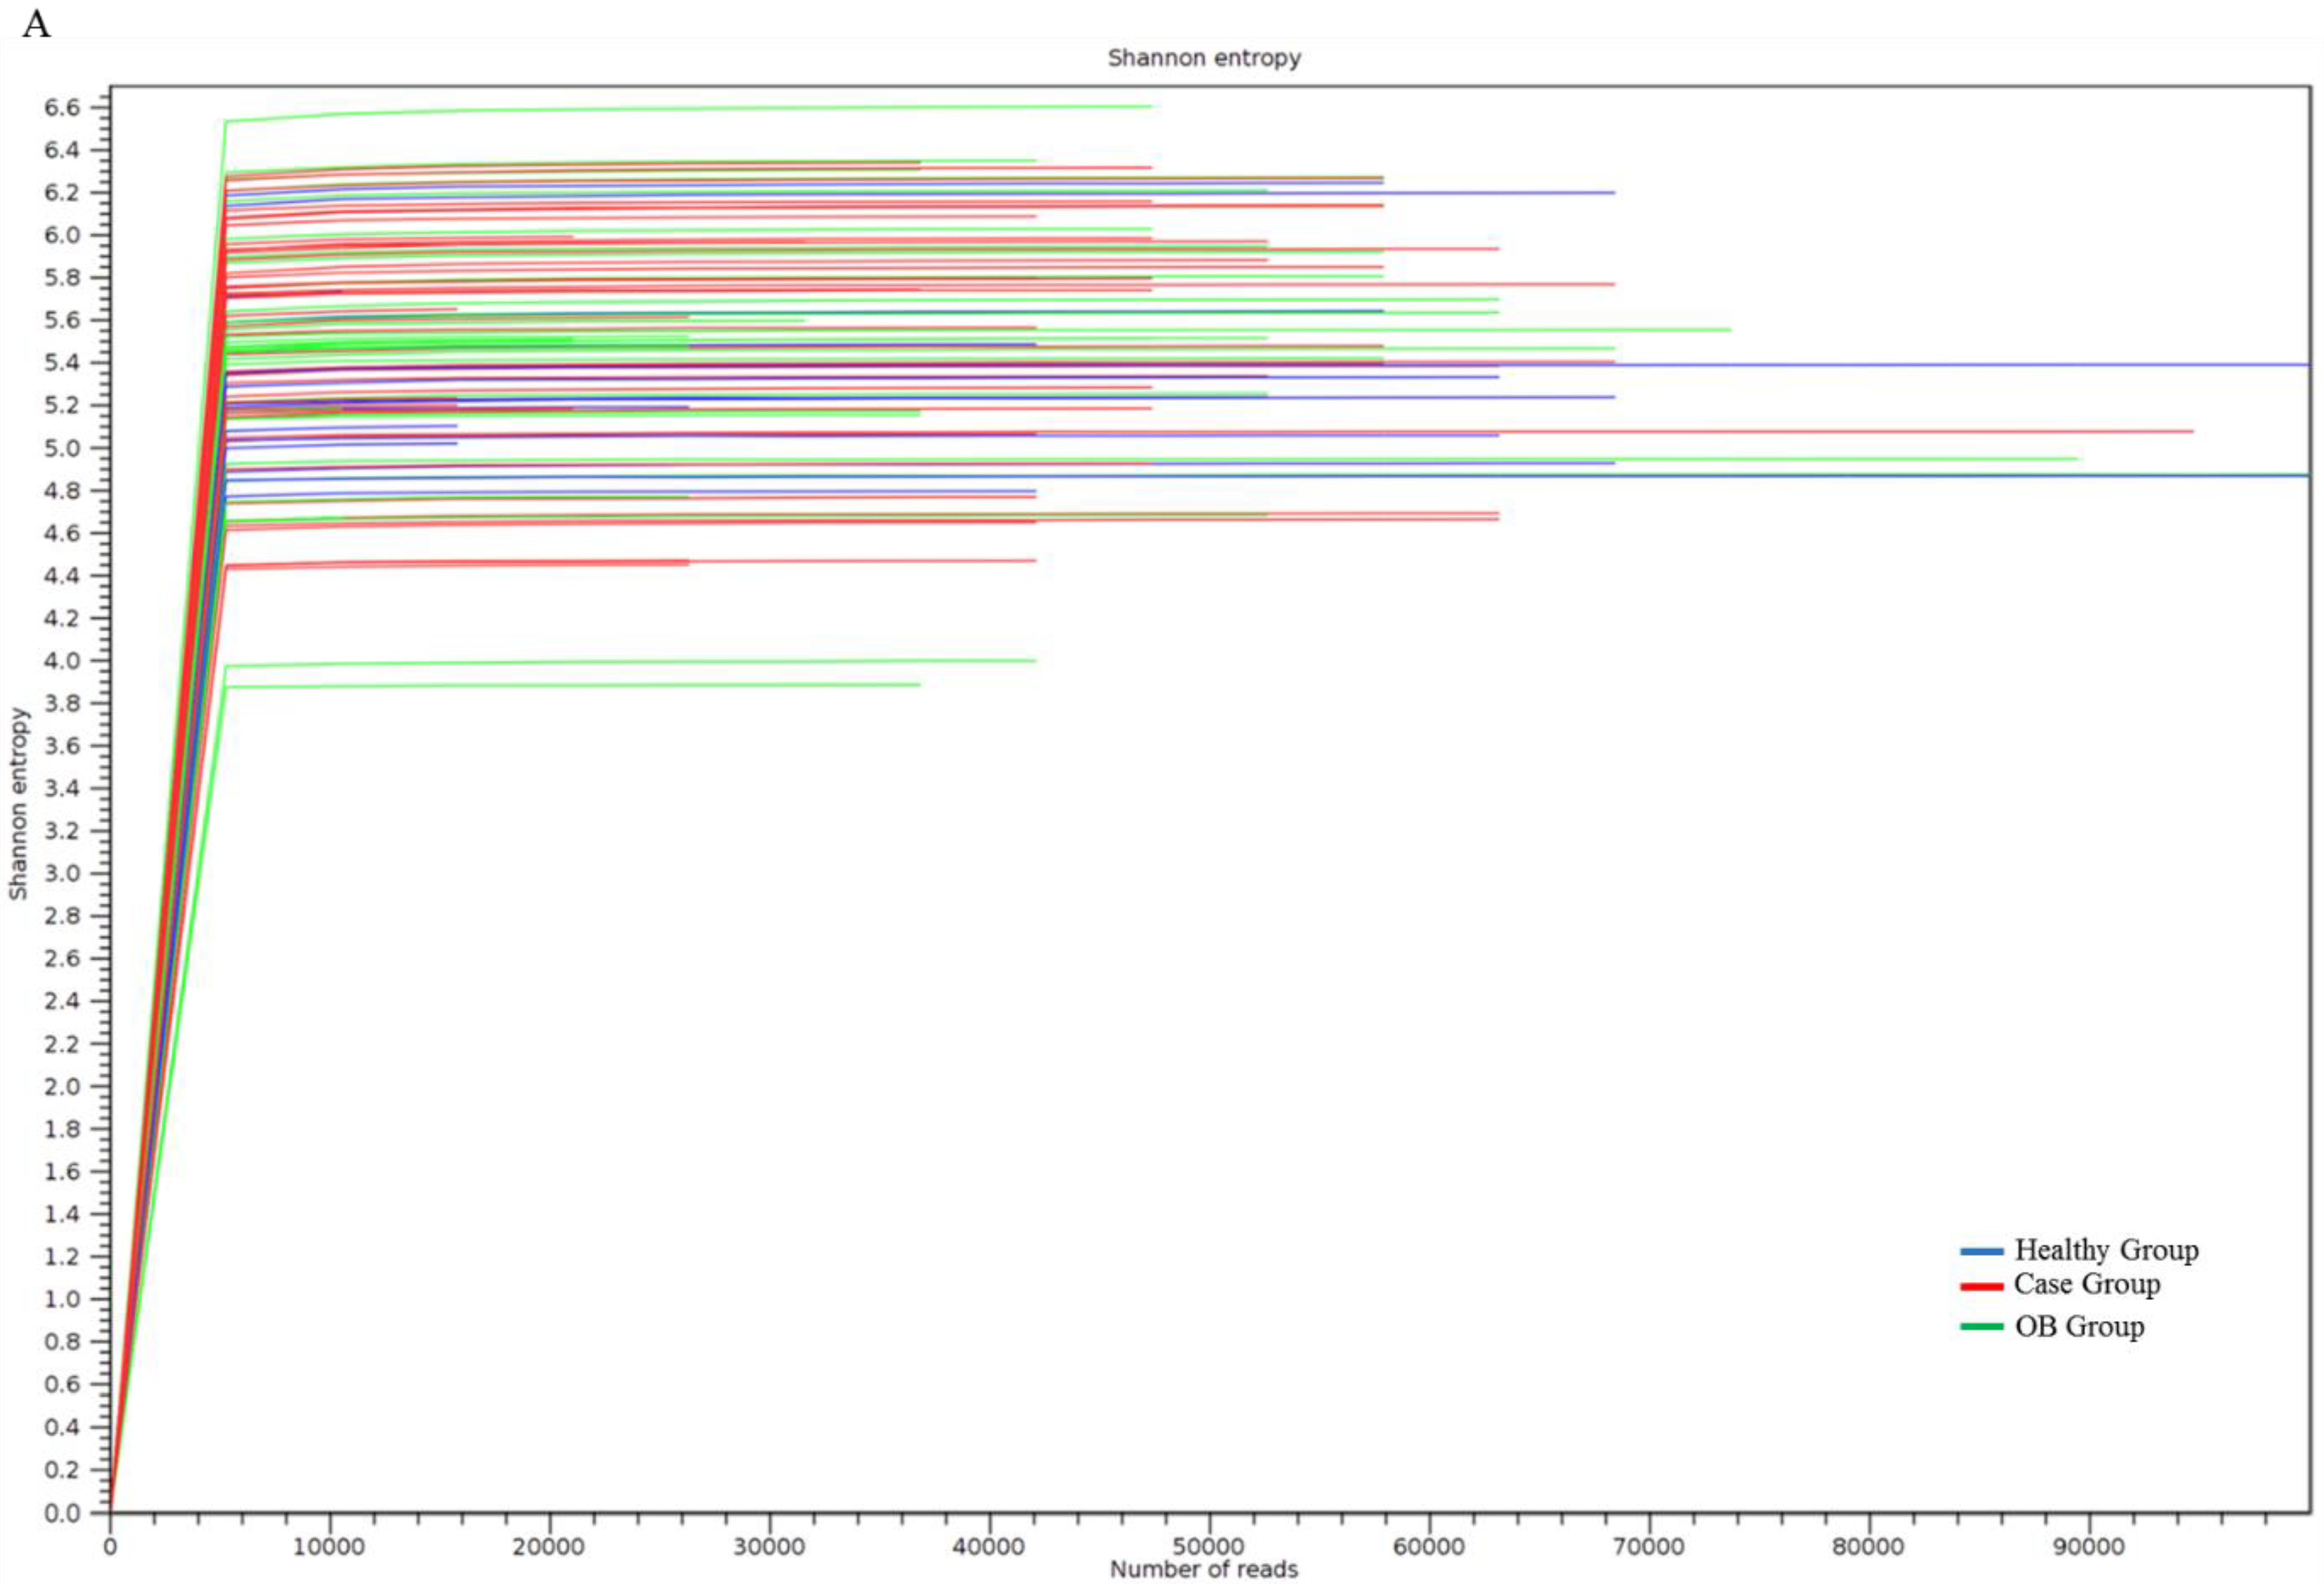
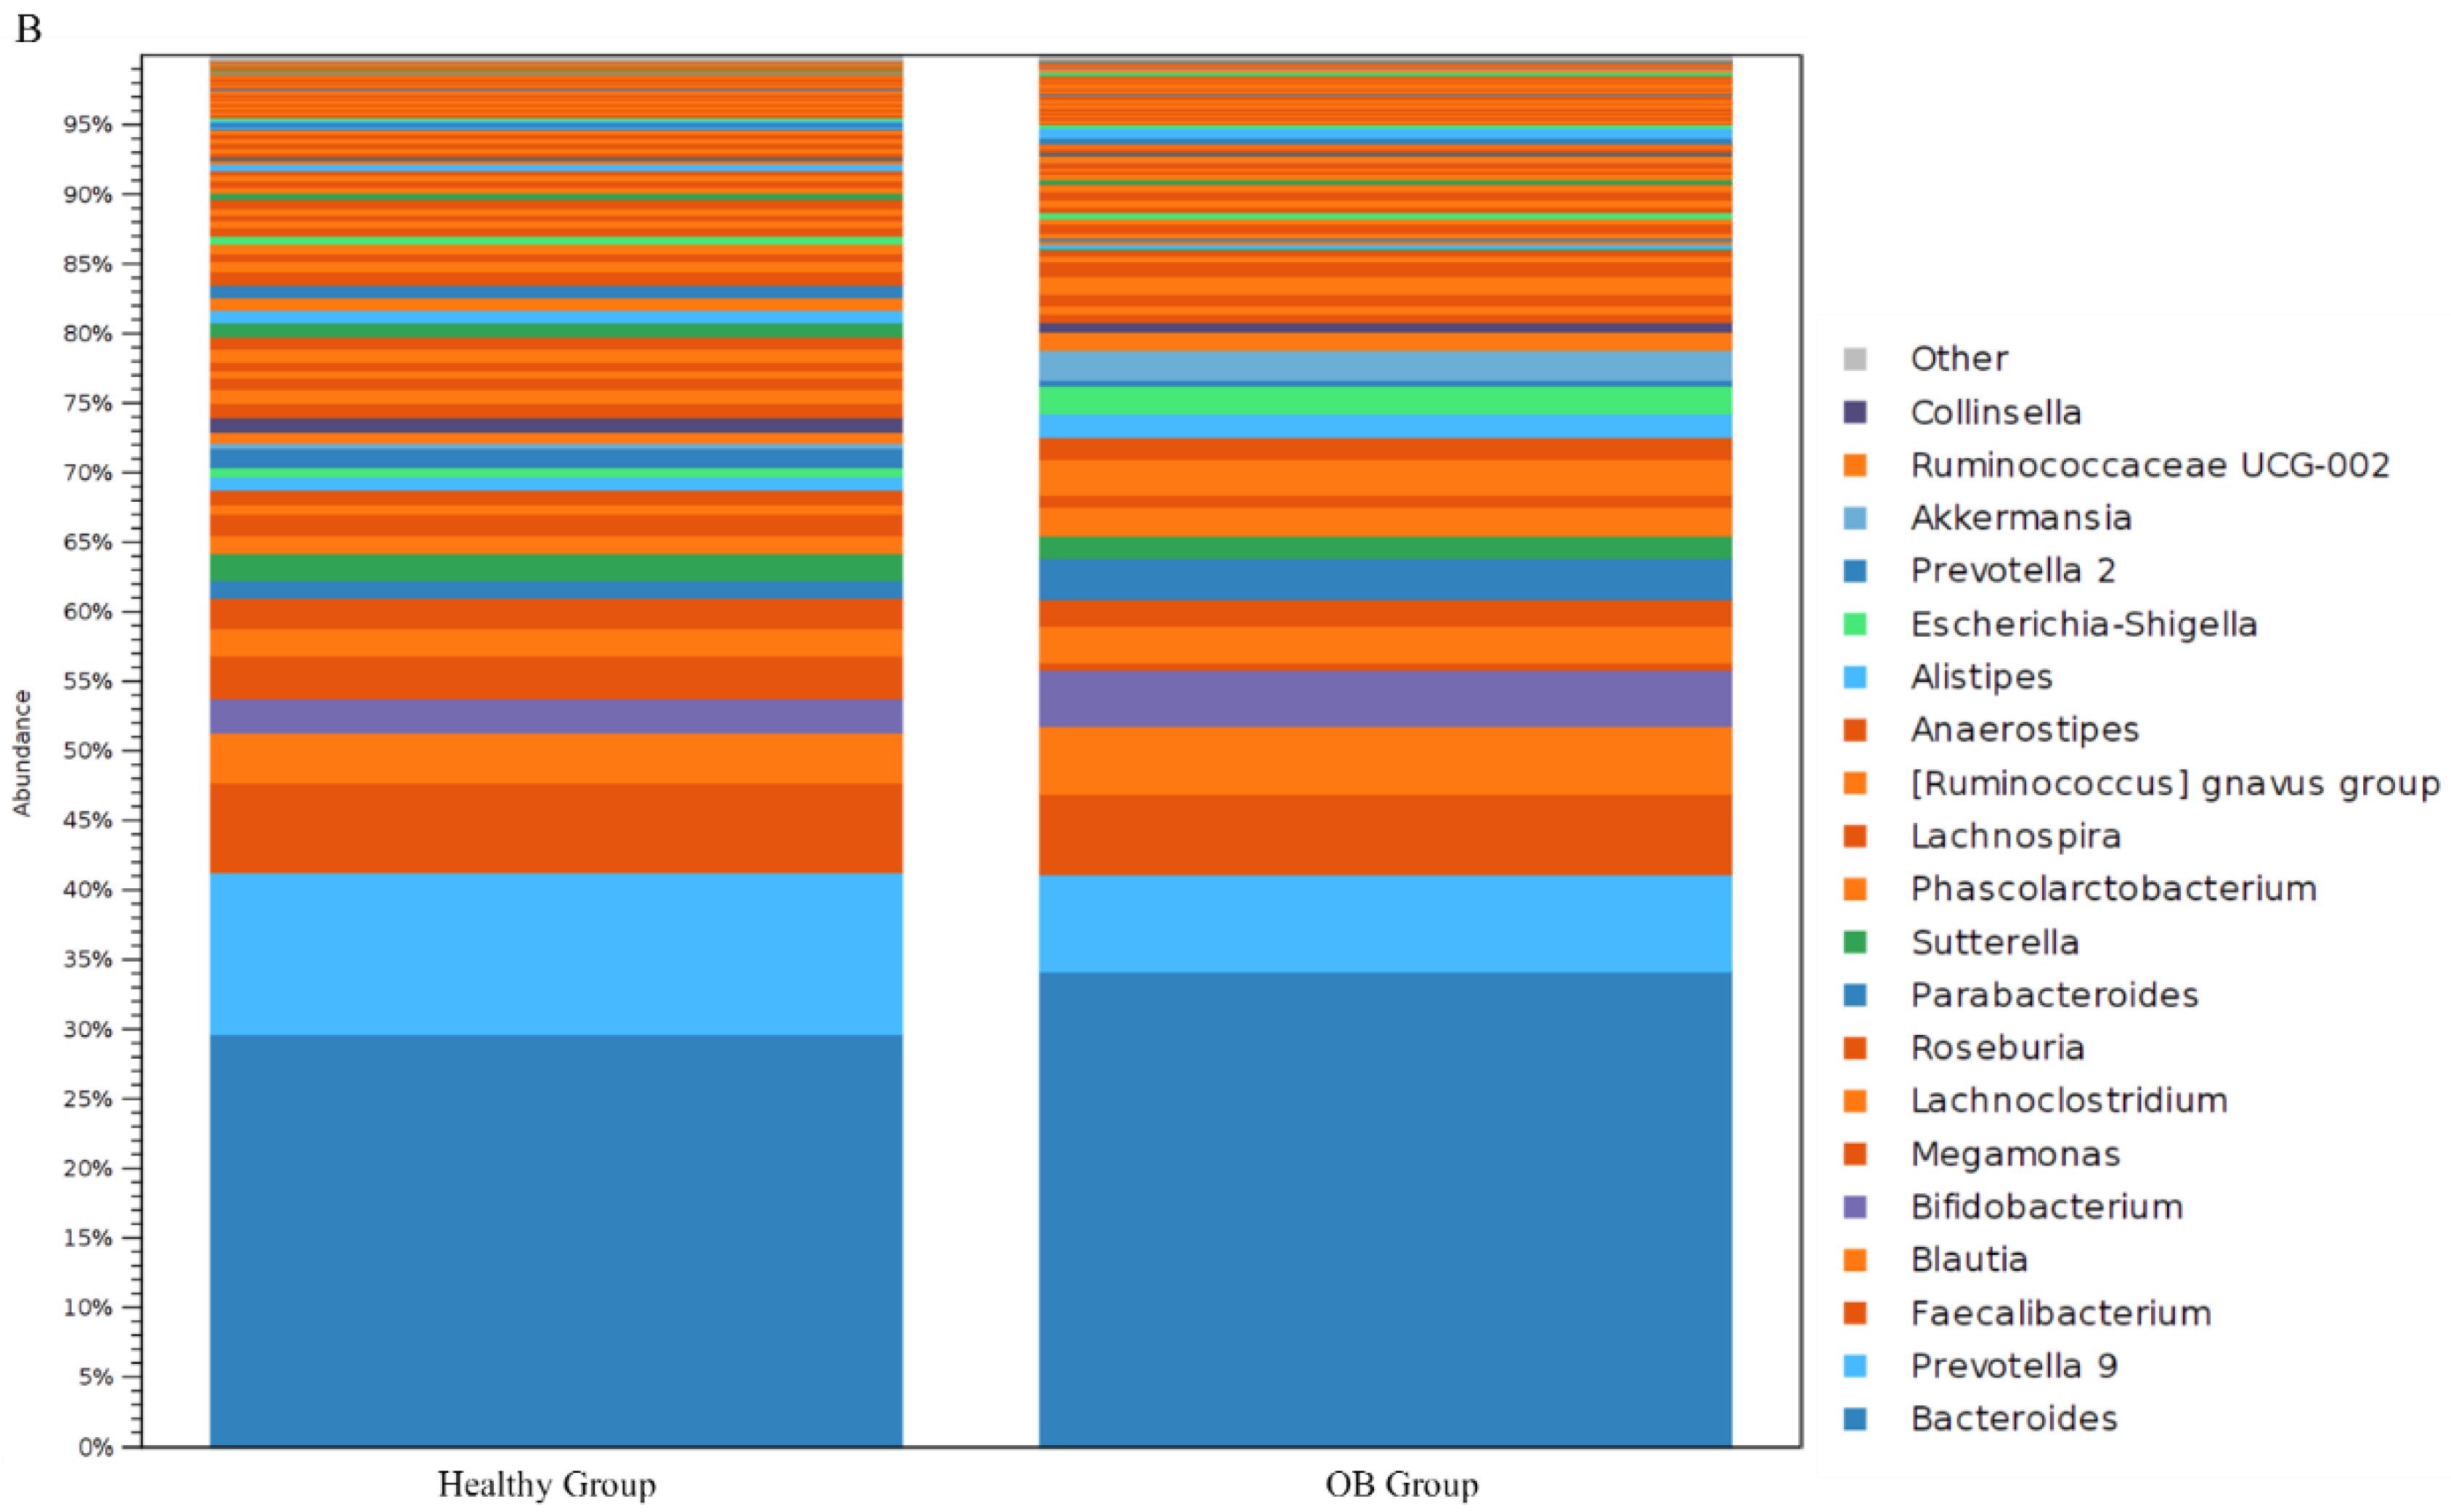
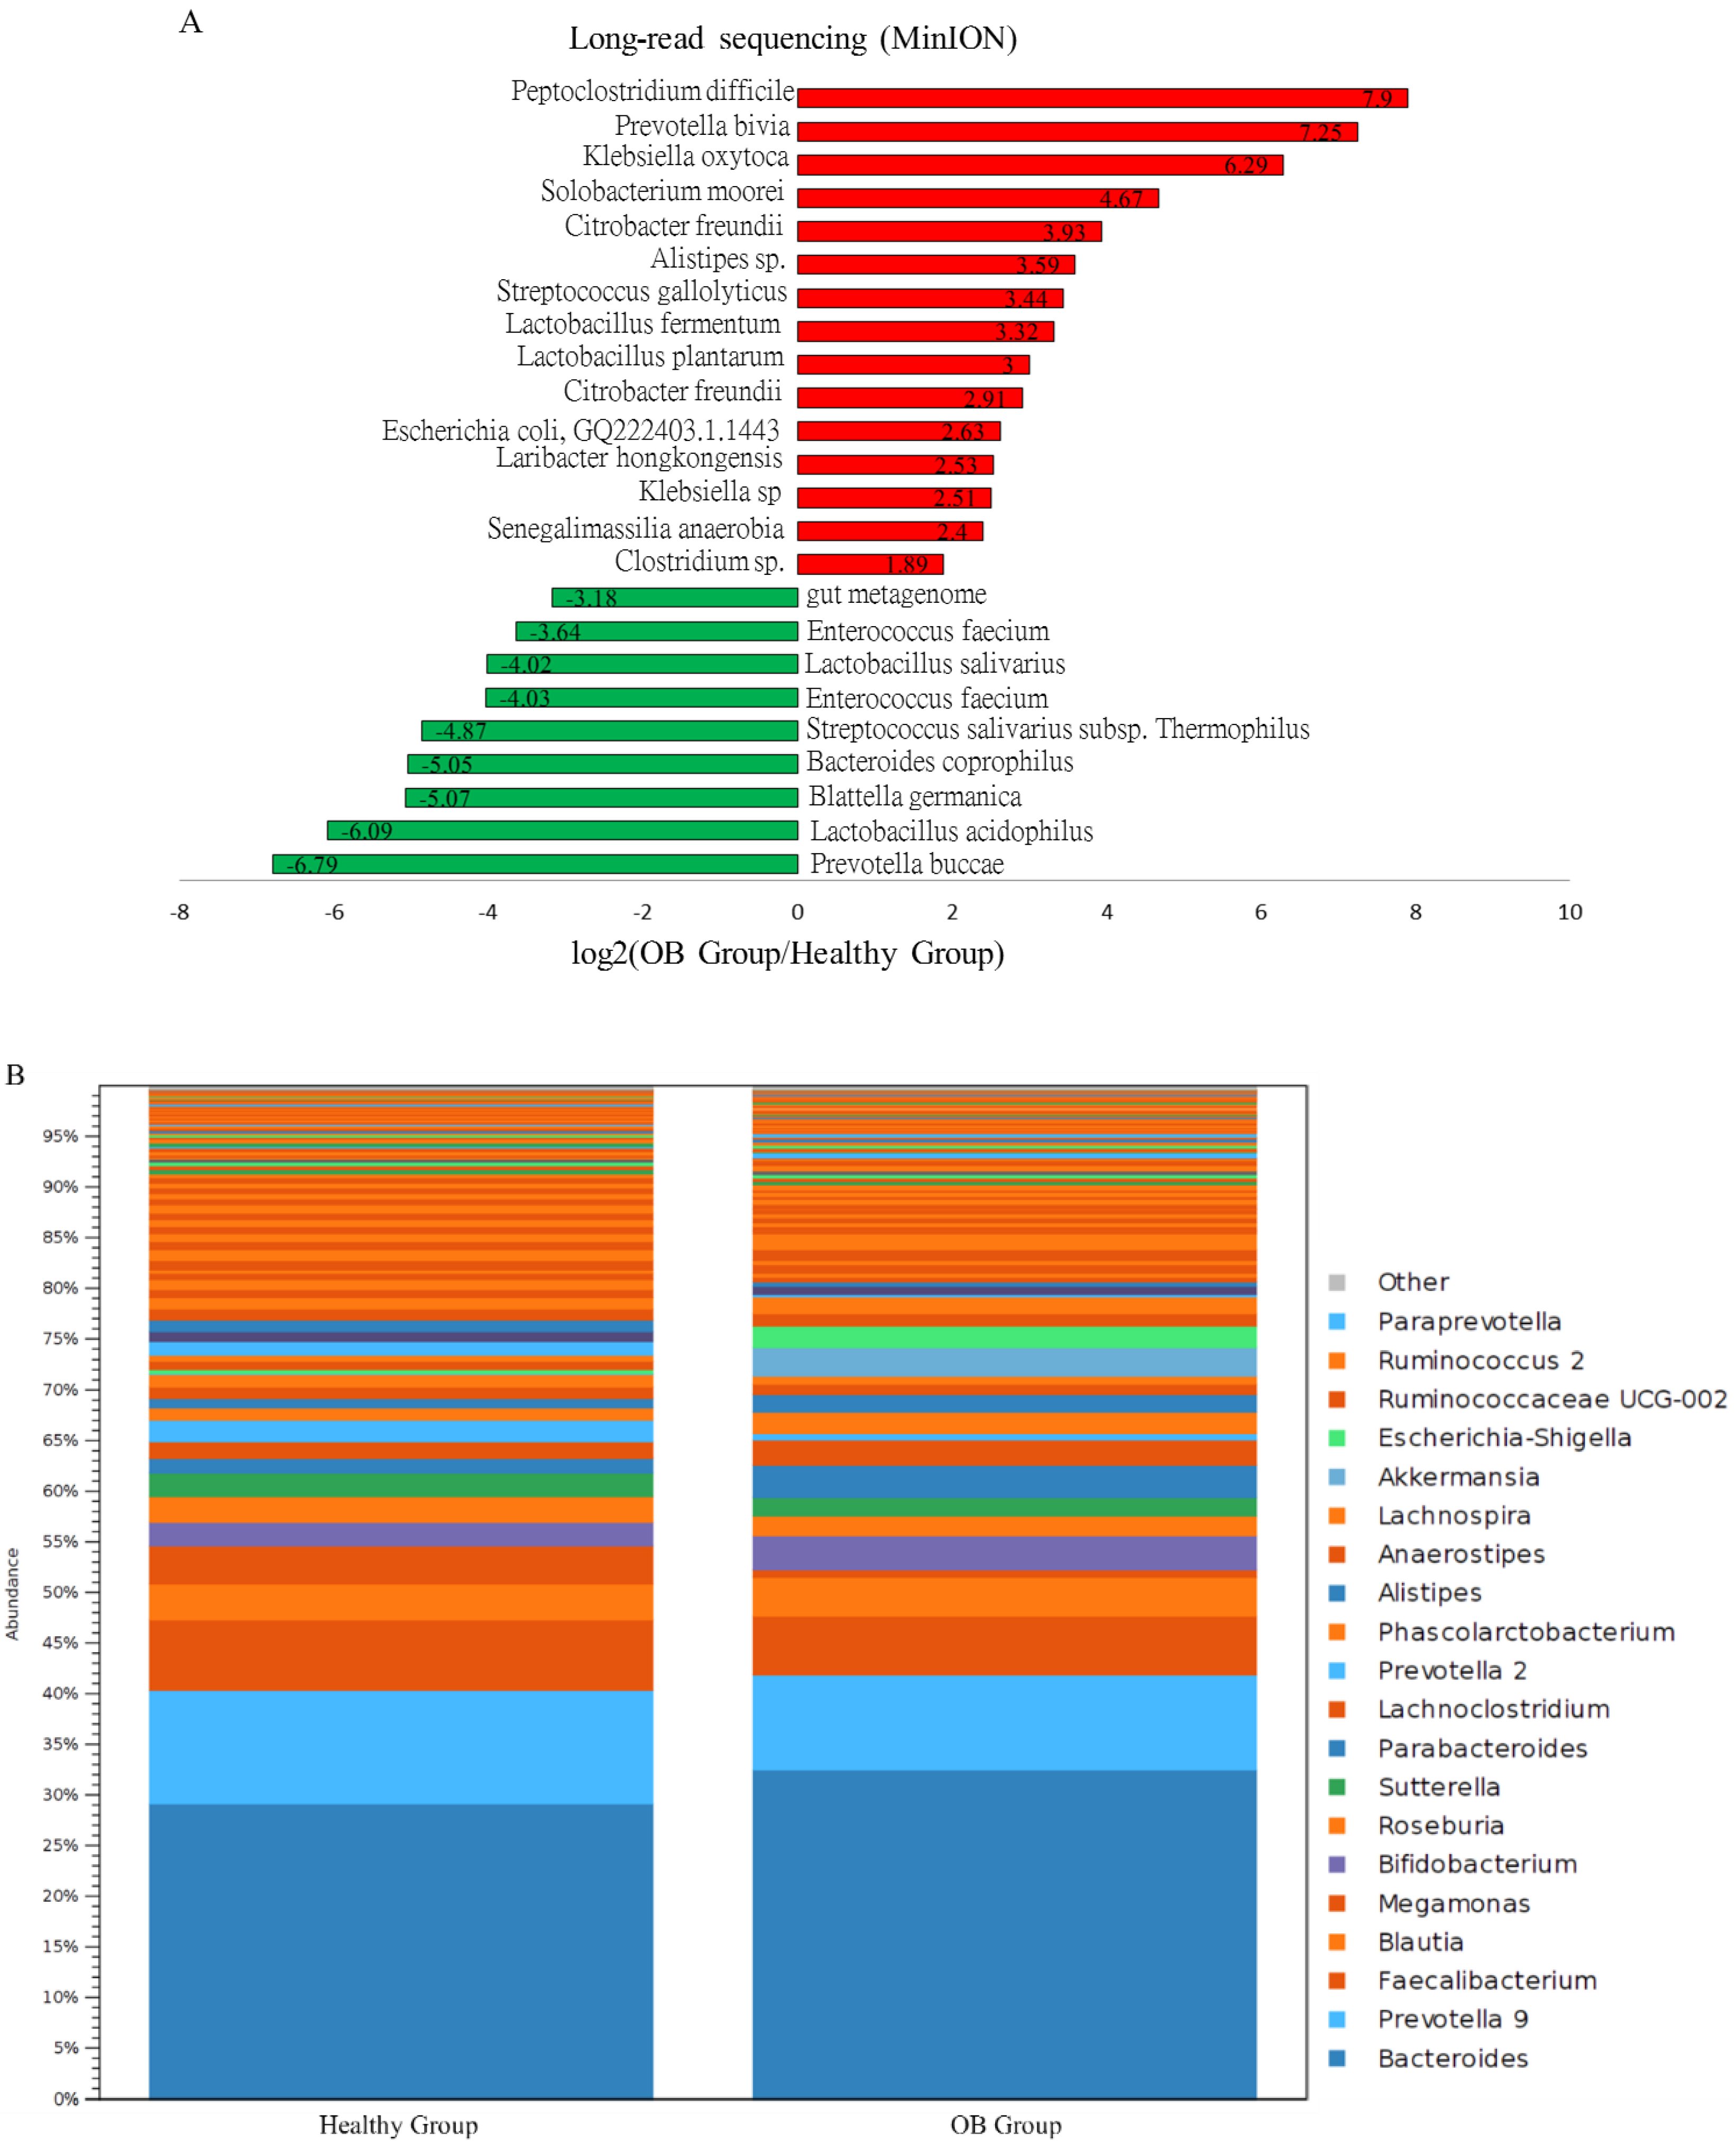
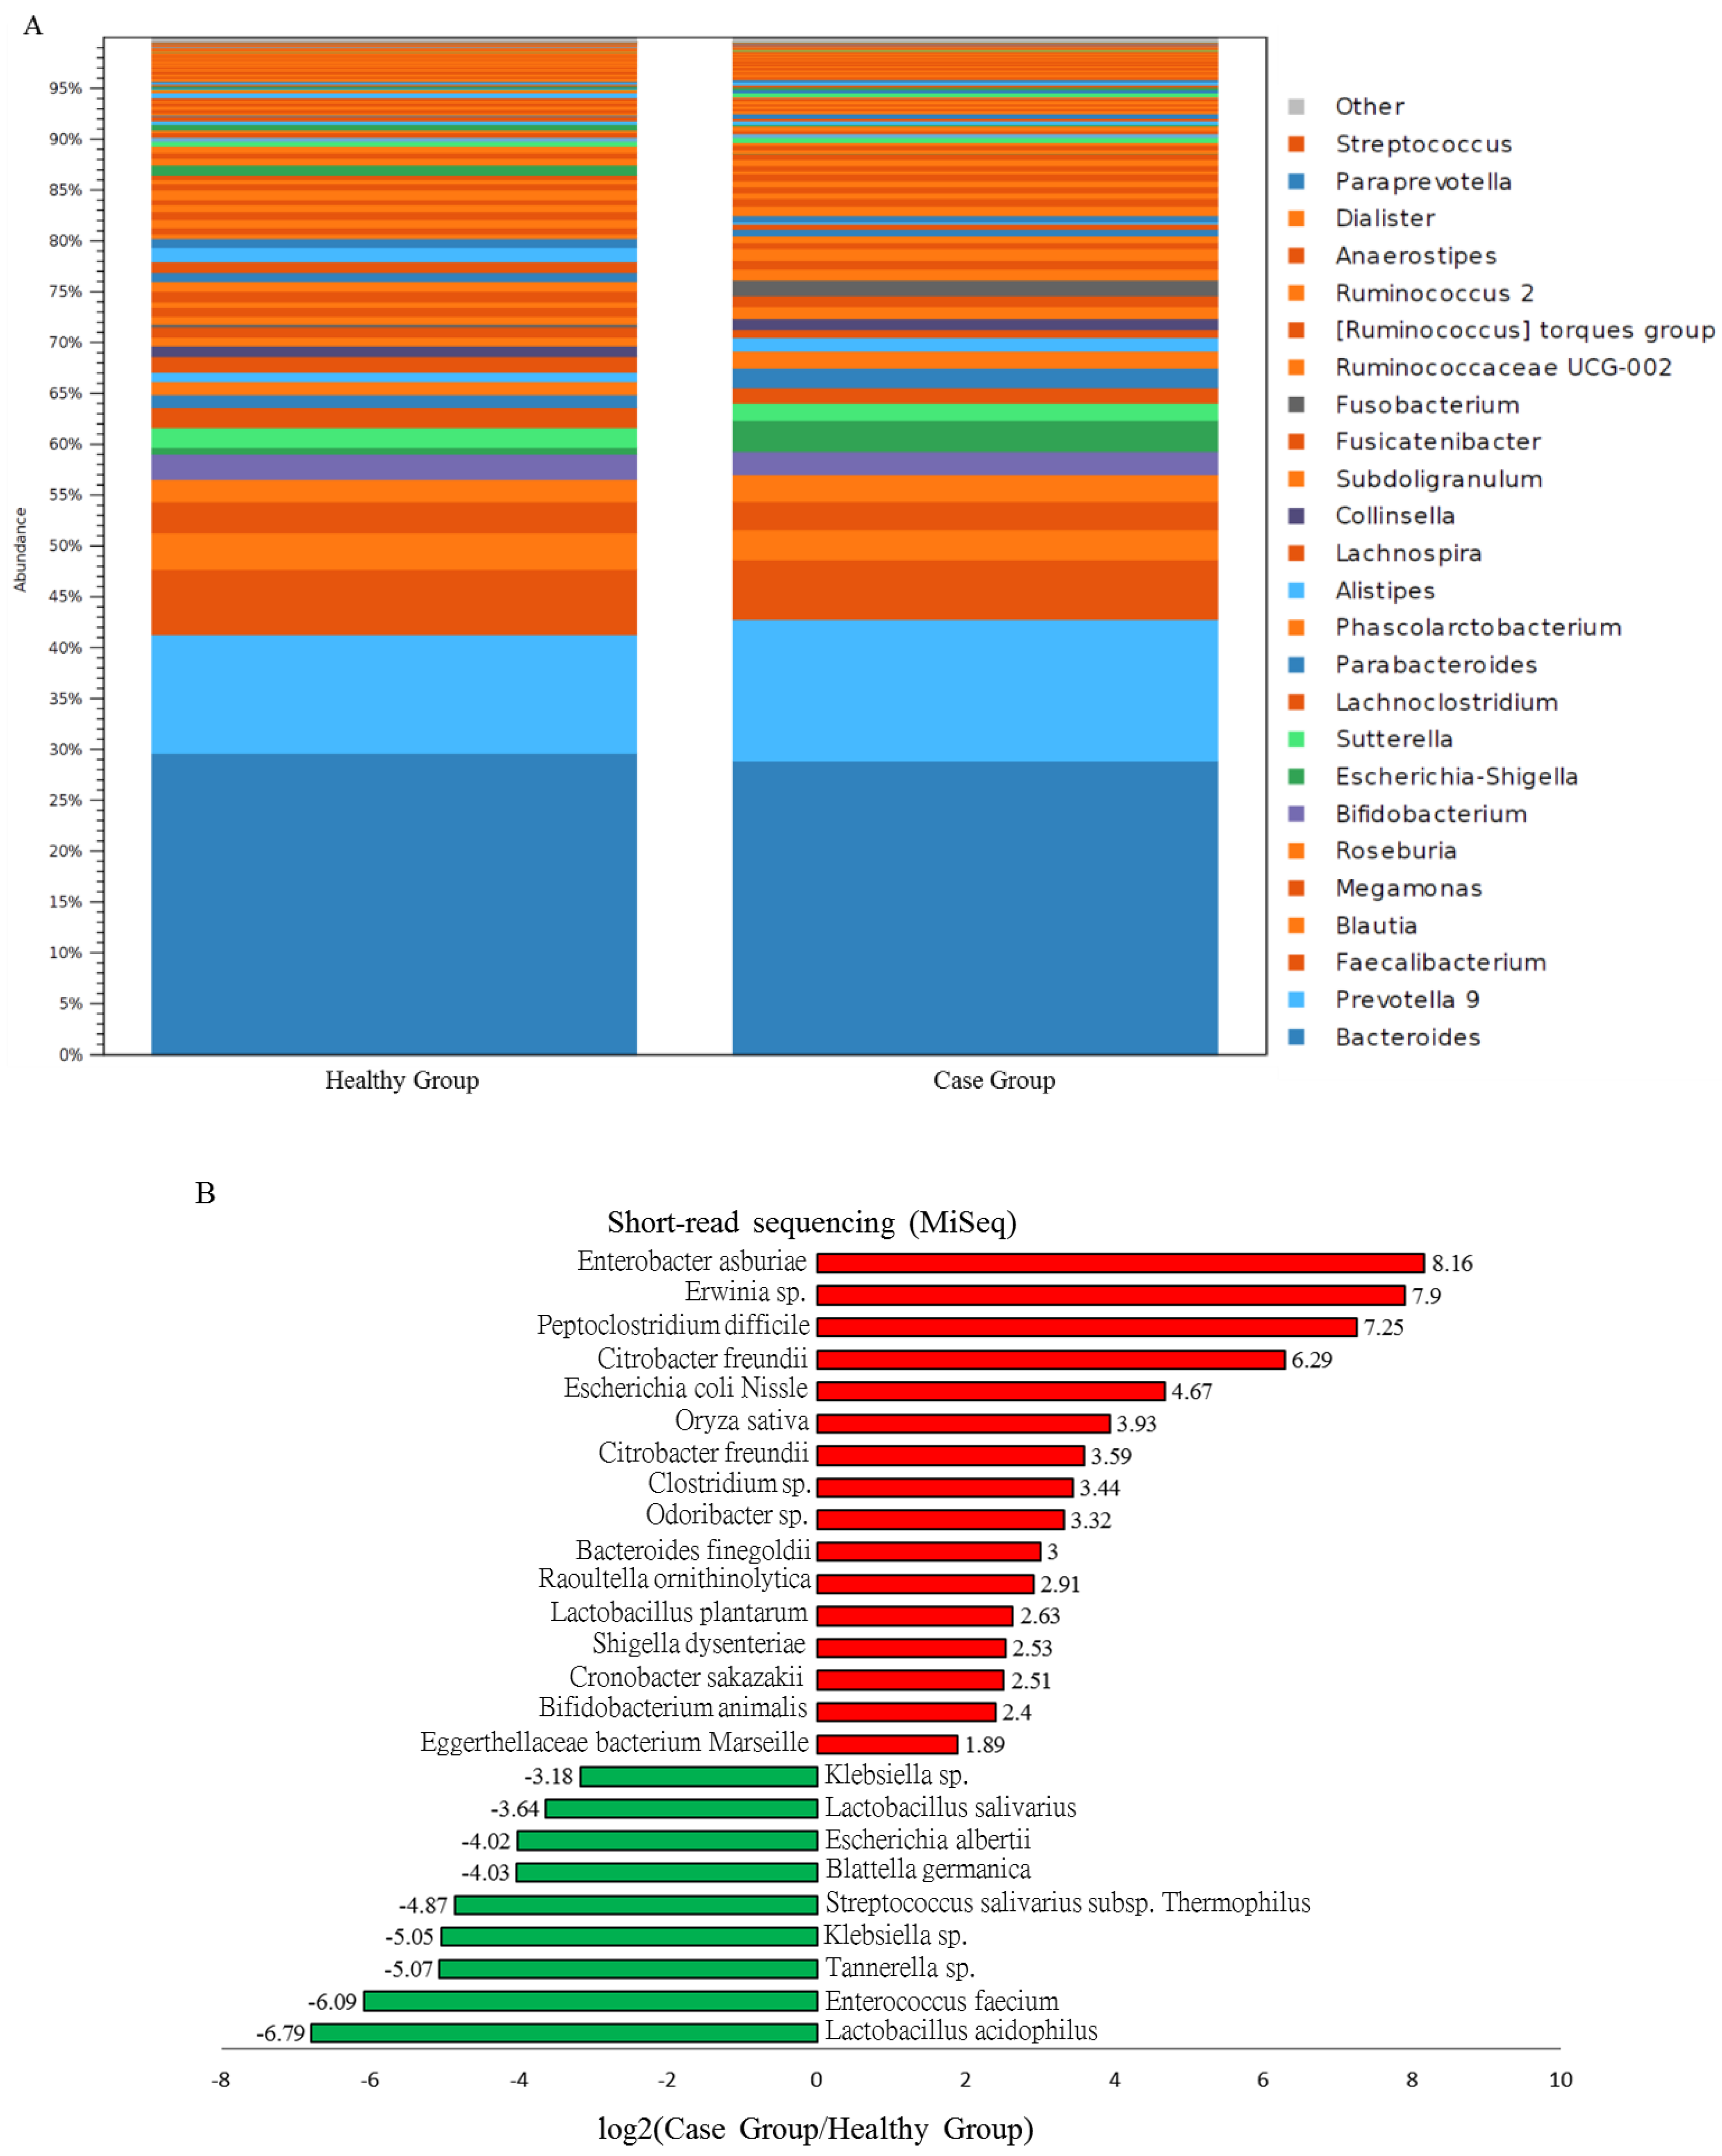
3.2. Overview of Gut Microbial Communities in Recruited Participants Evaluated by Short- and Long-Read Sequencing Results
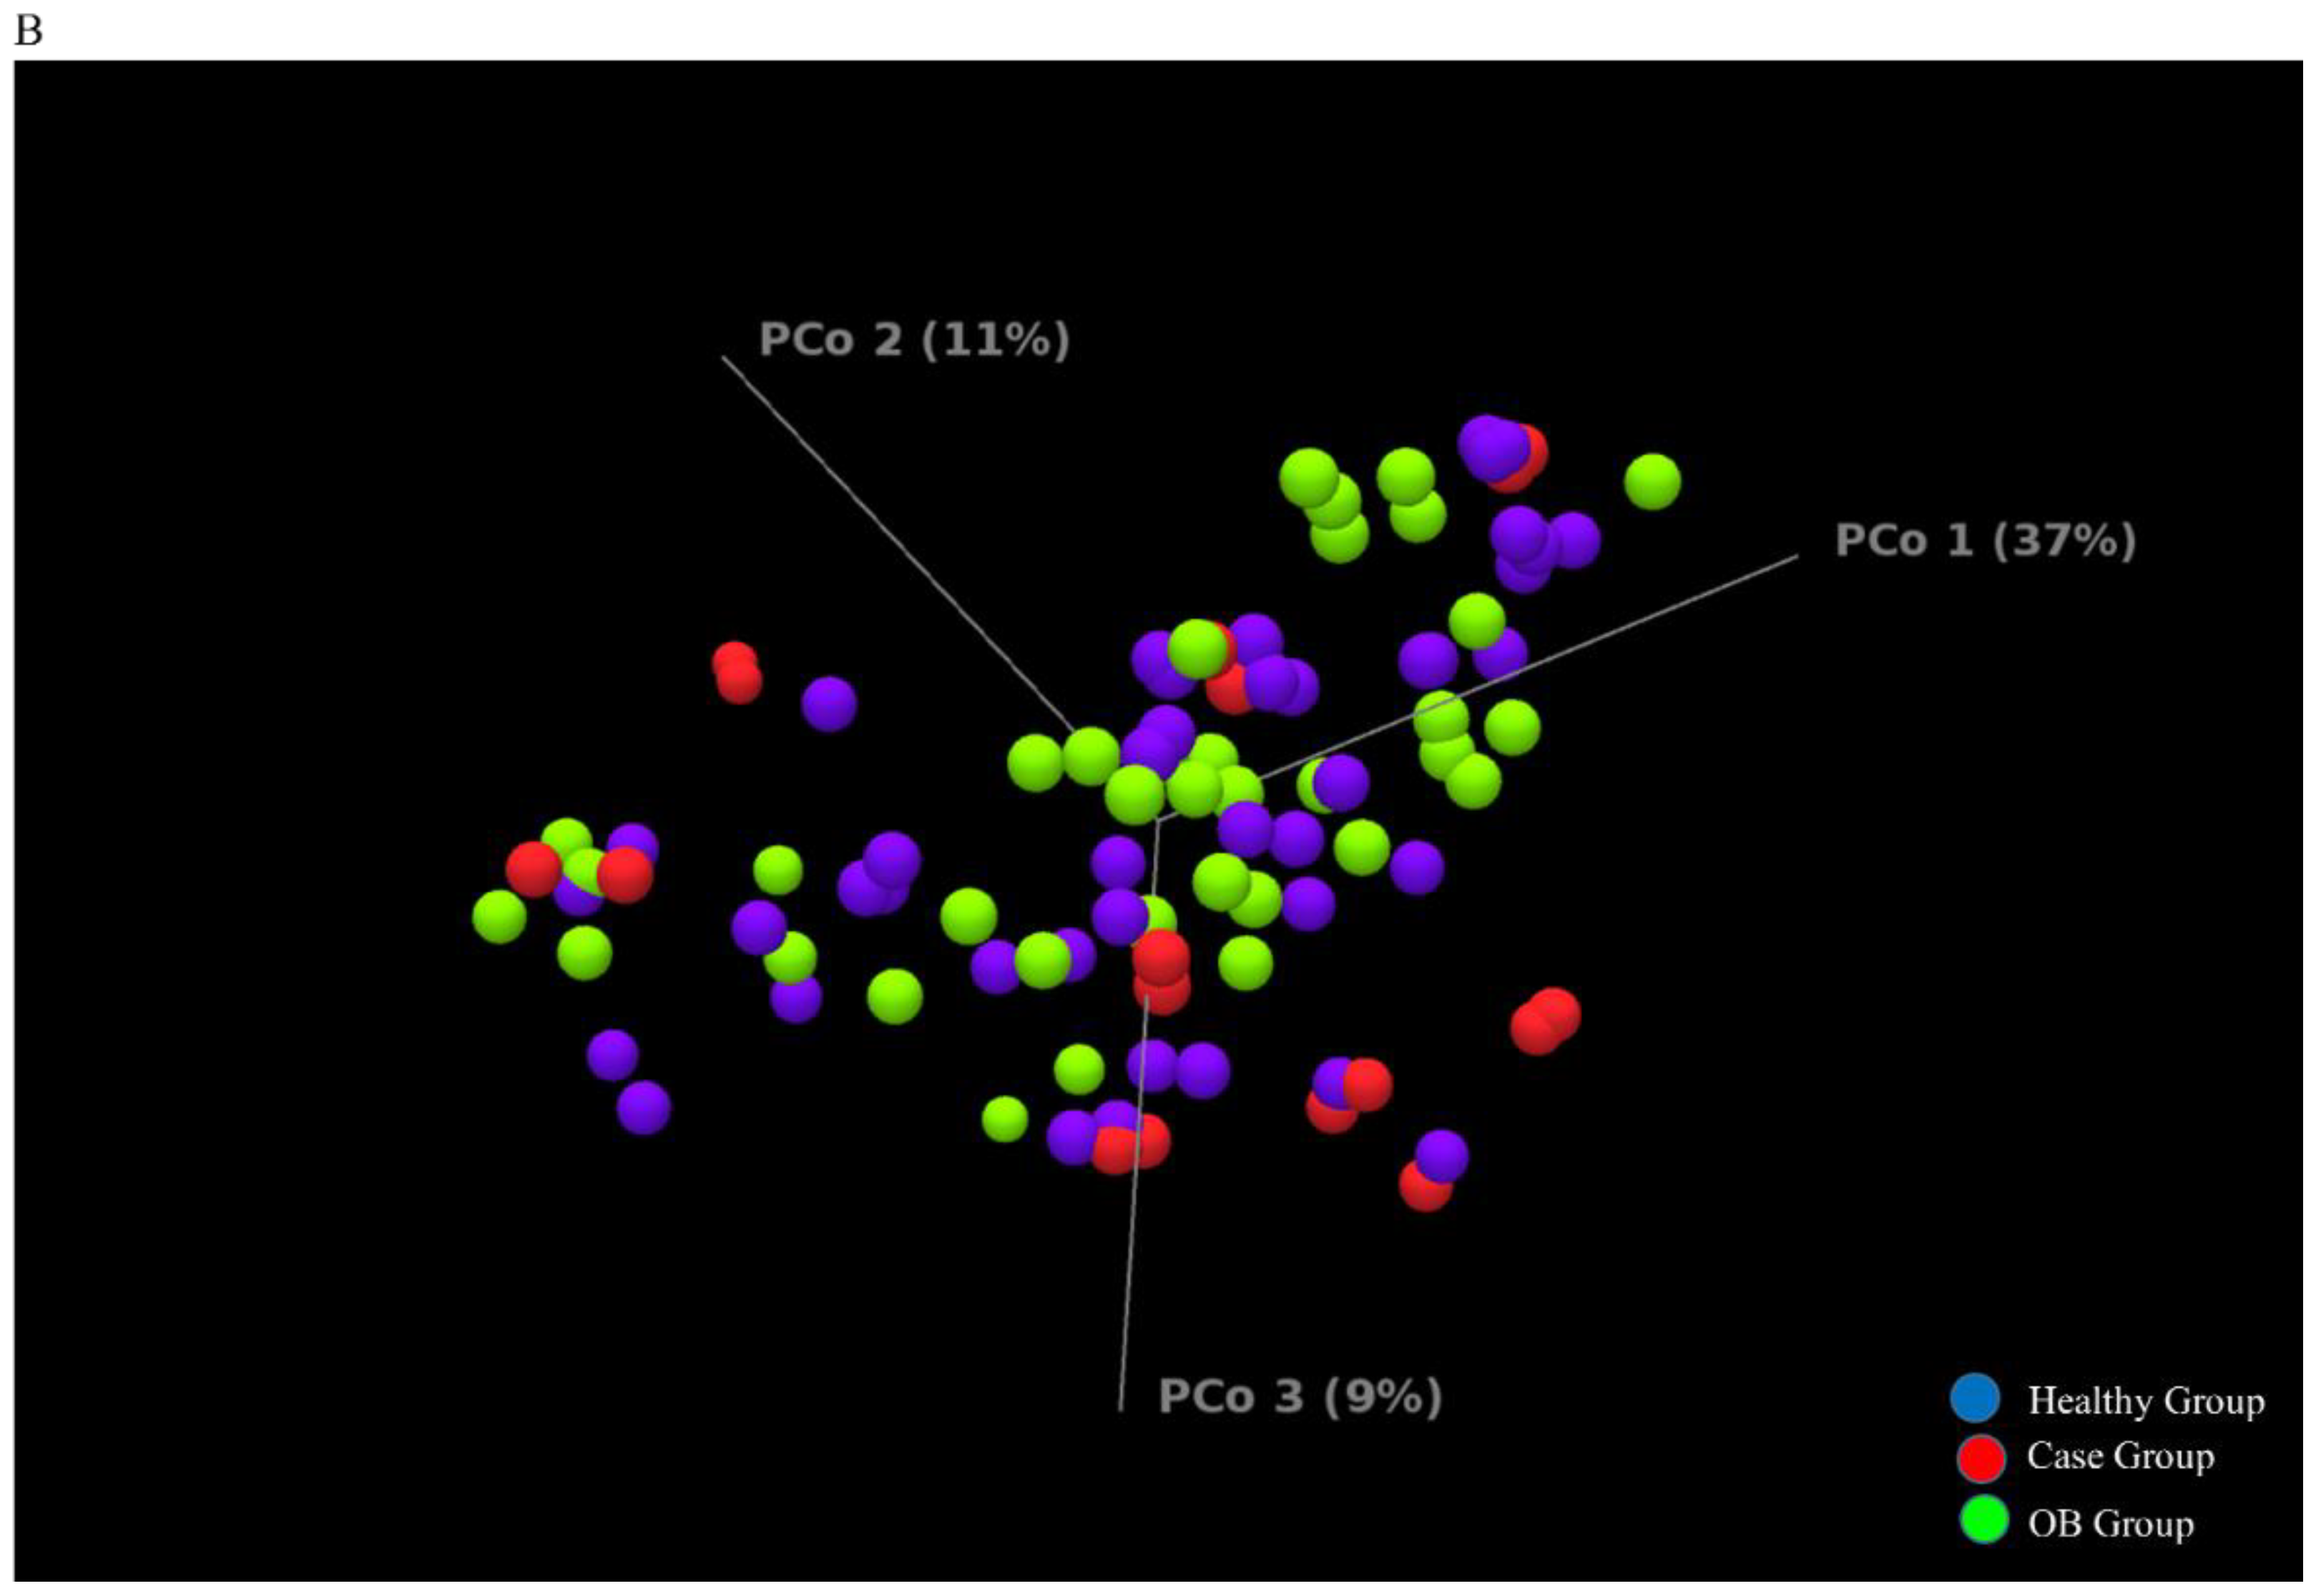
3.3. Comparison of Gut Microbiota in iFOBT-Positive Patients and the Healthy Group Using Distinct Sequencing Platforms
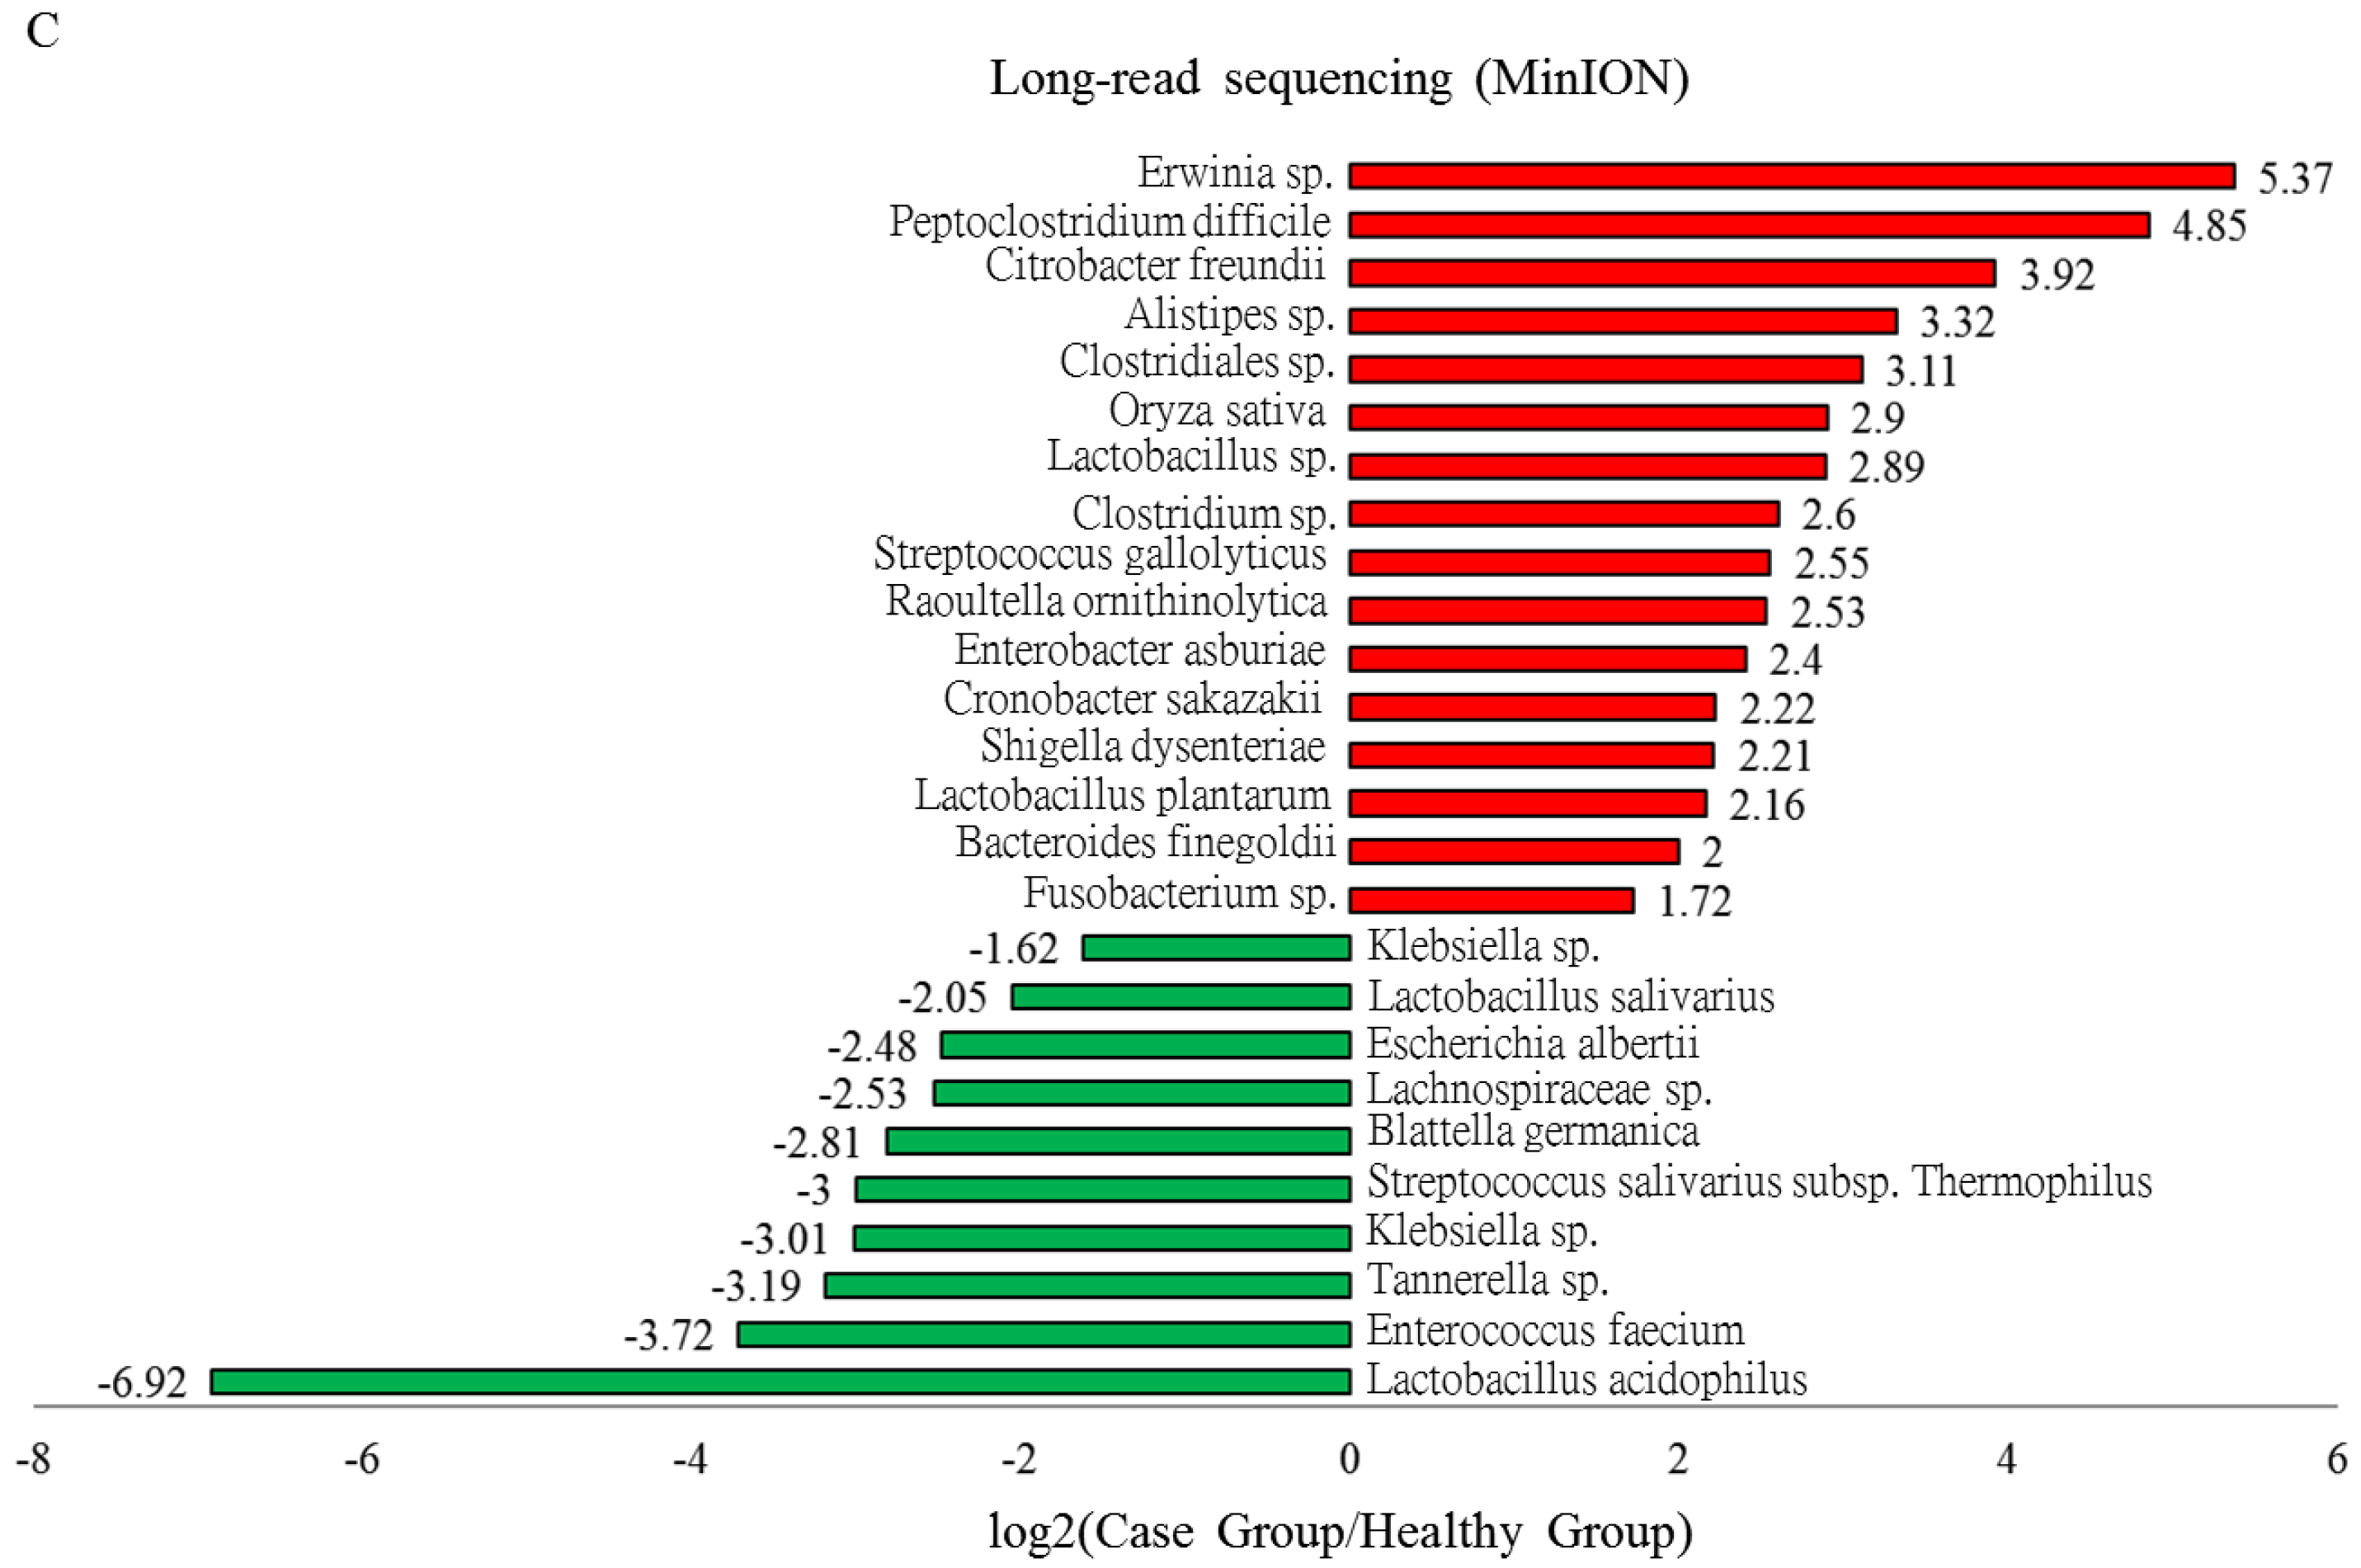
3.4. Characterization of Adenomatous-Polyp-Related OTUs in the Case Group Using Distinct Sequencing Platforms
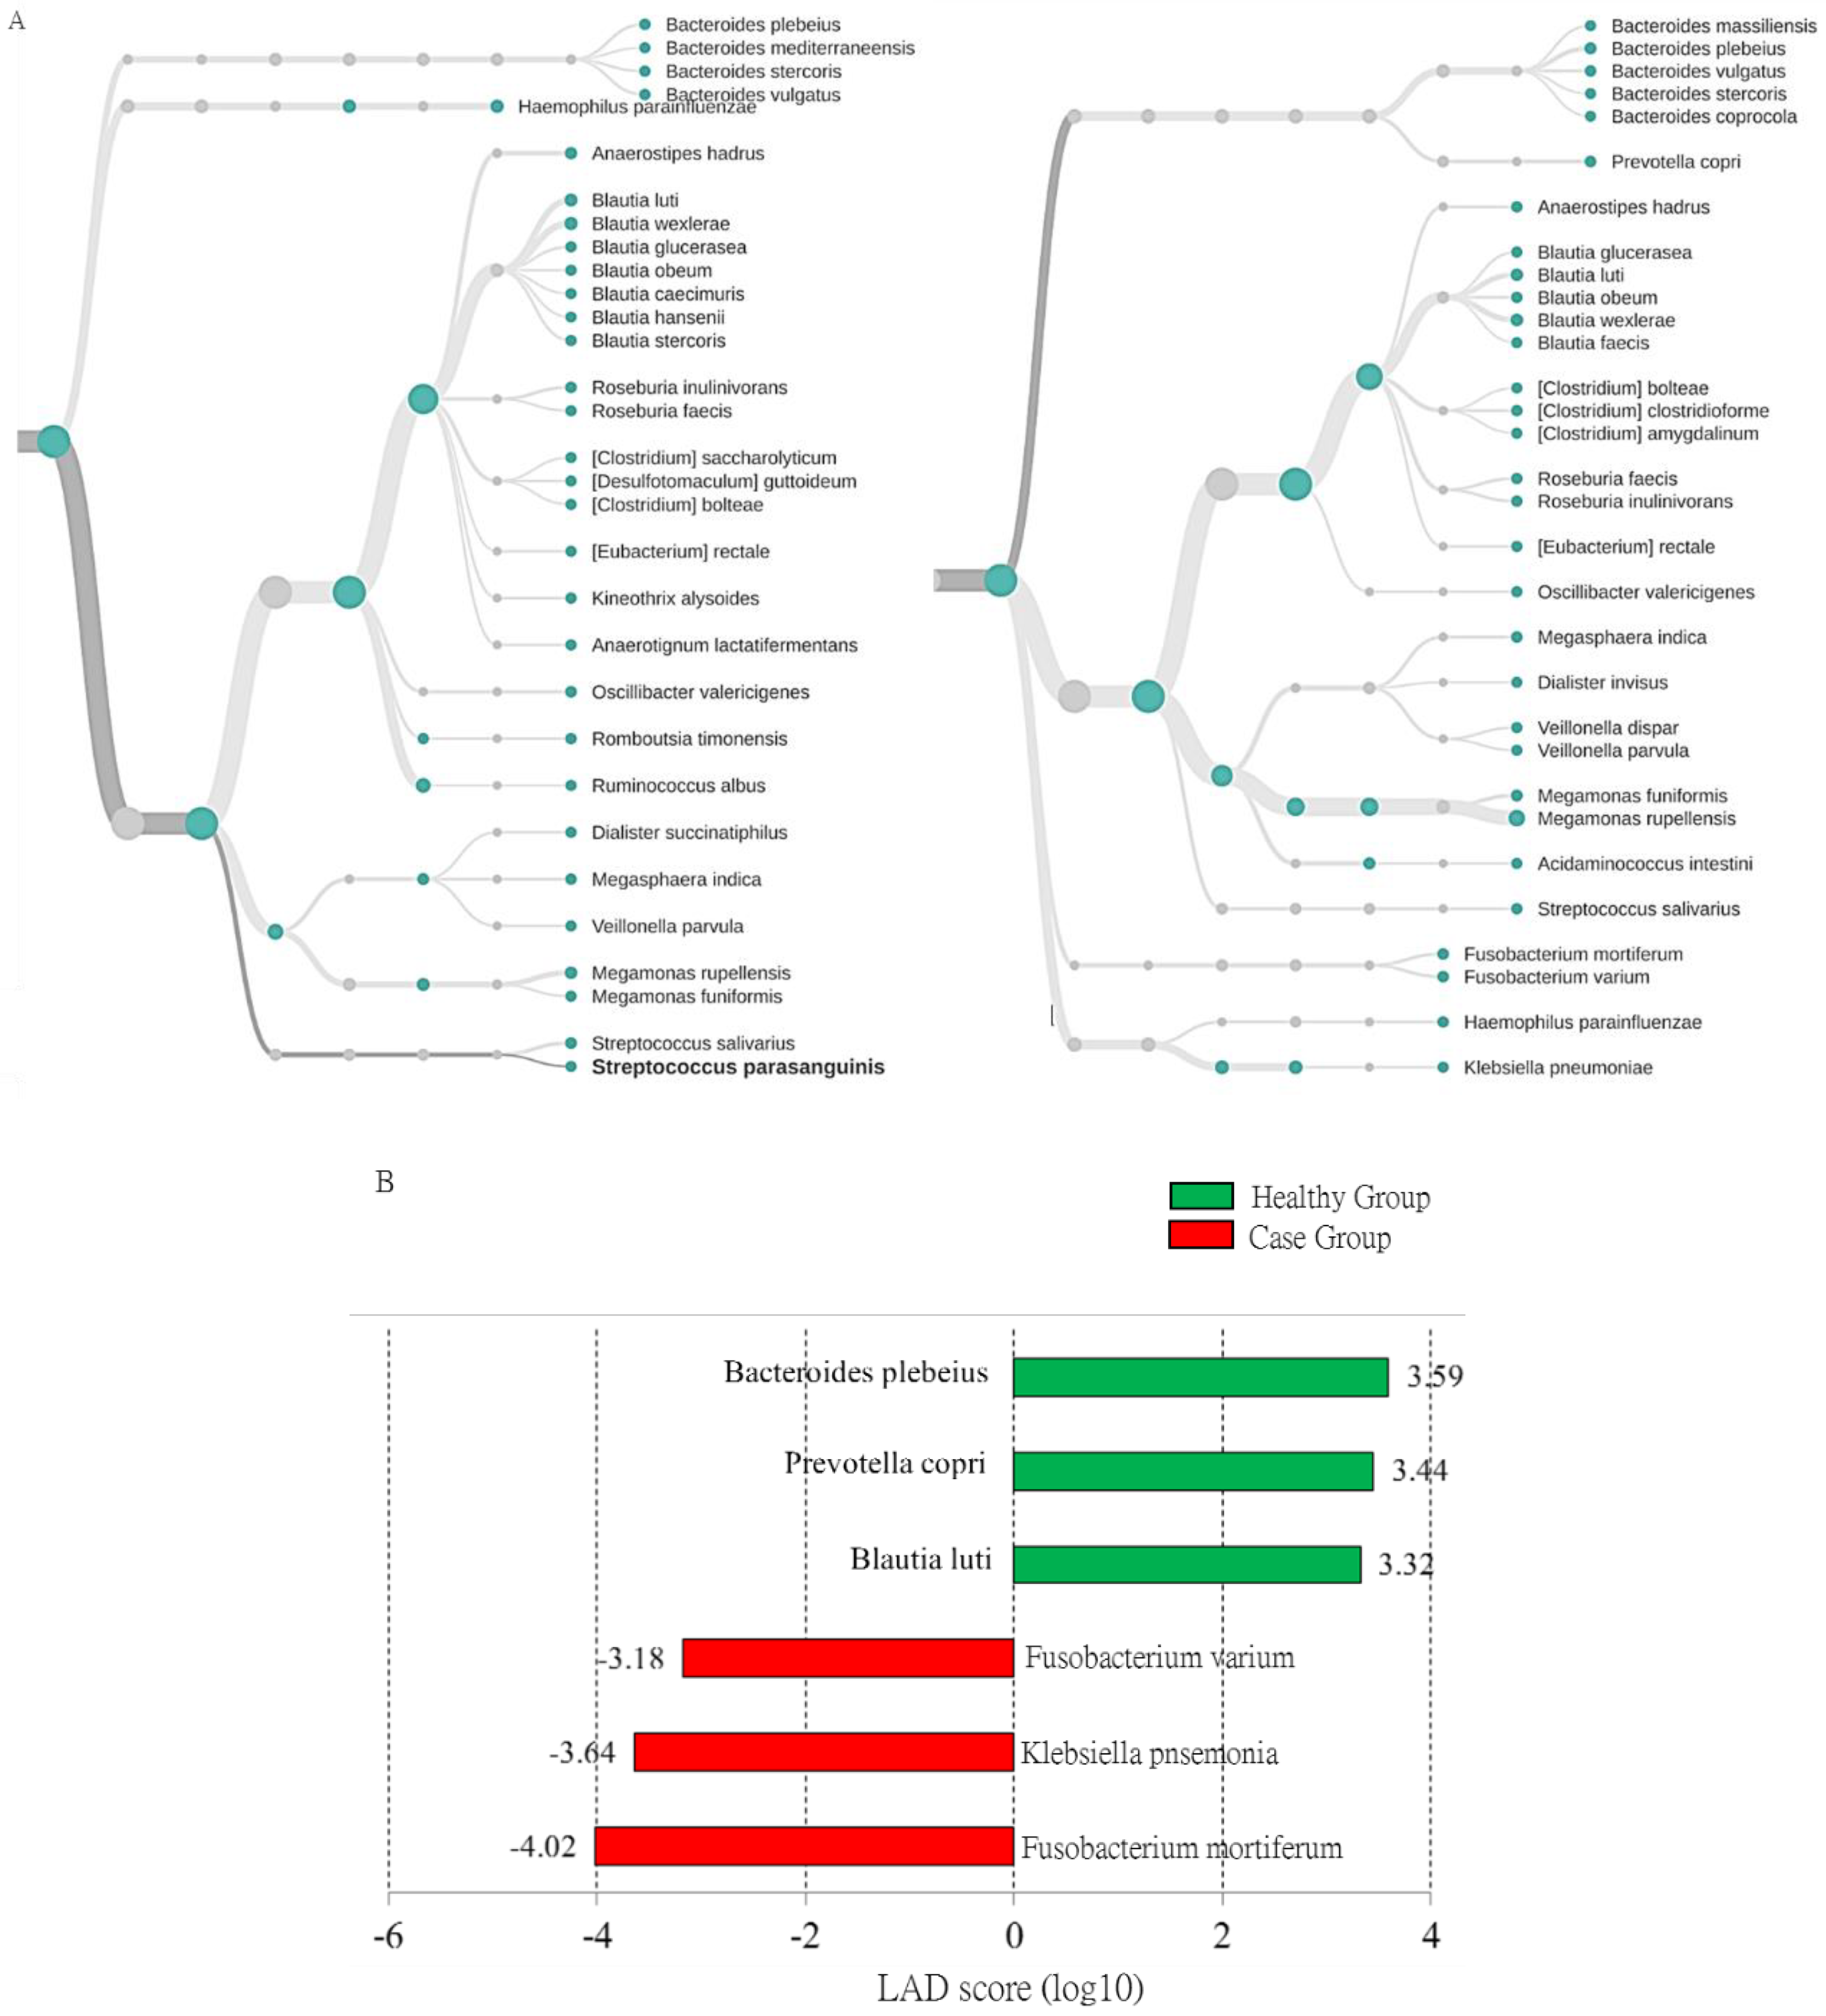
3.5. Identified OTUs at the Species Level that Differed between the Case Group and Healthy Participants Classified Using MinION Sequencing
4. Discussion
5. Conclusions
Author Contributions
Funding
Acknowledgments
Conflicts of Interest
Abbreviations
| NGS | Next generation sequencing |
| ONT | Oxford nanopore technology |
| iFOBT | immunochemical fecal occult blood test |
References
- Lee, J.R.; Magruder, M.; Zhang, L.; Westblade, L.F.; Satlin, M.J.; Robertson, A.; Edusei, E.; Crawford, C.; Ling, L.; Taur, Y.; et al. Gut microbiota dysbiosis and diarrhea in kidney transplant recipients. Am. J. Transpl. 2019, 19, 488–500. [Google Scholar] [CrossRef] [PubMed] [Green Version]
- Svolos, V.; Hansen, R.; Nichols, B.; Quince, C.; Ijaz, U.Z.; Papadopoulou, R.T.; Edwards, C.A.; Watson, D.; Alghamdi, A.; Brejnrod, A.; et al. Treatment of Active Crohn’s Disease With an Ordinary Food-based Diet That Replicates Exclusive Enteral Nutrition. Gastroenterology 2019, 156, 1354–1367. [Google Scholar] [CrossRef] [PubMed] [Green Version]
- Franzosa, E.A.; Sirota-Madi, A.; Avila-Pacheco, J.; Fornelos, N.; Haiser, H.J.; Reinker, S.; Vatanen, T.; Hall, A.B.; Mallick, H.; McIver, L.J.; et al. Gut microbiome structure and metabolic activity in inflammatory bowel disease. Nat. Microbiol. 2019, 4, 293–305. [Google Scholar] [CrossRef] [PubMed]
- Siegel, R.L.; Miller, K.D.; Goding Sauer, A.; Fedewa, S.A.; Butterly, L.F.; Anderson, J.C.; Cercek, A.; Smith, R.A.; Jemal, A. Colorectal cancer statistics, 2020. CA Cancer J. Clin. 2020, 70, 145–164. [Google Scholar] [CrossRef] [PubMed] [Green Version]
- Sobhani, I.; Bergsten, E.; Couffin, S.; Amiot, A.; Nebbad, B.; Barau, C.; de’Angelis, N.; Rabot, S.; Canoui-Poitrine, F.; Mestivier, D.; et al. Colorectal cancer-associated microbiota contributes to oncogenic epigenetic signatures. Proc. Natl. Acad. Sci. USA 2019, 116, 24285–24295. [Google Scholar] [CrossRef]
- Uçmak, F.; Tuncel, E.T. Relationship between Lesions in Adenomatous Polyp-Dysplasia-Colorectal Cancer Sequence and Neutrophil-to-Lymphocyte Ratio. Med. Sci. Monit. 2016, 22, 4536–4541. [Google Scholar] [CrossRef] [Green Version]
- Wieten, E.; Schreuders, E.H.; Grobbee, E.J.; Nieboer, D.; Bramer, W.M.; Lansdorp-Vogelaar, I.; Bruno, M.J.; Kuipers, E.J.; Spaander, M.C.W. Incidence of faecal occult blood test interval cancers in population-based colorectal cancer screening: A systematic review and meta-analysis. Gut 2019, 68, 873–881. [Google Scholar] [CrossRef]
- Teng, F.; Darveekaran Nair, S.S.; Zhu, P.; Li, S.; Huang, S.; Li, X.; Xu, J.; Yang, F. Impact of DNA extraction method and targeted 16S-rRNA hypervariable region on oral microbiota profiling. Sci. Rep. 2018, 8, 16321. [Google Scholar] [CrossRef]
- Schriefer, A.E.; Cliften, P.F.; Hibberd, M.C.; Sawyer, C.; Brown-Kennerly, V.; Burcea, L.; Klotz, E.; Crosby, S.D.; Gordon, J.I.; Head, R.D. A multi-amplicon 16S rRNA sequencing and analysis method for improved taxonomic profiling of bacterial communities. J. Microbiol. Methods 2018, 154, 6–13. [Google Scholar] [CrossRef]
- Ranjan, R.; Rani, A.; Metwally, A.; McGee, H.S.; Perkins, D.L. Analysis of the microbiome: Advantages of whole genome shotgun versus 16S amplicon sequencing. Biochem. Biophys. Res. Commun. 2016, 469, 967–977. [Google Scholar] [CrossRef] [Green Version]
- Leggett, R.M.; Alcon-Giner, C.; Heavens, D.; Caim, S.; Brook, T.C.; Kujawska, M.; Martin, S.; Peel, N.; Acford-Palmer, H.; Hoyles, L.; et al. Rapid MinION profiling of preterm microbiota and antimicrobial-resistant pathogens. Nat. Microbiol. 2020, 5, 430–442. [Google Scholar] [CrossRef] [PubMed] [Green Version]
- Heikema, A.P.; Horst-Kreft, D.; Boers, S.A.; Jansen, R.; Hiltemann, S.D.; de Koning, W.; Kraaij, R.; de Ridder, M.A.J.; van Houten, C.B.; Bont, L.J.; et al. Comparison of Illumina versus Nanopore 16S rRNA Gene Sequencing of the Human Nasal Microbiota. Genes 2020, 11, 1105. [Google Scholar] [CrossRef]
- Laver, T.; Harrison, J.; O’Neill, P.A.; Moore, K.; Farbos, A.; Paszkiewicz, K.; Studholme, D.J. Assessing the performance of the Oxford Nanopore Technologies MinION. Biomol. Detect. Quantif. 2015, 3, 1–8. [Google Scholar] [CrossRef] [PubMed] [Green Version]
- Casals-Pascual, C.; González, A.; Vázquez-Baeza, Y.; Song, S.J.; Jiang, L.J.; Knight, R. Microbial Diversity in Clinical Microbiome Studies: Sample Size and Statistical Power Considerations. Gastroenterology 2020, 158, 1524–1528. [Google Scholar] [CrossRef] [PubMed]
- Yu, T.; Guo, F.; Yu, Y.; Sun, T.; Ma, D.; Han, J.; Qian, Y.; Kryczek, I.; Sun, D.; Nagarsheth, N.; et al. Fusobacterium nucleatum Promotes Chemoresistance to Colorectal Cancer by Modulating Autophagy. Cell 2017, 170, 548–563. [Google Scholar] [CrossRef] [PubMed] [Green Version]
- Rezasoltani, S.; Asadzadeh Aghdaei, H.; Dabiri, H.; Akhavan Sepahi, A.; Modarressi, M.H.; Nazemalhosseini Mojarad, E. The association between fecal microbiota and different types of colorectal polyp as precursors of colorectal cancer. Microb. Pathog. 2018, 124, 244–249. [Google Scholar] [CrossRef]
- Sekizuka, T.; Ogasawara, Y.; Ohkusa, T.; Kuroda, M. Characterization of Fusobacterium varium Fv113-g1 isolated from a patient with ulcerative colitis based on complete genome sequence and transcriptome analysis. PLoS ONE 2017, 12, e0189319. [Google Scholar] [CrossRef] [Green Version]
- Toshifumi, O.; Tsutomu, Y.; Nobuhiro, S.; Sumio, W.; Hisao, T.; Isao, O. Commensal bacteria can enter colonic epithelial cells and induce proinflammatory cytokine secretion: A possible pathogenic mechanism of ulcerative colitis. J. Med. Microbiol. 2009, 58, 535–545. [Google Scholar]
- Siyuan, L.; Yan, M.; Ming, L.; Yansong, X.; Yingchun, C.; Xiaoliang, H.; Chuangyi, W.; Changtao, W.; Qiuyan, W.; Xiaoyan, P.; et al. Gut microbiome associated with APC gene mutation in patients with intestinal adenomatous polyps. Int. J. Biol. Sci. 2020, 16, 135–146. [Google Scholar]
- Kang, D.W.; Adams, J.B.; Gregory, A.C.; Borody, T.; Chittick, L.; Fasano, A.; Khoruts, A.; Geis, E.; Maldonado, J.; McDonough-Means, S.; et al. Microbiota Transfer Therapy alters gut ecosystem and improves gastrointestinal and autism symptoms: An open-label study. Microbiome 2017, 5, 10. [Google Scholar] [CrossRef]
- Ericsson, A.C.; Akter, S.; Hanson, M.M.; Busi, S.B.; Parker, T.W.; Schehr, R.J.; Hankins, M.A.; Ahner, C.E.; Davis, J.W.; Franklin, C.L.; et al. Differential susceptibility to colorectal cancer due to naturally occurring gut microbiota. Oncotarget 2015, 6, 33689–33704. [Google Scholar] [CrossRef] [PubMed] [Green Version]
- Zhang, Y.; Yu, K.; Chen, H.; Su, Y.; Zhu, W. Caecal infusion of the short-chain fatty acid propionate affects the microbiota and expression of inflammatory cytokines in the colon in a fistula pig model. Microb. Biotechnol. 2018, 11, 859–868. [Google Scholar] [CrossRef] [PubMed] [Green Version]
- Chaoheng, Y.; Bailing, Z.; Xuyang, X.; Shuang, C.; Yun, D.; Yantai, W.; Lei, W.; Yaomei, T.; Binyan, Z.; Heng, X.; et al. Prevotella copri is associated with carboplatin-induced gut toxicity. Cell Death Dis. 2019, 10, 714. [Google Scholar]
- Samantha, M.E.; Siddharth Venkat, R.; Aadra, P.B. Relationship between the Gut Microbiome and Systemic Chemotherapy. Dig. Dis. Sci. 2020, 65, 874–884. [Google Scholar]
- Lin, D.; Peters, B.A.; Friedlander, C.; Freiman, H.J.; Goedert, J.J.; Sinha, R.; Miller, G.; Bernstein, M.A.; Hayes, R.B.; Ahn, J. Association of dietary fibre intake and gut microbiota in adults. Br. J. Nutr. 2018, 120, 1014–1022. [Google Scholar] [CrossRef] [Green Version]
- Liu, F.; Liu, A.; Lu, X.; Zhang, Z.; Xue, Y.; Xu, J.; Zeng, S.; Xiong, Q.; Tan, H.; He, X.; et al. Dysbiosis signatures of the microbial profile in tissue from bladder cancer. Cancer Med. 2019, 8, 6904–6914. [Google Scholar] [CrossRef] [Green Version]
- Taylor, W.S.; Pearson, J.; Miller, A.; Schmeier, S.; Frizelle, F.A.; Purcell, R.V. MinION Sequencing of colorectal cancer tumour microbiomes-A comparison with amplicon-based and RNA-Sequencing. PLoS ONE 2020, 15, e0233170. [Google Scholar] [CrossRef]


| Healthy Group (n = 53) | FOBT-Positive (n = 36) | Adenomatous Polyp (n = 43) | p | |
|---|---|---|---|---|
| Age (Median(IQR)) | 64 (33–69) | 53 (47–55) | 56 (43–59) | 0.63 |
| Sex (n,%) Female Male | 31 (58.5) 22 (41.5) | 20 (55.56) 16 (44.44) | 20 (46.51) 23 (35.49) | 0.58 |
| History of cancer (n,%) | 6 (11.32) | 3 (8.33) | 5 (11.63) | 0.98 |
| Family history of cancer (n,%) | 11 (20.75) | 6 (16.67) | 10 (23.26) | 0.56 |
| History of smoking (n,%) | 15 (28.3) | 8 (22.22) | 13 (30.23) | 0.52 |
| History of drinking (n,%) | 4 (7.54) | 5 (13.89) | 8 (18.6) | 0.12 |
| History of regular exercise (n,%) | 24 (45.28) | 17 (47.22) | 20 (46.51) | 0.73 |
| Sequencing Platform | Miseq | MinION | |||||||||
|---|---|---|---|---|---|---|---|---|---|---|---|
| Number of Raw reads (n = 132) | Number of classified reads (n = 132) | Genus | Species | Number of Raw reads (n = 132) | Number of classified reads (n = 132) | Genus | Species | ||||
| CC | UC | CC | UC | CC | UC | CC | UC | ||||
| 9,404,348 | 8,511,812 | 95.57% | 4.43% | 71.29% | 28.71% | 7,094,472 | 6,810,408 | 97.32% | 2.68% | 76.83% | 23.17% |
| Relative Abundance (Case Group/Healthy Group) | p-Value | |
|---|---|---|
| Sample No. | Case Group (43)/Healthy Group (53) | |
| Fusobacterium Mortiferum (Fold change; mean (SD)) | 10.182 (3.41) | <0.001 |
| Klebsiella Pneumonia (Fold change; mean (SD)) | 15.286 (4.91) | <0.001 |
Publisher’s Note: MDPI stays neutral with regard to jurisdictional claims in published maps and institutional affiliations. |
© 2020 by the authors. Licensee MDPI, Basel, Switzerland. This article is an open access article distributed under the terms and conditions of the Creative Commons Attribution (CC BY) license (http://creativecommons.org/licenses/by/4.0/).
Share and Cite
Wei, P.-L.; Hung, C.-S.; Kao, Y.-W.; Lin, Y.-C.; Lee, C.-Y.; Chang, T.-H.; Shia, B.-C.; Lin, J.-C. Classification of Changes in the Fecal Microbiota Associated with Colonic Adenomatous Polyps Using a Long-Read Sequencing Platform. Genes 2020, 11, 1374. https://0-doi-org.brum.beds.ac.uk/10.3390/genes11111374
Wei P-L, Hung C-S, Kao Y-W, Lin Y-C, Lee C-Y, Chang T-H, Shia B-C, Lin J-C. Classification of Changes in the Fecal Microbiota Associated with Colonic Adenomatous Polyps Using a Long-Read Sequencing Platform. Genes. 2020; 11(11):1374. https://0-doi-org.brum.beds.ac.uk/10.3390/genes11111374
Chicago/Turabian StyleWei, Po-Li, Ching-Sheng Hung, Yi-Wei Kao, Ying-Chin Lin, Cheng-Yang Lee, Tzu-Hao Chang, Ben-Chang Shia, and Jung-Chun Lin. 2020. "Classification of Changes in the Fecal Microbiota Associated with Colonic Adenomatous Polyps Using a Long-Read Sequencing Platform" Genes 11, no. 11: 1374. https://0-doi-org.brum.beds.ac.uk/10.3390/genes11111374