Article

GWAS Based on RNA-Seq SNPs and High-Throughput Phenotyping Combined with Climatic Data Highlights the Reservoir of Valuable Genetic Diversity in Regional Tomato Landraces

1
Dipartimento di Agraria, Università degli Studi di Sassari, 07100 Sassari, Italy
2
Centro per la Conservazione e Valorizzazione della Biodiversità Vegetale—CBV, Università degli Studi di Sassari, 07041 Alghero, Italy
3
Boyce Thompson Institute for Plant Research and U.S. Department of Agriculture—Agriculture Research Service, Ithaca, New York, NY 14853, USA
4
Global Institute for Food Security, University of Saskatchewan, Saskatoon, SK S7N 0W9, Canada
5
Dipartimento di Scienze Agrarie, Alimentari e Ambientali—D3A, Università Politecnica delle Marche, 60131 Ancona, Italy
*
Author to whom correspondence should be addressed.
Submission received: 15 October 2020 / Revised: 19 November 2020 / Accepted: 20 November 2020 / Published: 23 November 2020
(This article belongs to the Special Issue Tomato Genetics)

Abstract

:
Tomato (Solanum lycopersicum L.) is a widely used model plant species for dissecting out the genomic bases of complex traits to thus provide an optimal platform for modern “-omics” studies and genome-guided breeding. Genome-wide association studies (GWAS) have become a preferred approach for screening large diverse populations and many traits. Here, we present GWAS analysis of a collection of 115 landraces and 11 vintage and modern cultivars. A total of 26 conventional descriptors, 40 traits obtained by digital phenotyping, the fruit content of six carotenoids recorded at the early ripening (breaker) and red-ripe stages and 21 climate-related variables were analyzed in the context of genetic diversity monitored in the 126 accessions. The data obtained from thorough phenotyping and the SNP diversity revealed by sequencing of ripe fruit transcripts of 120 of the tomato accessions were jointly analyzed to determine which genomic regions are implicated in the expressed phenotypic variation. This study reveals that the use of fruit RNA-Seq SNP diversity is effective not only for identification of genomic regions that underlie variation in fruit traits, but also of variation related to additional plant traits and adaptive responses to climate variation. These results allowed validation of our approach because different marker-trait associations mapped on chromosomal regions where other candidate genes for the same traits were previously reported. In addition, previously uncharacterized chromosomal regions were targeted as potentially involved in the expression of variable phenotypes, thus demonstrating that our tomato collection is a precious reservoir of diversity and an excellent tool for gene discovery.

1. Introduction

Tomato (Solanum lycopersicum L.) is a major vegetable crop worldwide and a widely used model species in genomic studies and breeding. The rapidly increasing availability of genomic data has allowed researchers to bypass the limitations of a single reference genome and has facilitated development of a pan-genome that represents the genetic diversity of cultivated and wild tomato species [1]. Recent groundbreaking studies have shown how the integration of widely variable tomato collections and multi-omics tools can contribute to advances in population genomics, domestication and plant evolution studies [2,3,4].
Our interest in tomato derives from the relevance of this crop for the Mediterranean area, where Italy is the leading European tomato producer, with an overall production in 2019 of ~6 million tons and a harvested area of ~100,000 ha (FAOSTAT, 2018; ISTAT, 2018, 2019). In Sardinia in particular, together with artichoke, tomato is the most important horticultural crop species, with numerous landraces still cultivated locally by farmers. This is of special relevance if we consider that landraces might be directly used in marginal environments or exploited in future breeding programs as a reservoir of genes that underlie quality and productive traits that can be used to increase the performance of modern cultivars and to boost sustainable agriculture [5,6,7,8,9]. As noted by Lin and colleagues [2], modern tomato cultivars have arisen following years of domestication and breeding, which have progressively reduced the genomic diversity, together with the chances of improving the species through conventional breeding. Therefore, it is important that researchers work to preserve and expand the genetic diversity through the analysis of local and regional genotypes. The results of these studies will help in disentangling the role of different genes in the expression of important agronomic traits [2,10,11]. Transcriptomic data, in particular, have been used to both compare expression profiles (expression quantitative trait loci (eQTLs)) in plant populations at different development stages, and genotype (using RNA-Seq–derived single nucleotide polymorphisms (SNPs)) germplasm collections that can be used in genome-wide association studies (GWAS) and genomic selection analyses [10,12,13].
Genome-wide association studies have become a powerful tool to investigate and link the huge available amounts of genome sequence variation data with measurable phenotypic variations [2,3,4]. Recent examples in tomato can be found for conventional fruit and plant traits and metabolites [2,3,14,15,16]. Typically, GWAS is performed by using a single-locus mixed linear model (MLM) that incorporates both population structure and kinship to limit false genotype–phenotype associations [17]. Concurrent with the increased use of GWAS, continuous improvements are being implemented to overcome computational limits and additional pitfalls [17,18,19,20,21,22]. For example, multilocus mixed linear models (MMLMs) are considered more appropriate when complex traits are investigated, because these incorporate multiple markers simultaneously as covariates in a step-wise MLM [19]. An improved multilocus model, known as fixed and random model circulating probability unification (FarmCPU), can help to remove the confounding effects between markers incorporated into the model and kinship [21]. A further method that does not require population structure information was also designed, known as the quantitative trait cluster association test (QTCAT); when compared to standard GWAS, QTSAT revealed novel associations [22].
Here we used both conventional MLM and the two alternative models, FarmCPU and QTCAT, to scan an ad hoc assembled population of 120 tomato varieties that were mostly landraces for relevant associations among 2470 RNA-Seq–derived SNPs and traits of interest. In this “multi-omics” era, where DNA sequence data are easily acquired, phenotypic data are becoming the limiting factor. For this reason, we have here mainly addressed our efforts at thoroughly characterizing this population. Accordingly, the aim of the present study was to link the diversity observed at the phenotypic level with that observed at the transcribed genome level. To achieve this goal, we used three different GWAS approaches that provided an output of 536 significant associations related to plant and fruit morphophenological traits, fruit quality and response to climate. With the present study, we are acknowledging the value of this tomato collection for future gene-function, genome-editing and crop-breeding studies.

2. Materials and Methods

2.1. Plant Materials and Experimental Design

We investigated a collection of 126 cultivated tomato (Solanum lycopersicum L.) accessions that comprised 64 landraces from Sardinia, 8 landraces from other regions of Italy, 43 landraces from different countries and 11 vintage or modern cultivars (Supplementary Table S1). The Sardinian landraces were mainly collected during 2006 and 2007, after being cultivated locally for ≥30 years, according to the farmers [23]. Forty-three landraces were provided by the Centre for Genetic Resources (CGN), Wageningen University (Wageningen, The Netherlands) and 14 accessions were kindly provided by Prof. Andrea Mazzucato, University of Tuscia (Viterbo, Italy), as specified in Supplementary Table S1.
We characterized the accessions phenotypically across two experimental trials that were run in Sardinia (Italy) during 2012 and 2013. We conducted the open-field trial in 2012 at Oristano, according to a randomized complete block design with five replicates, 124 treatments (accessions) and four plants per plot. The field trial started in June and the full mature fruit were harvested in September. In 2013, we set up the second trial from January to July in a greenhouse in Ottava (Sassari); a randomized complete block design was again used, with three replicates, 126 treatments (accessions) and three plants per plot.

2.2. Phenotypic Analysis

We used 26 conventional morphophenological traits (Supplementary Table S2) to characterize the plants and fruit of each accession, with the recording of: Days to flowering from sowing date (DTFs, days), days to flowering from transplanting date (DTFt, days), flowering-ripening interval (FRI, days), plant growth type (PGT, score), number of flowers per inflorescence (NFI), inflorescence type (ITP, score), stigma exertion (SE, score), leaf attitude (LAT, score), leaf length (LLE, cm), leaf width (LWI, cm), leaf length-to-width ratio (LL/W), foliage density (FD, score), fruit weight (FWG, g), fruit length (FLE, cm), fruit width (FWI, cm), fruit length-to-width ratio (FL/W), fruit color (FCO, score), fruit shape (FSH, score), green shoulder (GRS, score), pistil scar shape (PSS, score), blossom end shape (BES, score), cross-sectional shape (CSS, score), number of locules (NOL), puffiness appearance (PUF, score), pericarp thickness (PTK, mm) and degrees Brix (BRIX, Bx). These descriptors were chosen from the guidelines of Bioversity International (http://tinyurl.com/n7k75m6).
In addition to these conventional descriptors, we carried out digital phenotyping on the mature fruit collected in 2013 using the Tomato Analyzer software [24,25]. For each accession, we analyzed three longitudinal and three transversal sections for a total of six fruit. The 300 dpi JPEG images were acquired with a scanner (Mustek Must A3 600S, Mustek Europe B.V., Oosterhout, The Netherlands) and analyzed morphometrically with the Tomato Analyzer v. 3 software [24,25,26]. We chose 44 traits (Supplementary Table S2) from the attribute list, 35 from the longitudinal section, representing the following main descriptors: Seven basic measurements (Perimeter, Area, Width Mid-height, Maximum Width, Height Mid-width, Maximum Height, Curved Height); three fruit shape indices (Fruit Shape Index External I, Fruit Shape Index External II, Curved Fruit Shape Index); three blockiness measures (Proximal Fruit Blockiness, Distal Fruit Blockiness, Fruit Shape Triangle); three homogeneity measures (Ellipsoid, Circular, Rectangular); four proximal fruit end shape indices (Shoulder Height, Proximal Angle Micro, Proximal Angle Macro, Proximal Indentation Area); four distal fruit end shape indices (Distal Angle Micro, Distal Angle Macro, Distal Indentation Area, Distal End Protrusion); six asymmetry measures (Obovoid, Ovoid, V. Asymmetry, H. Asymmetry Obovoid, H. Asymmetry ovoid, Width Widest Position); and five internal eccentricity measures (Eccentricity, Proximal Eccentricity, Distal Eccentricity, Fruit Shape Index Internal, Eccentricity Area Index). Nine traits were selected from the transversal section: Six basic measurements (Perimeter, Area, Width Mid-height, Maximum Width, Height Mid-width, Maximum Height); and three traits specific for the transversal section (Lobedness Degree, Pericarp Area, Pericarp Thickness). The settings were: Centimeters as units; for blockiness, position 0.9 was used as the upper position and 0.1 as the lower position, unless otherwise requested in a few specific cases; for proximal and distal angles, 20 degrees was used as the macro distance and three degrees as the micro distance (unless otherwise requested in a few specific cases).

2.3. Carotenoids

We extracted the carotenoids from three replicates of each accession (one per block), at both the breaker stage (i.e., early ripening), when the fruit are still rich in chloroplasts and the red-ripe stage, when the fruit accumulate large quantities of carotenoids, for a total of 762 samples. All of the harvested fruit at the breaker and red-ripe stages were healthy and uniformly colored within their stage. An example of the two ripening stages is shown in Supplementary Figure S1. At ripe stage, accessions with mature orange, yellow or pink fruit were harvested when the color reached maximum intensity. The harvested fruit were left for 6 h on a laboratory bench at room temperature to reduce harvest stress and ethylene production. Then they were cut into halves and separated from the seeds, frozen in liquid nitrogen and stored at −80 °C.
Frozen flesh samples from each fruit stage were rapidly homogenized and carotenoids extraction performed as described in [27]. Carotenoid detection was performed on a Summit HPLC system with a photodiode array detector (PDA-100; Dionex, Sunnyvale, CA, USA). Spectra were collected at 286 nm, 450 nm and 471 nm and pigments were identified via co-migration with purified standards and/or by their pigment-specific absorbance spectra. The list of carotenoids analyzed for each stage is shown in Supplementary Table S2.

2.4. Climatic Data

For each accession for which geographic coordinates were available (108 accessions), climatic data were also downloaded relative to each collection site. Bioclimatic variables were used for further comparative analyses with phenotypic and molecular data, as they are considered more biologically meaningful than monthly temperatures and rainfall. Indeed, they describe annual temperature and precipitation trends, seasonality or extreme environmental factors (e.g., temperature of the coldest and warmest month or precipitation of the wettest and driest quarters). The DIVA-GIS 7.5 software (http://www.diva-gis.org/) was used to extract ecological data from the free-access database at http://www.diva-gis.org/climate.

2.5. Transcriptome Sequencing and SNP Calling

Transcriptome sequencing was performed on 120 of the 126 accessions cultivated during the green-house trial in 2013. The fruits used for RNA extraction were the same used for carotenoid extraction (see above) Total RNA was extracted using RNeasy Plant Mini kits (Qiagen, Hilden, Germany) from full-ripe tissue samples previously frozen at −80 °C and homogenized. Strand-specific RNA-Seq libraries were constructed using a protocol described in [28] and 51-bp-long single-end reads were sequenced using a HiSeq 2000 platform (Illumina, San Diego, CA, USA). Raw RNA-Seq reads were processed to trim low-quality and adapter sequences using Trimmomatic [29]. The resulting cleaned RNA-Seq reads were aligned to the “Heinz” reference genome (version SL2.40) using STAR [30]. Duplicated reads in each RNA-Seq library were marked using Picard (http://broadinstitute.github.io/picard/) and only uniquely mapped reads were kept. SNPs were then identified based on the mpileup files generated by SAMtools [31]. The resulting raw SNPs (73,859) were filtered to exclude those with missing rate >0.9 and minor allele frequency <0.03, which obtained a final dataset of 2470 SNPs for downstream population genomic and GWAS analyses.

2.6. Statistical and Population Genomic Analyses

Ranges and mean values were calculated by site for each accession on quantitative conventional descriptors, Tomato Analyzer descriptors and carotenoid contents. Analysis of variance (ANOVA) was then performed on the conventional descriptors collected from the 122 accessions shared among the two sites. To test for significant variations among environments and genotypes and to estimate the size of the genotype by environment interaction (GxE) we used the model given in Equation (1):
Yijr = μ + Gi +Ej + G*Eij + Br(Ej) + εijr
where Yijr is the observation of the ith genotype, in the jth environment and block replicate r, μ is the grand mean, Gi is the effect of the ith genotype, Ej is the effect of the jth environment, G*Eij is the interaction of the ith genotype with the jth environment, Br(Ej) is the effect of the rth replicate in the jth year and εijr is the random error.
The adjusted means (as the best linear unbiased predictors (BLUPs)) and the broad sense heritability were also calculated across sites for the quantitative conventional descriptors and within sites for the Tomato analyzer descriptors and the carotenoid contents. To calculate these statistics, we have fitted a mixed linear model based on the restricted maximum likelihood method with years as fixed effects and genotypes and blocks as random effects using Equation (2):
Yijr = μ + Gi +Ej + Br(Ej) + εijr
where Yijr is the observation of the ith genotype, in the jth environment and block replicate r, μ is the grand mean, Gi is the effect of the ith genotype, Ej is the effect of the jth environment, G*Eij is the interaction of the ith genotype with the jth environment, Br(Ej) is the effect of the rth replicate nested in the jth year and εijk is the random error.
The expression given in Equation (3) was used to calculate the statistics:
H2B = σ2g2p
where σ2p = σ2g + (σ2 ge/ne) + (σ2ϵ/ne⋅nr) for heritability across the two sites and σ2p = σ2g + (σ2ϵ/ne⋅nr) for heritability calculated by site, and where σ2g is the genotypic variance, σ2p is the phenotypic variance, σ2 ge is the genotype by environment interaction, ne is the number of environments, σ2ϵ is the residual variance and nr is the number of replicates.
All the above statistical analyses were carried out using R dedicated packages (lme4 and car) [32].
The Shannon–Weaver index was used to evaluate the diversity among the qualitative traits [33]. GenAlEx 6.5 [34] was used to calculate the formula H’ = i = 1 n p i l o g b , where pi is the frequency proportion of the descriptor state and b is the base of the logarithm. Most studies use natural logarithms, although some use base 2 (which makes no significant differences). Each value was normalized by dividing it by its maximum value (log2n, where n is the number of states) to keep the values between 0 and 1. Pearson’s correlations were estimated among the different traits using the cor standard R function and plotted using the corrplot package [35]. Principal component analysis (PCA) and cluster analysis based on all of the morphophenological and quality traits were also performed. The PCA results were plotted using a modified version of the ggbiplot package (https://github.com/vqv/ggbiplot). The Hopkins statistic [36] was used to assess the clustering tendency and the most likely number of groups was detected using the NbClust R package [37]. The Euclidean distance and the Ward method were used to draw the clusters and the results were plotted using the factoextra R package (https://cran.r-project.org/web/packages/factoextra/index.html).
Genetic diversity analyses were performed using GenAlEx 6.5 [34] and Arlequin vs. 3.5.1.2 [38], to calculate the main diversity statistics: Number of observed (Na) and expected (Ne) alleles, number of private alleles (PAs), expected heterozygosity (He) and unbiased expected heterozygosity (uHe). Hierarchical analysis of molecular variance (AMOVA) was performed to evaluate the partitioning of the genetic variance into, among and within groups of accessions, defined as: Sardinian landraces (SLRs), exotic landraces (ELRs) and modern or vintage cultivars (CVs). Genetic distances among groups were also calculated by pairwise FST values and also proportion of shared alleles between pairs of sub-populations.
A Mantel correlation test was then used to compare the genetic and phenotypic distances using the mantel.rtest function of the ade4 R package; 9999 permutations were used to evaluate the significance of the test. The phenotypic distances were those obtained to draw the clustering plot, while the genetic Nei minimum distances were obtained using the R adegenet [39] and popr packages (URLhttps://grunwaldlab.github.io/poppr).
To investigate population structure, we used the model-based clustering method, as implemented in Structure vs. 2.3.4 [40], and discriminant analysis of principal components (DAPC), implemented in the adegenet package for the R software [39]. The first method is a model-based approach that assigns each individual to different groups according to a membership coefficient (qi). We used an admixture model with the options “correlated allele frequencies among populations” and “infer the degree of admixture (a) by the data”. For each K (number of hypothetical populations), 20 runs (burn-in length, 100,000; iterations, 200,000) were carried out and the most likely number of K was determined using the method from Evanno et al. (2005), as implemented in the online program STRUCTURE Harvester [41]. The second method does not require any a priori knowledge of the population genetics model and among other advantages, it requires low computational effort to analyze large datasets and provides reliable assignment of individuals to groups [39]. The method uses PCA to transform the data and performs discriminant analysis on the principal components retained, thus also allowing easy graphical representation of the relatedness between the inferred groups. To run these analyses, we filtered the dataset of 2470 SNPs by clumping, to maintain only those with reduced pairwise linkage disequilibrium (r2 < 0.2). To filter the dataset, we used the R package bigsnpr [42], to obtain a dataset of 649 unlinked SNPs.
To further evaluate the structure of the population, we estimated the familial relatedness and linkage disequilibrium (LD) levels of the tomato collection by calculating the pairwise kinship coefficients as obtained from TASSEL 5.2.42 [43]. We then determined the intrachromosomal LD using both uncorrected estimations and estimates corrected for population structure and familial relatedness. In the first case, the classical r2 measure was calculated; in the second case, the r2 unbiased estimates were corrected by the structure of the sample (rs2), the relatedness of the individuals (rv2) or both (rvs2). These methods were implemented in the LDcorSV R package [44]. Pairwise distance between loci was calculated using LD-vignette included in the Bioconductor package snpStats implemented in R [45,46]. We then plotted the LD r2 data against the genetic distance and fitted the LD decay line as in [47], adapting an R script to our data (https://fabiomarroni.wordpress.com/). The regression line is based on [48] and the parameter C was calculated by using SneP, a program designed to easily estimate effective population size from genome-wide SNP data or directly from LD levels [49].
To identify the critical value of LD (r2 value) across our tomato population above which loci can be assumed to be associated, we used the method from [50]. Here, the LD threshold below which markers can be defined as unlinked and is defined based on the 95th percentile of a normalized distribution of markers located on different chromosomes. The intersection point between the regression line and the LD significance threshold was used to indicate the LD decay overall and along each chromosome.

2.7. Genome-Wide Association Studies

Genome-wide association studies were performed on the BLUPs of all of the collected traits by fitting a MLM implemented in GAPIT v.3 [51], which accounts for kinship (genotype relatedness) and population structure. To explore farther marker-trait associations, we used FarmCPU, also implemented in GAPIT v.3 [21,51]. FarmCPU is a modified multilocus mixed model approach that enhances the false-discovery rate and the QTL detection power by incorporating one or several markers as cofactors in a stepwise MLM, thus removing the confounding between testing markers and kinship; see e.g., [19]. Liu et al. [21] divided the modified multilocus mixed model approach into two parts: A fixed effect model and a random effect model, using these iteratively. To control for false positives, the fixed effect model tests markers one at a time and uses multiple associated markers as covariates. To limit an overcorrection of the model, the associated markers are then estimated in a random effect model and used to define kinship. To perform MLM and FarmCPU analyses, no missing data are allowed and we therefore imputed the missing phenotypic data using the phenix package implemented in R [52]. We also performed a relatively novel GWA analysis using QTCAT [22], a method that does not require population structure information to detect associations between markers and traits. This method, has been designed to overcome the limitations of single-locus MLM models that while correcting for population structure and genotype relatedness, cannot entirely avoid yielding spurious associations between a marker and a phenotype [22]. In particular, this QTCAT groups markers into clusters of correlated markers while simultaneously associating them to the phenotype and therefore it does not require any correction for the population structure.

3. Results

3.1. Phenotypic Traits Analyses

The ANOVA performed on the conventional quantitative phenotypic traits using year (Y), genotype (G) and genotype × year (G × Y) interactions as effects of the model revealed significant differences among the genotypes between the years, except for FWG, NFI and LWI (Table 1); significant strong variance (p < 0.001) was also observed for G and G × Y interaction effects (Table 1). The broad sense heritability (h2B) calculated across sites and by site also varied among conventional traits (Table 1). In particular, h2B varied between 11.8% for FRI and 85.8% for FL/W. When calculated within the year, h2B varied among the traits, with higher values were generally observed in 2013 than in 2012. Nonetheless, on average, h2B was stable between the years, with mean h2B values of 57.3% in 2012 and 59.5% in 2013. Wide and significant (p < 0.001) differences were observed in both 2012 and 2013 when looking at the differences among the genotypes, as shown by the mean, maximum and minimum values of the conventional quantitative traits (Supplementary Table S3).
Substantial variation was detected also for the conventional qualitative traits, as indicated by the Shannon–Weaver index (H’) (Supplementary Table S4). Almost all of the traits showed the same number of variants across the 2 years, with some relevant changes seen, e.g., for green stripes, with H’ of 0.50 in 2012 that was reduced to nearly zero in 2013 (greenhouse experiment). A similar trend was also observed for leaf attitude (H’_2012 = 0.39, H’_2013 = 0.13; Supplementary Table S4).
Significant differences among genotypes were also detected for the 44 Tomato Analyzer descriptors (Supplementary Table S5). Broad sense heritability was on average higher for these traits, with the highest value for pericarp thickness (h2B = 92.21%) and the lowest for the perimeter of the longitudinal section (h2B = 36.65%) (Supplementary Table S5). The mean value for all of the traits was ~70%.
For the carotenoids, the total content was higher at the ripe stage than the breaker stage, as expected (Supplementary Table S6). At the breaker stage, the total mean content of carotenoids was 6.09 μg/g fresh weight (fw) and as a general trend there was an increase of about 20-fold with full ripeness (121.55 μg/g fw). Moreover, the ANOVA output showed that all of the analyzed compounds showed significant differences among genotypes at both the breaker stage and the red ripe stages (Supplementary Table S6).
The heritability of the carotenoids was on average lower than the other phenotypic traits, with β-carotene showing the highest values at both breaker and ripe stages (45%, 57%, respectively) (Supplementary Table S6).
Both positive and negative correlations were found among the different traits (Supplementary Figure S2), with the most significant values observed between fruit size and shape (as recorded by both conventional and digital phenotyping). As an example, fruit weight (FWG) and locule number (NOL) were strongly and positively associated (r > 0.8, p < 0.0001) with the area, perimeter and maximum width (Width_M_H_L and Width_M_H_T) of the transverse and longitudinal sections of the fruit (as registered by Tomato Analyzer). Significant correlations were also observed between carotenoid content and fruit color and size. In particular, β-carotene content was negatively correlated (r = −0.4, p < 0.001) to the mean fruit weight (FWG) at both the breaker stage and the ripe stage and it was positively correlated with the degrees Brix at the breaker stage (r = 0.43, p < 0.0001) and the ripe stage (r = 0.20, p = 0.03). Fewer correlations were detected between bioclimatic variables and the plant/fruit traits, some of which were of particular note, such as those between the traits that described fruit size (e.g., FLE, FWG, FWI, area, perimeter, Max_W_L, Max_H_L, Max_W_T, Max_H_T) and bio3 (Isothermality), bio8 (Mean Temperature of Wettest Quarter), bio12 (Annual Precipitation), bio13 (Precipitation of Wettest Month), bio 16 (Precipitation of Wettest Quarter) and bio18 (Precipitation of Warmest Quarter). The observed correlations varied from −0.45 (p < 0.001) for correlations between FLE and bio3 and bio8, to −0.27 (p < 0.005) for correlations between area and perimeter with bio12, bio13 and bio16 (Supplementary Figure S2).
Overall, a wide pattern of phenotypic variation was observed for all the traits, as shown by the PCA analysis, where the accessions were differentiated into three groups based on the hierarchical clustering obtained with the same data (Figure 1, yellow, red, green). The landraces from Sardinia were present in all of the three groups, as well as the exotic landraces and modern/vintage cultivars, thus showing that the subdivision into varietal types (i.e., ELR, SLR, CV) does not overlap with the clustering based on phenotypic variance. While we should remark that less than the 50% of the phenotypic variance is explained by the first two principal components.
The main features of the three groups can be deduced from the loading of the different traits on the first two principal components (Supplementary Table S7). Briefly, we can summarize that cluster A is constituted by plants with composite inflorescence and large fruit, with heterogeneous shapes, including both flattened and heart-shaped types, and usually characterized by a medium to thin pericarp and low BRIX degrees, with a higher cis-lycopene content. Cluster B mainly includes varieties of small size, mainly round shaped with a medium pericarp, high sugar content, high β-carotene (at both breaker and ripe stages) and low puffiness. Cluster C is mainly comprised of varieties of small/medium size, elongated fruit, with thick pericarp and intermediate phenotypes for sugar content.

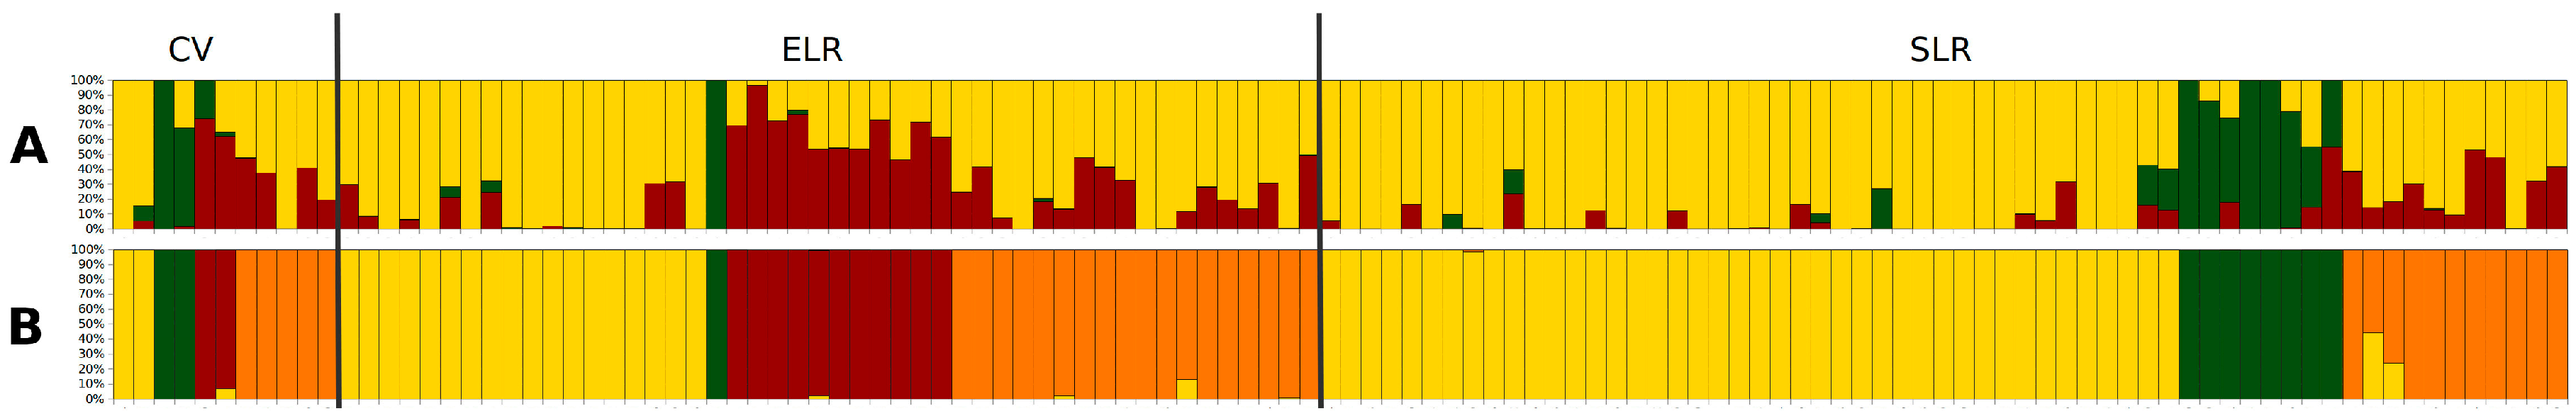
3.2. Genetic Diversity and Structure

Table 2 gives the summary of the genetic diversity indices that indicate overall gene diversity (uHe) of 0.18, gene diversity that is the same for the Sardinian and exotic landraces (uHe = 0.16) and higher gene diversity within the group of cultivars (uHe = 0.29).
The genetic differentiation (FST) among the groups was 0.07 on average and was always statistically significant. Moreover, the proportion of shared alleles indicated higher similarity between SLR and ELR than between CV and ELR (Table 3). On the other hand, SLR and ELR showed 11 and 50 private alleles, respectively, while only one private allele was detected in CV (Supplementary Table S8).
The partitioning of the SNP variance (AMOVA) indicated that only 4% of the total variation was due to a statistically significant differentiation (p < 0.001) among populations. This thus indicates that more than 96% of this diversity is due to the genetic variation among accessions within groups, either from different countries of the world or from a single country or region (e.g., Sardinia).
Based on the Bayesian approach, the most likely number of genetic groups within this tomato population was three (Supplementary Figure S3a), while the DAPC method indicated four genetic groups (Supplementary Figure S3b). Looking in detail at these results, we found significant association between the methods in the assignment of the different accessions to the different genetic groups (Χ2 = 194.0, p < 0.0001). Indeed, if we do not consider the admixed individuals, the same accessions were attributed to the green and red genetic groups shown in Figure 2 by both methods, while the accessions attributed to the yellow group by STRUCTURE were split into two groups by DAPC (Figure 2, yellow, orange).
When looking at the composition of each genetic group, landraces from ELR and accessions from CV were assigned to all the three groups detected by STRUCTURE and to the four groups detected by DAPC. The main difference among the three varietal groups was seen for SLR, which showed rare occurrence of the red genetic group in Figure 2. This is evident at both K3 (STRUCTURE), where we observed a low level of membership of the SLR accessions to the red group and at K4 (DAPC), where there are no red bars. We further investigated whether there was any correlation between the genetic groups and the phenotypic clusters and despite the significant relationships between the genetic and phenotypic distances (Mantel test correlation = 0.38, p = 2 × 10⁻⁴; 9999 permutations), the genetic and phenotypic clustering do not completely overlap (Supplementary Figure S4).

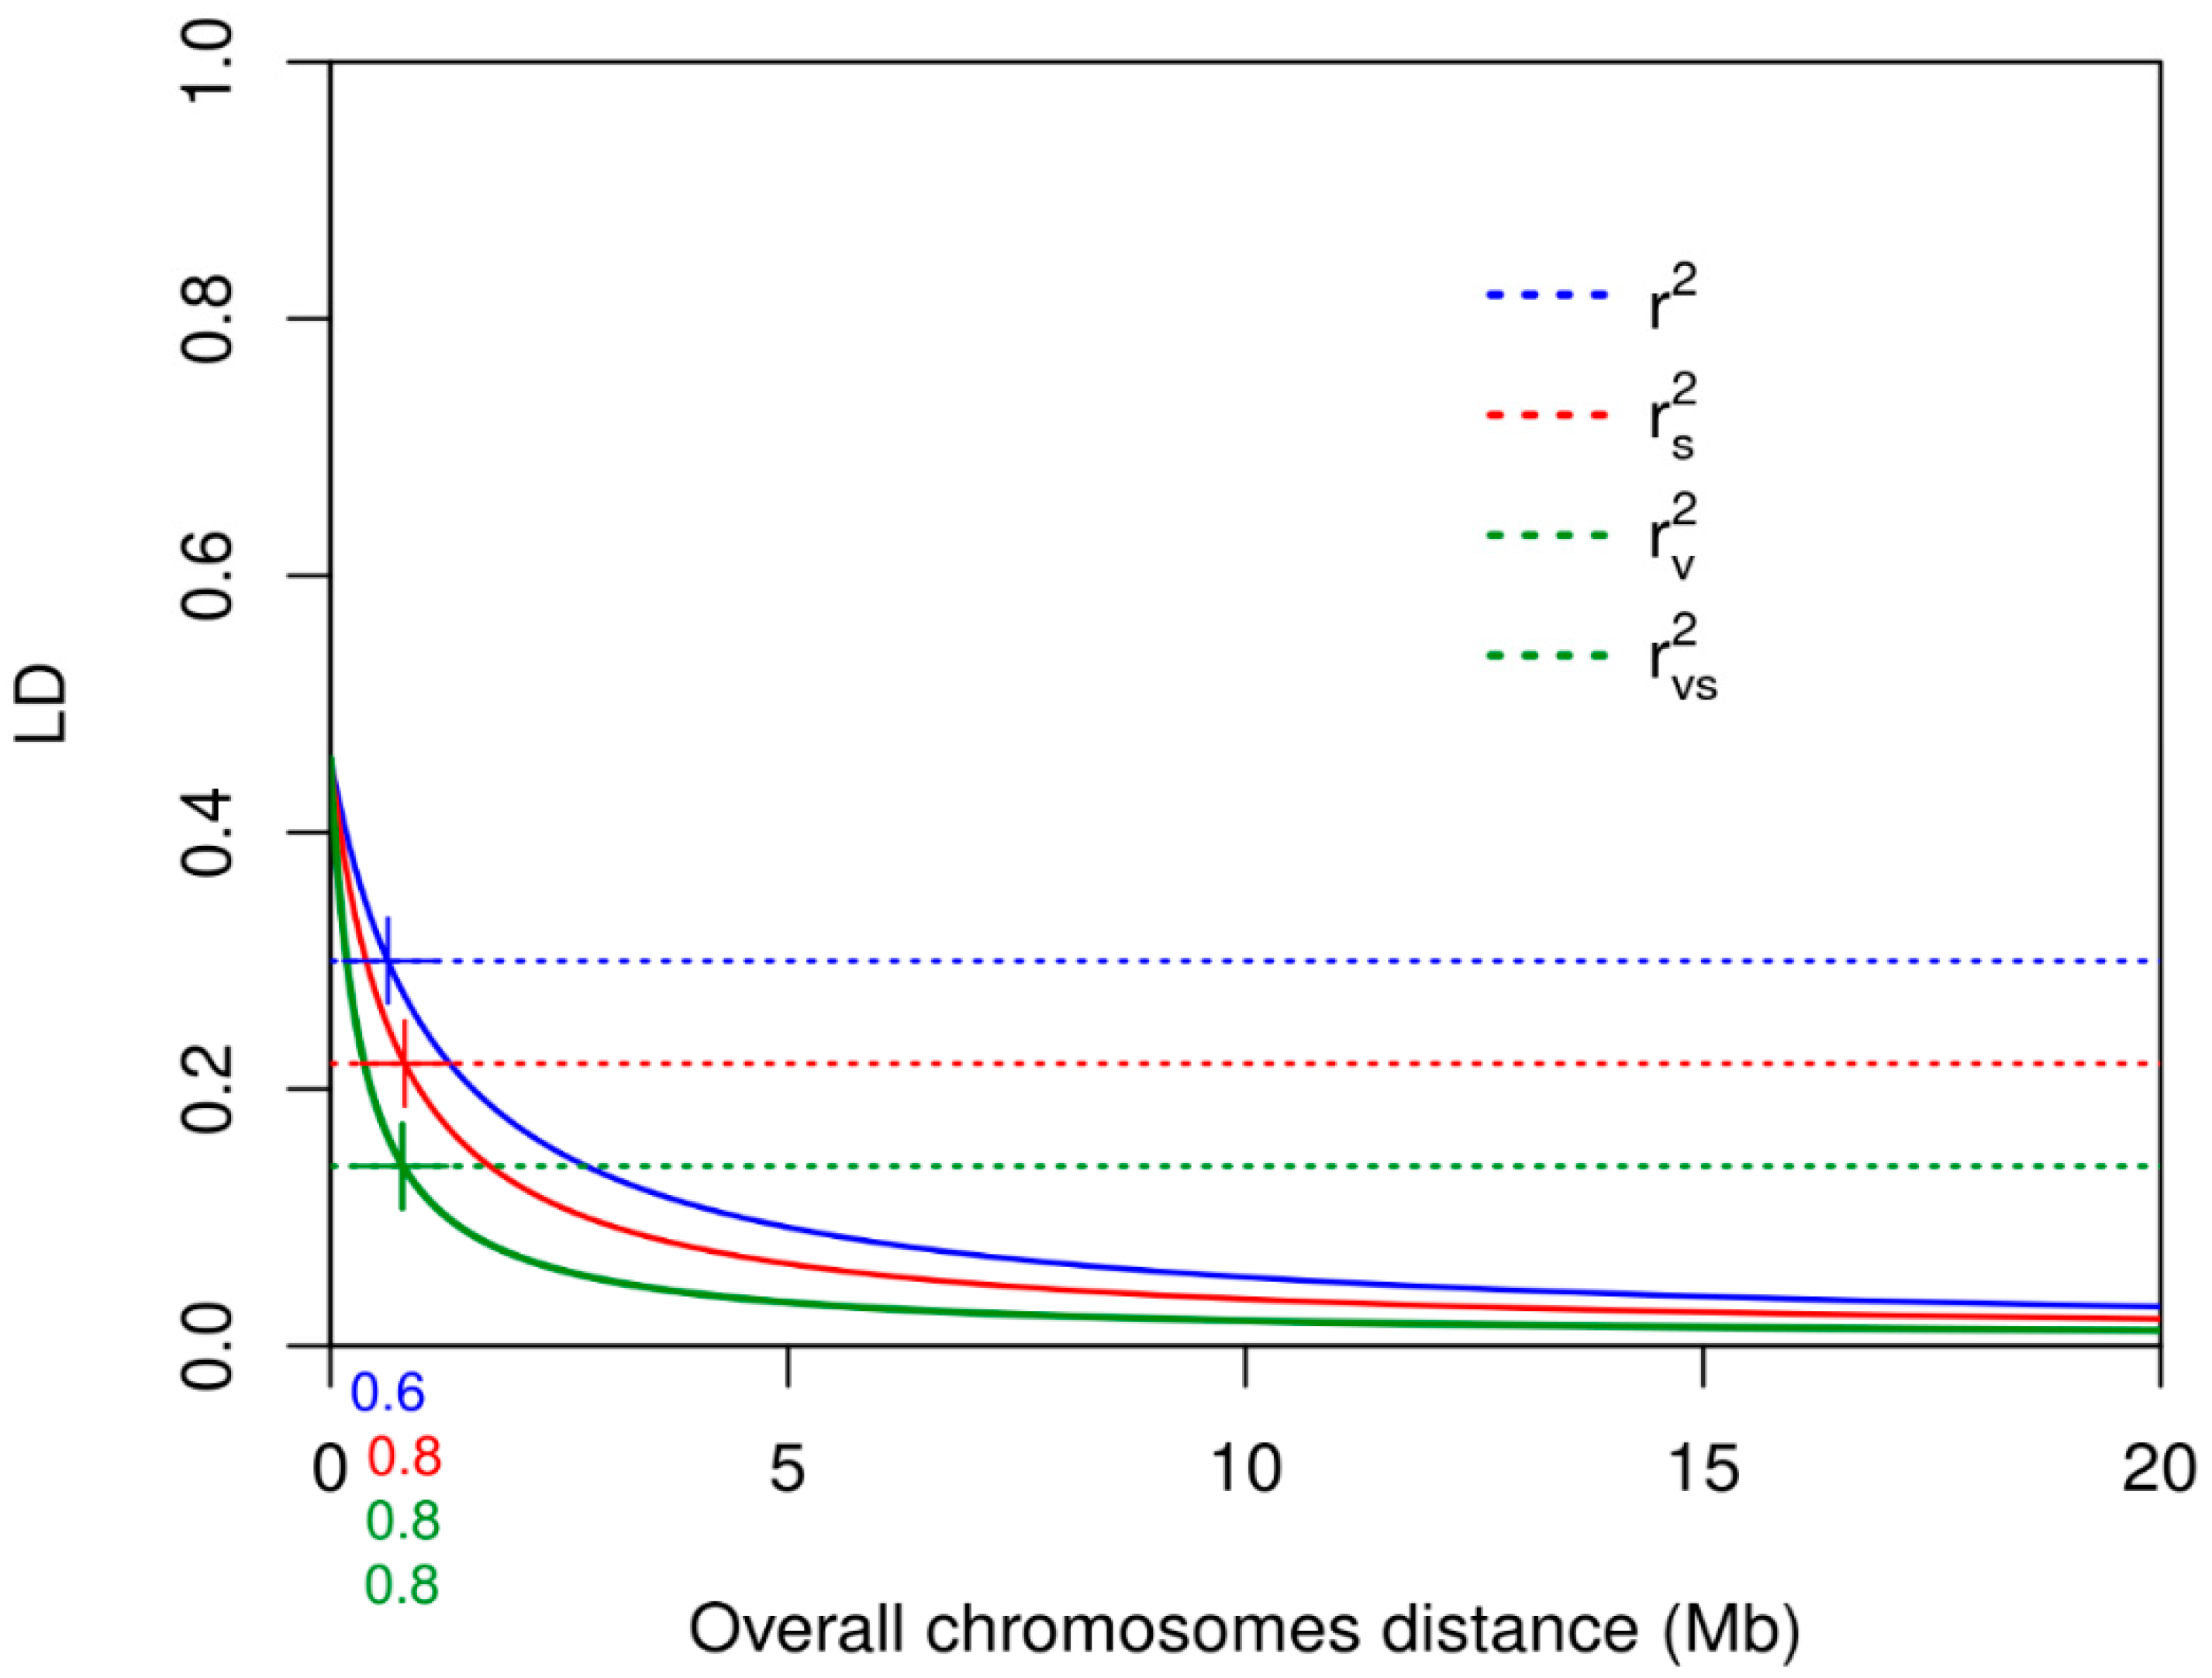
3.3. Linkage Disequilibrium

Linkage disequilibrium that was calculated using the usual pairwise correlation measure (r2) was higher than the r2 measure corrected for population structure (rs2), kinship (rv2) and both population structure and kinship (rvs2). These were seen as r2 > rs2 > rv2 > rvs2; rv2 and rvs2 LD were very similar overall and within each chromosome (Table 4, Supplementary Figures S5 and S6).
We plotted the r2, rs2, rv2 and rvs2 values against the genomic distances and modeled the LD decay for each chromosome (Figure 3) and the LD decay was determined at the intersection point between the regression curves and the LD thresholds. While the mean values of LD were lower for kinship corrected values, LD decayed at slightly higher distances for rs2 (1.40 Mb) and rv2 (1.37 Mb) than for standard r2 (1.06 Mb). This output was more evident within chromosomes for the rs2 decay.
Some differences were also observed for LD decay among the different chromosomes, with lower LD decay distances for chromosomes 1, 3, 8 and 10, while the highest decay distances were for chromosome 5 (Table 4.

3.4. Genome-Wide Association Studies

For clarity, we present the GWAS results according to trait investigated, as climate variables, fruit quality and fruit shape and size detected by conventional phenotyping and digital phenotyping, plant growth, inflorescence, leaf traits and phenology (Table 5; Supplementary Table S9). To interpret the GWAS results, we used chromosomal LD to determine the distance beyond which LD decay risked the possibility of spurious associations.
Among all the investigated traits, 536 marker trait associations (MTAs) were detected within 203 genes, 23 of which are genes (or homologs to Arabidopsis genes) that encode transcription factors (Table 5; Supplementary Tables S9 and S10). Among these 536 MTAs, 265 were detected by FarmCPU, 40 by GAPIT_MLM and 231 by QTCAT. Here, different SNPs were simultaneously detected by more than one method (Supplementary Table S9).

3.5. Fruit and Plant Traits

In particular, the highest number of MTAs (388) was detected for fruit size and shape (derived from both conventional and digital phenotyping; Table 5). Among the 165 MTAs detected for tomato fruit size, 86 indicated a subset of 13 genes that were shared between the two sets of traits. Among the 223 MTAs detected for fruit shape by both phenotyping methods, 72 where located within 12 genes.
Among the interesting MTAs we identified by both QTCAT and FarmCPU, one SNP (ch1_22) is located within the gene Solyc01g010440, which in addition to leaf size, was associated to multiple fruit traits (mainly related to fruit size) (Supplementary Tables S9 and S10). This gene was located 0.3 Mb from the CRABS-CLAW gene that encodes a YABBY transcription factor. On chromosome 2, one SNP was particularly relevant for fruit shape (ch2_151), which was detected by the three GWA models as associated to several traits (e.g., fruit shape, fruit size, BRIX, shape of pistil scar, shape of transverse section) and was located within the gene Solyc02g081700, which encodes a proteasome subunit α type protein, 13 kb from an ANANTHA gene (Supplementary Tables S9 and S10).
Among the genomic regions that influenced variation of fruit traits, an MTA on chromosome 4 (ch4_31) was 28 kb from a TONNEAU1 Recruiting Motif (TRM) gene that has been previously shown to influence final fruit shape [53].
On chromosomes 6 to 10, we detected more relevant MTAs for fruit size and shape, of which six were located within genes that encode transcription factors and others were either located near genes that influence fruit setting (OVATE-like, WUSCHEL-related, YABBY-like) or in regions where no genes determinant for the investigated fruit traits were found (Supplementary Table S9). On chromosome 11, there were other regions associated to fruit size and shape, among which the most significant was detected around 52 Mb, where the FASCIATED gene is located. FASCIATED has been extensively studied in tomato, where mutations to this gene result in altered floral meristem size and locule number [54,55,56,57,58].
Among the associations detected for quality traits, we found a relevant region on chromosome 1 (at 71 Mb) where three SNPs (ch1_38-40) were associated to fruit color and β-carotene content (Supplementary Table S9). These SNPs are located at 165 kb from Solyc01g079620, a SlMYB12 gene that influences accumulation of the yellow-colored flavonoid (naringenin chalcone) in tomato fruit [59]. These MTAs were detected by MLM and FarmCPU.
Other relevant MTAs were detected for sugar content and other fruit quality traits. Among these, one is located within the gene Solyc02g081700, above mentioned for its association with different fruit size and shape traits and one located within Solyc06g066320, the gene encoding for a transcription factor homolog of Arabidopsis thaliana IWS1 (INTERACTS WITH SPT6) [60]. This gene was also associated to other traits related to fruit size and shape and inflorescence.
Marker-trait associations that correlated with other plant traits were also detected, such as growth habit, leaf traits and inflorescence traits. For plant growth, we found one SNP on chromosome 1 (ch1_153) within Solyc01g108020, a gene that encodes a thioredoxin M3, and one on chromosome 10 within Solyc10g084400, which encodes a glutathione S-transferase (Supplementary Table S9). These MTAs were located at 206 kb and 27 kb, respectively, from genes that encode an AP2-like ethylene-responsive transcription factor (AP2/ERF). Moreover, on chromosome 11 we detected a SNP (ch11_49) within a DELLA gene (Solyc11g011260) that encodes a gibberellic acid insensitive (GAI) transcription factor (Supplementary Table S9). The gene product belongs to a family that has been shown to have a role as redox regulator in hormone signaling pathways of different plant species, including Arabidopsis, rice and tomato [61,62,63,64,65].
Marker-trait associations for leaf size were also identified that included an MTA for leaf length within Solyc04g080730, at 31 kb from Solyc04g080780 and 35 kb from Solyc04g080790, two BEL-like homeodomain genes [66]. BEL-LIKE genes have been shown to influence leaf development and morphology in many plant species, such as Arabidopsis and tomato [66,67,68]. More significant associations were found for flowering time (ch1_22, chr2_155, chr3_33), as well as for inflorescent type and number. In particular, looking at chromosome 11, two SNPs were located within Solyc11g010490 at 82 kb from the J-1 gene, a MADS-box 512 transcription factor implicated in the differentiation of the pedicel abscission zone and the 513 maintenance of the inflorescence meristem [69,70] and a further one within Solyc11g071680, which encodes a serine/threonine kinase (homolog of the Arabidopsis TOUSLED). This is particular interesting because it encodes a serine/threonine protein kinase that is required for leaf and flower development and is involved in the regulation of RNA interference [71,72]. These functions are congruent with the other marker-trait associations that we have detected for this gene (i.e., fruit size and shape).

3.6. Climatic Data

Genome-wide association analysis on bio-climatic data relative to each collection site resulted in numerous MTAs distributed among all of the chromosomes (Table 5). Among these MTAs detected, one on chromosome 2 (ch2_130) is located within Solyc02g071510, a transcription factor GTE12, which is associated with bio13, bio15 and bio16 (i.e., precipitation of wettest month, precipitation seasonality, precipitation of wettest quarter). The T allele of ch2_130 is private to the exotic landraces group (Supplementary Table S8). On chromosome 3, we found two more loci with an allele private to exotic landraces. Both of these MTAs were associated with isothermality and were detected within Solyc03g117760 and Solyc03g121660, genes that encode an un-known protein and a homolog of a zinc-finger protein, respectively (Supplementary Table S9).
We identified three additional MTAs associated with precipitation on chromosome 3. The loci ch3_275 and ch3_276 were correlated to bio 13 (i.e., precipitation of wettest month) and were both identified within Solyc03g121000, a gene encoding a PAF1-like protein (Supplementary Table S9). This protein regulates all stages of the RNA polymerase (Pol) II transcription cycle and in Arabidopsis it has been shown to transcriptionally regulate FLOWERING LOCUS C [73,74].
On chromosome 5, we detected a high number of MTAs. One within Solyc05g015510 that it is associated with precipitation (i.e., precipitation of driest month) and encodes SlySBP10 a SQUAMOSA promoter-binding protein (Supplementary Table S9). This protein family has key roles in plant growth and development, including flowering time, shoot architecture and fruit setting and ripening [75,76,77,78]. We singled out other MTAs along the remaining chromosomes in regions that might be involved in responses to different climatic factors. Examples include Solyc06g083150, located 127 kb from a FRIGIDA-like gene. In Arabidopsis, FRIGIDA regulates flowering transition (vernalization) by activating a central flowering repressor that is encoded by flowering locus C [79]. Others are Solyc07g055660, located 26 kb from a heat-stress transcription factor; Solyc08g076930, a transcription factor for jasmonic acid 3 that is 72 kb from a RAMOSA transcription factor (Supplementary Table S9). In maize, RAMOSA genes act during early inflorescence development and determine the fate of axillary meristems [80].

4. Discussion

We have here investigated the value of a wide collection of tomato landraces for association mapping and detection of both novel loci and candidate genes that might be useful for designing future genomic-based breeding strategies or tomato gene-editing approaches. The collection is enriched by Italian, in particular Sardinian, landraces that represent a wealth of genetic local resources that might be exploited in future conservation and breeding studies. We investigated the collection in different environments and for different traits, including bio-climatic variables recorded for the country of cultivation. We also tested three different GWA methods to determine whether relevant differences might emerge from conventional and digital phenotyping.

4.1. Phenotypic and Molecular Diversity

The diversity levels and heritabilities measured across phenotypic traits showed that our tomato collection is adequate for GWAS. We have, indeed, shown that these materials are widely diverse for all of the investigated traits. Sardinian landraces in particular show a level of diversity similar to that of the group of exotic landraces. This is particularly relevant if we consider that the exotic landraces were chosen from among those available at the Centre for Genetic Resources (CGN, NL) to be a worldwide sample. On the other hand, the higher levels of genetic diversity observed within modern and vintage cultivars underlines that the breeding programs might have led to inclusion of different loci in these accessions [11,16].
Previous studies performed on tomato landraces and commercial cultivars using SNP markers revealed comparable levels of diversity and similar levels of heterozigosity when looking at groups of landraces from different regions [16,81,82,83]. Moreover, the partitioning of genetic variance has indicated that most of this diversity resides within varietal groups and not between them. Interestingly, novel alleles detected within both the Sardinian and the exotic landraces indicated that we have assembled a wide heterogeneous group with some unique diversity, which demonstrates the value of incorporating local and regional accessions when attempting to enrich the reservoir of crop genetic diversity. Indeed, nine of the 52 private alleles from the exotic landraces were associated with climate variables (mainly precipitation related). Private alleles are important because they indicate the presence of loci that can be exploited in future breeding and conservation programs or in genetic diversity studies [84]. For us, this is particularly interesting if we consider that these loci that are also associated to climatic variables, might be under selection. On the other hand, none of the 11 Sardinian private alleles were associated to any trait in this study.
The genetic distance observed among the groups of varieties was not high, which is consistent with the nature of domesticated tomato, for which high phenotypic but low genetic variation has been shown previously [1,11,16,85]. Concurrently, when we used all of the traits to investigate the phenotypic variation among accessions, the three main phenotypic clusters did not show any straightforward overlap with the genetic subdivision. This has been previously observed in studies on tomato and pepper [11,86]. Nonetheless, we observed a significant correlation between genetic and phenotypic distances and a clear tendency of accessions to group according to a small number of key traits, including fruit size and shape, pericarp thickness, carotenoid content and sugar content, similar to previous studies [11,16,81]. On the other hand, we did not observe any clear correlation between the genetic or phenotypic subdivisions and the provenience of our materials, as the landraces (either exotic or Sardinian) and the modern/vintage cultivars were distributed all over the detected groups.

4.2. Genome-Wide Association Study Results

The population structure and the linkage disequilibrium analyses performed prior to GWAS have further shown that our population was adequate for association analysis. While the LD levels and LD decay on some chromosomes were comparable to those from previous studies, these were quite variable among chromosomes [16,82,87]. In particular, the high levels of LD observed on chromosome 5 were similar to those from Ruggieri et al. [88], who used a set of genomic SNP markers to characterise a collection of cultivated tomatoes. To account for the high LD levels and decay on some chromosomes, following the example of previous studies [89,90], we reduced the average LD within chromosomes by correcting for population structure and genotype relatedness.
Among the methods used to perform these GWAS, FarmCPU and QTCAT shared the highest numbers of associations while the standard MLM method, showed the least number of shared associations with the other two methods. These data indicate that some associations are highly robust and detected by all methods and that weaker associations might best be identified using multiple strategies. In particular we also chose to use QTCAT to determine whether the associations detected were comparable with those from previous consolidated GWAS models [17,19,20,21]. Few studies have exploited the QTCAT model until now and results have shown consistent results with previous methods [22,91]. The present results indeed show that this method is efficient and has allowed the identification of novel associations that MLM and FarmCPU did not detect. In particular, the MLM model showed the poorest results.
Differently from many GWA studies that rely on the genomic variation, the present study was based on the transcriptome variation among genes and accessions. The RNAseq based SNPs genotyping has been proven to be valuable for QTL mapping and functional and evolutionary studies [92,93]. Concurrently, in the present study, the variation among landraces and cultivars at the RNAseq level was sufficient to detect numerous associations. Indeed, we showed the association between diverse crop traits to previously identified candidate genes and we were able to suggest that some of the target genes might either have pleiotropic effects on different traits or show co-expression due to linkage. This has also been observed in previous GWAS and QTL studies [14,15,16,94]. As our population was variegated with no clear breeding history, such as in Blanca et al. [81] and Lin et al. [2], the observed genetic diversity might reflect complex metapopulation dynamics, with some loci under divergent selection and others under balancing selection, as previously seen in tomato, sorghum and maize [95,96,97,98]. Indeed, the level and structure of the diversity of cultivated tomato derives from historical and recent gene flow between wild tomato species and cultivars that allowed the dispersal of local varieties across a wide range of environments, with a complex evolution (i.e., domestication, improvements) [2,97,99].
The GWAS results have mainly targeted genomic regions that underlie genes relevant for fruit size and shape traits. This is a direct consequence of our phenotypic analysis, which mainly focused on fruit traits, in line with the relatively thorough phenotypic characterization, as either detected by conventional or digital phenotyping. This is also a good way to evaluate the appropriateness of the present collection for GWAS studies. Indeed, a large number of associations were detected with data from the Tomato Analyzer, which was also successfully used in previous studies [58,86,100]. In particular, this method has been effective in associating different fruit shape categories to different alleles of SUN, OVATE, FASCIATED and LOCULE NUMBER, genes that control the elongated and flattened fruit shape in tomato [55,58,101,102].
Additional traits identified by these authors as predictive for these categories were fruit shape index, distal end protrusion, width widest position, proximal end blockiness, rectangular, distal angle and proximal eccentricity. Here, we also detected many of these associations, such as that with Proximal_angle_macro near OVATE or with fruit-shape-related traits near FASCIATED. However, interestingly, along with these associations, we also detected further associations linked to SlCLV3 (homolog of Arabidopsis CLAVATA3), which underlies the fasciated mutant phenotype [56,101,103,104,105], and a TONNEAU1-recruiting-motif gene. Together with OVATE, different genes from this family regulate early ovary development, which affects final fruit shape [53].
Along with studies mainly based on mutants, more recent GWAS based on genomic SNP, have detected significant polymorphisms within the same region [16,106]. Among associations detected for the fruit traits described in the present study, some were exclusive to conventional phenotyping and others to digital phenotyping. This demonstrates that the ability of the human eye to synthesize multiple features cannot yet be completely replaced by the available technology.
Many MTAs located either within or near transcription factor genes influenced fruit setting (OVATE-like, WUSCHEL-related, YABBY-like). These show that this combined regional and global tomato collection is useful for targeting genes with prominent roles in fruit. As an example, a single SNP (ch2_151) was identified within a gene that encodes a proteasome subunit α type protein that appears to have a key role during fruit setting [107,108]. This MTA was identified by all three of the GWAS methods for multiple fruit traits (detected by both conventional and precision phenotyping) near ANANTHA, which regulates inflorescence branching and floral organ identity [109], and in the region of additional MTAs for fruit shape and size.
Together, these results suggest that the diversity of this germplasm is sufficient to gain further insights into the role and function of genes that underlie important traits. Indeed, further associations were found in regions that were previously targeted as important for fruit color, carotenoids and sugar content, while others targeted novel genes that might be of relevance for quality traits, such as fruit color and β-carotene content on chromosomes 1 and 4 [59,110,111,112].
Using GWAS on SNPs from RNA-Seq extracted from mature fruit, we did not expect a direct implication for most of the present polymorphisms in the expressions of genes involved in plant development and phenology. However, we would expect a relevant number of these genes to be in LD (physical or functional) with others expressed in the fruit tissue. The significant RNA variation has indeed allowed the identification of associations for growth habit. These were often at short distances from transcription factors that have determinant roles in the regulation of plant growth and development, including tomato ripening and responses to environmental stimuli [64,113,114,115].
As revealed by a recent study from Wu and colleagues [53], genes of the OVATE and TONNEAU1 recruiting motif families not only control fruit shape in different domesticated plants (e.g., tomato, potato, melon, cucumber) but also interact to regulate other plant organs, such as leaves and flowers. This is in line with the present results, as among the different MTAs, some show joint association (either functional or as a result of hitchhiking during selection) with traits that underlie fruit development and plant and flower development, as also flowering. The MTA within Solyc06g066320, the gene encoding for a IWS1 transcription factor, is particularly interesting because this protein is highly conserved in different organisms (from humans to yeast) in Arabidopsis it is required for gene expression induced by brassinosteroids [60,116]. Moreover, the region around this gene spanning nearly 0.5 Mb, is enriched of genes encoding for different transcription factors, also related to fruit development and ripening [114,117]. In particular, the closest to IWS1 is a homolog to KANADI2, that together with KANADI1, appeared to be involved in the development of the carpel in Arabidopsis, as well as in the establishment of polarity of lateral organs, including leaf and flower, in Arabidopisis, rice and other species [118,119,120]. The function of Solyc06g066320, together with its simultaneous associations with different traits (i.e., fruit quality, inflorescence, fruit shape and size), suggest a possible pleiotropic role for this gene. Being pleiotropy a target for many GWA studies, variable strategies have been designed for the identification of causal variants and their roles that will help to extract the huge amount of information that is being produced [13,121,122].

4.3. Climatic Data

Previous studies based on climatic data have revealed gene expressed regions that might be involved in the answer to different environments [123,124,125,126,127,128]. They also suggest a role for the target genes in responses to environmental effects during plant development, such as those involved in regulation of the circadian clock, DNA methylation or flowering delay.
Among the most interesting results, we found MTAs identified on chromosome 2 for variables related to precipitation, such as ch2_130, with its “T” allele being private to the exotic landrace population. This MTA is located within Solyc02g071510, which encodes a transcription factor (GTE12) that in Arabidopsis is implicated in the cytosolic Ca2+ increase after application of stress, such as heat, drought and cold [129,130]. Three additional MTAs were also private alleles of the exotic landrace population and all were associated to bioclimatic variables, which suggest that these variants might be a signal of adaptation. Previous studies, performed on sorghum landraces have evidenced that the environment of origin have had a significant role in shaping SNP allele variation and suggested that these genomic signatures of adaptation might be used for crop improvement [126,127,128,131].
Further associations were detected across the remaining chromosomes in genomic regions that appear to be involved in plant responses to climatic changes. As an example, we indicate the MTAs located within a gene that encodes a heat stress transcription factor or within SlMYC2, a jasmonic acid transcription factor involved in fruit chilling tolerance in tomato [132]. Others are located near genes that encode a FRIGIDA-like or other heat-stress proteins, as well as in close proximity to genes implicated in the regulation of flowering or inflorescence architecture. Since tomato cultivation is hindered by high temperature and drought, these results might help to target genes that will be useful to develop new varieties that are better adapted to changing environments.
The present results indicate that we can select the accessions that carry the polymorphic alleles to create specific crosses with controlled fruit size and shape and, for example, improved quality characteristics or that might be linked to specific climate responses.

5. Conclusions

We demonstrate here the value of exploring the genetic diversity of local and regional accessions, to exploit the variation of this genetic diversity reservoir to gain knowledge and facilitating crop improvements. Our results indicate that, as well as the relevant associations detected for fruit size, shape and quality, there is correlation between the expression of fruit traits and other traits related to plant development and flowering, and the likely response to climate variations. As recently demonstrated in tomato, the human-driven selection for specific traits during domestication has resulted in direct effects on other secondary traits or indirect influences in the expression of other genes to linkage drag [3,133]. Some of the present outcomes might be used to investigate gene functions in basic genetic studies or in the post-GWAS era, to be exploited in gene editing programs, and for genomic selection and breeding. The present collection is enriched in landraces that, along with the wild species, represent a reservoir of diversity that might translate into improved crops and/or crops adapted to ever-changing consumer preferences.

Supplementary Materials

The following are available online at https://0-www-mdpi-com.brum.beds.ac.uk/2073-4425/11/11/1387/s1, Figure S1: Tomato fruit collected for the carotenoids content analysis. Different varieties of the tomato collection harvested at the breaker (greenish color) and ripe (red color) stages (Photograph: C.M. Posadinu). Figure S2: Estimates of Pearson’s correlations among all of the traits recorded. The red (negative) to blue (positive) color palette is used to indicate the strength of the correlation. White indicates no correlation. The codes for each trait are specified in Table S2. Figure S3: Most likely number of populations as obtained from STRUCTURE (A) and DAPC (B) analyses. (A) Delta K for increasing K performed over the 120 tomato accessions characterized by RNA-Seq analysis. Ten runs were performed for each K value. (B) The most likely number of genetic groups of four, as indicated by the lower Bayesian information criterion (BIC) value. Figure S4: Population structure as obtained from morphophenotypical and quality traits (A) and genetic analysis (B). A certain level of overlap is seen between the two clustering methods, although the overall variation captured by one of the two analyses is not fully representative of the other. Figure S5: Linkage disequilibrium (LD) versus physical distance, from chromosome 1 to chromosome 6. Left to right: Each plot represents four different LD measures per single chromosome, for the usual r2 value, the rs2 measure (r2 corrected by the population structure), the rv2 (r2 corrected by the kinship), the rvs2 measure (r2 corrected by both the kinship of individuals and the population structure). Figure S6: Linkage disequilibrium (LD) versus physical distance, from chromosome 7 to chromosome 12. Left to right: Each plot represents four different LD measures per single chromosome, for the usual r2 value, the rs2 measure (r2 corrected by the population structure), the rv2 (r2 corrected by the kinship), the rvs2 measure (r2 corrected by both the kinship of individuals and the population structure). Table S1: Accessions, names, origin, donors and details for the analysis performed on each accession. Table S2: Phenotypic traits (conventional, and from Tomato Analyzer) and carotenoid contents as registered for the tomato collection. Bio-climatic data are also given (as obtained for the 108 geo-referenced accessions). Table S3: Significant differences among the tomato accessions for the conventional quantitative traits in 2012 and 2013. Table S4: Shannon–Weaver index for the qualitative traits evaluated in 2012 and 2013. Table S5: Distribution and variance of the digital phenotyping descriptors, as evaluated in 116 tomato accessions in 2013. The ANOVA was applied to the data to test for significant differences among traits. Table S6: Significant differences among genotypes of cultivated tomato for all of the compounds analyzed. Table S7: Loading of the PCA—see Figure 1 for PC plot—performed using phenotypic traits, carotenoids and bioclimate variables. Table S8: Summary of private alleles by population. When the allele is also associated to a specific trait—based on GWAS results—it is indicated in column E. Table S9: Gene ontology based on Genome V2.4 and V2.5 and Tomato Genome_4.0. The columns from S to AB indicate the SNPs that have been detected as associated to different traits. Additional notes are given for each marker-trait association when present. Table S10: Distribution of marker-trait associations on the different chromosomes and genes within each chromosomes. Data are subdivided into groups of different phenotypic traits. Files (.txt format) with all the data are also given: Files with SNP and morphologic/quality/climatic data: SNP dataset in hapmap format: tmt_120g_2470SNPs.hmp.txt; Carotenoid data: tmt_carotenoids_traits_BLUPs.txt; Climatic data: tmt_climate_traits.txt; Conventional morphologic traits: tmt_conventional_traits_BLUPs.txt Morphologic traits as obtained from digital phenotyping: tmt_TomatoAnalyzer_traits_BLUPs.txt; Output of population structure: tmt_pop_str_K3.txt; Kinship matrix: kinship_120i_2470SNPs.txt.

Author Contributions

Conceptualization, M.R., J.J.G., D.R. and G.A.; data curation, M.R., A.S., Y.X., C.V.N., H.S., E.B. (Elena Bitocchi), E.B. (Elisa Bellucci), Z.F. and D.R.; formal analysis, M.R., A.S., H.S. and D.R.; funding acquisition, M.R., Z.F., J.J.G. and G.A.; methodology, M.R., R.P., D.R. and G.A.; project administration, J.J.G. and G.A.; resources, M.R., A.S., C.M.P. and G.A.; software, M.R., A.S. and H.S.; supervision, Z.F., J.J.G., D.R. and G.A.; writing—original draft, M.R. and A.S.; writing—review and editing, M.R., A.S., R.P., Z.F., J.J.G. and G.A. All authors have read and agreed to the published version of the manuscript.

Funding

This research was supported by grants to M.R. (fixed term researcher—a) and A.S., covered by the European Social Fund “P.O.R. SARDEGNA E.S.F. 2007–2013—Asse IV Capitale umano, Linea di Attività l.3.1” and by grants from US National Science Foundation (IOS-1339287, IOS-1539831 and IOS-1855585 to Z.F. and J.J.G). Open access publication was granted by University of Sassari “Fondo di Ateneo per la ricerca 2020”.

Conflicts of Interest

The authors declare that they have no conflicts of interest or competing interests.

Availability of Data and Material

Raw RNA-Seq reads have been deposited into the NCBI sequence read archive (SRA) under accession PRJNA646818. All data necessary for confirming the conclusions of the article are present within the article, Figures, and Tables, and within Supplementary Tables and Figures.

References

  1. Gao, L.; Gonda, I.; Sun, H.; Ma, Q.; Bao, K.; Tieman, D.M.; Burzynski-Chang, E.A.; Fish, T.L.; Stromberg, K.A.; Sacks, G.L.; et al. The tomato pan-genome uncovers new genes and a rare allele regulating fruit flavor. Nat. Genet. 2019, 51, 1044–1051. [Google Scholar] [CrossRef]
  2. Lin, T.; Zhu, G.; Zhang, J.; Xu, X.; Yu, Q.; Zheng, Z.; Zhang, Z.; Lun, Y.; Li, S.; Wang, X.; et al. Genomic analyses provide insights into the history of tomato breeding. Nat. Genet. 2014, 46, 1220–1226. [Google Scholar] [CrossRef]
  3. Zhu, G.; Wang, S.; Huang, Z.; Zhang, S.; Liao, Q.; Zhang, C.; Lin, T.; Qin, M.; Peng, M.; Yang, C.; et al. Rewiring of the Fruit Metabolome in Tomato Breeding. Cell 2018, 172, 249–261.e12. [Google Scholar] [CrossRef] [Green Version]
  4. Zhao, J.; Sauvage, C.; Zhao, J.; Bitton, F.; Bauchet, G.; Liu, D.; Huang, S.; Tieman, D.M.; Klee, H.J.; Causse, M. Meta-analysis of genome-wide association studies provides insights into genetic control of tomato flavor. Nat. Commun. 2019, 10, 1534. [Google Scholar] [CrossRef] [Green Version]
  5. Harlan, J.R. Our vanishing genetic resources. Science 1975, 188, 617–621. [Google Scholar]
  6. Brush, S.B. Genes in the Field: On-Farm Conservation of Crop Diversity; IDRC: Ottawa, ON, Canada, 2000. [Google Scholar]
  7. Petropoulos, S.A.; Barros, L.; Ferreira, I.C.F.R. Editorial: Rediscovering Local Landraces: Shaping Horticulture for the Future. Front. Plant Sci. 2019, 10, 126. [Google Scholar] [CrossRef] [Green Version]
  8. Hufford, M.B.; Berny Mier y Teran, J.C.; Gepts, P. Crop Biodiversity: An Unfinished Magnum Opus of Nature. Annu. Rev. Plant Biol. 2019, 70, 727–751. [Google Scholar] [CrossRef]
  9. McCouch, S. Diversifying selection in plant breeding. PLoS Biol. 2004, 2, e347. [Google Scholar]
  10. David, J.; Holtz, Y.; Ranwez, V.; Santoni, S.; Sarah, G.; Ardisson, M.; Poux, G.; Choulet, F.; Genthon, C.; Roumet, P.; et al. Genotyping by sequencing transcriptomes in an evolutionary pre-breeding durum wheat population. Mol. Breed. 2014, 34, 1531–1548. [Google Scholar] [CrossRef]
  11. Mazzucato, A.; Papa, R.; Bitocchi, E.; Mosconi, P.; Nanni, L.; Negri, V.; Picarella, M.E.; Siligato, F.; Soressi, G.P.; Tiranti, B.; et al. Genetic diversity, structure and marker-trait associations in a collection of Italian tomato (Solanum lycopersicum L.) landraces. Theor. Appl. Genet. 2008, 116, 657–669. [Google Scholar]
  12. Gupta, P.K.; Kulwal, P.L.; Jaiswal, V. Chapter Two—Association mapping in plants in the post-GWAS genomics era. In Advances in Genetics; Kumar, D., Ed.; Academic Press: Cambridge, MA, USA, 2019; Volume 104, pp. 75–154. [Google Scholar]
  13. Li, Z.; Wang, P.; You, C.; Yu, J.; Zhang, X.; Yan, F.; Ye, Z.; Shen, C.; Li, B.; Guo, K. Combined GWAS and eQTL analysis uncovers a genetic regulatory network orchestrating the initiation of secondary cell wall development in cotton. New Phytol. 2020, 226, 1738–1752. [Google Scholar]
  14. Sauvage, C.; Segura, V.; Bauchet, G.; Stevens, R.; Do, P.T.; Nikoloski, Z.; Fernie, A.R.; Causse, M. Genome-wide association in tomato reveals 44 candidate loci for fruit metabolic traits. Plant Physiol. 2014, 165, 1120–1132. [Google Scholar]
  15. Phan, N.T.; Trinh, L.T.; Rho, M.-Y.; Park, T.-S.; Kim, O.-R.; Zhao, J.; Kim, H.-M.; Sim, S.-C. Identification of loci associated with fruit traits using genome-wide single nucleotide polymorphisms in a core collection of tomato (Solanum lycopersicum L.). Sci. Hortic. 2019, 243, 567–574. [Google Scholar] [CrossRef]
  16. Sacco, A.; Ruggieri, V.; Parisi, M.; Festa, G.; Rigano, M.M.; Picarella, M.E.; Mazzucato, A.; Barone, A. Exploring a tomato landraces collection for fruit-related traits by the aid of a high-throughput genomic platform. PLoS ONE 2015, 10, e0137139. [Google Scholar]
  17. Yu, J.; Pressoir, G.; Briggs, W.H.; Bi, I.V.; Yamasaki, M.; Doebley, J.F.; McMullen, M.D.; Gaut, B.S.; Nielsen, D.M.; Holland, J.B.; et al. A unified mixed-model method for association mapping that accounts for multiple levels of relatedness. Nat. Genet. 2006, 38, 203–208. [Google Scholar] [CrossRef]
  18. Kang, H.M.; Zaitlen, N.A.; Wade, C.M.; Kirby, A.; Heckerman, D.; Daly, M.J.; Eskin, E. Efficient Control of Population Structure in Model Organism Association Mapping. Genetics 2008, 178, 1709–1723. [Google Scholar] [CrossRef] [Green Version]
  19. Segura, V.; Vilhjálmsson, B.J.; Platt, A.; Korte, A.; Seren, Ü.; Long, Q.; Nordborg, M. An efficient multi-locus mixed-model approach for genome-wide association studies in structured populations. Nat. Genet. 2012, 44, 825–830. [Google Scholar]
  20. Korte, A.; Farlow, A. The advantages and limitations of trait analysis with GWAS: A review. Plant Methods 2013, 9, 29. [Google Scholar]
  21. Liu, X.; Huang, M.; Fan, B.; Buckler, E.S.; Zhang, Z. Iterative usage of fixed and random effect models for powerful and efficient genome-wide association studies. PLoS Genet. 2016, 12, e1005767. [Google Scholar]
  22. Klasen, J.R.; Barbez, E.; Meier, L.; Meinshausen, N.; Bühlmann, P.; Koornneef, M.; Busch, W.; Schneeberger, K. A multi-marker association method for genome-wide association studies without the need for population structure correction. Nat. Commun. 2016, 7, 13299. [Google Scholar] [CrossRef] [Green Version]
  23. Louette, D. Traditional management of seed and genetic diversity: What is a landrace. Genes Field Fla. Lewis Publ. 2000, 109–142. [Google Scholar]
  24. Brewer, M.T.; Lang, L.; Fujimura, K.; Dujmovic, N.; Gray, S.; van der Knaap, E. Development of a controlled vocabulary and software application to analyze fruit shape variation in tomato and other plant species. Plant Physiol. 2006, 141, 15–25. [Google Scholar] [PubMed] [Green Version]
  25. Gonzalo, M.J.; Van Der Knaap, E. A comparative analysis into the genetic bases of morphology in tomato varieties exhibiting elongated fruit shape. Theor. Appl. Genet. 2008, 116, 647–656. [Google Scholar] [PubMed]
  26. Rodríguez, G.; Strecker, J.; Brewer, M.; Gonzalo, M.; Anderson, C.; Lang, L.; Sullivan, D.; Wagner, E.; Strecker, B.; Drushal, R.; et al. Tomato Analyzer Version 3 User Manual. 2010. Available online: https://vanderknaaplab.uga.edu/files/Tomato_Analyzer_3.0_Manual.pdf (accessed on 23 November 2020).
  27. Grassi, S.; Piro, G.; Lee, J.M.; Zheng, Y.; Fei, Z.; Dalessandro, G.; Giovannoni, J.J.; Lenucci, M.S. Comparative genomics reveals candidate carotenoid pathway regulators of ripening watermelon fruit. BMC Genom. 2013, 14, 781. [Google Scholar]
  28. Zhong, S.; Joung, J.-G.; Zheng, Y.; Chen, Y.; Liu, B.; Shao, Y.; Xiang, J.Z.; Fei, Z.; Giovannoni, J.J. High-Throughput Illumina Strand-Specific RNA Sequencing Library Preparation. Cold Spring Harb. Protoc. 2011, 2011, pdb.prot5652. [Google Scholar] [CrossRef] [Green Version]
  29. Bolger, A.M.; Lohse, M.; Usadel, B. Trimmomatic: A flexible trimmer for Illumina sequence data. Bioinformatics 2014, 30, 2114–2120. [Google Scholar] [CrossRef] [Green Version]
  30. Dobin, A.; Davis, C.A.; Schlesinger, F.; Drenkow, J.; Zaleski, C.; Jha, S.; Batut, P.; Chaisson, M.; Gingeras, T.R. STAR: Ultrafast universal RNA-seq aligner. Bioinforma. Oxf. Engl. 2013, 29, 15–21. [Google Scholar] [CrossRef]
  31. Li, H.; Handsaker, B.; Wysoker, A.; Fennell, T.; Ruan, J.; Homer, N.; Marth, G.; Abecasis, G.; Durbin, R. 1000 Genome Project Data Processing Subgroup The Sequence Alignment/Map format and SAMtools. Bioinforma. Oxf. Engl. 2009, 25, 2078–2079. [Google Scholar] [CrossRef] [Green Version]
  32. Bates, D.M. lme4: Mixed-Effects Modeling with R; Springer: New York, NY, USA, 2010. [Google Scholar]
  33. Shannon, C.; Weaver, W. The Mathematical Theory of Communication; Urban University; Illinois Press: Champaign, IL, USA, 1949. [Google Scholar]
  34. Peakall, R.; Smouse, P.E. GENALEX 6: Genetic analysis in Excel. Population genetic software for teaching and research. Mol. Ecol. Notes 2006, 6, 288–295. [Google Scholar]
  35. Wei, T.; Simko, V. R Package “Corrplot”: Visualization of a Correlation Matrix (Version 0.84). Retrived Httpsgithub Comtaiyuncorrplot. 2017. Available online: https://github.com/taiyun/corrplot (accessed on 23 November 2020).
  36. Lawson, R.G.; Jurs, P.C. New index for clustering tendency and its application to chemical problems. J. Chem. Inf. Comput. Sci. 1990, 30, 36–41. [Google Scholar]
  37. Malika, C.; Ghazzali, N.; Boiteau, V.; Niknafs, A. NbClust: An R package for determining the relevant number of clusters in a data Set. J. Stat. Softw. 2014, 61, 1–36. [Google Scholar]
  38. Excoffier, L.; Lischer, H.E. Arlequin suite ver 3.5: A new series of programs to perform population genetics analyses under Linux and Windows. Mol. Ecol. Resour. 2010, 10, 564–567. [Google Scholar]
  39. Jombart, T. Adegenet: A R package for the multivariate analysis of genetic markers. Bioinformatics 2008, 24, 1403–1405. [Google Scholar] [CrossRef] [PubMed] [Green Version]
  40. Pritchard, J.K.; Stephens, M.; Rosenberg, N.A.; Donnelly, P. Association mapping in structured populations. Am. J. Hum. Genet. 2000, 67, 170–181. [Google Scholar]
  41. Earl, D.A. STRUCTURE HARVESTER: A website and program for visualizing STRUCTURE output and implementing the Evanno method. Conserv. Genet. Resour. 2012, 4, 359–361. [Google Scholar]
  42. Privé, F.; Aschard, H.; Ziyatdinov, A.; Blum, M.G.B. Efficient analysis of large-scale genome-wide data with two R packages: Bigstatsr and bigsnpr. Bioinformatics 2018, 34, 2781–2787. [Google Scholar] [CrossRef] [Green Version]
  43. Bradbury, P.J.; Zhang, Z.; Kroon, D.E.; Casstevens, T.M.; Ramdoss, Y.; Buckler, E.S. TASSEL: Software for association mapping of complex traits in diverse samples. Bioinformatics 2007, 23, 2633–2635. [Google Scholar]
  44. Mangin, B.; Siberchicot, A.; Nicolas, S.; Doligez, A.; This, P.; Cierco-Ayrolles, C. Novel measures of linkage disequilibrium that correct the bias due to population structure and relatedness. Heredity 2012, 108, 285. [Google Scholar]
  45. Solé, X.; Guinó, E.; Valls, J.; Iniesta, R.; Moreno, V. SNPStats: A web tool for the analysis of association studies. Bioinformatics 2006, 22, 1928–1929. [Google Scholar]
  46. Clayton, D. SnpStats: SnpMatrix and XSnpMatrix Classes and Methods. R Package 2012. Available online: https://rdrr.io/bioc/snpStats/ (accessed on 23 November 2020).
  47. Marroni, F.; Pinosio, S.; Zaina, G.; Fogolari, F.; Felice, N.; Cattonaro, F.; Morgante, M. Nucleotide diversity and linkage disequilibrium in Populus nigra cinnamyl alcohol dehydrogenase (CAD4) gene. Tree Genet. Genomes 2011, 7, 1011–1023. [Google Scholar]
  48. Hill, W.G.; Weir, B.S. Variances and covariances of squared linkage disequilibria in finite populations. Theor. Popul. Biol. 1988, 33, 54–78. [Google Scholar] [PubMed]
  49. Barbato, M.; Orozco-terWengel, P.; Tapio, M.; Bruford, M.W. SNeP: A tool to estimate trends in recent effective population size trajectories using genome-wide SNP data. Front. Genet. 2015, 6, 109. [Google Scholar] [PubMed] [Green Version]
  50. Breseghello, F.; Sorrells, M.E. Association mapping of kernel size and milling quality in wheat (Triticum aestivum L.) cultivars. Genetics 2006, 172, 1165–1177. [Google Scholar] [PubMed] [Green Version]
  51. Lipka, A.E.; Tian, F.; Wang, Q.; Peiffer, J.; Li, M.; Bradbury, P.J.; Gore, M.A.; Buckler, E.S.; Zhang, Z. GAPIT: Genome association and prediction integrated tool. Bioinformatics 2012, 28, 2397–2399. [Google Scholar] [PubMed] [Green Version]
  52. Dahl, A.; Iotchkova, V.; Baud, A.; Johansson, Å.; Gyllensten, U.; Soranzo, N.; Mott, R.; Kranis, A.; Marchini, J. A multiple-phenotype imputation method for genetic studies. Nat. Genet. 2016, 48, 466–472. [Google Scholar] [CrossRef] [PubMed] [Green Version]
  53. Wu, S.; Zhang, B.; Keyhaninejad, N.; Rodríguez, G.R.; Kim, H.J.; Chakrabarti, M.; Illa-Berenguer, E.; Taitano, N.K.; Gonzalo, M.J.; Díaz, A.; et al. A common genetic mechanism underlies morphological diversity in fruits and other plant organs. Nat. Commun. 2018, 9, 4734. [Google Scholar] [CrossRef] [PubMed]
  54. Lippman, Z.; Tanksley, S.D. Dissecting the Genetic Pathway to Extreme Fruit Size in Tomato Using a Cross Between the Small-Fruited Wild Species Lycopersicon pimpinellifolium and L. esculentum var. Genetics 2001, 158, 413–422. [Google Scholar]
  55. Grandillo, S.; Ku, H.; Tanksley, S. Identifying the loci responsible for natural variation in fruit size and shape in tomato. Theor. Appl. Genet. 1999, 99, 978–987. [Google Scholar]
  56. Barrero, L.S.; Cong, B.; Wu, F.; Tanksley, S.D. Developmental characterization of the fasciated locus and mapping of Arabidopsis candidate genes involved in the control of floral meristem size and carpel number in tomato. Genome 2006, 49, 991–1006. [Google Scholar] [CrossRef]
  57. Cong, B.; Barrero, L.S.; Tanksley, S.D. Regulatory change in YABBY-like transcription factor led to evolution of extreme fruit size during tomato domestication. Nat. Genet. 2008, 40, 800–804. [Google Scholar] [CrossRef]
  58. Rodríguez, G.R.; Muños, S.; Anderson, C.; Sim, S.-C.; Michel, A.; Causse, M.; Gardener, B.B.M.; Francis, D.; van der Knaap, E. Distribution of SUN, OVATE, LC, and FAS in the tomato germplasm and the relationship to fruit shape diversity. Plant Physiol. 2011, 156, 275–285. [Google Scholar]
  59. Adato, A.; Mandel, T.; Mintz-Oron, S.; Venger, I.; Levy, D.; Yativ, M.; Domínguez, E.; Wang, Z.; De Vos, R.C.H.; Jetter, R.; et al. Fruit-Surface Flavonoid Accumulation in Tomato Is Controlled by a SlMYB12-Regulated Transcriptional Network. PLoS Genet. 2009, 5, e1000777. [Google Scholar] [CrossRef] [Green Version]
  60. Li, L.; Ye, H.; Guo, H.; Yin, Y. Arabidopsis IWS1 interacts with transcription factor BES1 and is involved in plant steroid hormone brassinosteroid regulated gene expression. Proc. Natl. Acad. Sci. USA 2010, 107, 3918–3923. [Google Scholar] [CrossRef] [Green Version]
  61. Reichheld, J.-P.; Khafif, M.; Riondet, C.; Droux, M.; Bonnard, G.; Meyer, Y. Inactivation of Thioredoxin Reductases Reveals a Complex Interplay between Thioredoxin and Glutathione Pathways in Arabidopsis Development. Plant Cell 2007, 19, 1851–1865. [Google Scholar] [CrossRef] [Green Version]
  62. Chi, Y.H.; Moon, J.C.; Park, J.H.; Kim, H.-S.; Zulfugarov, I.S.; Fanata, W.I.; Jang, H.H.; Lee, J.R.; Lee, Y.M.; Kim, S.T.; et al. Abnormal Chloroplast Development and Growth Inhibition in Rice Thioredoxin m Knock-Down Plants. Plant Physiol. 2008, 148, 808–817. [Google Scholar] [CrossRef] [Green Version]
  63. Meyer, Y.; Belin, C.; Delorme-Hinoux, V.; Reichheld, J.-P.; Riondet, C. Thioredoxin and glutaredoxin systems in plants: Molecular mechanisms, crosstalks, and functional significance. Antioxid. Redox Signal. 2012, 17, 1124–1160. [Google Scholar] [CrossRef]
  64. Bartoli, C.G.; Casalongué, C.A.; Simontacchi, M.; Marquez-Garcia, B.; Foyer, C.H. Interactions between hormone and redox signalling pathways in the control of growth and cross tolerance to stress. Environ. Exp. Bot. 2013, 94, 73–88. [Google Scholar] [CrossRef]
  65. Cheng, F.; Zhou, Y.-H.; Xia, X.-J.; Shi, K.; Zhou, J.; Yu, J.-Q. Chloroplastic thioredoxin-f and thioredoxin-m1/4 play important roles in brassinosteroids-induced changes in CO2 assimilation and cellular redox homeostasis in tomato. J. Exp. Bot. 2014, 65, 4335–4347. [Google Scholar] [CrossRef] [Green Version]
  66. Kumar, R.; Kushalappa, K.; Godt, D.; Pidkowich, M.S.; Pastorelli, S.; Hepworth, S.R.; Haughn, G.W. The Arabidopsis BEL1-LIKE HOMEODOMAIN Proteins SAW1 and SAW2 Act Redundantly to Regulate KNOX Expression Spatially in Leaf Margins. Plant Cell 2007, 19, 2719–2735. [Google Scholar] [CrossRef] [Green Version]
  67. Parnis, A.; Cohen, O.; Gutfinger, T.; Hareven, D.; Zamir, D.; Lifschitz, E. The dominant developmental mutants of tomato, Mouse-ear and Curl, are associated with distinct modes of abnormal transcriptional regulation of a Knotted gene. Plant Cell 1997, 9, 2143–2158. [Google Scholar] [CrossRef]
  68. Shani, E.; Burko, Y.; Ben-Yaakov, L.; Berger, Y.; Amsellem, Z.; Goldshmidt, A.; Sharon, E.; Ori, N. Stage-Specific Regulation of Solanum lycopersicum Leaf Maturation by Class 1 KNOTTED1-LIKE HOMEOBOX Proteins. Plant Cell 2009, 21, 3078–3092. [Google Scholar] [CrossRef] [Green Version]
  69. Mao, L.; Begum, D.; Chuang, H.; Budiman, M.A.; Szymkowiak, E.J.; Irish, E.E.; Wing, R.A. JOINTLESS is a MADS-box gene controlling tomato flower abscissionzone development. Nature 2000, 406, 910–913. [Google Scholar] [CrossRef]
  70. Mao, L.; Begum, D.; Goff, S.A.; Wing, R.A. Sequence and Analysis of the Tomato JOINTLESSLocus. Plant Physiol. 2001, 126, 1331–1340. [Google Scholar] [CrossRef] [Green Version]
  71. Roe, J.L.; Rivin, C.J.; Sessions, R.A.; Feldmann, K.A.; Zambryski, P.C. The Tousled gene in A. thaliana encodes a protein kinase homolog that is required for leaf and flower development. Cell 1993, 75, 939–950. [Google Scholar] [CrossRef]
  72. Uddin, M.N.; Dunoyer, P.; Schott, G.; Akhter, S.; Shi, C.; Lucas, W.J.; Voinnet, O.; Kim, J.-Y. The protein kinase TOUSLED facilitates RNAi in Arabidopsis. Nucleic Acids Res. 2014, 42, 7971–7980. [Google Scholar] [CrossRef] [Green Version]
  73. He, Y.; Doyle, M.R.; Amasino, R.M. PAF1-complex-mediated histone methylation of FLOWERING LOCUS C chromatin is required for the vernalization-responsive, winter-annual habit in Arabidopsis. Genes Dev. 2004, 18, 2774–2784. [Google Scholar] [CrossRef] [Green Version]
  74. Kim, S.; Choi, K.; Park, C.; Hwang, H.-J.; Lee, I. SUPPRESSOR OF FRIGIDA4, Encoding a C2H2-Type Zinc Finger Protein, Represses Flowering by Transcriptional Activation of Arabidopsis FLOWERING LOCUS C. Plant Cell 2006, 18, 2985–2998. [Google Scholar] [CrossRef] [Green Version]
  75. Manning, K.; Tör, M.; Poole, M.; Hong, Y.; Thompson, A.J.; King, G.J.; Giovannoni, J.J.; Seymour, G.B. A naturally occurring epigenetic mutation in a gene encoding an SBP-box transcription factor inhibits tomato fruit ripening. Nat. Genet. 2006, 38, 948–952. [Google Scholar] [CrossRef]
  76. Preston, J.C.; Hileman, L. Functional Evolution in the Plant SQUAMOSA-PROMOTER BINDING PROTEIN-LIKE (SPL) Gene Family. Front. Plant Sci. 2013, 4, 80. [Google Scholar] [CrossRef] [Green Version]
  77. Silva, G.F.F.; Silva, E.M.; Correa, J.P.O.; Vicente, M.H.; Jiang, N.; Notini, M.M.; Junior, A.C.; Jesus, F.A.D.; Castilho, P.; Carrera, E.; et al. Tomato floral induction and flower development are orchestrated by the interplay between gibberellin and two unrelated microRNA-controlled modules. New Phytol. 2019, 221, 1328–1344. [Google Scholar] [CrossRef] [Green Version]
  78. Silva, G.F.F.; Silva, E.M.; Azevedo, M.D.S.; Guivin, M.A.C.; Ramiro, D.A.; Figueiredo, C.R.; Carrer, H.; Peres, L.E.P.; Nogueira, F.T.S. microRNA156-targeted SPL/SBP box transcription factors regulate tomato ovary and fruit development. Plant J. 2014, 78, 604–618. [Google Scholar] [CrossRef]
  79. Johanson, U.; West, J.; Lister, C.; Michaels, S.; Amasino, R.; Dean, C. Molecular Analysis of FRIGIDA, a Major Determinant of Natural Variation in Arabidopsis Flowering Time. Science 2000, 290, 344–347. [Google Scholar] [CrossRef]
  80. Gallavotti, A.; Long, J.A.; Stanfield, S.; Yang, X.; Jackson, D.; Vollbrecht, E.; Schmidt, R.J. The control of axillary meristem fate in the maize ramosa pathway. Dev. Camb. Engl. 2010, 137, 2849–2856. [Google Scholar] [CrossRef] [Green Version]
  81. Blanca, J.; Cañizares, J.; Cordero, L.; Pascual, L.; Diez, M.J.; Nuez, F. Variation revealed by SNP genotyping and morphology provides insight into the origin of the tomato. PLoS ONE 2012, 7, e48198. [Google Scholar]
  82. Sim, S.-C.; Van Deynze, A.; Stoffel, K.; Douches, D.S.; Zarka, D.; Ganal, M.W.; Chetelat, R.T.; Hutton, S.F.; Scott, J.W.; Gardner, R.G.; et al. High-Density SNP Genotyping of Tomato (Solanum lycopersicum L.) Reveals Patterns of Genetic Variation Due to Breeding. PLoS ONE 2012, 7, e45520. [Google Scholar] [CrossRef] [Green Version]
  83. Cortés-Olmos, C.; Vilanova, S.; Pascual, L.; Roselló, J.; Cebolla-Cornejo, J. SNP markers applied to the characterization of Spanish tomato (Solanum lycopersicum L.) landraces. Sci. Hortic. 2015, 194, 100–110. [Google Scholar] [CrossRef]
  84. Kalinowski, S.T. Counting alleles with rarefaction: Private alleles and hierarchical sampling designs. Conserv. Genet. 2004, 5, 539–543. [Google Scholar]
  85. Tanksley, S.D. The Genetic, Developmental, and Molecular Bases of Fruit Size and Shape Variation in Tomato. Plant Cell 2004, 16, S181–S189. [Google Scholar] [CrossRef]
  86. Colonna, V.; D’Agostino, N.; Garrison, E.; Albrechtsen, A.; Meisner, J.; Facchiano, A.; Cardi, T.; Tripodi, P. Genomic diversity and novel genome-wide association with fruit morphology in Capsicum, from 746k polymorphic sites. Sci. Rep. 2019, 9, 10067. [Google Scholar] [CrossRef] [Green Version]
  87. Bauchet, G.; Grenier, S.; Samson, N.; Segura, V.; Kende, A.; Beekwilder, J.; Cankar, K.; Gallois, J.-L.; Gricourt, J.; Bonnet, J. Identification of major loci and genomic regions controlling acid and volatile content in tomato fruit: Implications for flavor improvement. New Phytol. 2017, 215, 624–641. [Google Scholar]
  88. Ruggieri, V.; Francese, G.; Sacco, A.; D’Alessandro, A.; Rigano, M.M.; Parisi, M.; Milone, M.; Cardi, T.; Mennella, G.; Barone, A. An association mapping approach to identify favourable alleles for tomato fruit quality breeding. BMC Plant Biol. 2014, 14, 337. [Google Scholar]
  89. Cericola, F.; Portis, E.; Lanteri, S.; Toppino, L.; Barchi, L.; Acciarri, N.; Pulcini, L.; Sala, T.; Rotino, G.L. Linkage disequilibrium and genome-wide association analysis for anthocyanin pigmentation and fruit color in eggplant. BMC Genom. 2014, 15, 896. [Google Scholar] [CrossRef] [Green Version]
  90. Biselli, C.; Volante, A.; Desiderio, F.; Tondelli, A.; Gianinetti, A.; Finocchiaro, F.; Taddei, F.; Gazza, L.; Sgrulletta, D.; Cattivelli, L. GWAS for starch-related parameters in japonica rice (Oryza sativa L.). Plants 2019, 8, 292. [Google Scholar] [CrossRef] [Green Version]
  91. Garcia, M.; Eckermann, P.; Haefele, S.; Satija, S.; Sznajder, B.; Timmins, A.; Baumann, U.; Wolters, P.; Mather, D.E.; Fleury, D. Genome-wide association mapping of grain yield in a diverse collection of spring wheat (Triticum aestivum L.) evaluated in southern Australia. PLoS ONE 2019, 14, e0211730. [Google Scholar]
  92. Rogier, O.; Chateigner, A.; Amanzougarene, S.; Lesage-Descauses, M.-C.; Balzergue, S.; Brunaud, V.; Caius, J.; Soubigou-Taconnat, L.; Jorge, V.; Segura, V. Accuracy of RNAseq based SNP discovery and genotyping in Populus nigra. BMC Genom. 2018, 19, 909. [Google Scholar]
  93. Renaut, S.; Nolte, A.W.; Bernatchez, L. Mining transcriptome sequences towards identifying adaptive single nucleotide polymorphisms in lake whitefish species pairs (Coregonus spp. Salmonidae). Mol. Ecol. 2010, 19, 115–131. [Google Scholar] [PubMed]
  94. Pascual, L.; Albert, E.; Sauvage, C.; Duangjit, J.; Bouchet, J.-P.; Bitton, F.; Desplat, N.; Brunel, D.; Le Paslier, M.-C.; Ranc, N.; et al. Dissecting quantitative trait variation in the resequencing era: Complementarity of bi-parental, multi-parental and association panels. Plant Sci. 2016, 242, 120–130. [Google Scholar] [CrossRef] [Green Version]
  95. Pressoir, G.; Berthaud, J. Population structure and strong divergent selection shape phenotypic diversification in maize landraces. Heredity 2004, 92, 95–101. [Google Scholar] [CrossRef] [Green Version]
  96. Hamblin, M.T.; Casa, A.M.; Sun, H.; Murray, S.C.; Paterson, A.H.; Aquadro, C.F.; Kresovich, S. Challenges of Detecting Directional Selection After a Bottleneck: Lessons From Sorghum bicolor. Genetics 2006, 173, 953–964. [Google Scholar] [CrossRef] [Green Version]
  97. Labate, J.; Robertson, L.; Baldo, A. Multilocus sequence data reveal extensive departures from equilibrium in domesticated tomato (Solanum lycopersicum L.). Heredity 2009, 103, 257–267. [Google Scholar]
  98. Heerwaarden, J.V.; Eeuwijk, F.A.V.; Ross-Ibarra, J. Genetic diversity in a crop metapopulation. Heredity 2010, 104, 28–39. [Google Scholar] [CrossRef] [PubMed] [Green Version]
  99. Labate, J.A.; Sheffer, S.M.; Balch, T.; Robertson, L.D. Diversity and population structure in a geographic sample of tomato accessions. Crop Sci. 2011, 51, 1068–1079. [Google Scholar]
  100. Murgia, M.L.; Attene, G.; Rodriguez, M.; Bitocchi, E.; Bellucci, E.; Fois, D.; Nanni, L.; Gioia, T.; Albani, D.M.; Papa, R. A comprehensive phenotypic investigation of the “pod-shattering syndrome” in common bean. Front. Plant Sci. 2017, 8, 251. [Google Scholar] [PubMed] [Green Version]
  101. Xu, C.; Liberatore, K.L.; MacAlister, C.A.; Huang, Z.; Chu, Y.-H.; Jiang, K.; Brooks, C.; Ogawa-Ohnishi, M.; Xiong, G.; Pauly, M.; et al. A cascade of arabinosyltransferases controls shoot meristem size in tomato. Nat. Genet. 2015, 47, 784–792. [Google Scholar] [CrossRef]
  102. Muños, S.; Ranc, N.; Botton, E.; Bérard, A.; Rolland, S.; Duffé, P.; Carretero, Y.; Le Paslier, M.-C.; Delalande, C.; Bouzayen, M.; et al. Increase in Tomato Locule Number Is Controlled by Two Single-Nucleotide Polymorphisms Located Near WUSCHEL. Plant Physiol. 2011, 156, 2244–2254. [Google Scholar] [CrossRef] [Green Version]
  103. Huang, Z.; van der Knaap, E. Tomato fruit weight 11.3 maps close to fasciated on the bottom of chromosome 11. Theor. Appl. Genet. 2011, 123, 465–474. [Google Scholar] [CrossRef]
  104. Li, H.; Qi, M.; Sun, M.; Liu, Y.; Liu, Y.; Xu, T.; Li, Y.; Li, T. Tomato Transcription Factor SlWUS Plays an Important Role in Tomato Flower and Locule Development. Front. Plant Sci. 2017, 8. [Google Scholar] [CrossRef] [Green Version]
  105. Chu, Y.-H.; Jang, J.-C.; Huang, Z.; van der Knaap, E. Tomato locule number and fruit size controlled by natural alleles of lc and fas. Plant Direct 2019, 3, e00142. [Google Scholar] [CrossRef] [Green Version]
  106. Shirasawa, K.; Fukuoka, H.; Matsunaga, H.; Kobayashi, Y.; Kobayashi, I.; Hirakawa, H.; Isobe, S.; Tabata, S. Genome-Wide Association Studies Using Single Nucleotide Polymorphism Markers Developed by Re-Sequencing of the Genomes of Cultivated Tomato. DNA Res. 2013, 20, 593–603. [Google Scholar] [CrossRef] [Green Version]
  107. Chae, E.; Tan, Q.K.-G.; Hill, T.A.; Irish, V.F. An Arabidopsis F-box protein acts as a transcriptional co-factor to regulate floral development. Development 2008, 135, 1235–1245. [Google Scholar] [CrossRef] [Green Version]
  108. Bahrami, A.R.; Gray, J.E. Expression of a proteasome α-type subunit gene during tobacco development and senescence. Plant Mol. Biol. 1999, 39, 325–333. [Google Scholar] [PubMed]
  109. Astola, L.; Stigter, H.; van Dijk, A.D.J.; van Daelen, R.; Molenaar, J. Inferring the Gene Network Underlying the Branching of Tomato Inflorescence. PLoS ONE 2014, 9, e89689. [Google Scholar] [CrossRef]
  110. Ballester, A.-R.; Molthoff, J.; de Vos, R.; Hekkert, B.T.L.; Orzaez, D.; Fernández-Moreno, J.-P.; Tripodi, P.; Grandillo, S.; Martin, C.; Heldens, J.; et al. Biochemical and Molecular Analysis of Pink Tomatoes: Deregulated Expression of the Gene Encoding Transcription Factor SlMYB12 Leads to Pink Tomato Fruit Color. Plant Physiol. 2010, 152, 71–84. [Google Scholar] [CrossRef] [PubMed] [Green Version]
  111. Ye, J.; Hu, T.; Yang, C.; Li, H.; Yang, M.; Ijaz, R.; Ye, Z.; Zhang, Y. Transcriptome Profiling of Tomato Fruit Development Reveals Transcription Factors Associated with Ascorbic Acid, Carotenoid and Flavonoid Biosynthesis. PLoS ONE 2015, 10, e0130885. [Google Scholar] [CrossRef]
  112. Gürbüz Çolak, N.; Eken, N.T.; Ülger, M.; Frary, A.; Doğanlar, S. Mapping of quantitative trait loci for antioxidant molecules in tomato fruit: Carotenoids, vitamins C and E, glutathione and phenolic acids. Plant Sci. 2020, 292, 110393. [Google Scholar] [CrossRef]
  113. Nakano, T.; Suzuki, K.; Fujimura, T.; Shinshi, H. Genome-wide analysis of the ERF gene family in Arabidopsis and rice. Plant Physiol. 2006, 140, 411–432. [Google Scholar] [CrossRef] [Green Version]
  114. Liu, M.; Gomes, B.L.; Mila, I.; Purgatto, E.; Peres, L.E.P.; Frasse, P.; Maza, E.; Zouine, M.; Roustan, J.-P.; Bouzayen, M.; et al. Comprehensive Profiling of Ethylene Response Factor Expression Identifies Ripening-Associated ERF Genes and Their Link to Key Regulators of Fruit Ripening in Tomato. Plant Physiol. 2016, 170, 1732–1744. [Google Scholar] [CrossRef] [Green Version]
  115. Phukan, U.J.; Jeena, G.S.; Tripathi, V.; Shukla, R.K. Regulation of Apetala2/Ethylene Response Factors in Plants. Front. Plant Sci. 2017, 8, 150. [Google Scholar] [CrossRef] [Green Version]
  116. Pujari, V.; Radebaugh, C.A.; Chodaparambil, J.V.; Muthurajan, U.M.; Almeida, A.R.; Fischbeck, J.A.; Luger, K.; Stargell, L.A. The transcription factor Spn1 regulates gene expression via a highly conserved novel structural motif. J. Mol. Biol. 2010, 404, 1–15. [Google Scholar] [CrossRef] [Green Version]
  117. Petit, J.; Bres, C.; Mauxion, J.-P.; Tai, F.W.J.; Martin, L.B.B.; Fich, E.A.; Joubès, J.; Rose, J.K.C.; Domergue, F.; Rothan, C. The Glycerol-3-Phosphate Acyltransferase GPAT6 from Tomato Plays a Central Role in Fruit Cutin Biosynthesis. Plant Physiol. 2016, 171, 894–913. [Google Scholar] [CrossRef]
  118. Eshed, Y.; Baum, S.F.; Perea, J.V.; Bowman, J.L. Establishment of polarity in lateral organs of plants. Curr. Biol. 2001, 11, 1251–1260. [Google Scholar] [CrossRef] [PubMed] [Green Version]
  119. Khanday, I.; Yadav, S.R.; Vijayraghavan, U. Rice LHS1/OsMADS1 Controls Floret Meristem Specification by Coordinated Regulation of Transcription Factors and Hormone Signaling Pathways. Plant Physiol. 2013, 161, 1970–1983. [Google Scholar] [CrossRef] [PubMed] [Green Version]
  120. Zheng, Y.; Zhang, K.; Guo, L.; Liu, X.; Zhang, Z. AUXIN RESPONSE FACTOR3 plays distinct role during early flower development. Plant Signal. Behav. 2018, 13, e1467690. [Google Scholar] [CrossRef] [Green Version]
  121. Hannon, E.; Weedon, M.; Bray, N.; O’Donovan, M.; Mill, J. Pleiotropic effects of trait-associated genetic variation on DNA methylation: Utility for refining GWAS loci. Am. J. Hum. Genet. 2017, 100, 954–959. [Google Scholar] [PubMed] [Green Version]
  122. Wang, W.; Feng, Z.; Bull, S.B.; Wang, Z. A 2-step strategy for detecting pleiotropic effects on multiple longitudinal traits. Front. Genet. 2014, 5, 357. [Google Scholar] [PubMed] [Green Version]
  123. Méndez-Vigo, B.; Picó, F.X.; Ramiro, M.; Martínez-Zapater, J.M.; Alonso-Blanco, C. Altitudinal and Climatic Adaptation Is Mediated by Flowering Traits and FRI, FLC, and PHYC Genes in Arabidopsis. Plant Physiol. 2011, 157, 1942–1955. [Google Scholar] [CrossRef] [Green Version]
  124. Facella, P.; Lopez, L.; Carbone, F.; Galbraith, D.W.; Giuliano, G.; Perrotta, G. Diurnal and Circadian Rhythms in the Tomato Transcriptome and Their Modulation by Cryptochrome Photoreceptors. PLoS ONE 2008, 3, e2798. [Google Scholar] [CrossRef] [Green Version]
  125. Wu, J.-R.; Wang, T.-Y.; Weng, C.-P.; Duong, N.K.T.; Wu, S.-J. AtJ3, a specific HSP40 protein, mediates protein farnesylation-dependent response to heat stress in Arabidopsis. Planta 2019, 250, 1449–1460. [Google Scholar] [CrossRef]
  126. Li, Y.; Li, D.; Jiao, Y.; Schnable, J.C.; Li, Y.; Li, H.; Chen, H.; Hong, H.; Zhang, T.; Liu, B. Identification of loci controlling adaptation in Chinese soya bean landraces via a combination of conventional and bioclimatic GWAS. Plant Biotechnol. J. 2020, 18, 389–401. [Google Scholar]
  127. Sokolkova, A.; Bulyntsev, S.V.; Chang, P.L.; Carrasquilla-Garcia, N.; Igolkina, A.A.; Noujdina, N.V.; von Wettberg, E.; Vishnyakova, M.A.; Cook, D.R.; Nuzhdin, S.V. Genomic Analysis of Vavilov’s Historic Chickpea Landraces Reveals Footprints of Environmental and Human Selection. Int. J. Mol. Sci. 2020, 21, 3952. [Google Scholar] [CrossRef]
  128. Lasky, J.R.; Upadhyaya, H.D.; Ramu, P.; Deshpande, S.; Hash, C.T.; Bonnette, J.; Juenger, T.E.; Hyma, K.; Acharya, C.; Mitchell, S.E. Genome-environment associations in sorghum landraces predict adaptive traits. Sci. Adv. 2015, 1, e1400218. [Google Scholar] [PubMed] [Green Version]
  129. Du, L.; Poovaiah, B.W. A Novel Family of Ca 2+ /Calmodulin-Binding Proteins Involved in Transcriptional Regulation: Interaction with fsh/Ring3 Class Transcription Activators. Plant Mol. Biol. 2004, 54, 549–569. [Google Scholar] [CrossRef] [PubMed]
  130. Lee, B.; Henderson, D.A.; Zhu, J.-K. The Arabidopsis Cold-Responsive Transcriptome and Its Regulation by ICE1. Plant Cell 2005, 17, 3155–3175. [Google Scholar] [CrossRef] [PubMed] [Green Version]
  131. Faye, J.M.; Maina, F.; Hu, Z.; Fonceka, D.; Cisse, N.; Morris, G.P. Genomic signatures of adaptation to Sahelian and Soudanian climates in sorghum landraces of Senegal. Ecol. Evol. 2019, 9, 6038–6051. [Google Scholar] [PubMed]
  132. Min, D.; Li, F.; Zhang, X.; Cui, X.; Shu, P.; Dong, L.; Ren, C. SlMYC2 Involved in Methyl Jasmonate-Induced Tomato Fruit Chilling Tolerance. J. Agric. Food Chem. 2018, 66, 3110–3117. [Google Scholar] [CrossRef]
  133. Giovannoni, J. Tomato Multiomics Reveals Consequences of Crop Domestication and Improvement. Cell 2018, 172, 6–8. [Google Scholar] [CrossRef] [PubMed]
Figure 1. Principal component analysis performed on all of the morphophenological and fruit quality traits. ELR, exotic landraces; SLR, Sardinian landraces; CV, modern and vintage cultivars. Accessions are attributed to three phenotypic groups (yellow, green, red), based on the hierarchical clustering obtained with the same data.
Genes 11 01387 g001
Figure 2. Population structure analysis as obtained from STRUCTURE (A) and DAPC (B) methods. (A) Accessions attributed to three genetic groups (yellow, green, red). (B) Accessions attributed to four genetic groups (yellow, green, orange, red). In both cases shown, each vertical bar indicates a single accession, which is colored according to the genetic group to which it was assigned. Accessions not assigned to a single group are colored according to the estimated proportion of membership to each genetic group and are defined as admixed. ELR, exotic landraces; SLR, Sardinian landraces; CV, modern and vintage cultivars.
Genes 11 01387 g002
Figure 3. Linkage disequilibrium decay levels over all chromosomes calculated using the standard r2 coefficient and the r2 measure corrected for population structure (rs2), kinship (rv2) and both population structure and kinship (rvs2).
Genes 11 01387 g003
Table 1. ANOVA analysis performed across 122 tomato accessions for 14 conventional quantitative traits evaluated in 2012 and 2013. Year (Y), genotype (G) and genotype × year (G × Y) interactions were considered as effects of the model.
TraitYearGenotypeGenotype × Year h2B
DFSSF DFSSF DFSSF 201220132012/2013
DTFs1508,837.726,547.5****12143,086.718.6****12115,408.16.6****51.255.034.4
DTFt1125,556.06876.4****12141,182.418.6****12114,045.86.4****51.258.035.9
FRI1247,271.07000.0****12131,918.67.5****12122,707.85.3****30.743.411.8
NFI1170.88.3**12125,164.310.1****1218662.53.5****65.757.636.3
LLE1577.336.5****12112,356.66.5****1213732.41.9****42.525.928.6
LWI12.20.1n.s.12119,444.86.8****1216552.42.3****43.931.727.3
LL/W10.629.7****12110.04.1****1213.91.6****26.042.120.0
FWG1403.60.1n.s.12113,339,038.633.2****1211,192,320.93.0****67.862.259.9
FLE127.255.9****1214260.472.4****121217.23.7****78.280.974.2
FWI111.512.1***1218233.271.4****121344.93.0****78.980.676.6
FL/W11.8126.9****121209.2120.4****1214.42.5****85.189.385.8
NOL156.316.1****12130,730.572.5****1211009.82.4****81.280.479.0
PTK12.6347.0****12126.729.1****1212.52.7****55.870.558.8
BRIX1239.9610.7****121798.116.8****121128.82.7****44.555.542.3
DF, degrees of freedom; SS, sum of squares; F, F ratio; h2B, broad sense heritability; n.s., not significant; *, p < 0.05; **, p < 0.01; ***, p < 0.001; ****, p < 0.0001. DTFs, days to flowering from sowing (days); DTFt, days to flowering from transplanting (days); FRI, flowering-ripening interval (days); NFI, number of flowers per inflorescence; LLE, leaf length (cm); LWI, leaf width (cm); LL/W, leaf length/width; FWG, fruit weight (g); FLE, fruit length (cm); FWI, fruit width (cm); FL/W, fruit length/width; NOL, number of locules; PTK, pericarp thickness (cm); BRIX, degrees Brix (°Brix).
Table 2. Genetic diversity indices calculated within the different accessions groups and based on the 2470 single nucleotide polymorphisms (SNPs).
GroupSample SizeNaNeNo. PAHeuHe
ELR481.941.23500.160.16
SLR611.881.23110.160.16
CV111.921.4410.280.29
Overall1202.001.25 0.180.18
Na, No. of different alleles; Ne, No. of effective alleles; I, Shannon’s information index; No. PA, No. of alleles unique to a single population; He, expected heterozygosity; uHe, unbiased expected heterozygosity. ELR, exotic landraces; SLR, Sardinian landraces; CV, modern and vintage cultivars.
Table 3. FST values (below diagonal) and relative significance of the test (above diagonal) and proportion of shared alleles between pairs of sub-populations based on the 2470 SNPs.
Comparison among GroupsELRSLRCV
Genetic differentiation (FST)
ELR *****
SLR0.04 *
CV0.090.08
Proportion of shared alleles
ELR
SLR0.93
CV0.870.88
ELR, exotic landraces; SLR, Sardinian landraces; CV, modern and vintage cultivars; n.s., not significant; *, p < 0.05; **, p < 0.01; ***, p < 0.001.
Table 4. Linkage disequilibrium levels overall and within chromosomes, as calculated using standard r2 and (r2) corrected for population structure (rs2), kinship (rv2) and both population structure and kinship (rvs2).
ChromosomeMean r2r2 Decay at 0.30 MbMean rs2rs2 Decay at 0.22 MbMean rv2rv2 Decay at 0.14 Mbrvs2rvs2 Decay at 0.14 Mb
chr10.060.190.050.340.050.370.050.37
chr20.140.630.110.910.111.020.110.94
chr30.080.210.070.320.070.340.070.33
chr40.130.700.111.130.110.800.110.81
chr50.3442.570.178.740.1715.970.178.12
chr60.090.350.090.690.090.830.090.84
chr70.150.750.131.290.131.650.131.65
chr80.060.120.050.210.050.270.050.27
chr90.130.400.120.680.121.030.121.04
chr100.080.090.070.170.070.250.070.25
chr110.130.740.090.520.090.550.090.55
chr120.242.110.233.630.231.360.231.37
Mean0.150.630.110.810.070.800.070.80
The mean linkage disequilibrium (LD) levels over all chromosomes were r2 = 0.15, rs2 = 0.11 and rvs2 = 0.07, whereas the estimates of the unlinked pairwise loci (among chromosomes) indicated r2 = 0.19, rs2 = 0.12 and rvs2 = 0.09 as the threshold above which loci can be assumed to be in LD. There were fewer SNPs across centromeres and the highest LD levels were usually observed around peri-centromeric areas.
Table 5. Distribution and number of marker-trait associations detected along tomato chromosomes. Data are presented according to the GWAS method and then trait type. FRUIT_SHAPE_CP and FRUIT_SIZE_CP/DP, fruit shape and size, respectively, based on conventional/digital phenotyping.
Method/Trait TypeCHR1CHR2CHR3CHR4CHR5CHR6CHR7CHR8CHR9CHR10CHR11CHR12TOTAL
FarmCPU303036262217817919447265
CLIMATE251346432269359
FRUIT_QUALITY41211 111 12
FRUIT_SHAPE_CP352241 3224 28
FRUIT_SHAPE_DP6681362193215374
FRUIT_SIZE_CP234 121 23 18
FRUIT_SIZE_DP852136 2 26 35
GROWTH1 1 12 5
INFLORESCENCE2111 1 23112
LEAF TRAITS12331 31 11 16
PHENOLOGY1211 1 6
GAPIT.MLM543652 6 8140
CLIMATE2 325 2 115
FRUIT_QUALITY3 1 4
FRUIT_SHAPE_CP 3 1 1 4 9
FRUIT_SHAPE_DP 1 3 1 3 8
FRUIT_SIZE_CP 4 4
QTCAT29334551214 10713576231
FRUIT_QUALITY 11 1 2 1 6
FRUIT_SHAPE_CP146 2 37124
FRUIT_SHAPE_DP21419568 53313280
FRUIT_SIZE_CP726 1 34326
FRUIT_SIZE_DP151213 54 32424 82
INFLORESCENCE1 1 8 10
LEAF TRAITS1 1
PHENOLOGY2 2
TOTAL646784373933833163210914536
Publisher’s Note: MDPI stays neutral with regard to jurisdictional claims in published maps and institutional affiliations.

