Structural Variation of the X Chromosome Heterochromatin in the Anopheles gambiae Complex

 and
and 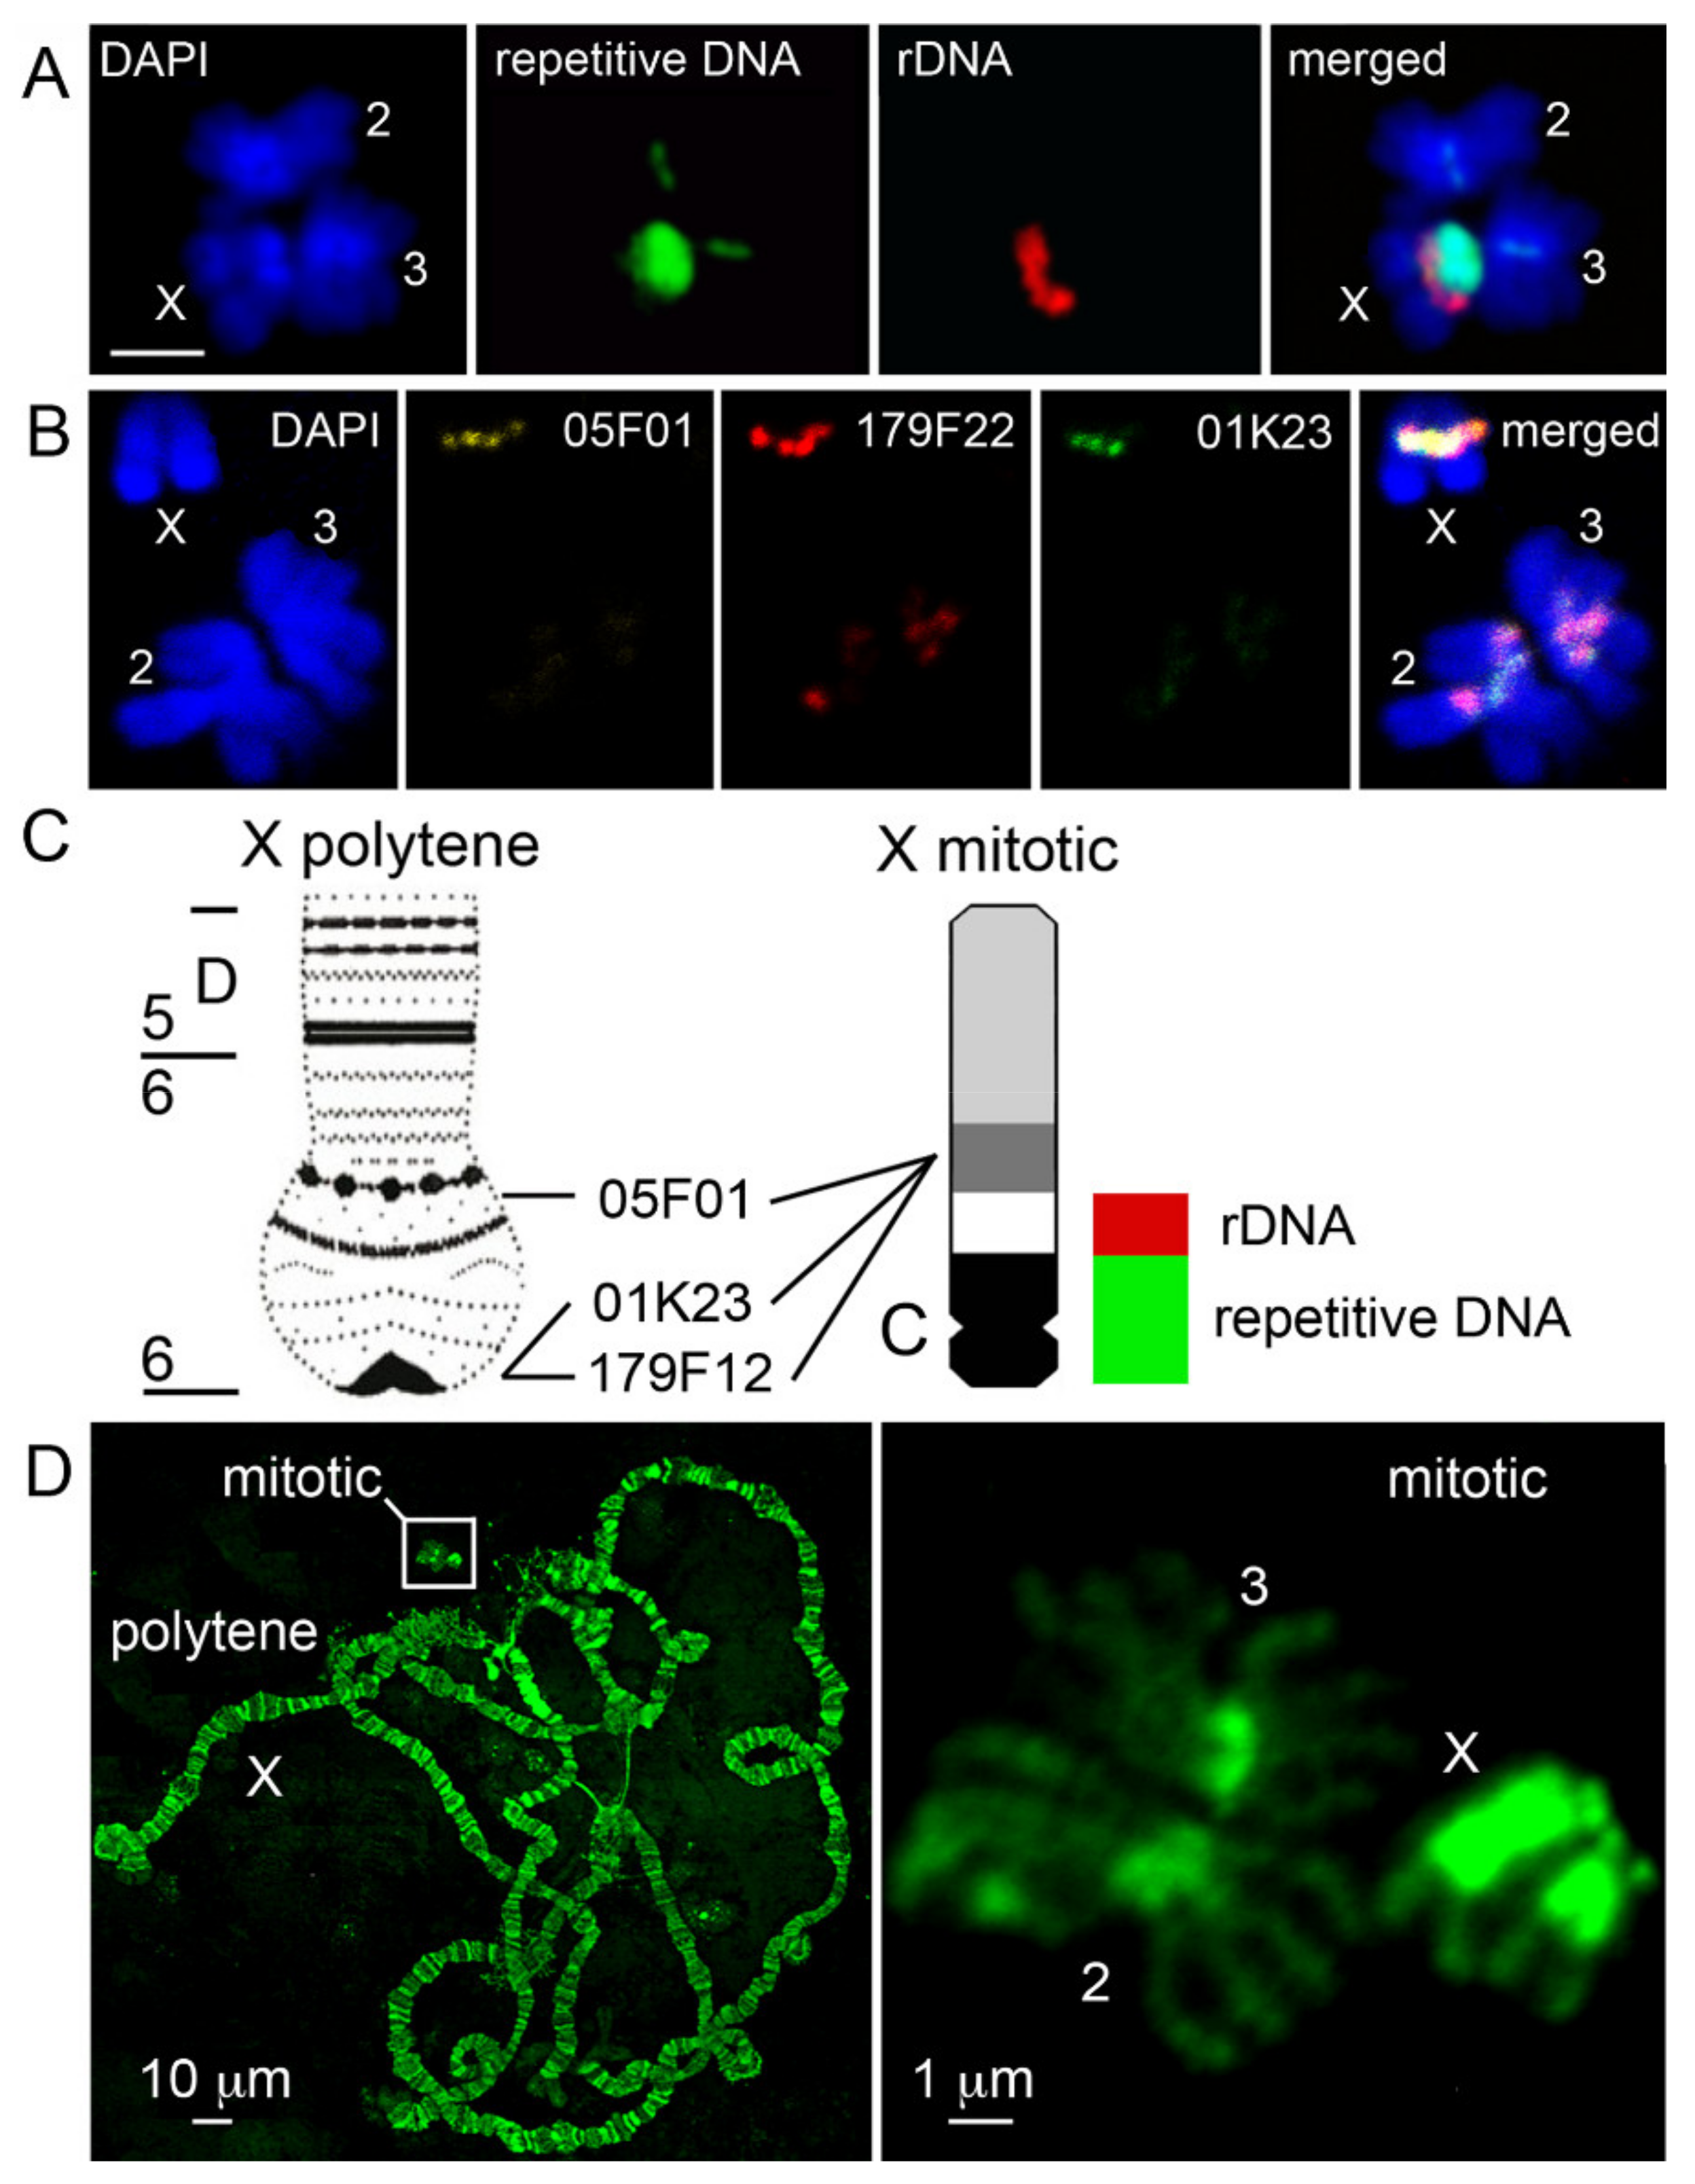
Abstract
:1. Introduction
2. Materials and Methods
2.1. Mosquito Strains and Colony Maintenance
2.2. Chromosome Preparation
2.3. C0t DNA Preparation and DNA Probe Labeling
2.4. Fluorescence in situ Hybridization (FISH)
2.5. Image Acquisition and Chromosome Measurements
2.6. Quantative Analysis of Fluorescent Signal Positions
3. Results
3.1. Correspondence Between Heterochromatin of the Polytene and Mitotic X Chromosome in Anopheles gambiae
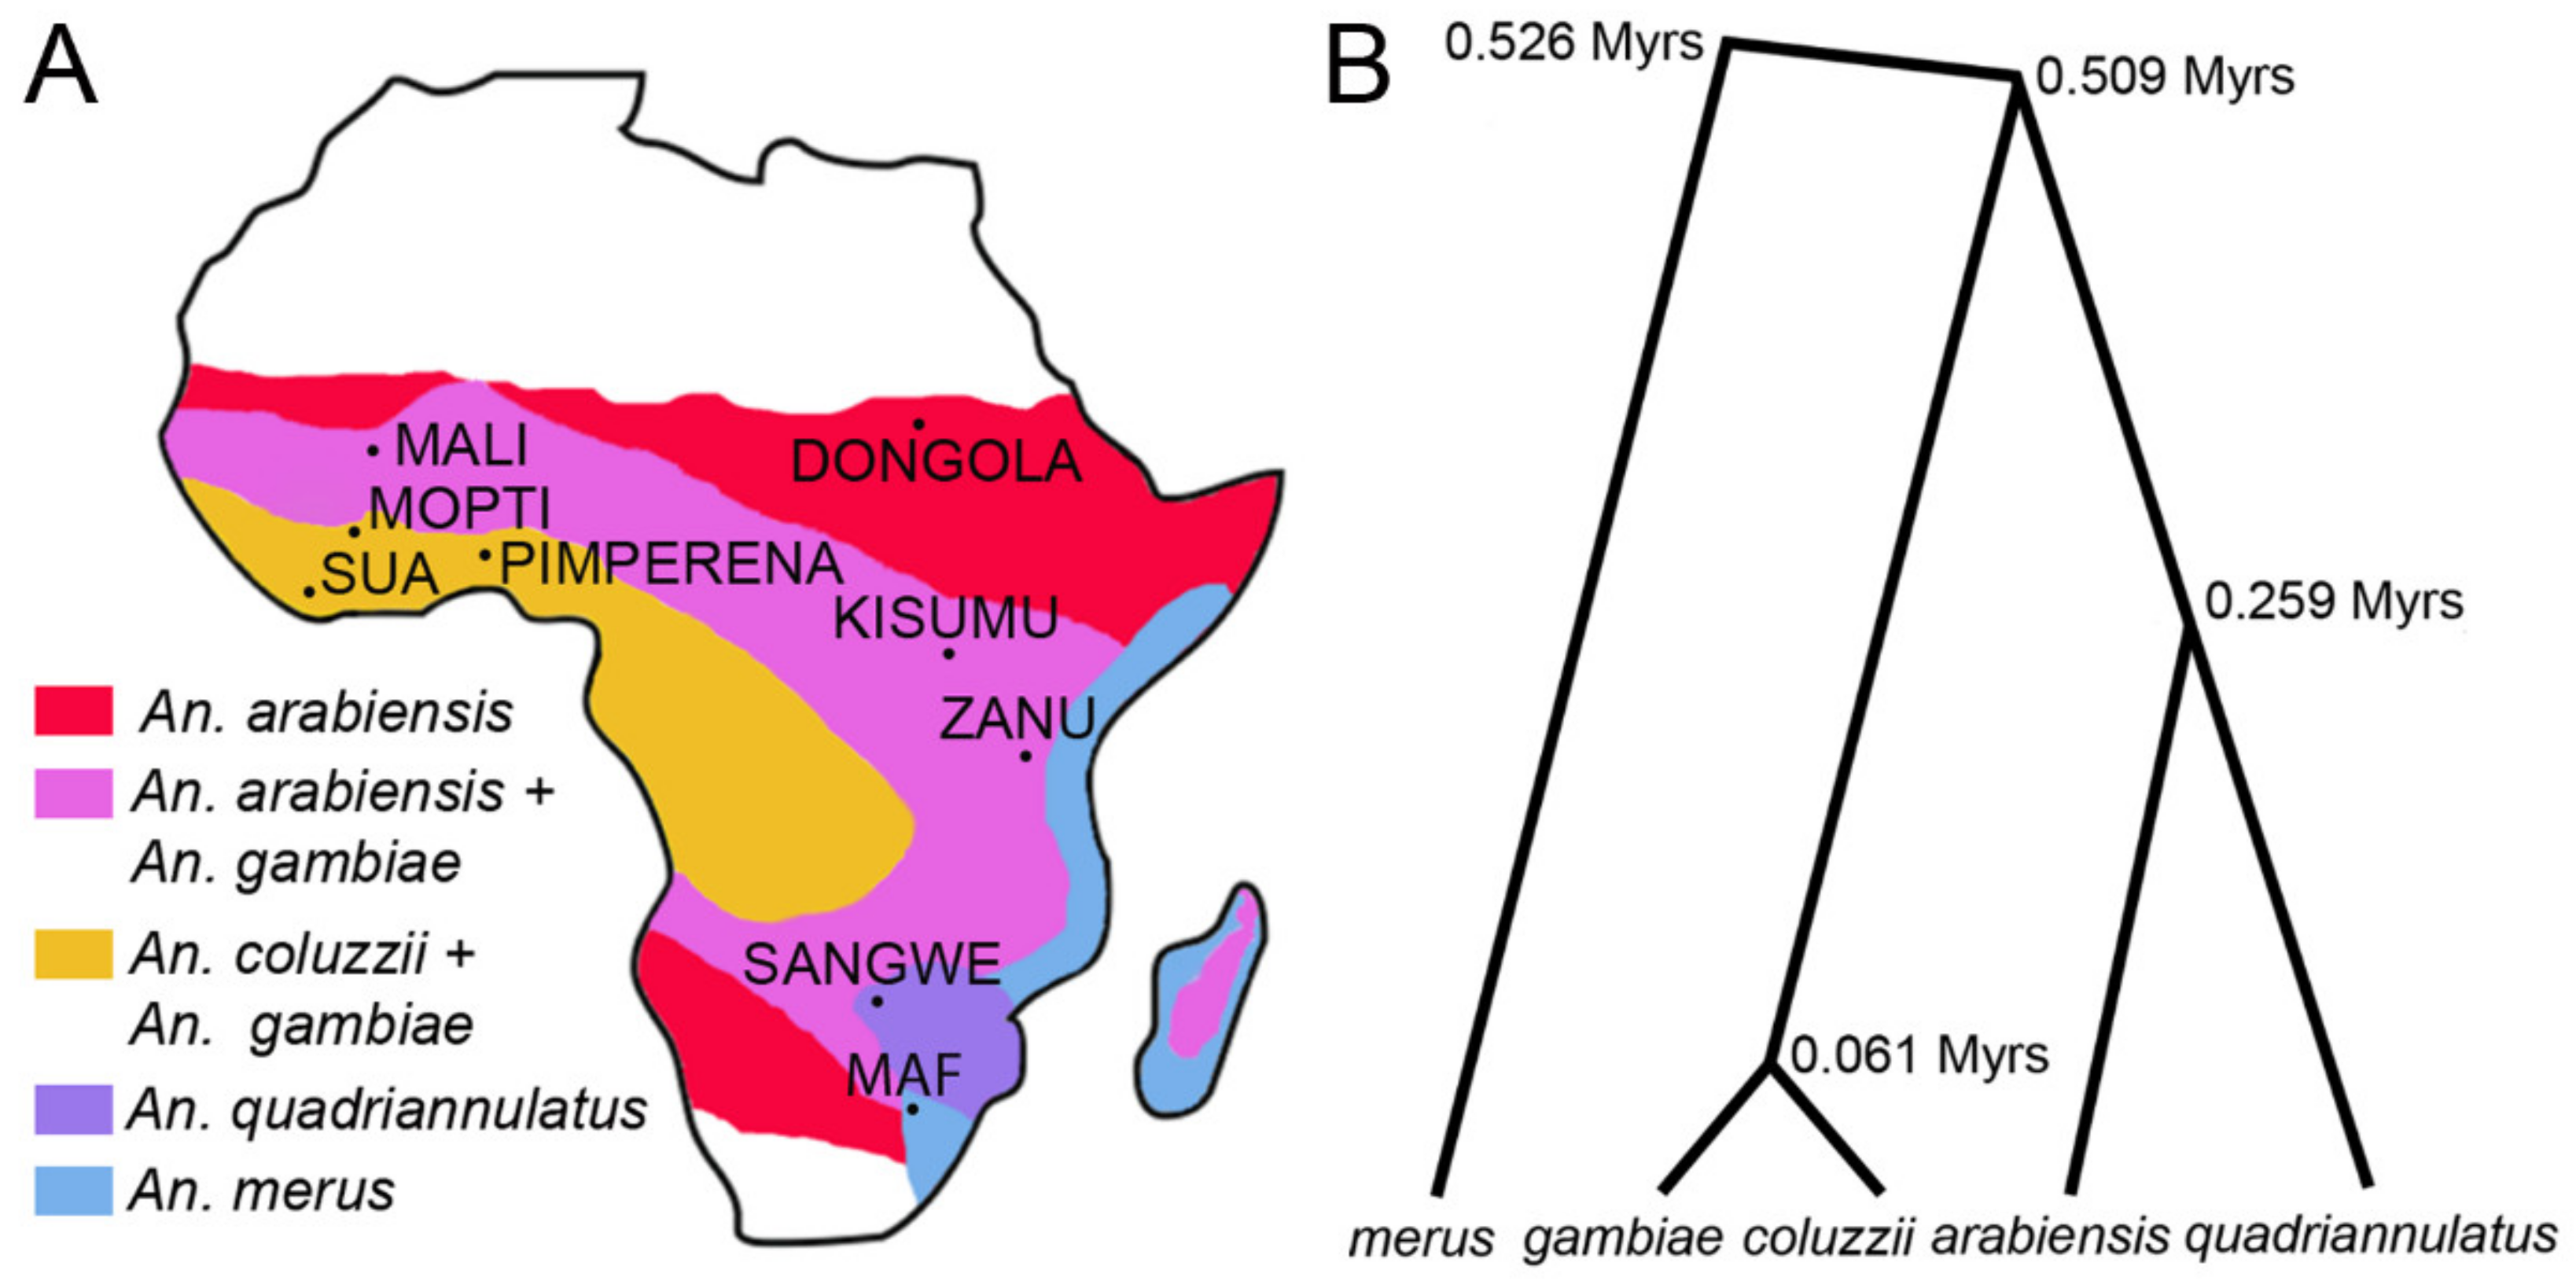
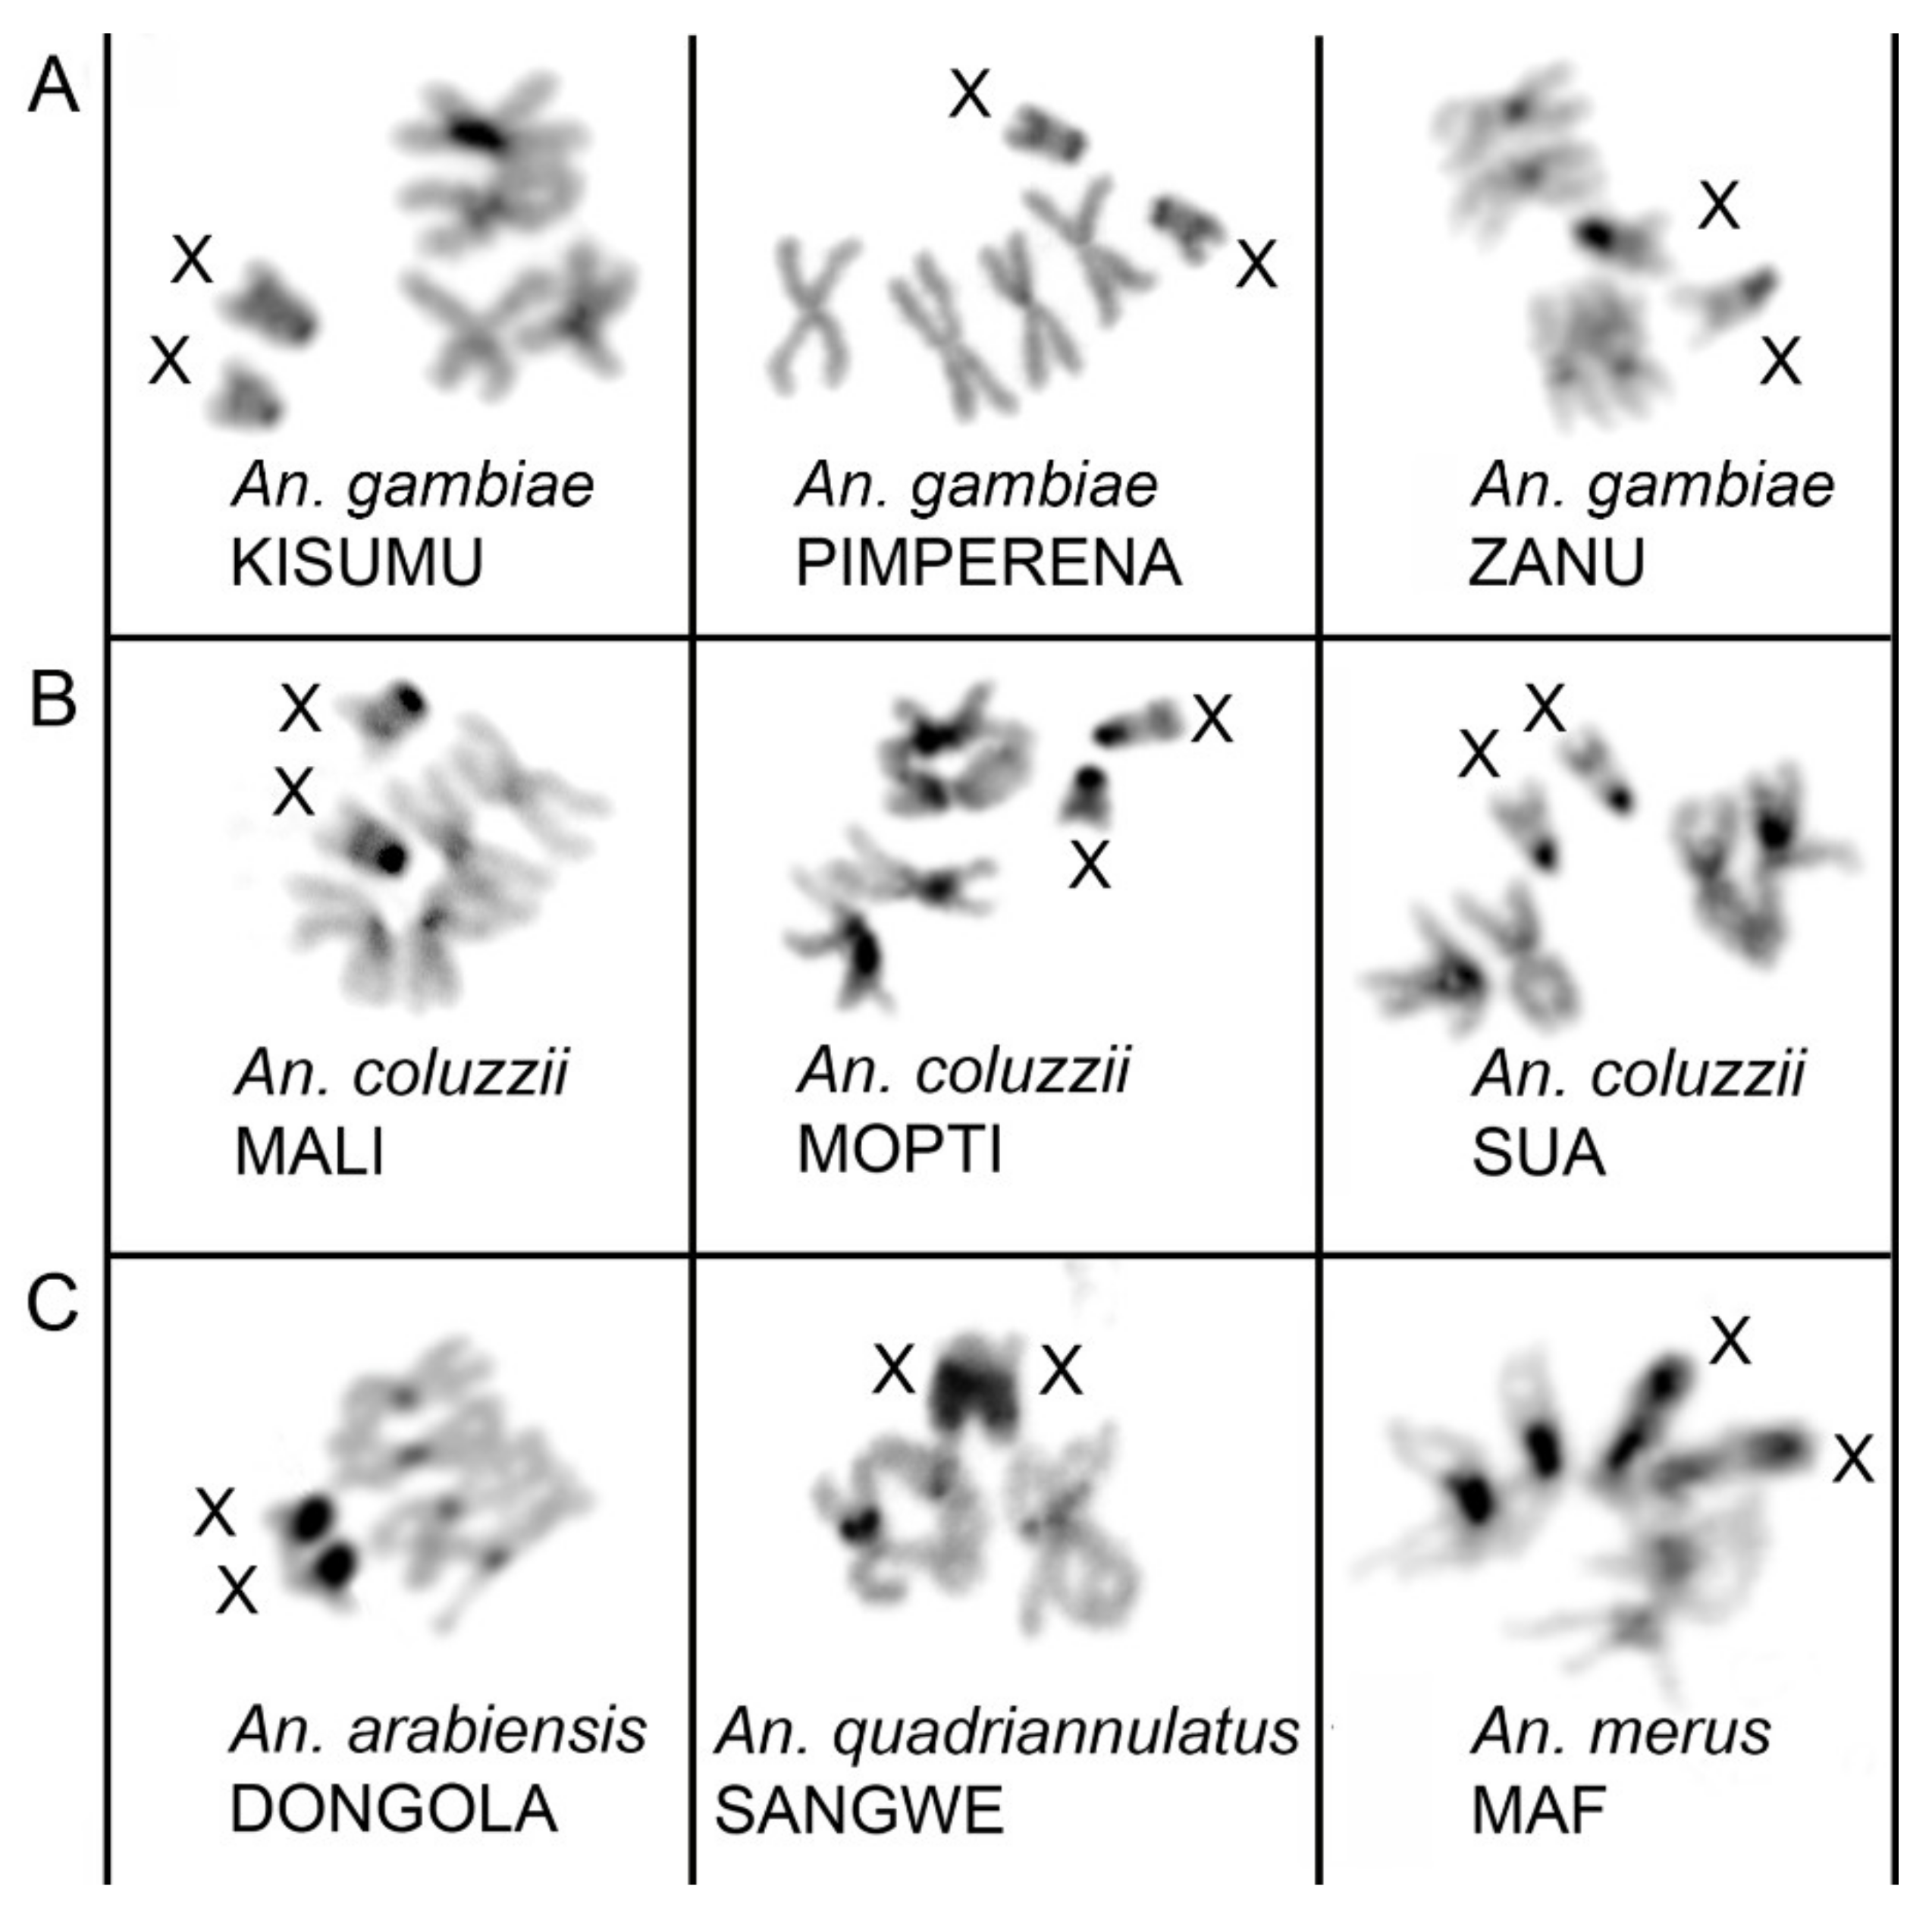
3.2. Variation in Heterochromatin Morphology Among Sibling Species of the An. gambiae Complex
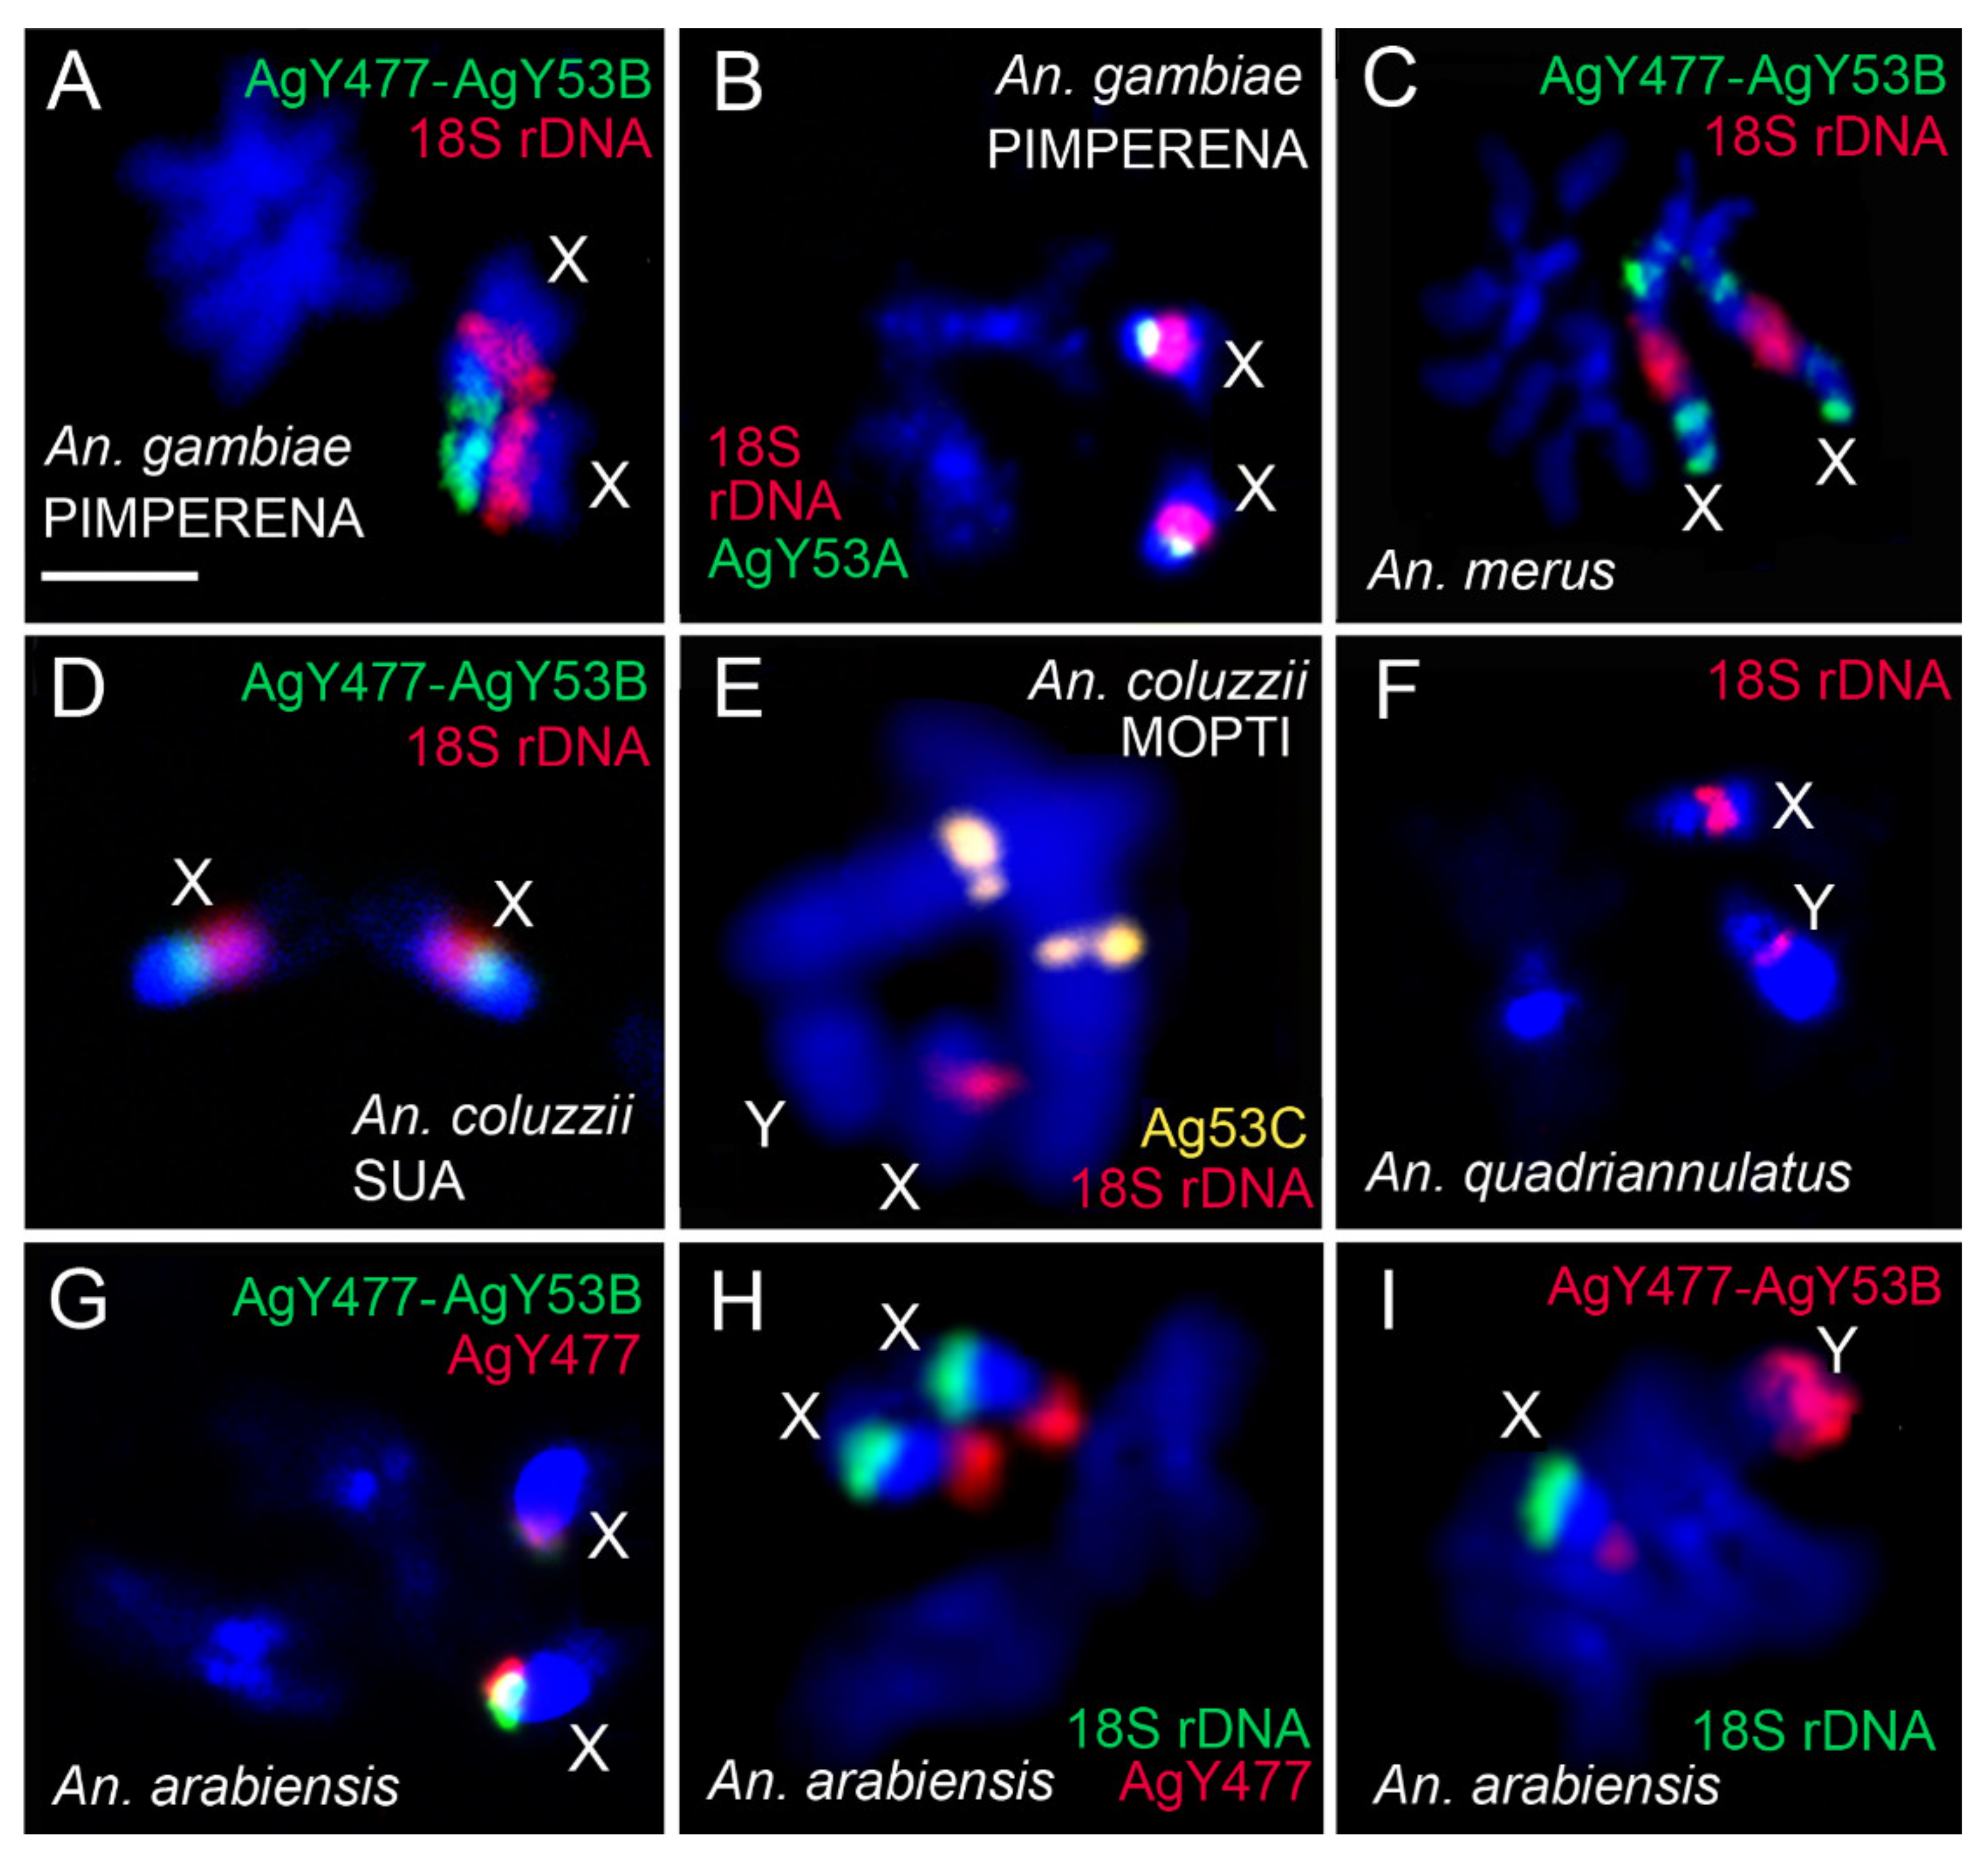
3.3. Molecular Variation of Heterochromatin Among Species of the An. gambiae Complex
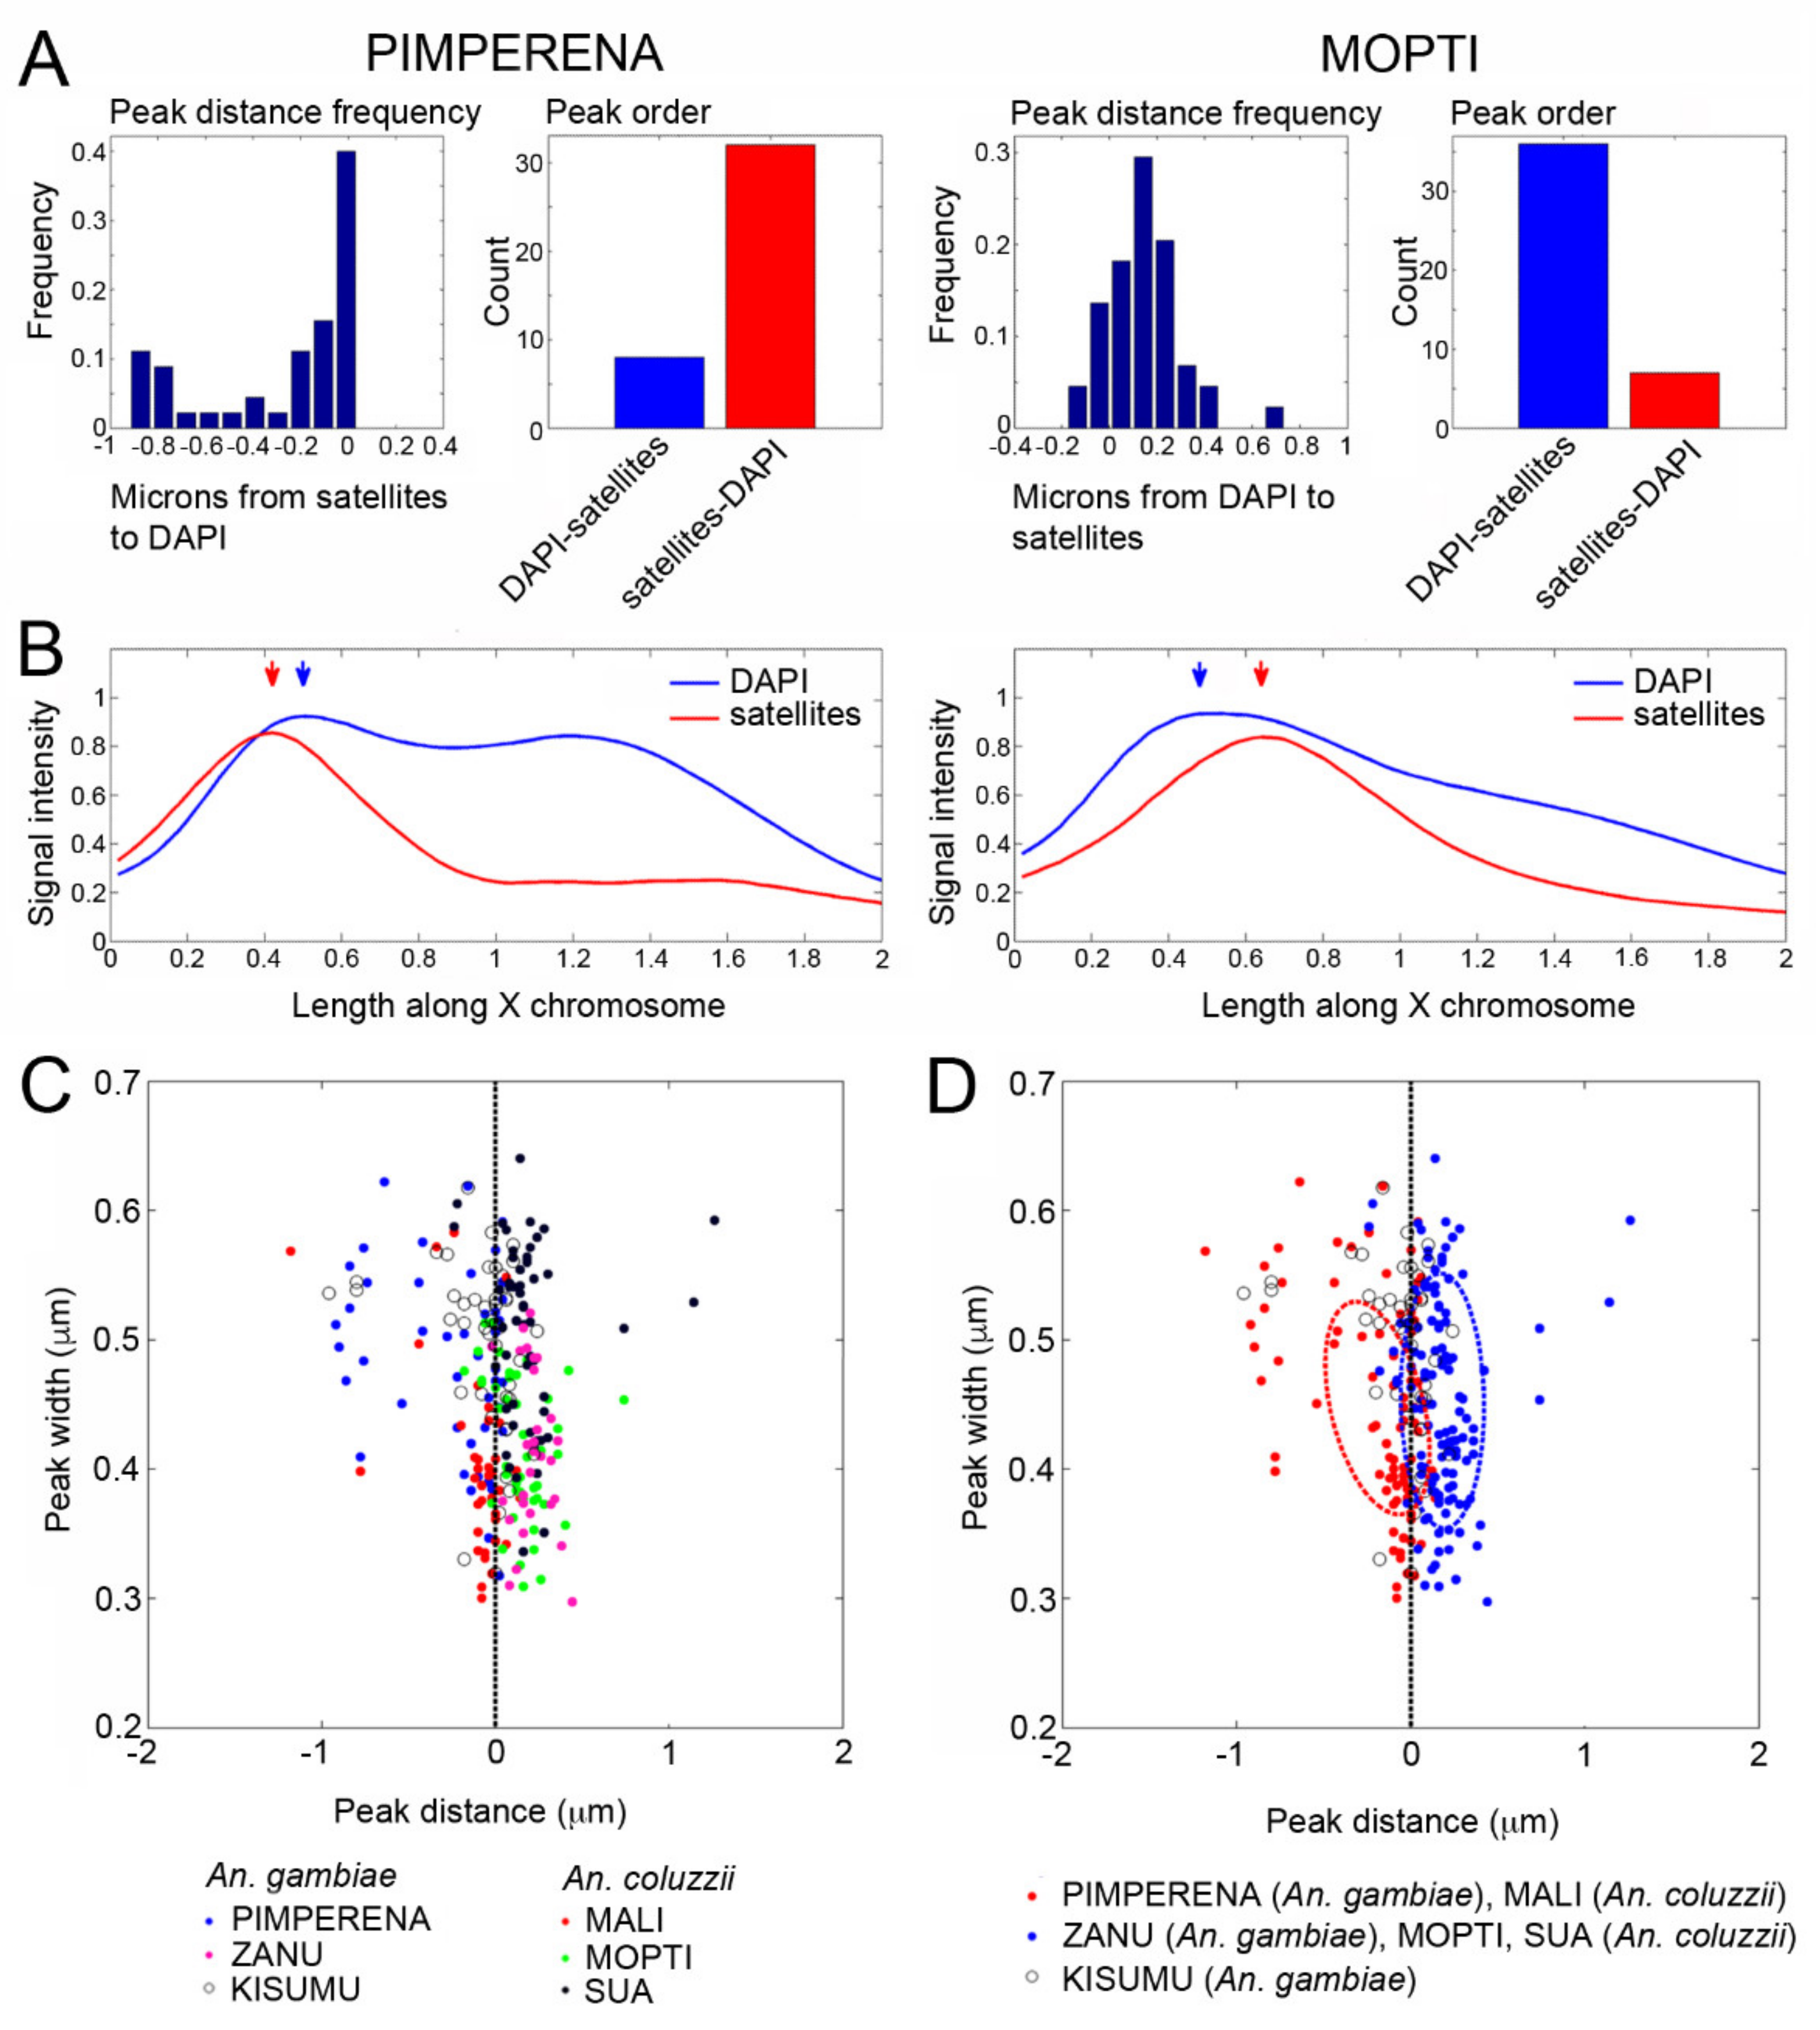
3.4. Shared Heterochromatin Variation Between An. coluzzii and An. gambiae
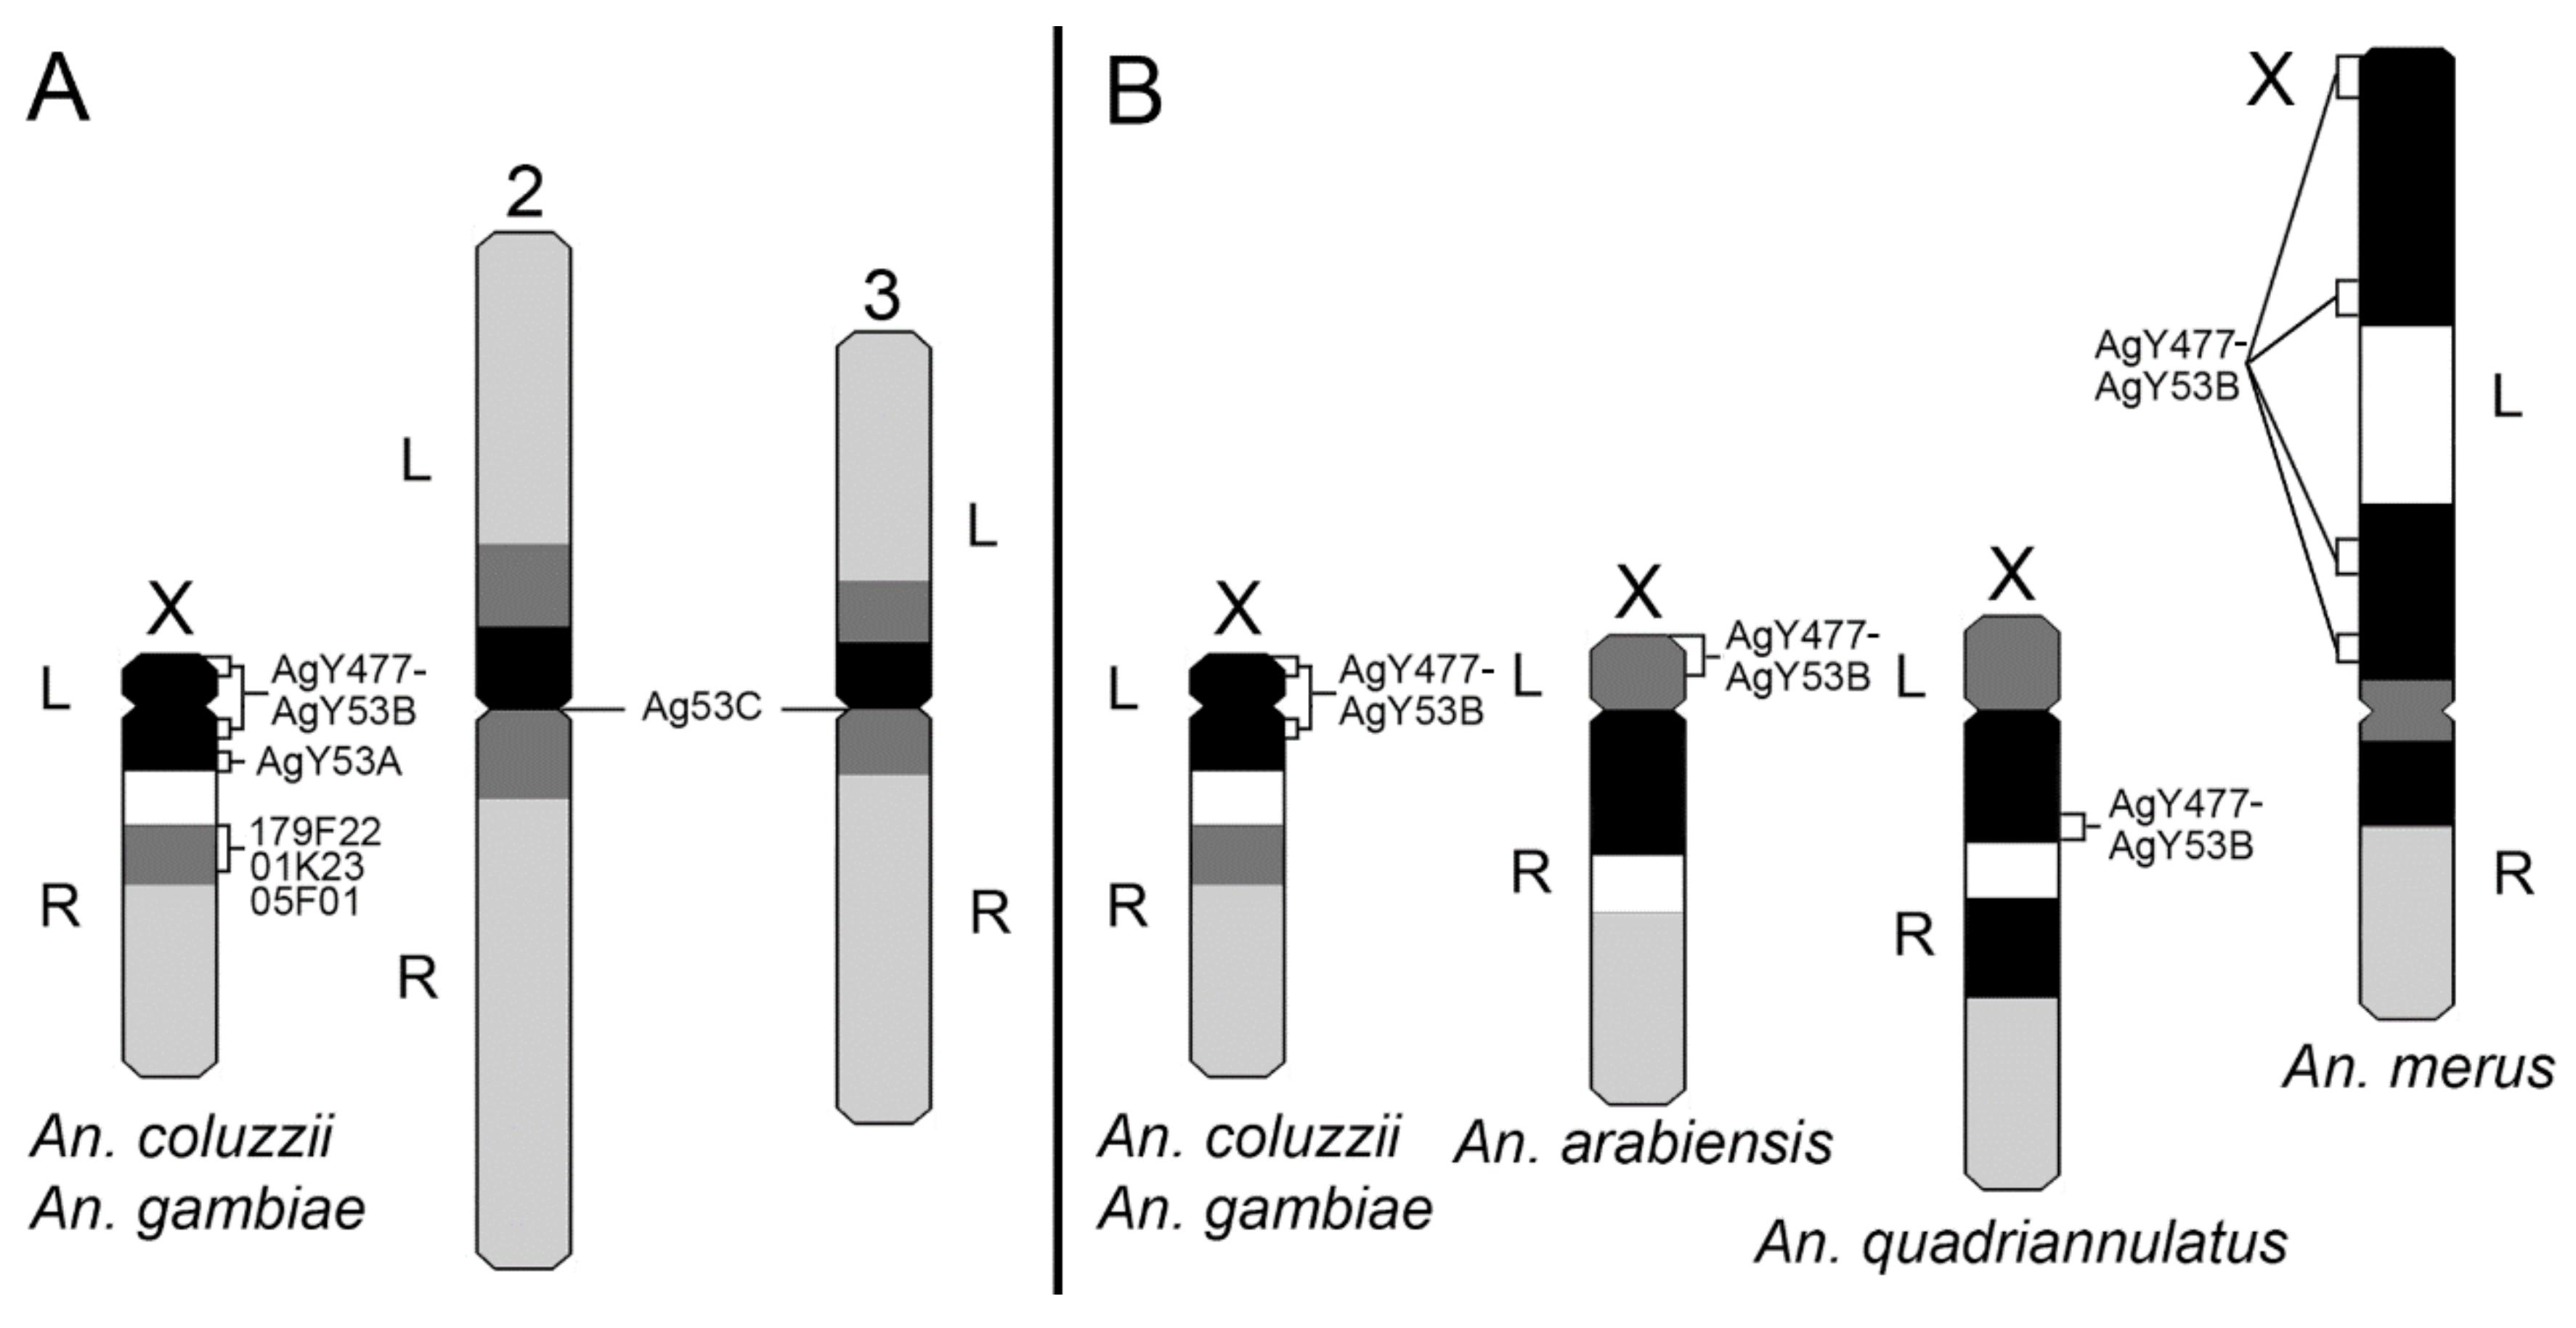
3.5. X Chromosome Idiograms for Species of the An. gambiae Complex
4. Discussion
5. Conclusions
Supplementary Materials
Author Contributions
Funding
Acknowledgments
Conflicts of Interest
References
- Davidson, G. The Five Mating Types in the Anopheles Gambiae Complex. Riv. Malariol. 1964, 43, 167–183. [Google Scholar] [PubMed]
- Davidson, G.; Paterson, H.E.; Coluzzi, M.; Mason, G.F.; Micks, D.W. The Anopheles gambiae Complex. In Genetics of Insect Vectors of Diesease; Wright, J.W., Pal, R., Eds.; Elsevier Publishing Company: Amsterdam, The Netherlands; London, UK; New York, NY, USA, 1967; pp. 211–249. [Google Scholar]
- Coluzzi, M.; Sabatini, A.; Petrarca, V.; Di Deco, M.A. Chromosomal differentiation and adaptation to human environments in the Anopheles gambiae complex. Trans. R. Soc. Trop. Med. Hyg. 1979, 73, 483–497. [Google Scholar] [CrossRef]
- Coluzzi, M.; Sabatini, A.; della Torre, A.; Di Deco, M.A.; Petrarca, V. A polytene chromosome analysis of the Anopheles gambiae species complex. Science 2002, 298, 1415–1418. [Google Scholar] [CrossRef] [PubMed]
- Della Torre, A.; Costantini, C.; Besansky, N.J.; Caccone, A.; Petrarca, V.; Powell, J.R.; Coluzzi, M. Speciation within Anopheles gambiae—The glass is half full. Science 2002, 298, 115–117. [Google Scholar] [CrossRef]
- Della Torre, A.; Fanello, C.; Akogbeto, M.; Dossou-yovo, J.; Favia, G.; Petrarca, V.; Coluzzi, M. Molecular evidence of incipient speciation within Anopheles gambiae s.s. in West Africa. Insect Mol. Biol. 2001, 10, 9–18. [Google Scholar] [CrossRef]
- Coetzee, M.; Hunt, R.H.; Wilkerson, R.; Della Torre, A.; Coulibaly, M.B.; Besansky, N.J. Anopheles coluzzii and Anopheles amharicus, new members of the Anopheles gambiae complex. Zootaxa 2013, 3619, 246–274. [Google Scholar] [CrossRef] [Green Version]
- Lawniczak, M.K.; Emrich, S.J.; Holloway, A.K.; Regier, A.P.; Olson, M.; White, B.; Redmond, S.; Fulton, L.; Appelbaum, E.; Godfrey, J.; et al. Widespread divergence between incipient Anopheles gambiae species revealed by whole genome sequences. Science 2010, 330, 512–514. [Google Scholar] [CrossRef] [Green Version]
- Barron, M.G.; Paupy, C.; Rahola, N.; Akone-Ella, O.; Ngangue, M.F.; Wilson-Bahun, T.A.; Pombi, M.; Kengne, P.; Costantini, C.; Simard, F.; et al. A new species in the major malaria vector complex sheds light on reticulated species evolution. Sci. Rep. 2019, 9, 14753. [Google Scholar] [CrossRef] [Green Version]
- White, B.J.; Collins, F.H.; Besansky, N.J. Evolution of Anopheles gambiae in Relation to Humans and Malaria. Annu. Rev. Ecol. Evol. Syst. 2011, 42, 111–132. [Google Scholar] [CrossRef]
- Slotman, M.; Della Torre, A.; Powell, J.R. The genetics of inviability and male sterility in hybrids between Anopheles gambiae and An. arabiensis. Genetics 2004, 167, 275–287. [Google Scholar] [CrossRef] [Green Version]
- Bernardini, F.; Galizi, R.; Wunderlich, M.; Taxiarchi, C.; Kranjc, N.; Kyrou, K.; Hammond, A.; Nolan, T.; Lawniczak, M.N.K.; Papathanos, P.A.; et al. Cross-Species Y Chromosome Function Between Malaria Vectors of the Anopheles gambiae Species Complex. Genetics 2017, 207, 729–740. [Google Scholar] [CrossRef] [PubMed] [Green Version]
- Presgraves, D.C.; Orr, H.A. Haldane’s rule in taxa lacking a hemizygous X. Science 1998, 282, 952–954. [Google Scholar] [CrossRef] [PubMed] [Green Version]
- Liang, J.; Sharakhov, I.V. Premeiotic and meiotic failures lead to hybrid male sterility in the Anopheles gambiae complex. Proc. Biol. Sci. 2019, 286, 20191080. [Google Scholar] [CrossRef] [PubMed] [Green Version]
- Haldane, J.B.S. Sex ratio and unisexual sterility in hybrid animals. J. Genet. 1922, 12, 101–109. [Google Scholar] [CrossRef] [Green Version]
- Diabate, A.; Dabire, R.K.; Millogo, N.; Lehmann, T. Evaluating the effect of postmating isolation between molecular forms of Anopheles gambiae (Diptera: Culicidae). J. Med. Entomol. 2007, 44, 60–64. [Google Scholar] [CrossRef]
- Aboagye-Antwi, F.; Alhafez, N.; Weedall, G.D.; Brothwood, J.; Kandola, S.; Paton, D.; Fofana, A.; Olohan, L.; Betancourth, M.P.; Ekechukwu, N.E.; et al. Experimental swap of Anopheles gambiae’s assortative mating preferences demonstrates key role of X-chromosome divergence island in incipient sympatric speciation. PLoS Genet. 2015, 11, e1005141. [Google Scholar] [CrossRef]
- Thawornwattana, Y.; Dalquen, D.; Yang, Z. Coalescent Analysis of Phylogenomic Data Confidently Resolves the Species Relationships in the Anopheles gambiae Species Complex. Mol. Biol. Evol. 2018, 35, 2512–2527. [Google Scholar] [CrossRef]
- Wilkins, E.E.; Howell, P.I.; Benedict, M.Q. IMP PCR primers detect single nucleotide polymorphisms for Anopheles gambiae species identification, Mopti and Savanna rDNA types, and resistance to dieldrin in Anopheles arabiensis. Malar. J. 2006, 5, 125. [Google Scholar] [CrossRef] [Green Version]
- Santolamazza, F.; Mancini, E.; Simard, F.; Qi, Y.; Tu, Z.; della Torre, A. Insertion polymorphisms of SINE200 retrotransposons within speciation islands of Anopheles gambiae molecular forms. Malar. J. 2008, 7, 163. [Google Scholar] [CrossRef] [Green Version]
- Caputo, B.; Nwakanma, D.; Caputo, F.P.; Jawara, M.; Oriero, E.C.; Hamid-Adiamoh, M.; Dia, I.; Konate, L.; Petrarca, V.; Pinto, J.; et al. Prominent intraspecific genetic divergence within Anopheles gambiae sibling species triggered by habitat discontinuities across a riverine landscape. Mol. Ecol. 2014, 23, 4574–4589. [Google Scholar] [CrossRef]
- Gimonneau, G.; Pombi, M.; Choisy, M.; Morand, S.; Dabire, R.K.; Simard, F. Larval habitat segregation between the molecular forms of the mosquito Anopheles gambiae in a rice field area of Burkina Faso, West Africa. Med. Vet. Entomol. 2012, 26, 9–17. [Google Scholar] [CrossRef] [PubMed]
- Dabire, K.R.; Diabate, A.; Agostinho, F.; Alves, F.; Manga, L.; Faye, O.; Baldet, T. Distribution of the members of Anopheles gambiae and pyrethroid knock-down resistance gene (kdr) in Guinea-Bissau, West Africa. Bull. Soc. Pathol. Exot. 2008, 101, 119–123. [Google Scholar] [PubMed]
- Gimonneau, G.; Pombi, M.; Dabire, R.K.; Diabate, A.; Morand, S.; Simard, F. Behavioural responses of Anopheles gambiae sensu stricto M and S molecular form larvae to an aquatic predator in Burkina Faso. Parasit. Vectors 2012, 5, 65. [Google Scholar] [CrossRef] [PubMed] [Green Version]
- Tripet, F.; Toure, Y.T.; Taylor, C.E.; Norris, D.E.; Dolo, G.; Lanzaro, G.C. DNA analysis of transferred sperm reveals significant levels of gene flow between molecular forms of Anopheles gambiae. Mol. Ecol. 2001, 10, 1725–1732. [Google Scholar] [CrossRef]
- Cassone, B.J.; Kamdem, C.; Cheng, C.; Tan, J.C.; Hahn, M.W.; Costantini, C.; Besansky, N.J. Gene expression divergence between malaria vector sibling species Anopheles gambiae and An. coluzzii from rural and urban Yaounde Cameroon. Mol. Ecol. 2014, 23, 2242–2259. [Google Scholar] [CrossRef] [Green Version]
- Sharakhova, M.V.; Peery, A.; Antonio-Nkondjio, C.; Xia, A.; Ndo, C.; Awono-Ambene, P.; Simard, F.; Sharakhov, I.V. Cytogenetic analysis of Anopheles ovengensis revealed high structural divergence of chromosomes in the Anopheles nili group. Infect. Genet. Evol. 2013, 16, 341–348. [Google Scholar] [CrossRef] [Green Version]
- Stegnii, V.N.; Novikov, Y.M.; Kabanova, V.M. Cytogenetic analysis and distribution of the malaria mosquito Anopheles beklemishevi. Zool. ZH 1978, 57, 873–876. [Google Scholar]
- Stegnii, V.N.; Kabanova, V.M. Chromosome analysis of the malarial mosquitoes Anopheles atroparvus and A. maculipennis (Diptera, Culicidae). Zool. ZH 1978, 8, 207–225. [Google Scholar]
- Gatti, M.; Santini, G.; Pimpinelli, S.; Coluzzi, M. Fluorescence banding techniques in the identification of sibling species of the Anopheles gambiae complex. Heredity (Edinb) 1977, 38, 105–108. [Google Scholar] [CrossRef] [Green Version]
- Bonaccorsi, S.; Santini, G.; Gatti, M.; Pimpinelli, S.; Colluzzi, M. Intraspecific polymorphism of sex chromosome heterochromatin in two species of the Anopheles gambiae complex. Chromosoma 1980, 76, 57–64. [Google Scholar] [CrossRef]
- Hall, A.B.; Papathanos, P.A.; Sharma, A.; Cheng, C.; Akbari, O.S.; Assour, L.; Bergman, N.H.; Cagnetti, A.; Crisanti, A.; Dottorini, T.; et al. Radical remodeling of the Y chromosome in a recent radiation of malaria mosquitoes. Proc. Natl. Acad. Sci. USA 2016, 113, E2114–E2123. [Google Scholar] [CrossRef] [PubMed] [Green Version]
- Fraccaro, M.; Tiepolo, L.; Laudani, U.; Marchi, A.; Jayakar, S.D. Y chromosome controls mating behaviour on Anopheles mosquitoes. Nature 1977, 265, 326–328. [Google Scholar] [CrossRef] [PubMed]
- Holt, R.A.; Subramanian, G.M.; Halpern, A.; Sutton, G.G.; Charlab, R.; Nusskern, D.R.; Wincker, P.; Clark, A.G.; Ribeiro, J.M.; Wides, R.; et al. The genome sequence of the malaria mosquito Anopheles gambiae. Science 2002, 298, 129–149. [Google Scholar] [CrossRef] [PubMed]
- Smith, C.D.; Shu, S.; Mungall, C.J.; Karpen, G.H. The Release 5.1 annotation of Drosophila melanogaster heterochromatin. Science 2007, 316, 1586–1591. [Google Scholar] [CrossRef] [PubMed] [Green Version]
- Manning, J.E.; Schmid, C.W.; Davidson, N. Interspersion of repetitive and nonrepetitive DNA sequences in the Drosophila melanogaster genome. Cell 1975, 4, 141–155. [Google Scholar] [CrossRef]
- Besansky, N.J.; Collins, F.H. The mosquito genome: Organization, evolution and manipulation. Parasitol. Today 1992, 8, 186–192. [Google Scholar] [CrossRef]
- Sharakhova, M.V.; Hammond, M.P.; Lobo, N.F.; Krzywinski, J.; Unger, M.F.; Hillenmeyer, M.E.; Bruggner, R.V.; Birney, E.; Collins, F.H. Update of the Anopheles gambiae PEST genome assembly. Genome Biol. 2007, 8, R5. [Google Scholar] [CrossRef] [Green Version]
- Sharakhova, M.V.; George, P.; Brusentsova, I.V.; Leman, S.C.; Bailey, J.A.; Smith, C.D.; Sharakhov, I.V. Genome mapping and characterization of the Anopheles gambiae heterochromatin. BMC Genom. 2010, 11, 459. [Google Scholar] [CrossRef] [Green Version]
- George, P.; Sharakhova, M.V.; Sharakhov, I.V. High-resolution cytogenetic map for the African malaria vector Anopheles gambiae. Insect Mol. Biol. 2010, 19, 675–682. [Google Scholar] [CrossRef] [Green Version]
- Kingan, S.B.; Heaton, H.; Cudini, J.; Lambert, C.C.; Baybayan, P.; Galvin, B.D.; Durbin, R.; Korlach, J.; Lawniczak, M.K.N. A High-Quality De novo Genome Assembly from a Single Mosquito Using PacBio Sequencing. Genes 2019, 10. [Google Scholar] [CrossRef] [Green Version]
- Neafsey, D.E.; Waterhouse, R.M.; Abai, M.R.; Aganezov, S.S.; Alekseyev, M.A.; Allen, J.E.; Amon, J.; Arca, B.; Arensburger, P.; Artemov, G.; et al. Mosquito genomics. Highly evolvable malaria vectors: The genomes of 16 Anopheles mosquitoes. Science 2015, 347, 1258522. [Google Scholar] [CrossRef] [Green Version]
- Turner, T.L.; Hahn, M.W.; Nuzhdin, S.V. Genomic islands of speciation in Anopheles gambiae. PLoS Biol. 2005, 3, e285. [Google Scholar] [CrossRef]
- White, B.J.; Cheng, C.; Simard, F.; Costantini, C.; Besansky, N.J. Genetic association of physically unlinked islands of genomic divergence in incipient species of Anopheles gambiae. Mol. Ecol. 2010, 19, 925–939. [Google Scholar] [CrossRef] [Green Version]
- Nwakanma, D.C.; Neafsey, D.E.; Jawara, M.; Adiamoh, M.; Lund, E.; Rodrigues, A.; Loua, K.M.; Konate, L.; Sy, N.; Dia, I.; et al. Breakdown in the process of incipient speciation in Anopheles gambiae. Genetics 2013, 193, 1221–1231. [Google Scholar] [CrossRef] [Green Version]
- Neafsey, D.E.; Lawniczak, M.K.; Park, D.J.; Redmond, S.N.; Coulibaly, M.B.; Traore, S.F.; Sagnon, N.; Costantini, C.; Johnson, C.; Wiegand, R.C.; et al. SNP genotyping defines complex gene-flow boundaries among African malaria vector mosquitoes. Science 2010, 330, 514–517. [Google Scholar] [CrossRef] [Green Version]
- Miles, A.; Harding, N.J.; Botta, G.; Clarkson, C.; Antao, T.; Kozak, K.; Schrider, D.; Kern, A.; Redmond, S.; Sharakhov, I.V.; et al. Genetic diversity of the African malaria vector Anopheles gambiae. Nature 2017, 552, 96–100. [Google Scholar]
- Zhimulev, I.F. Polytene chromosomes, heterochromatin, and position effect variegation. Adv. Genet. 1998, 37, 1–555. [Google Scholar]
- Scott, J.A.; Brogdon, W.G.; Collins, F.H. Identification of single specimens of the Anopheles gambiae complex by the polymerase chain reaction. Am. J. Trop. Med. Hyg. 1993, 49, 520–529. [Google Scholar] [CrossRef] [Green Version]
- Fanello, C.; Santolamazza, F.; della Torre, A. Simultaneous identification of species and molecular forms of the Anopheles gambiae complex by PCR-RFLP. Med. Vet. Entomol. 2002, 16, 461–464. [Google Scholar] [CrossRef]
- Benedict, M.; Dotson, E.M. Methods in Anopheles Research. 2015, p. 408. Available online: https://www.beiresources.org/Portals/2/VectorResources/2016%20Methods%20in%20Anopheles%20Research%20full%20manual.pdf (accessed on 12 December 2019).
- Timoshevskiy, V.A.; Sharma, A.; Sharakhov, I.V.; Sharakhova, M.V. Fluorescent in situ Hybridization on Mitotic Chromosomes of Mosquitoes. J. Vis. Exp. 2012, e4215. [Google Scholar] [CrossRef] [Green Version]
- Krzywinski, J.; Sangare, D.; Besansky, N.J. Satellite DNA from the Y chromosome of the malaria vector Anopheles gambiae. Genetics 2005, 169, 185–196. [Google Scholar] [CrossRef] [Green Version]
- Sharakhova, M.V.; George, P.; Timoshevskiy, V.; Sharma, A.; Peery, A.; Sharakhov, I.V. Mosquitoes (Diptera). In Protocols for Cytogenetic Mapping of Arthropod Genomes; Sharakhov, I.V., Ed.; CRC Press; Taylor & Francis Group: Boca Raton, FL, USA, 2015; pp. 93–170. [Google Scholar]
- MATLAB. MATLAB:2010 Version 7.10.0 (R2010a); The MathWorks Inc.: Natick, MA, USA, 2010. [Google Scholar]
- Kinney, N.; Sharakhov, I.V. MATLAB Script to Measure the Position of Fluorescence Peaks on Chromosomes. Figshare. Software. Available online: https://0-doi-org.brum.beds.ac.uk/10.6084/m9.figshare.11782140.v1 (accessed on 31 January 2020).
- Trifonov, V.A.; Vorobieva, N.V.; Serdyukova, N.A.; Rens, W. FISH with and Without COT1 DNA. In Fluorescence In Situ Hybridization (FISH)—Application Guide; Springer: Berlin/Heidelberg, Germany, 2009. [Google Scholar] [CrossRef]
- Kumar, A.; Rai, K.S. Chromosomal localization and copy number of 18S + 28S ribosomal RNA genes in evolutionarily diverse mosquitoes (Diptera, Culicidae). Hereditas 1990, 113, 277–289. [Google Scholar] [CrossRef]
- Grushko, O.G.; Rusakova, A.M.; Sharakhova, M.V.; Sharakhov, I.V.; Stegnii, V.N. Localization of repetitive DNA sequences in the pericentromeric heterochromatin of malarial mosquitoes of the “Anopheles maculipennis” complex. Tsitologiia 2006, 48, 240–245. [Google Scholar]
- Jiang, X.; Peery, A.; Hall, A.; Sharma, A.; Chen, X.G.; Waterhouse, R.M.; Komissarov, A.; Riehl, M.M.; Shouche, Y.; Sharakhova, M.V.; et al. Genome analysis of a major urban malaria vector mosquito, Anopheles stephensi. Genome Biol. 2014, 15, 459. [Google Scholar] [CrossRef]
- Chang, C.H.; Larracuente, A.M. Heterochromatin-Enriched Assemblies Reveal the Sequence and Organization of the Drosophila melanogaster Y Chromosome. Genetics 2019, 211, 333–348. [Google Scholar] [CrossRef] [Green Version]
- Brideau, N.J.; Flores, H.A.; Wang, J.; Maheshwari, S.; Wang, X.; Barbash, D.A. Two Dobzhansky-Muller genes interact to cause hybrid lethality in Drosophila. Science 2006, 314, 1292–1295. [Google Scholar] [CrossRef] [Green Version]
- Cattani, M.V.; Presgraves, D.C. Genetics and lineage-specific evolution of a lethal hybrid incompatibility between Drosophila mauritiana and its sibling species. Genetics 2009, 181, 1545–1555. [Google Scholar] [CrossRef] [Green Version]
- Satyaki, P.R.; Cuykendall, T.N.; Wei, K.H.; Brideau, N.J.; Kwak, H.; Aruna, S.; Ferree, P.M.; Ji, S.; Barbash, D.A. The Hmr and Lhr hybrid incompatibility genes suppress a broad range of heterochromatic repeats. PLoS Genet. 2014, 10, e1004240. [Google Scholar] [CrossRef] [Green Version]
- Cattani, M.V.; Presgraves, D.C. Incompatibility between X chromosome factor and pericentric heterochromatic region causes lethality in hybrids between Drosophila melanogaster and its sibling species. Genetics 2012, 191, 549–559. [Google Scholar] [CrossRef] [Green Version]
- Blum, J.A.; Bonaccorsi, S.; Marzullo, M.; Palumbo, V.; Yamashita, Y.M.; Barbash, D.A.; Gatti, M. The Hybrid Incompatibility Genes Lhr and Hmr Are Required for Sister Chromatid Detachment During Anaphase but Not for Centromere Function. Genetics 2017, 207, 1457–1472. [Google Scholar] [CrossRef] [Green Version]
- Ferree, P.M.; Prasad, S. How can satellite DNA divergence cause reproductive isolation? Let us count the chromosomal ways. Genet. Res. Int. 2012, 2012, 430136. [Google Scholar] [CrossRef] [Green Version]
- Kejnovsky, E.; Hobza, R.; Cermak, T.; Kubat, Z.; Vyskot, B. The role of repetitive DNA in structure and evolution of sex chromosomes in plants. Heredity 2009, 102, 533–541. [Google Scholar] [CrossRef] [Green Version]
- Matsunaga, S. Junk DNA promotes sex chromosome evolution. Heredity 2009, 102, 525–526. [Google Scholar] [CrossRef]
- Deakin, J.E.; Potter, S.; O’Neill, R.; Ruiz-Herrera, A.; Cioffi, M.B.; Eldridge, M.D.B.; Fukui, K.; Marshall Graves, J.A.; Griffin, D.; Grutzner, F.; et al. Chromosomics: Bridging the Gap between Genomes and Chromosomes. Genes 2019, 10. [Google Scholar] [CrossRef] [Green Version]
- Dion-Cote, A.M.; Barbash, D.A. Beyond speciation genes: An overview of genome stability in evolution and speciation. Curr. Opin. Genet. Dev. 2017, 47, 17–23. [Google Scholar] [CrossRef]
- Ishishita, S.; Tsuboi, K.; Ohishi, N.; Tsuchiya, K.; Matsuda, Y. Abnormal pairing of X and Y sex chromosomes during meiosis I in interspecific hybrids of Phodopus campbelli and P. sungorus. Sci. Rep. 2015, 5, 9435. [Google Scholar] [CrossRef] [Green Version]
- Bikchurina, T.I.; Tishakova, K.V.; Kizilova, E.A.; Romanenko, S.A.; Serdyukova, N.A.; Torgasheva, A.A.; Borodin, P.M. Chromosome Synapsis and Recombination in Male-Sterile and Female-Fertile Interspecies Hybrids of the Dwarf Hamsters (Phodopus, Cricetidae). Genes 2018, 9. [Google Scholar] [CrossRef] [Green Version]
- Bhattacharyya, T.; Gregorova, S.; Mihola, O.; Anger, M.; Sebestova, J.; Denny, P.; Simecek, P.; Forejt, J. Mechanistic basis of infertility of mouse intersubspecific hybrids. Proc. Natl. Acad. Sci. USA 2013, 110, E468–E477. [Google Scholar] [CrossRef] [Green Version]
- Bhattacharyya, T.; Reifova, R.; Gregorova, S.; Simecek, P.; Gergelits, V.; Mistrik, M.; Martincova, I.; Pialek, J.; Forejt, J. X chromosome control of meiotic chromosome synapsis in mouse inter-subspecific hybrids. PLoS Genet. 2014, 10, e1004088. [Google Scholar] [CrossRef] [Green Version]
- Jagannathan, M.; Warsinger-Pepe, N.; Watase, G.J.; Yamashita, Y.M. Comparative Analysis of Satellite DNA in the Drosophila melanogaster Species Complex. G3 (Bethesda) 2017, 7, 693–704. [Google Scholar] [CrossRef] [Green Version]
- Craddock, E.M.; Gall, J.G.; Jonas, M. Hawaiian Drosophila genomes: Size variation and evolutionary expansions. Genetica 2016, 144, 107–124. [Google Scholar] [CrossRef] [PubMed]
- De Lima, L.G.; Svartman, M.; Kuhn, G.C.S. Dissecting the Satellite DNA Landscape in Three Cactophilic Drosophila Sequenced Genomes. G3 (Bethesda) 2017, 7, 2831–2843. [Google Scholar] [CrossRef] [PubMed] [Green Version]
- Wei, K.H.; Grenier, J.K.; Barbash, D.A.; Clark, A.G. Correlated variation and population differentiation in satellite DNA abundance among lines of Drosophila melanogaster. Proc. Natl. Acad. Sci. USA 2014, 111, 18793–18798. [Google Scholar] [CrossRef] [PubMed] [Green Version]
- Talbert, P.B.; Kasinathan, S.; Henikoff, S. Simple and Complex Centromeric Satellites in Drosophila Sibling Species. Genetics 2018, 208, 977–990. [Google Scholar] [CrossRef] [Green Version]
- Lemos, B.; Branco, A.T.; Hartl, D.L. Epigenetic effects of polymorphic Y chromosomes modulate chromatin components, immune response, and sexual conflict. Proc. Natl. Acad. Sci. USA 2010, 107, 15826–15831. [Google Scholar] [CrossRef] [Green Version]
- Francisco, F.O.; Lemos, B. How do y-chromosomes modulate genome-wide epigenetic states: Genome folding, chromatin sinks, and gene expression. J. Genom. 2014, 2, 94–103. [Google Scholar] [CrossRef] [Green Version]
- Sochorova, J.; Garcia, S.; Galvez, F.; Symonova, R.; Kovarik, A. Evolutionary trends in animal ribosomal DNA loci: Introduction to a new online database. Chromosoma 2018, 127, 141–150. [Google Scholar] [CrossRef] [Green Version]
- Larson, K.; Yan, S.J.; Tsurumi, A.; Liu, J.; Zhou, J.; Gaur, K.; Guo, D.; Eickbush, T.H.; Li, W.X. Heterochromatin formation promotes longevity and represses ribosomal RNA synthesis. PLoS Genet. 2012, 8, e1002473. [Google Scholar] [CrossRef] [Green Version]
- Lu, K.L.; Nelson, J.O.; Watase, G.J.; Warsinger-Pepe, N.; Yamashita, Y.M. Transgenerational dynamics of rDNA copy number in Drosophila male germline stem cells. Elife 2018, 7. [Google Scholar] [CrossRef]
- Chestkov, I.V.; Jestkova, E.M.; Ershova, E.S.; Golimbet, V.E.; Lezheiko, T.V.; Kolesina, N.Y.; Porokhovnik, L.N.; Lyapunova, N.A.; Izhevskaya, V.L.; Kutsev, S.I.; et al. Abundance of ribosomal RNA gene copies in the genomes of schizophrenia patients. Schizophr. Res. 2018, 197, 305–314. [Google Scholar] [CrossRef]
- Gibbons, J.G.; Branco, A.T.; Yu, S.K.; Lemos, B. Ribosomal DNA copy number is coupled with gene expression variation and mitochondrial abundance in humans. Nat. Commun. 2014, 5, 1–12. [Google Scholar] [CrossRef] [PubMed] [Green Version]
- Dion-Cote, A.M.; Symonova, R.; Rab, P.; Bernatchez, L. Reproductive isolation in a nascent species pair is associated with aneuploidy in hybrid offspring. Proc. R. Soc. B Biol. Sci. 2015, 282, 20142826. [Google Scholar] [CrossRef] [PubMed]
- Dion-Cote, A.M.; Symonova, R.; Lamaze, F.C.; Pelikanova, S.; Rab, P.; Bernatchez, L. Standing chromosomal variation in Lake Whitefish species pairs: The role of historical contingency and relevance for speciation. Mol. Ecol. 2017, 26, 178–192. [Google Scholar] [CrossRef] [PubMed]
- Symonova, R. Integrative rDNAomics-Importance of the Oldest Repetitive Fraction of the Eukaryote Genome. Genes 2019, 10. [Google Scholar] [CrossRef] [PubMed] [Green Version]


© 2020 by the authors. Licensee MDPI, Basel, Switzerland. This article is an open access article distributed under the terms and conditions of the Creative Commons Attribution (CC BY) license (http://creativecommons.org/licenses/by/4.0/).
Share and Cite
Sharma, A.; Kinney, N.A.; Timoshevskiy, V.A.; Sharakhova, M.V.; Sharakhov, I.V. Structural Variation of the X Chromosome Heterochromatin in the Anopheles gambiae Complex. Genes 2020, 11, 327. https://0-doi-org.brum.beds.ac.uk/10.3390/genes11030327
Sharma A, Kinney NA, Timoshevskiy VA, Sharakhova MV, Sharakhov IV. Structural Variation of the X Chromosome Heterochromatin in the Anopheles gambiae Complex. Genes. 2020; 11(3):327. https://0-doi-org.brum.beds.ac.uk/10.3390/genes11030327
Chicago/Turabian StyleSharma, Atashi, Nicholas A. Kinney, Vladimir A. Timoshevskiy, Maria V. Sharakhova, and Igor V. Sharakhov. 2020. "Structural Variation of the X Chromosome Heterochromatin in the Anopheles gambiae Complex" Genes 11, no. 3: 327. https://0-doi-org.brum.beds.ac.uk/10.3390/genes11030327