Genetic Characterization of Cupped Oyster Resources in Europe Using Informative Single Nucleotide Polymorphism (SNP) Panels

 ,
,
Abstract
:1. Introduction
2. Materials and Methods
2.1. SNP Panels
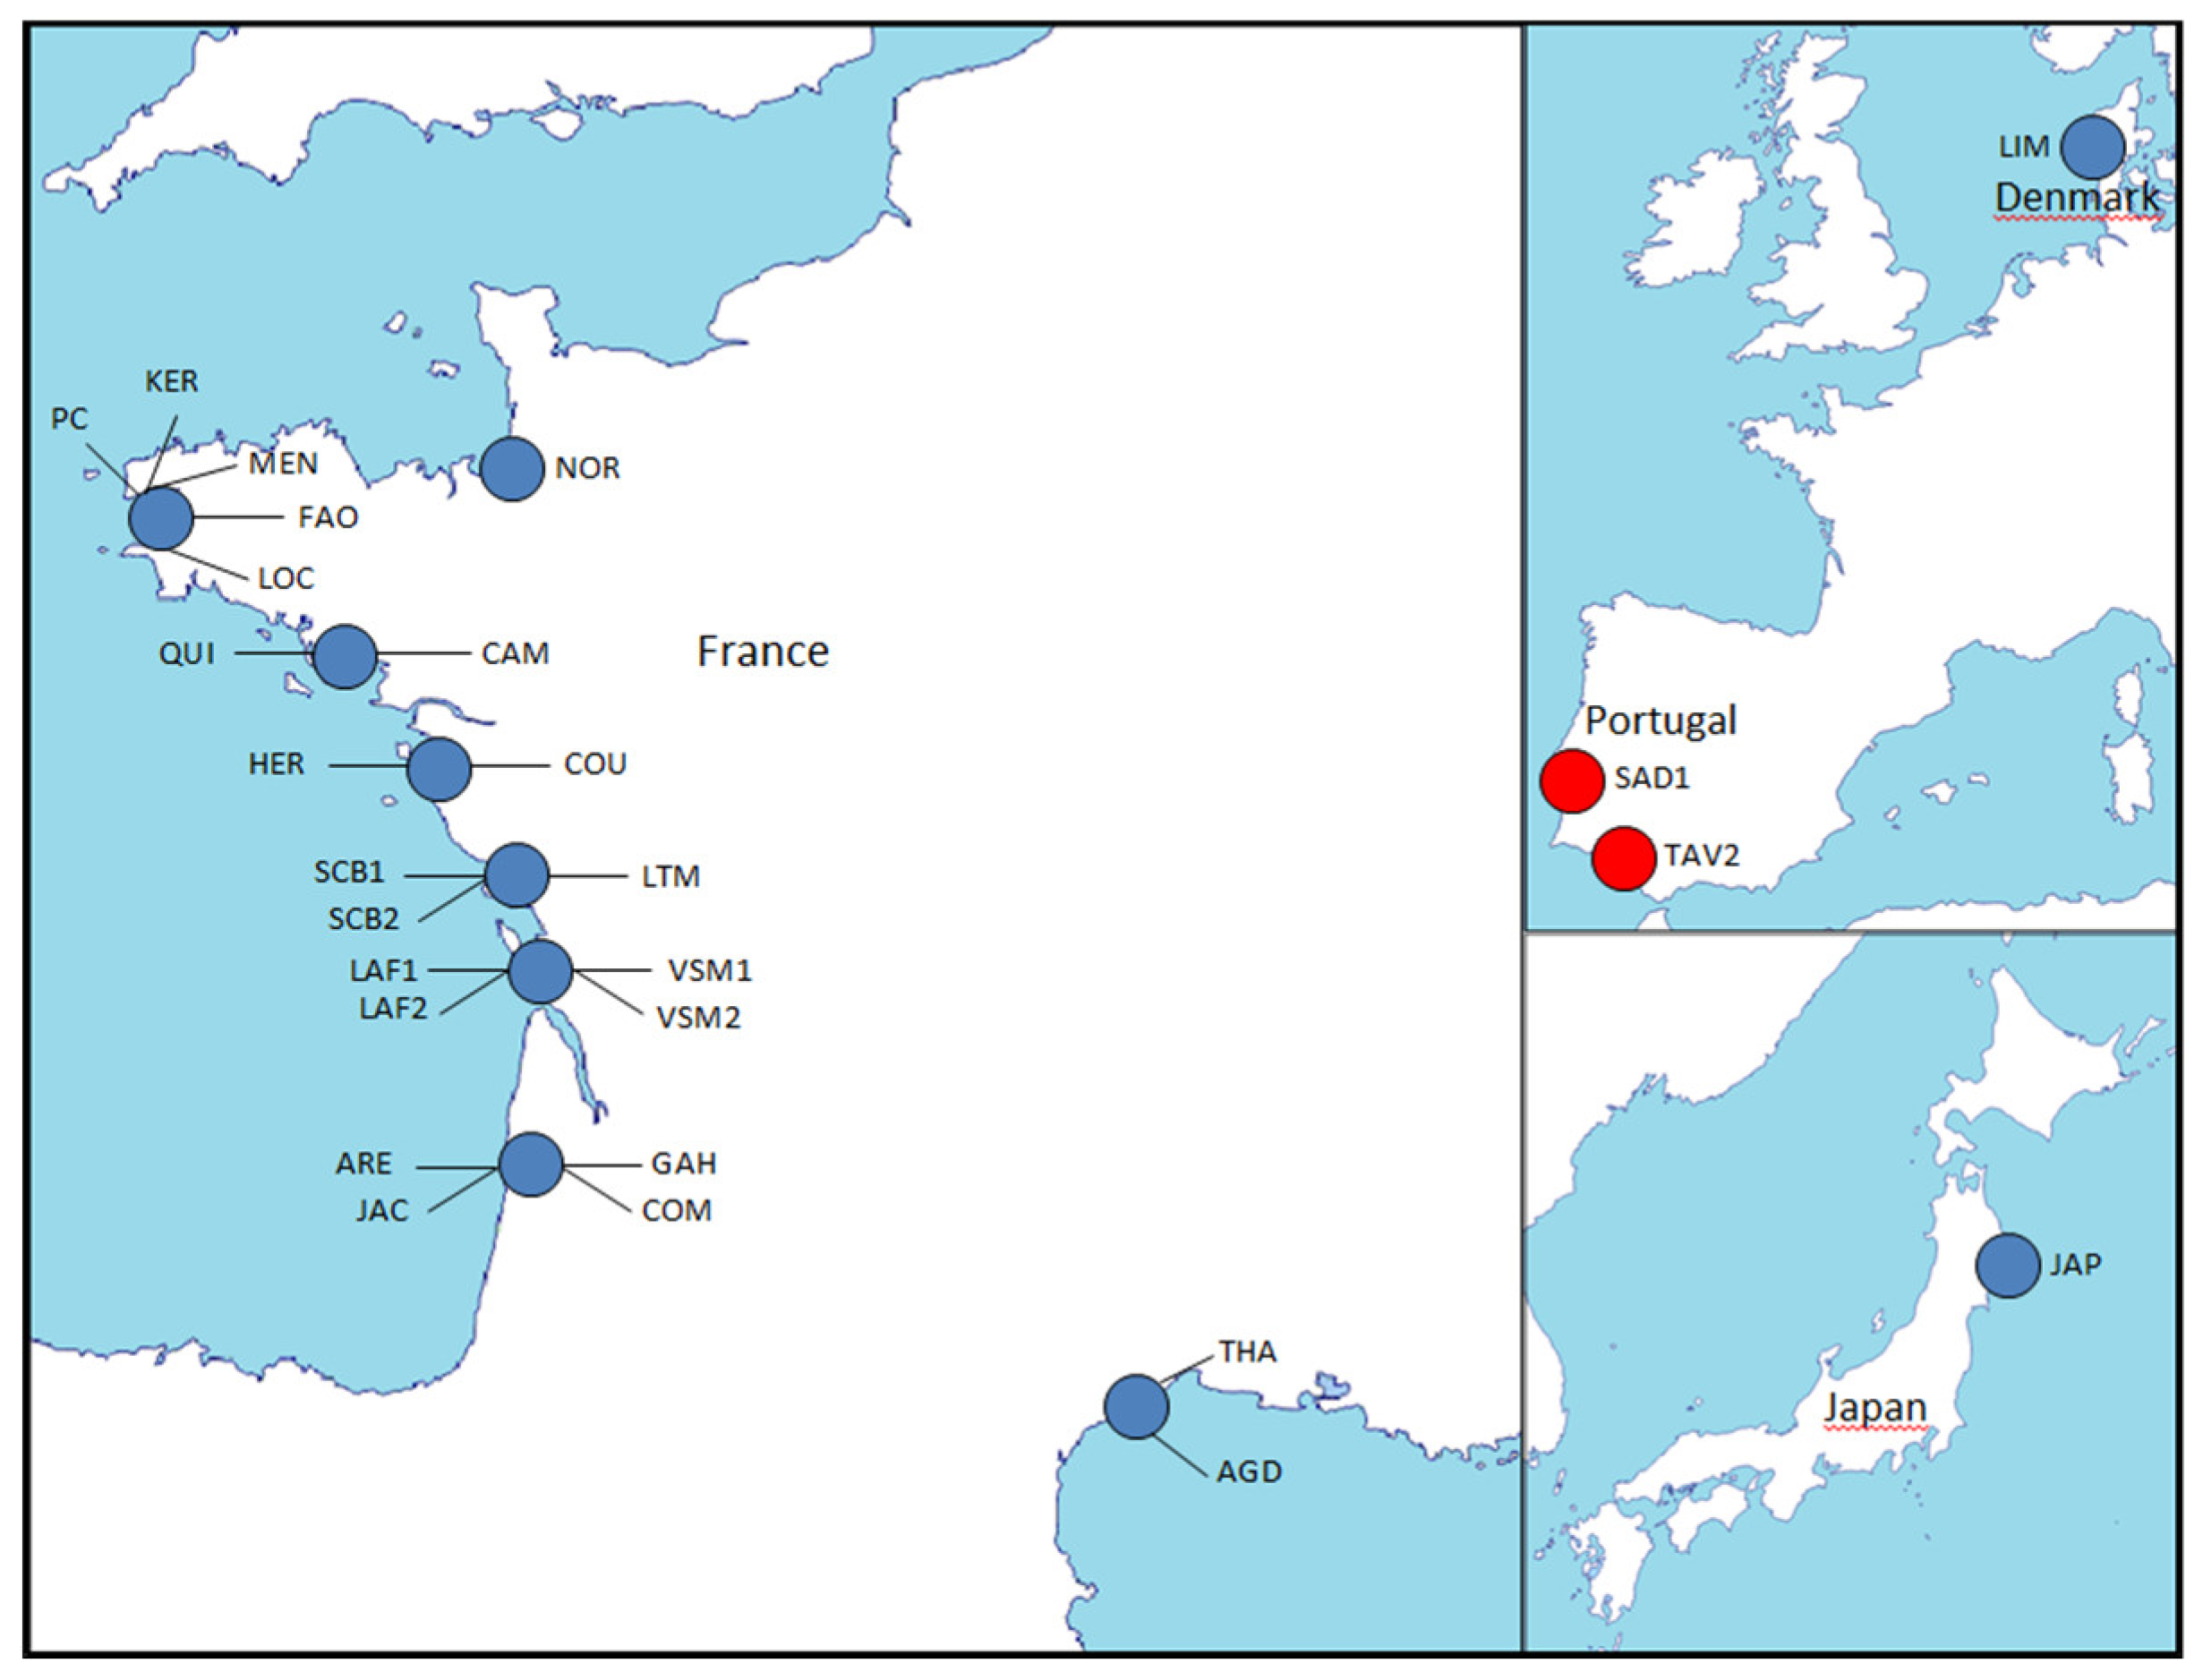
2.2. Biological Material
2.2.1. Biological Material Used to Develop the Ancestry Informative Panel (Dataset 1)
2.2.2. Biological Material Used to Confirm the Power of the Ancestry Informative Panel (Dataset 2)
2.2.3. Biological Material Used with the 80 SNPs Panel to Characterize the European Cupped Oyster Diversity (Dataset 3)
2.3. Genotyping Methods
2.4. Population Genetics Analyses
3. Results
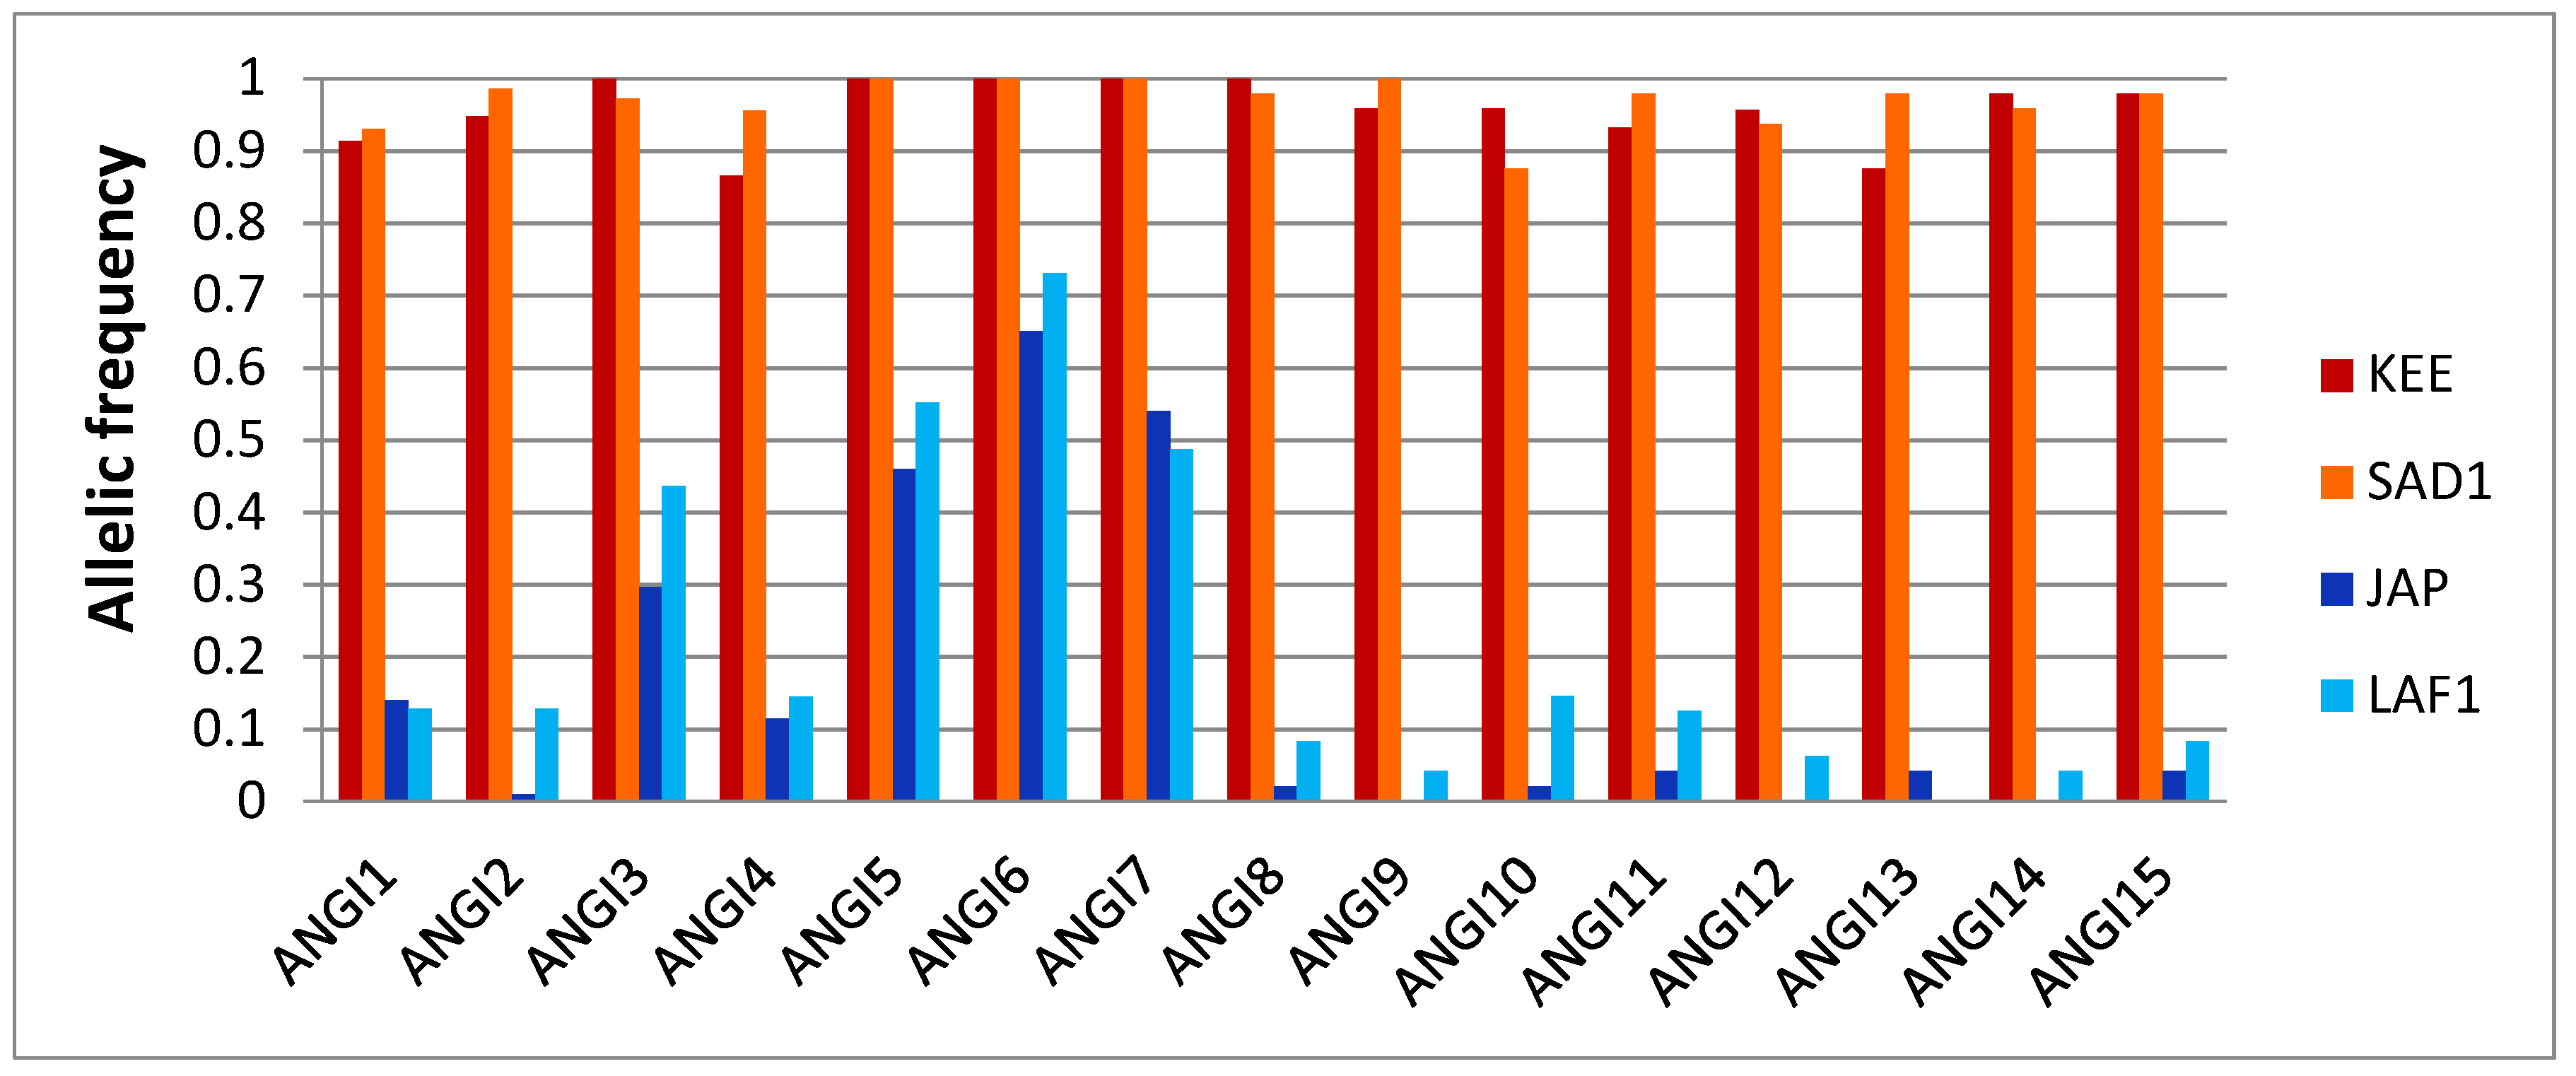
3.1. Development of Ancestry Informative SNP Panels
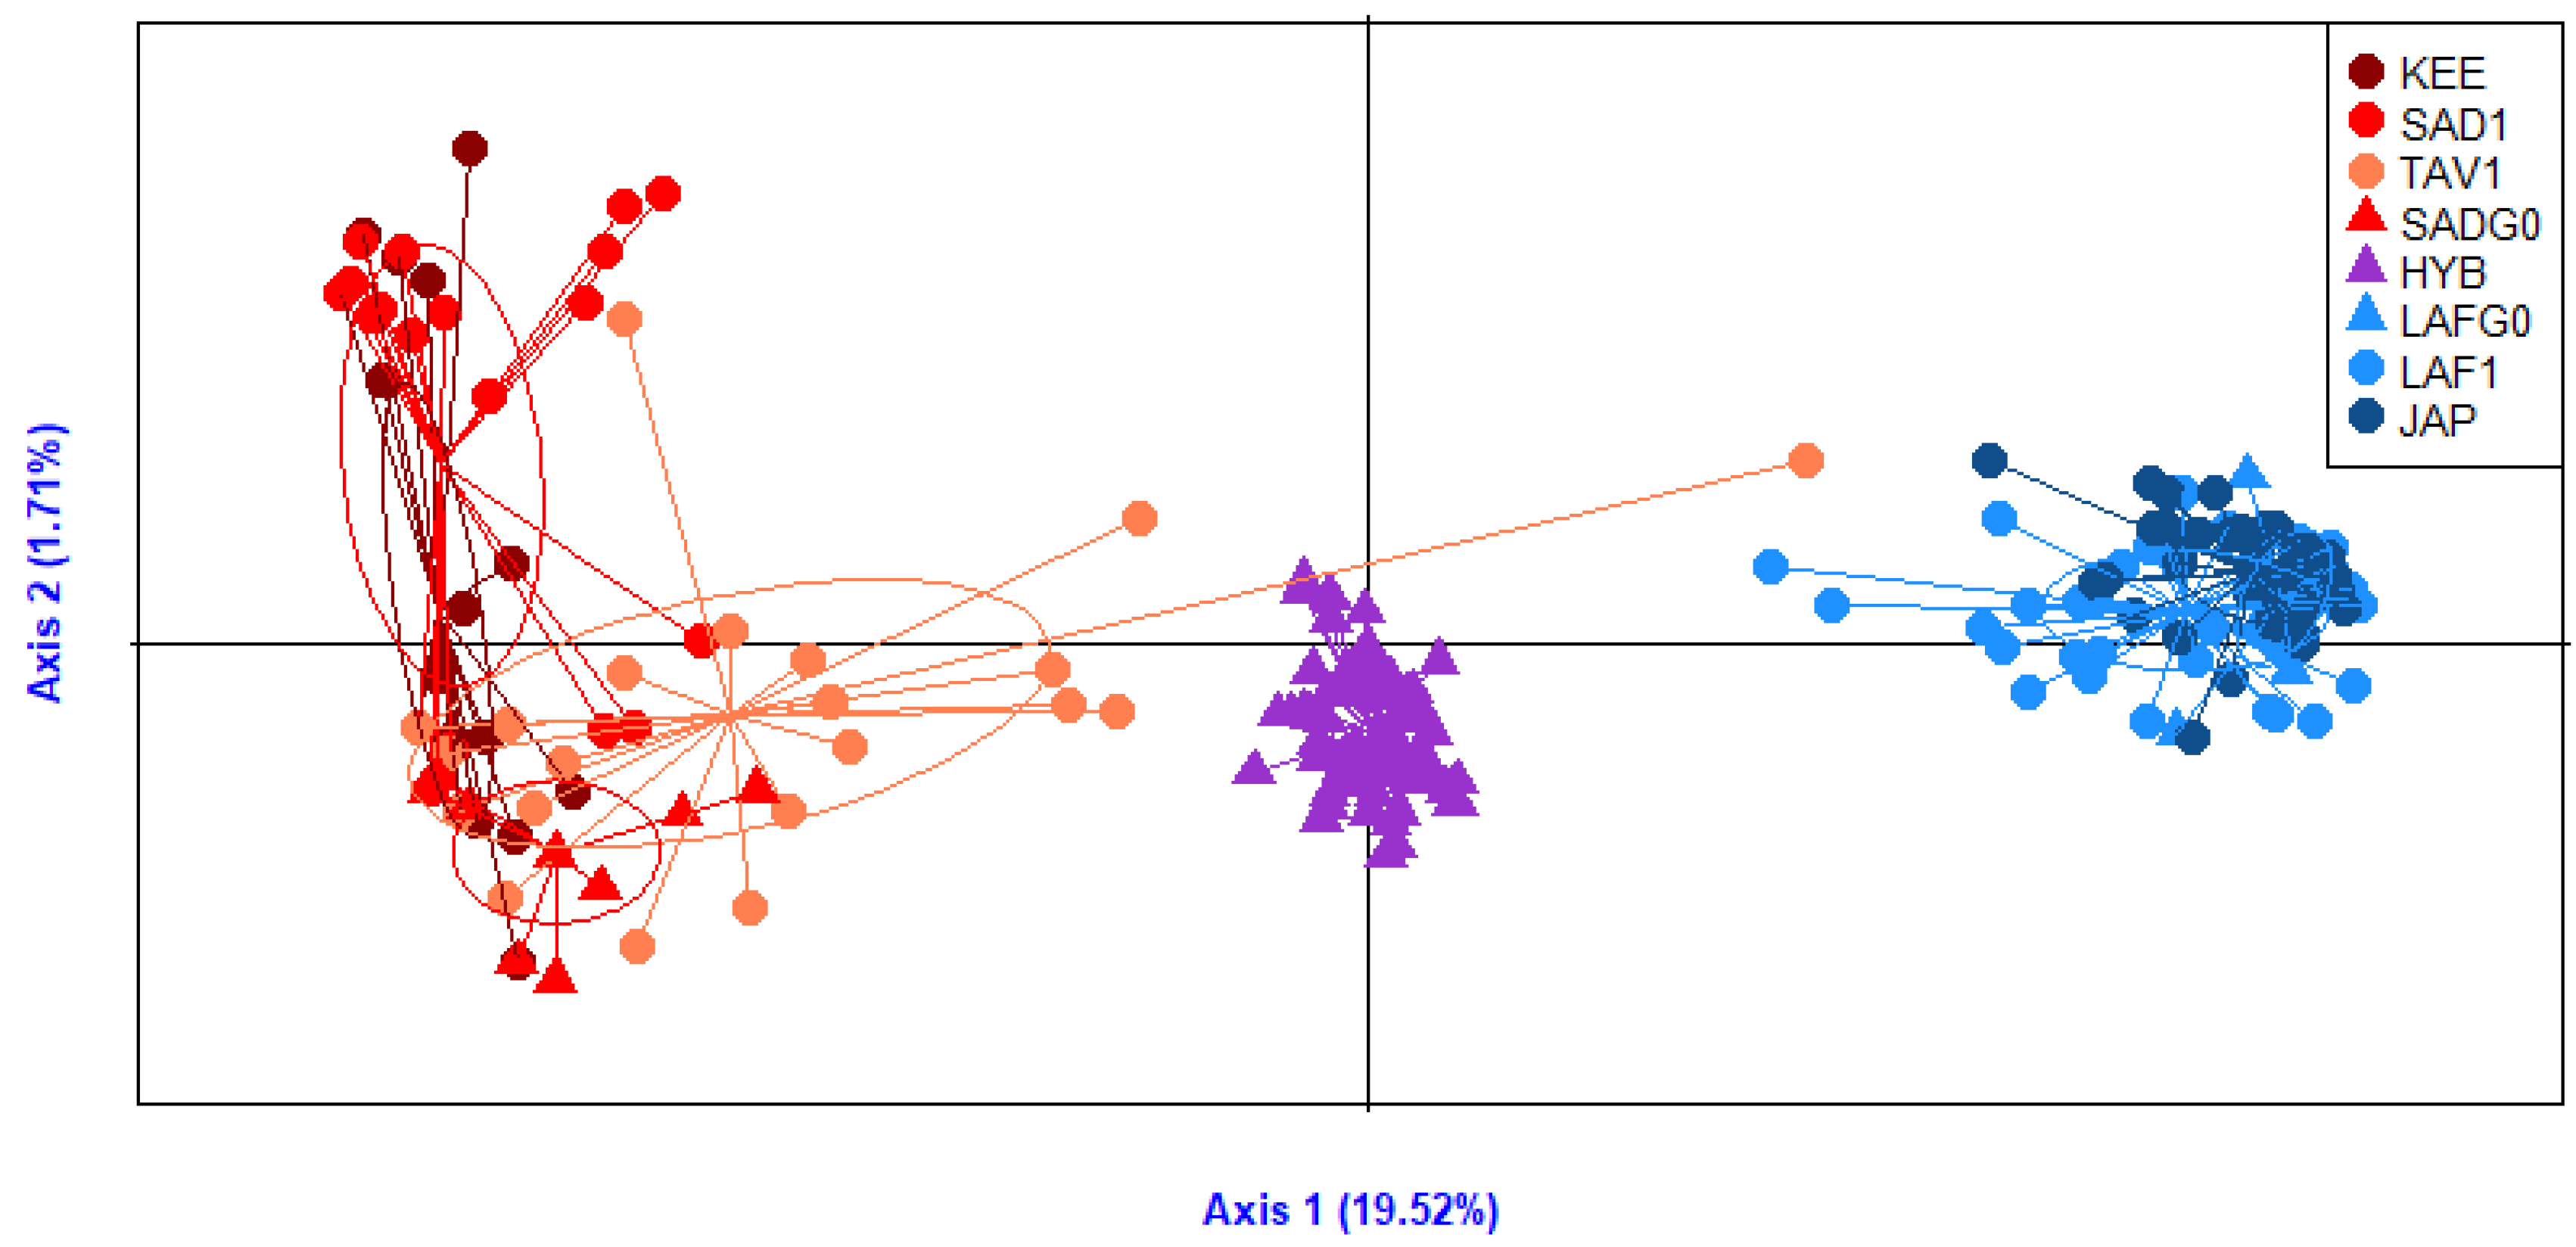
3.2. Ancestry Informative Panels Differentiate Crassostrea gigas and Crassostrea angulata
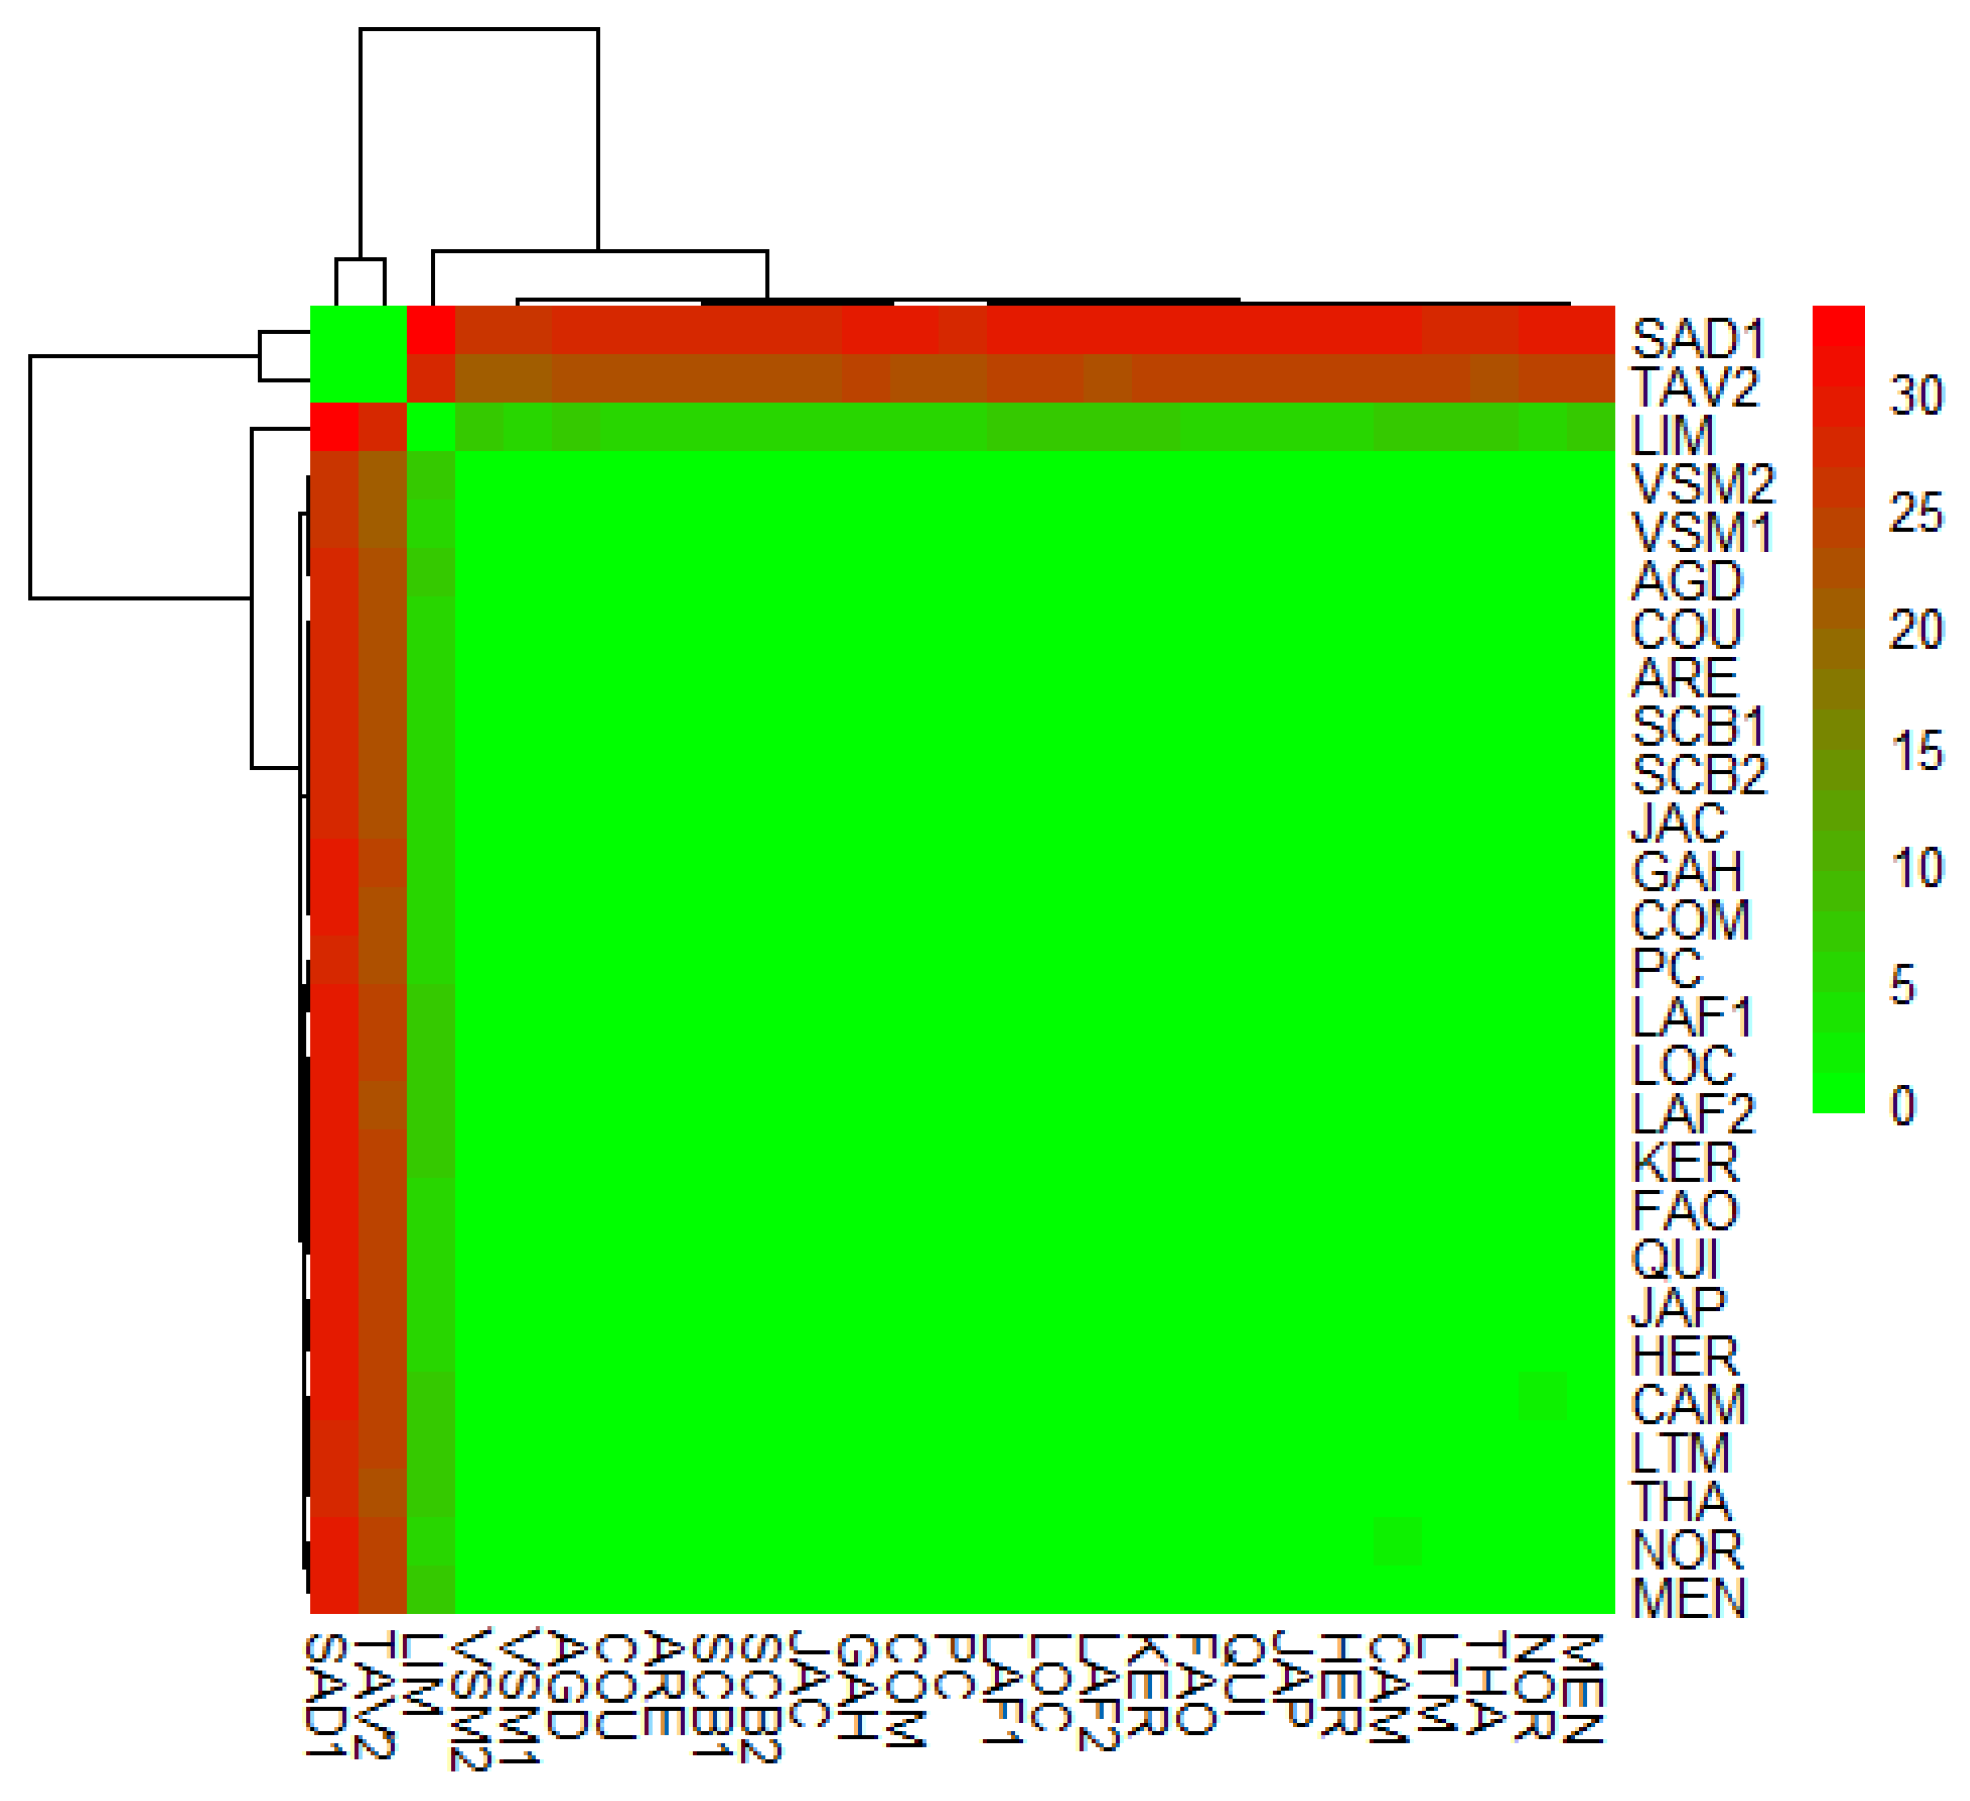
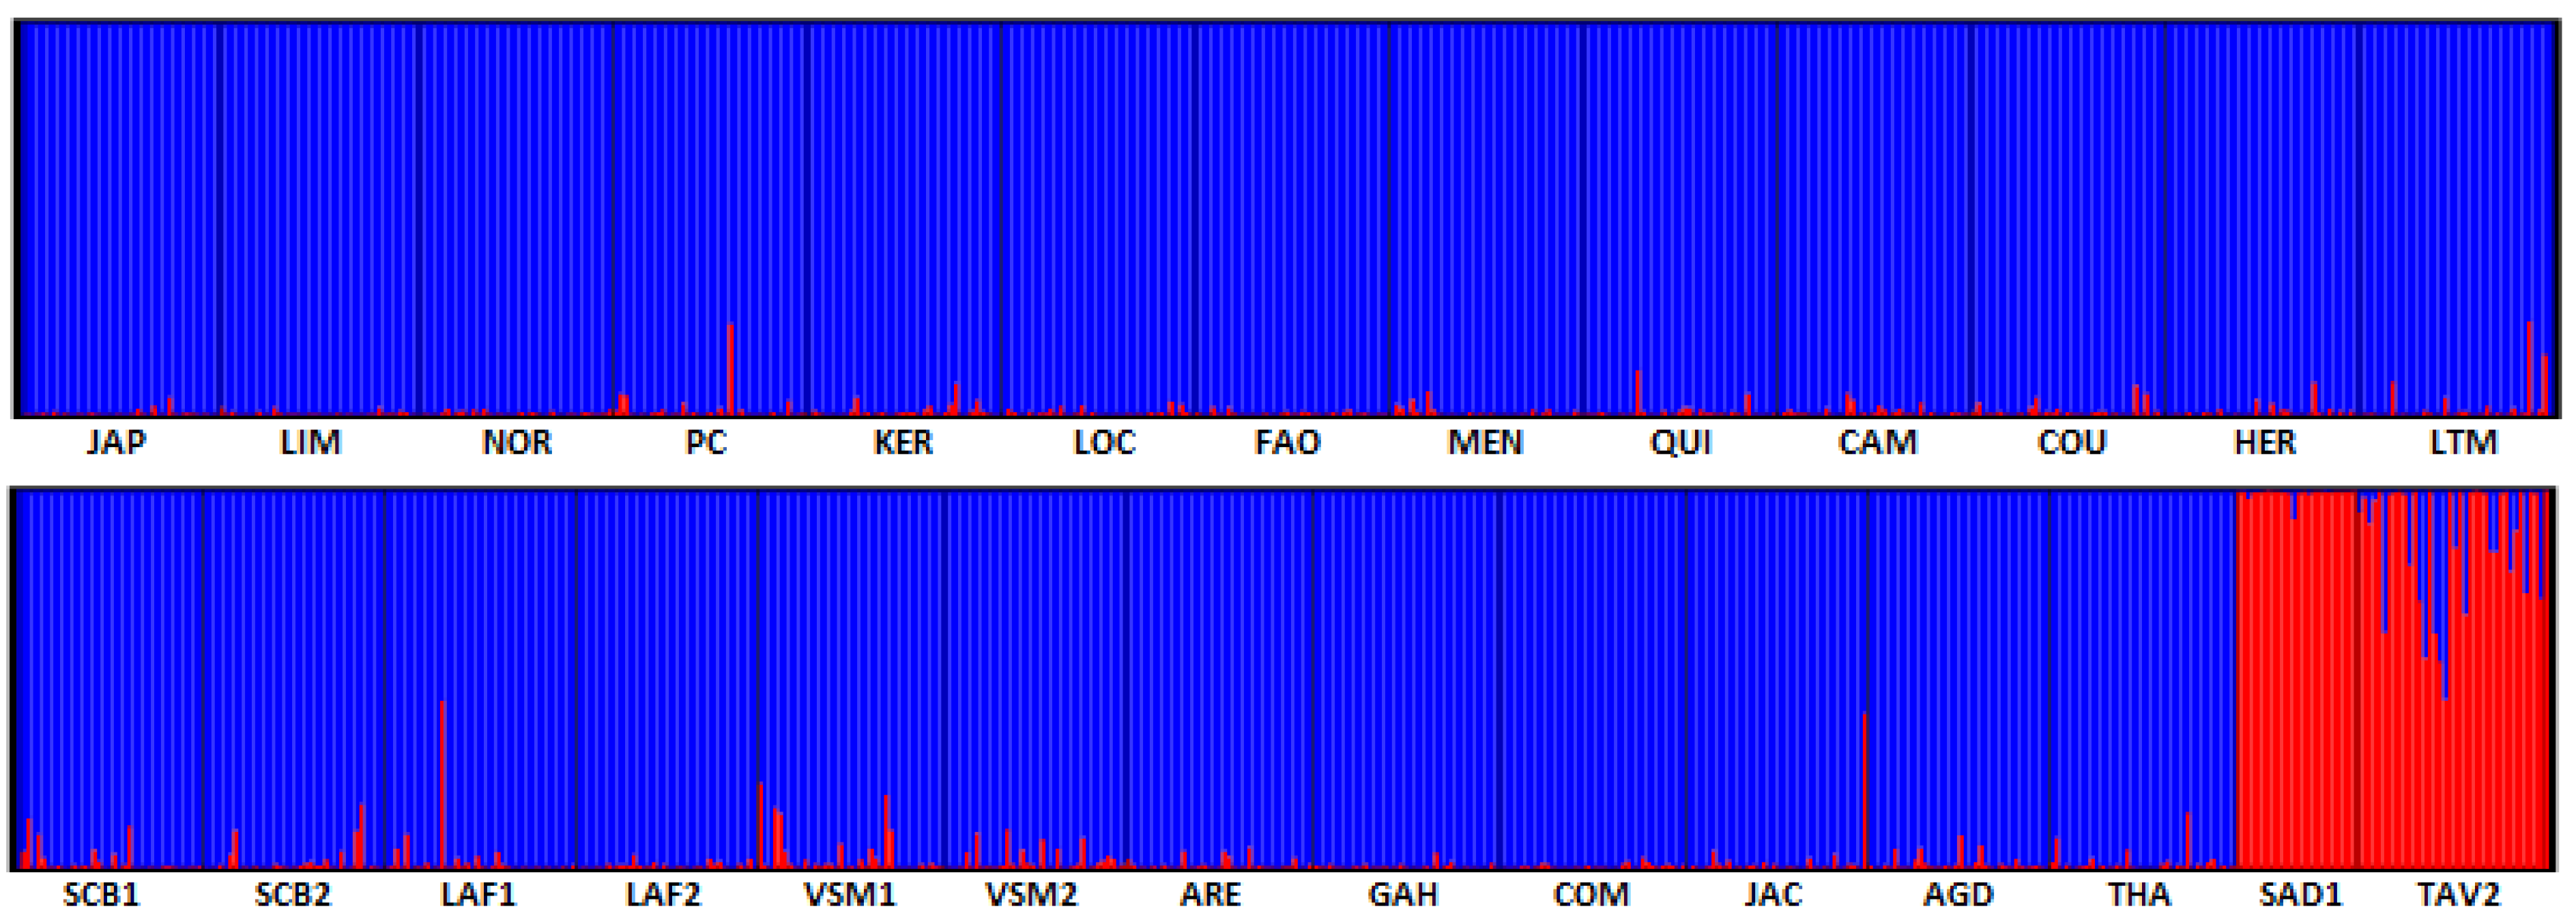
3.3. Diversity and Differentiation of the Cupped Oyster in France
4. Discussion
4.1. A New Flexible Tool to Differentiate the Two Oyster Resources in Europe
4.2. Different Cases of Introgression
4.3. Conservation Issues
4.4. Confirmation of a High Homogeneity within the Pacific Cupped Oyster Populations in France
Supplementary Materials
Author Contributions
Funding
Acknowledgments
Conflicts of Interest
References
- Mallet, J. Hybridization as an invasion of the genome. Trends Ecol. Evol. 2005, 20, 229–237. [Google Scholar] [CrossRef] [PubMed]
- Abbott, R.; Albach, D.; Ansell, S.; Arntzen, J.W.; Baird, S.J.E.; Bierne, N.; Boughman, J.; Brelsford, A.; Buerkle, C.A.; Buggs, R.; et al. Hybridization and speciation. J. Evol. Biol. 2013, 26, 229–246. [Google Scholar] [CrossRef] [Green Version]
- Dobzhansky, T. Species after Darwin. In A Century of Darwin; Barnett, S.A., Ed.; Harvard Univ. Press: Cambridge, MA, USA, 1958; pp. 19–55. [Google Scholar]
- Mayr, E. Animal Species and Evolution; The Belknap Press of Harvard University Press: Cambridge, MA, USA, 1963. [Google Scholar]
- Barton, N.H.; Hewitt, G.M. Analysis of Hybrid Zones. Ann. Rev. Ecol. Syst. 1985, 16, 113–148. [Google Scholar] [CrossRef]
- Harrison, R.G. Hybrid Zones and the Evolutionary Process; Harrison, R.G., Ed.; Oxford University Press: Oxford, NY, USA, 1993; ISBN 978-0-19-506917-4. [Google Scholar]
- Roux, C.; Fraïsse, C.; Romiguier, J.; Anciaux, Y.; Galtier, N.; Bierne, N. Shedding Light on the Grey Zone of Speciation along a Continuum of Genomic Divergence. PLOS Biol. 2016, 14, e2000234. [Google Scholar] [CrossRef] [Green Version]
- Bierne, N.; Gagnaire, P.-A.; David, P. The geography of introgression in a patchy environment and the thorn in the side of ecological speciation. Curr. Zool. 2013, 59, 72–86. [Google Scholar] [CrossRef]
- Ravinet, M.; Westram, A.; Johannesson, K.; Butlin, R.; André, C.; Panova, M. Shared and nonshared genomic divergence in parallel ecotypes of Littorina saxatilis at a local scale. Mol. Ecol. 2016, 25, 287–305. [Google Scholar] [CrossRef]
- Fraïsse, C.; Belkhir, K.; Welch, J.J.; Bierne, N. Local interspecies introgression is the main cause of extreme levels of intraspecific differentiation in mussels. Mol. Ecol. 2016, 25, 269–286. [Google Scholar] [CrossRef] [Green Version]
- Rose, N.H.; Bay, R.A.; Morikawa, M.K.; Palumbi, S.R. Polygenic evolution drives species divergence and climate adaptation in corals. Evolution 2018, 72, 82–94. [Google Scholar] [CrossRef]
- Harrison, R.G.; Larson, E.L. Heterogeneous genome divergence, differential introgression, and the origin and structure of hybrid zones. Mol. Ecol. 2016, 25, 2454–2466. [Google Scholar] [CrossRef] [Green Version]
- Le Moan, A.; Gagnaire, P.-A.; Bonhomme, F. Parallel genetic divergence among coastal–marine ecotype pairs of European anchovy explained by differential introgression after secondary contact. Mol. Ecol. 2016, 25, 3187–3202. [Google Scholar] [CrossRef]
- Duranton, M.; Allal, F.; Fraïsse, C.; Bierne, N.; Bonhomme, F.; Gagnaire, P.-A. The origin and remolding of genomic islands of differentiation in the European sea bass. Nat. Commun. 2018, 9, 1–11. [Google Scholar] [CrossRef] [PubMed] [Green Version]
- Fraïsse, C.; Roux, C.; Gagnaire, P.-A.; Romiguier, J.; Faivre, N.; Welch, J.J.; Bierne, N. The divergence history of European blue mussel species reconstructed from Approximate Bayesian Computation: The effects of sequencing techniques and sampling strategies. PeerJ 2018, 6, e5198. [Google Scholar] [CrossRef] [PubMed] [Green Version]
- Jeffery, N.W.; Bradbury, I.R.; Stanley, R.R.E.; Wringe, B.F.; Wyngaarden, M.V.; Lowen, J.B.; McKenzie, C.H.; Matheson, K.; Sargent, P.S.; DiBacco, C. Genomewide evidence of environmentally mediated secondary contact of European green crab (Carcinus maenas) lineages in eastern North America. Evol. Appl. 2018, 11, 869–882. [Google Scholar] [CrossRef] [PubMed] [Green Version]
- Saarman, N.P.; Pogson, G.H. Introgression between invasive and native blue mussels (genus Mytilus) in the central California hybrid zone. Mol. Ecol. 2015, 24, 4723–4738. [Google Scholar] [CrossRef]
- Viard, F.; David, P.; Darling, J.A. Marine invasions enter the genomic era: Three lessons from the past, and the way forward. Curr. Zool. 2016, 62, 629–642. [Google Scholar] [CrossRef] [Green Version]
- Wang, H.; Qian, L.; Liu, X.; Zhang, G.; Guo, X. Classification of a Common Cupped Oyster from Southern China. J. Shellfish Res. 2010, 29, 857–866. [Google Scholar] [CrossRef]
- Boudry, P.; Heurtebise, S.; Collet, B.; Cornette, F.; Gérard, A. Differentiation between populations of the Portuguese oyster, Crassostrea angulata (Lamark) and the Pacific oyster, Crassostrea gigas (Thunberg), revealed by mtDNA RFLP analysis. J. Exp. Mar. Biol. Ecol. 1998, 226, 279–291. [Google Scholar] [CrossRef]
- Huvet, A.; Lapègue, S.; Magoulas, A.; Boudry, P. Mitochondrial and nuclear DNA phylogeography of Crassostrea angulata, the Portuguese oyster endangered in Europe. Conserv. Genet. 2000, 1, 251–262. [Google Scholar] [CrossRef]
- Grade, A.; Chairi, H.; Lallias, D.; Power, D.M.; Ruano, F.; Leitão, A.; Drago, T.; King, J.W.; Boudry, P.; Batista, F.M. New insights about the introduction of the Portuguese oyster, Crassostrea angulata, into the North East Atlantic from Asia based on a highly polymorphic mitochondrial region. Aquat. Living Resour. 2016, 29, 404. [Google Scholar] [CrossRef]
- Grizel, H.; Héral, M. Introduction into France of the Japanese oyster (Crassostrea gigas). ICES J. Mar. Sci. 1991, 47, 399–403. [Google Scholar] [CrossRef]
- Drinkwaard, A.C. Introductions and developments of oysters in the North Sea area: A review. Helgoländer Meeresunters. 1998, 52, 301–308. [Google Scholar] [CrossRef] [Green Version]
- Troost, K. Causes and effects of a highly successful marine invasion: Case-study of the introduced Pacific oyster Crassostrea gigas in continental NW European estuaries. J. Sea Res. 2010, 64, 145–165. [Google Scholar] [CrossRef]
- Anglès d’Auriac, M.B.; Rinde, E.; Norling, P.; Lapègue, S.; Staalstrøm, A.; Hjermann, D.Ø.; Thaulow, J. Rapid expansion of the invasive oyster Crassostrea gigas at its northern distribution limit in Europe: Naturally dispersed or introduced? PLoS ONE 2017, 12, e0177481. [Google Scholar] [CrossRef] [PubMed]
- Zhong, X.; Li, Q.; Yu, H.; Kong, L. SNP Mining in Crassostrea gigas EST Data: Transferability to Four Other Crassostrea Species, Phylogenetic Inferences and Outlier SNPs under Selection. PLoS ONE 2014, 9, e108256. [Google Scholar] [CrossRef] [Green Version]
- Sekino, M.; Yamashita, H. Mitochondrial DNA barcoding for Okinawan oysters: A cryptic population of the Portuguese oyster Crassostrea angulata in Japanese waters. Fish. Sci. 2013, 79, 61–76. [Google Scholar] [CrossRef]
- Hsiao, S.-T.; Chuang, S.-C.; Chen, K.-S.; Ho, P.-H.; Wu, C.-L.; Chen, C.A. DNA barcoding reveals that the common cupped oyster in Taiwan is the Portuguese oyster Crassostrea angulata (Ostreoida; Ostreidae), not C. gigas. Sci. Rep. 2016, 6, 1–11. [Google Scholar] [CrossRef] [Green Version]
- Lallias, D.; Boudry, P.; Batista, F.M.; Beaumont, A.; King, J.W.; Turner, J.R.; Lapègue, S. Invasion genetics of the Pacific oyster Crassostrea gigas in the British Isles inferred from microsatellite and mitochondrial markers. Biol. Invasions 2015, 17, 2581–2595. [Google Scholar] [CrossRef] [Green Version]
- Huvet, A.; Fabioux, C.; McCombie, H.; Lapègue, S.; Boudry, P. Natural hybridization between genetically differentiated populations of Crassostrea gigas and C. angulata highlighted by sequence variation in flanking regions of a microsatellite locus. Mar. Ecol. Prog. Ser. 2004, 272, 141–152. [Google Scholar] [CrossRef]
- Batista, F.M.; Fonseca, V.G.; Ruano, F.; Boudry, P. Asynchrony in settlement time between the closely related oysters Crassostrea angulata and C. gigas in Ria Formosa lagoon (Portugal). Mar. Biol. 2017, 164, 110. [Google Scholar] [CrossRef]
- Fabioux, C.; Huvet, A.; Lapègue, S.; Heurtebise, S.; Boudry, P. Past and present geographical distribution of populations of Portuguese (Crassostrea angulata) and Pacific (C. gigas) oysters along the European and north African Atlantic coasts. Haliotis 2002, 31, 33–44. [Google Scholar]
- FAO La situation mondiale des pêches et de l’aquaculture 2018. Atteindre les objectifs de développement durable 2018. Available online: http://www.fao.org/3/i9540fr/i9540fr.pdf (accessed on 3 February 2020).
- Huvet, A.; Balabaud, K.; Bierne, N.; Boudry, P. Microsatellite Analysis of 6-Hour-Old Embryos Reveals No Preferential Intraspecific Fertilization Between Cupped Oysters Crassostrea gigas and Crassostrea angulata. Mar. Biotechnol. 2001, 3, 448–453. [Google Scholar] [CrossRef] [PubMed]
- Huvet, A.; Gérard, A.; Ledu, C.; Phélipot, P.; Heurtebise, S.; Boudry, P. Is fertility of hybrids enough to conclude that the two oysters Crassostrea gigas and Crassostrea angulata are the same species? Aquat. Living Resour. 2002, 15, 45–52. [Google Scholar] [CrossRef] [Green Version]
- Imai, T.; Sakai, S. Study of breeding of Japonese oyster, Crassostrea gigas. Tohoku J. Agric. Res. 1961, 12, 125–171. [Google Scholar]
- Reece, K.S.; Cordes, J.F.; Stubbs, J.B.; Hudson, K.L.; Francis, E.A. Molecular phylogenies help resolve taxonomic confusion with Asian Crassostrea oyster species. Mar. Biol. 2008, 153, 709–721. [Google Scholar] [CrossRef]
- López-Flores, I.; de la Herrán, R.; Garrido-Ramos, M.A.; Boudry, P.; Ruiz-Rejón, C.; Ruiz-Rejón, M. The molecular phylogeny of oysters based on a satellite DNA related to transposons. Gene 2004, 339, 181–188. [Google Scholar] [CrossRef] [Green Version]
- Lapègue, S.; Batista, F.M.; Heurtebise, S.; Yu, Z.; Boudry, P. Evidence for the presence of the Portuguese oyster, Crassostrea angulata, in Northern China. J. Shellfish Res. 2004, 23, 759–763. [Google Scholar]
- Ren, J.; Liu, X.; Jiang, F.; Guo, X.; Liu, B. Unusual conservation of mitochondrial gene order in Crassostrea oysters: Evidence for recent speciation in Asia. BMC Evol. Biol. 2010, 10, 394. [Google Scholar] [CrossRef] [Green Version]
- Gagnaire, P.; Lamy, J.-B.; Cornette, F.; Heurtebise, S.; Dégremont, L.; Flahauw, E.; Boudry, P.; Bierne, N.; Lapègue, S. Analysis of Genome-Wide Differentiation between Native and Introduced Populations of the Cupped Oysters Crassostrea gigas and Crassostrea angulata. Genome Biol. Evol. 2018, 10, 2518–2534. [Google Scholar] [CrossRef]
- Comps, M.; Bonami, J.; Vago, C. Une virose de l’Huître portugaise (Crassostrea angulata LMK). C R Acad Sc Paris 1976, 282, 139–143. [Google Scholar]
- Bougrier, S.; Raguenes, G.; Bachère, E.; Tige, G.; Grizel, H. Essai de réimplantation de Crassostrea angulata en France. Résistance au chambrage et comportement des hybrides C. angulate-C. gigas. In Proceedings of the Consell Meeting of the International Consell for the Exploration of the Sea, Copenhagen, Denmark, 9 October 1986. [Google Scholar]
- Soletchnik, P.; Huvet, A.; Le Moine, O.; Razet, D.; Geairon, P.; Faury, N.; Goulletquer, P.; Boudry, P. A comparative field study of growth, survival and reproduction of Crassostrea gigas, C. angulata and their hybrids. Aquat. Living Resour. 2002, 15, 243–250. [Google Scholar] [CrossRef] [Green Version]
- Haure, J.; Huvet, A.; Palvadeau, H.; Nourry, M.; Penisson, C.; Martin, J.L.Y.; Boudry, P. Feeding and respiratory time activities in the cupped oysters Crassostrea gigas, Crassostrea angulata and their hybrids. Aquaculture 2003, 218, 539–551. [Google Scholar] [CrossRef]
- Li, L.; Li, A.; Song, K.; Meng, J.; Guo, X.; Li, S.; Li, C.; De Wit, P.; Que, H.; Wu, F.; et al. Divergence and plasticity shape adaptive potential of the Pacific oyster. Nat. Ecol. Evol. 2018, 2, 1751–1760. [Google Scholar] [CrossRef] [PubMed]
- Lehnert, S.J.; DiBacco, C.; Jeffery, N.W.; Blakeslee, A.M.; Isaksson, J.; Roman, J.; Wringe, B.F.; Stanley, R.R.; Matheson, K.; McKenzie, C.H.; et al. Temporal dynamics of genetic clines of invasive European green crab (Carcinus maenas) in eastern North America. Evol. Appl. 2018, 11, 1656–1670. [Google Scholar] [CrossRef] [PubMed]
- Lapègue, S.; Harrang, E.; Heurtebise, S.; Flahauw, E.; Donnadieu, C.; Gayral, P.; Ballenghien, M.; Genestout, L.; Barbotte, L.; Mahla, R.; et al. Development of SNP-genotyping arrays in two shellfish species. Mol. Ecol. Resour. 2014, 14, 820–830. [Google Scholar] [CrossRef] [PubMed] [Green Version]
- Rohfritsch, A.; Bierne, N.; Boudry, P.; Heurtebise, S.; Cornette, F.; Lapègue, S. Population genomics shed light on the demographic and adaptive histories of European invasion in the Pacific oyster, Crassostrea gigas. Evol. Appl. 2013, 6, 1064–1078. [Google Scholar] [CrossRef]
- Rozen, S.; Skaletsky, H. Primer3 on the WWW for General Users and for Biologist Programmers. In Bioinformatics Methods and Protocols; Misener, S., Krawetz, S.A., Eds.; Methods in Molecular BiologyTM; Humana Press: Totowa, NJ, USA, 1999; pp. 365–386. ISBN 978-1-59259-192-3. [Google Scholar] [CrossRef] [Green Version]
- Gabriel, S.; Ziaugra, L.; Tabbaa, D. SNP Genotyping Using the Sequenom MassARRAY iPLEX Platform. Curr. Protoc. Hum. Genet. 2009, 60, 2–12. [Google Scholar] [CrossRef]
- Lapegue, S.; Heurtebise, S.; Cornette, F.; Guichoux, E.; Gagnaire, P.-A. SNP panels genotyping data for the genetic characterization of cupped oyster resources in Europe. SEANOE 2020. [Google Scholar] [CrossRef]
- Weir, B.S.; Cockerham, C.C. Estimating F-Statistics for the Analysis of Population Structure. Evolution 1984, 38, 1358–1370. [Google Scholar] [CrossRef]
- Belkhir, K.; Borsa, P.; Chikhi, L.; Raufaste, N.; Bonhomme, F. GENETIX4.05, logiciel sous Windows TM pour la génétique des populations. 1996. Available online: https://www.researchgate.net/publication/301853229_GENETIX4_05_logiciel_sous_Windows_TM_pour_la_genetiquedes_populations (accessed on 13 July 2019).
- Jombart, T. adegenet: A R package for the multivariate analysis of genetic markers. Bioinform. Oxf. Engl. 2008, 24, 1403–1405. [Google Scholar] [CrossRef] [Green Version]
- Pritchard, J.K.; Stephens, M.; Donnelly, P. Inference of population structure using multilocus genotype data. Genetics 2000, 155, 945–959. [Google Scholar]
- Falush, D.; Stephens, M.; Pritchard, J.K. Inference of population structure using multilocus genotype data: Linked loci and correlated allele frequencies. Genetics 2003, 164, 1567–1587. [Google Scholar]
- Evanno, G.; Regnaut, S.; Goudet, J. Detecting the number of clusters of individuals using the software structure: A simulation study. Mol. Ecol. 2005, 14, 2611–2620. [Google Scholar] [CrossRef] [PubMed] [Green Version]
- Katsanevakis, S.; Zenetos, A.; Belchior, C.; Cardoso, A.C. Invading European Seas: Assessing pathways of introduction of marine aliens. Ocean Coast. Manag. 2013, 76, 64–74. [Google Scholar] [CrossRef]
- Vendrami, D.L.J.; Houston, R.D.; Gharbi, K.; Telesca, L.; Gutierrez, A.P.; Gurney-Smith, H.; Hasegawa, N.; Boudry, P.; Hoffman, J.I. Detailed insights into pan-European population structure and inbreeding in wild and hatchery Pacific oysters (Crassostrea gigas) revealed by genome-wide SNP data. Evol. Appl. 2018, 12, 519–534. [Google Scholar] [CrossRef] [PubMed] [Green Version]
- Gutierrez, A.P.; Bean, T.P.; Hooper, C.; Stenton, C.A.; Sanders, M.B.; Paley, R.K.; Rastas, P.; Bryrom, M.; Matika, O.; Houston, R.D. A Genome-Wide Association Study for Host Resistance to Ostreid Herpesvirus in Pacific Oysters (Crassostrea gigas). G3 Genes Genomes Genet. 2018, 8, 1273–1280. [Google Scholar] [CrossRef] [PubMed] [Green Version]
- Cornette, F.; Lapègue, S. Variabilité génétique des stocks d’huîtres dans les Pertuis charentais 2011. Convention n° 08/RPC-A-29 du 19 mai 2008. Available online: https://archimer.ifremer.fr/doc/00055/16661/ (accessed on 3 February 2020).
- Fitzpatrick, B.M.; Ryan, M.E.; Johnson, J.R.; Corush, J.; Carter, E.T. Hybridization and the species problem in conservation. Curr. Zool. 2015, 61, 206–216. [Google Scholar] [CrossRef]
- Wringe, B.F.; Stanley, R.R.E.; Jeffery, N.W.; Anderson, E.C.; Bradbury, I.R. parallelnewhybrid: An R package for the parallelization of hybrid detection using newhybrids. Mol. Ecol. Resour. 2017, 17, 91–95. [Google Scholar] [CrossRef]
- Orensanz, J.; Schwindt, E.; Pastorino, G.; Bortolus, A.; Casas, G.; Darrigran, G.; Elias, R.; López-Gappa, J.; Obenat, S.; Pascual, M.; et al. No Longer The Pristine Confines of the World Ocean: A Survey of Exotic Marine Species in the Southwestern Atlantic. Biol. Invasions 2002, 4, 115–143. [Google Scholar] [CrossRef]
- Miossec, L.; Le Deuff, R.-M. Goulletquer, Philippe Alien Species Alert: Crassostrea Gigas (Pacific Oyster); ICES: Burnaby, BC, Canada, 2009; Volume 42. [Google Scholar]
- Ayres, P. Introduced Pacific oyster in Australia. In The Ecology of Crassostrea gigas in Australia, New Zealand, France and Washington State; University of Maryland Sea Grant publication UM-SG-TS-92.07; Maryland Sea Grant College: College Park, MD, USA, 1992; pp. 3–7. [Google Scholar]
- Faust, E.; André, C.; Meurling, S.; Kochmann, J.; Christiansen, H.; Jensen, L.F.; Charrier, G.; Laugen, A.T.; Strand, Å. Origin and route of establishment of the invasive Pacific oyster Crassostrea gigas in Scandinavia. Mar. Ecol. Prog. Ser. 2017, 575, 95–105. [Google Scholar] [CrossRef] [Green Version]
- Strand, Å.; Blanda, E.; Bodvin, T.; Davids, J.K.; Jensen, L.F.; Holm-Hansen, T.H.; Jelmert, A.; Lindegarth, S.; Mortensen, S.; Moy, F.E.; et al. Impact of an icy winter on the Pacific oyster (Crassostrea gigas Thunberg, 1973) populations in Sacndinavia. Aquat. Invasions 2012, 7, 433–440. [Google Scholar] [CrossRef] [Green Version]
- Mortensen, S.; Strand, Å.; Bodvin, T.; Alfjorden, A.; Skår, C.K.; Jelmert, A.; Aspán, A.; Sælemyr, L.; Naustvoll, L.-J.; Albretsen, J. Summer mortalities and detection of ostreid herpesvirus microvariant in Pacific oyster Crassostrea gigas in Sweden and Norway. Dis. Aquat. Organ. 2016, 117, 171–176. [Google Scholar] [CrossRef]
- Laugen, A.T.; Hollander, J.; Obst, M.; Strand, Å. The Pacific oyster (Crassostrea gigas) invasion in Scandinavian coastal waters: Impact on local ecosystem services. In Biological Invasions in Changing Ecosystems: Vectors, Ecological Impacts, Management and Predictions; Canning-Clode, J., Ed.; De Gruyter Open: Warsaw, Poland, 2001; pp. 232–257. [Google Scholar]
- Strand, Ø.; Vølstad, J.H. The Molluscan fisheries and culture of Norway. In The History, Present Condition, Andfuture of the Molluscan Fisheries of North and Central America and Europe; NOAA/National Marine Fisheries Service: Silver Spring, MD, USA, 1997; Volume 3, pp. 7–24. [Google Scholar]
- Guy, C.; Roberts, D. Can the spread of non-native oysters (Crassostrea gigas) at the early stages of population expansion be managed? Mar. Pollut. Bull. 2010, 60, 1059–1064. [Google Scholar] [CrossRef] [PubMed]
- Pogoda, B.; Brown, J.; Hancock, B.; Preston, J.; Pouvreau, S.; Kamermans, P.; Sanderson, W.; Nordheim, H. von The Native Oyster Restoration Alliance (NORA) and the Berlin Oyster Recommendation: Bringing back a key ecosystem engineer by developing and supporting best practice in Europe. Aquat. Living Resour. 2019, 32, 13. [Google Scholar] [CrossRef] [Green Version]
- Kerckhof, F.; Coolen, J.W.P.; Rumes, B.; Degraer, S. Recent findings of wild European flat oysters Ostrea edulis (Linnaeus, 1758) in Belgian and Dutch offshore waters: New perspectives for offshore oyster reef restoration in the southern North Sea. Belg. J. Zool. 2018, 148, 13–24. [Google Scholar] [CrossRef] [Green Version]
- Native Oyster—NORA. Available online: https://noraeurope.eu/native-oyster/ (accessed on 3 February 2020).
- Arnaldi, K.G.; Walters, L.J.; Hoffman, E.A. Effects of time and harvest on genetic diversity of natural and restored oyster reefs. Restor. Ecol. 2018, 26, 943–951. [Google Scholar] [CrossRef]
- Sussarellu, R.; Huvet, A.; Lapègue, S.; Quillen, V.; Lelong, C.; Cornette, F.; Jensen, L.F.; Bierne, N.; Boudry, P. Additive transcriptomic variation associated with reproductive traits suggest local adaptation in a recently settled population of the Pacific oyster, Crassostrea gigas. BMC Genom. 2015, 16, 808. [Google Scholar] [CrossRef] [PubMed] [Green Version]
- Li, A.; Li, L.; Wang, W.; Zhang, G. Evolutionary trade-offs between baseline and plastic gene expression in two congeneric oyster species. Biol. Lett. 2019, 15, 20190202. [Google Scholar] [CrossRef] [Green Version]
- Ghaffari, H.; Wang, W.; Li, A.; Zhang, G.; Li, L. Thermotolerance Divergence Revealed by the Physiological and Molecular Responses in Two Oyster Subspecies of Crassostrea gigas in China. Front. Physiol. 2019, 10. [Google Scholar] [CrossRef]
- Roman, J.; Darling, J.A. Paradox lost: Genetic diversity and the success of aquatic invasions. Trends Ecol. Evol. 2007, 22, 454–464. [Google Scholar] [CrossRef]
- Barrett, R.D.H.; Schluter, D. Adaptation from standing genetic variation. Trends Ecol. Evol. 2008, 23, 38–44. [Google Scholar] [CrossRef]
- Quayle, D.B. Pacific oyster culture in British Columbia. Can. Fish. Aquat. Sci. Bull. 1988, 218, 241. [Google Scholar]
- Sutherland, B.J.G.; Rycroft, C.; Ferchaud, A.-L.; Saunders, R.; Li, L.; Liu, S.; Chan, A.M.; Otto, S.P.; Suttle, C.A.; Miller, K.M. Relative genomic impacts of translocation history, hatchery practices, and farm selection in Pacific oyster Crassostrea gigas throughout the Northern Hemisphere. bioRxiv 2019, 847467. [Google Scholar] [CrossRef] [Green Version]
- Moehler, J.; Wegner, K.M.; Reise, K.; Jacobsen, S. Invasion genetics of Pacific oyster Crassostrea gigas shaped by aquaculture stocking practices. J. Sea Res. 2011, 66, 256–262. [Google Scholar] [CrossRef] [Green Version]
- Meistertzheim, A.-L.; Arnaud-Haond, S.; Boudry, P.; Thébault, M.-T. Genetic structure of wild European populations of the invasive Pacific oyster Crassostrea gigas due to aquaculture practices. Mar. Biol. 2013, 160, 453–463. [Google Scholar] [CrossRef] [Green Version]
- Cornette, F.; Lapègue, S. Microsatellite genotyping data for the Pacific oyster Crassostrea gigas. SEANOE 2020. [Google Scholar] [CrossRef]


| Population Abbreviation | Location | Origin | Country | GPS Coordinates | Sampling (Production) Year | Sample Size | Dataset |
|---|---|---|---|---|---|---|---|
| KEE | Keelung | Keelung bay | Taïwan | 25°09’29.89"N - 121°44’54.87"E | 1996 | 28 | 1.2 |
| SAD1 | Rio Sado | Sado estuary | Portugal | 38°29’15.72"N - 8°49’44.48"O | 2010 | 36 | 1,2,3 |
| JAP | Miyagi | Matsushima bay | Japan | 38°21’31.99"N - 141°6’20.34"E | 2010 | 47 | 1,2,3 |
| LAF1 | Pointe de La Fumée | Charente estuary | France | 46°00’10.01"N - 1°07’17.46"O | 2010 | 39 | 1,2,3 |
| LAFG0 | Pointe de La Fumée | Charente estuary | France | 46°00’10.01"N - 1°07’17.46"O | 2012 | 9 | 2 |
| SADG0 | Rio Sado | Sado estuary | Portugal | 38°29’15.72"N - 8°49’44.48"O | 2012 | 9 | 2 |
| HYB | Experimental hatchery | LAFG0 X SADG0 | France | (2012) | 104 | 2 | |
| TAV1 | Tavira | Algarve | Portugal | 37°06’59.98"N - 7°37’41.21"O | 1998 | 24 | 2 |
| LIM | Limfjorden | Jutland | Denmark | 56°43’16.99"N - 8°15’26.34"E | 2010 | 38 | 3 |
| NOR | Champeaux | Mont Saint-Michel bay | France | 48°43’50.80"N - 1°31’59.76"O | 2010 | 37 | 3 |
| PC | Pointe du Château | Brest bay | France | 48°19’51.44"N - 4°18’60.00"O | 2010 | 37 | 3 |
| KER | Kersanton | Brest bay | France | 48°21’N - 4°17’O | 2010 | 37 | 3 |
| LOC | Le Loc’h - Anse de Poulmic | Brest bay | France | 48°17’32.40"N - 4°20’11.20"O | 2017 | 37 | 3 |
| FAO | Faou river | Brest bay | France | 48°17’51.70"N - 4°13’66.30"O | 2017 | 37 | 3 |
| MEN | Daoulas river - Mengleuz | Brest bay | France | 48°20’62.80"N - 4°17’37.10"O | 2017 | 37 | 3 |
| QUI | Kerivor | Quiberon bay | France | 47°34’57.40’’N - 3°06’41.80"O | 2017 | 37 | 3 |
| CAM | Camaret | Vilaine bay | France | 47°29’79.40"N - 2°29’46.50"O | 2017 | 37 | 3 |
| COU | La Couplasse | Bourgneuf bay | France | 47°00’45.78"N - 2°01’02.78"O | 2017 | 37 | 3 |
| HER | L’Herbaudière | Noirmoutier island | France | 47°01’13.72"N - 2°18’15.60"O | 2017 | 37 | 3 |
| LTM | La Tranche sur mer | Aiguillon bay | France | 46°20’0.10"N - 1°21’0.60"O | 2010 | 37 | 3 |
| SCB1 | Saint-Clément des Baleines | Ré island | France | 46°14’43.62"N - 1°33’47.56"O | 2010 | 37 | 3 |
| SCB2 | Saint-Clément des Baleines | Ré island | France | 46°14’43.62"N - 1°33’47.56"O | 2017 | 36 | 3 |
| LAF2 | Pointe de La Fumée | Charente estuary | France | 46°00’10.01"N - 1°07’17.46"O | 2017 | 36 | 3 |
| VSM1 | Vaux sur mer | Gironde estuary | France | 45°37’51.13"N - 1°03’53.46"O | 2010 | 38 | 3 |
| VSM2 | Vaux sur mer | Gironde estuary | France | 45°37’51.13"N - 1°03’53.46"O | 2017 | 36 | 3 |
| ARE | Arès | Arcachon bay | France | 44°40’13.55’’N - 1°04’35.45"O | 2010 | 37 | 3 |
| GAH | Gahignon | Arcachon bay | France | 44°42’26.93"N - 1°8’11.55"O | 2010 | 37 | 3 |
| COM | Comprian | Arcachon bay | France | 44°40’13.55"N - 1°04’35.45"O | 2017 | 37 | 3 |
| JAC | Jacquets | Arcachon bay | France | 44°72’18.50"N - 1°18’79.50"O | 2017 | 36 | 3 |
| AGD | Cap d’Agde | Mediterranean sea | France | 43°16’44.48"N - 3°29’45.13"E | 2010 | 36 | 3 |
| THA | Thau lagoon | Mediterranean sea | France | 43°26’80.00"N - 3°39’47.70"E | 2017 | 37 | 3 |
| TAV2 | Tavira | Algarve | Portugal | 37°06’59.98"N - 7°37’41.21"O | 2000 | 38 | 3 |
© 2020 by the authors. Licensee MDPI, Basel, Switzerland. This article is an open access article distributed under the terms and conditions of the Creative Commons Attribution (CC BY) license (http://creativecommons.org/licenses/by/4.0/).
Share and Cite
Lapègue, S.; Heurtebise, S.; Cornette, F.; Guichoux, E.; Gagnaire, P.-A. Genetic Characterization of Cupped Oyster Resources in Europe Using Informative Single Nucleotide Polymorphism (SNP) Panels. Genes 2020, 11, 451. https://0-doi-org.brum.beds.ac.uk/10.3390/genes11040451
Lapègue S, Heurtebise S, Cornette F, Guichoux E, Gagnaire P-A. Genetic Characterization of Cupped Oyster Resources in Europe Using Informative Single Nucleotide Polymorphism (SNP) Panels. Genes. 2020; 11(4):451. https://0-doi-org.brum.beds.ac.uk/10.3390/genes11040451
Chicago/Turabian StyleLapègue, Sylvie, Serge Heurtebise, Florence Cornette, Erwan Guichoux, and Pierre-Alexandre Gagnaire. 2020. "Genetic Characterization of Cupped Oyster Resources in Europe Using Informative Single Nucleotide Polymorphism (SNP) Panels" Genes 11, no. 4: 451. https://0-doi-org.brum.beds.ac.uk/10.3390/genes11040451