Brief Report

Relative Abundance of SARS-CoV-2 Entry Genes in the Enterocytes of the Lower Gastrointestinal Tract

1
Sheikh Ahmed Center for Pancreatic Cancer Research and the Department of Translational Molecular Pathology, The University of Texas MD Anderson Cancer Center, Houston, TX 77030, USA
2
Department of Surgical Oncology, The University of Texas MD Anderson Cancer Center, Houston, TX 77030, USA
3
Department of Gastrointestinal Medical Oncology, The University of Texas MD Anderson Cancer Center, Houston, TX 77030, USA
4
Department of Clinical Cancer Prevention, The University of Texas MD Anderson Cancer Center, Houston, TX 77030, USA
5
Department of Bioinformatics and Computational Biology, The University of Texas MD Anderson Cancer Center, Houston, TX 77030, USA
*
Author to whom correspondence should be addressed.
Submission received: 7 May 2020 / Revised: 1 June 2020 / Accepted: 9 June 2020 / Published: 11 June 2020

Abstract

:
There is increasing evidence of gastrointestinal (GI) infection by severe acute respiratory syndrome coronavirus 2 (SARS-CoV-2). We surveyed the co-expression of SARS-CoV-2 entry genes ACE2 and TMPRSS2 throughout the GI tract to assess potential sites of infection. Publicly available and in-house single-cell RNA-sequencing datasets from the GI tract were queried. Enterocytes from the small intestine and colonocytes showed the highest proportions of cells co-expressing ACE2 and TMPRSS2. Therefore, the lower GI tract represents the most likely site of SARS-CoV-2 entry leading to GI infection.

Graphical Abstract

1. Introduction

COVID-19, the disease caused by severe acute respiratory syndrome coronavirus (SARS-CoV-2), has rapidly spread throughout the world and was declared a pandemic by the World Health Organization, thus leading to a rapid surge in the efforts to understand the mechanisms of transmission, methods of prevention, and potential therapies. While COVID-19 frequently manifests as a respiratory infection [1], there is evidence for infection of the gastrointestinal (GI) tract [1,2,3,4,5] with documented viral RNA shedding in the stool of infected patients [2,4,6]. In this study, we aimed to investigate the co-expression of ACE2 (encoding angiotensin converting enzyme 2) and TMPRSS2 (encoding transmembrane serine protease 2), the products of which are required for SARS-CoV-2 entry into mammalian cells [7], from single-cell RNA sequencing (scRNA-seq) datasets of five different parts of the GI tract: esophagus, stomach, pancreas, small intestine, and colon/rectum. We also queried the co-expression of TMPRSS4, which promotes viral entry into human intestinal epithelial cells in combination with TMPRSS2 [8]. We found predominant co-expression of ACE2 and TMPRSS2 in the enterocytes of the lower GI tract, with progenitor and stem-like epithelial cells demonstrating highest proportions of ACE2, TMPRSS2, and TMPRSS4 co-expression, especially in the small intestine, which suggests a potential mechanism for GI manifestations of acute COVID-19 infection.

2. Materials and Methods

2.1. Public Data Acquisition

Publicly available single-cell sequencing datasets from esophagus [9,10], stomach [11], pancreatic islets [12,13,14,15], small intestine [16,17], and colon/rectum [18,19] were obtained as described in Table 1.

2.2. Single-Cell Dissociation of Normal Colon Samples

For in-house normal colon samples, a total of seven patients were recruited at the University of Texas MD Anderson Cancer Center through written informed consent following Institutional Review Board approval (protocols LAB10-0982 and PA12-0327). Single cell dissociation was performed following a standard protocol: tissues were minced with sterile surgical scalpels to approximately 1 mm fragments and resuspended in 0.5 mg/ml Liberase TH (Sigma-Aldrich, St. Louis, MO, USA) followed by incubation at 37 °C for 15 min with constant agitation. Liberase was quenched with equal volume of 1% bovine serum albumin (BSA) from (Thermo Fisher, Waltham, MA, USA) and cells were resuspended in Accutase (Sigma-Aldrich) followed by incubation at 37 °C for 15 min with constant agitation. Dissociated cells were passed through a 40 μm strainer and resuspended in 0.04% BSA for subsequent viability analysis and counting. Relevant cell data for the colorectal dataset, including the expression of marker genes and SARS-CoV-2 entry genes, are provided in Data S1.

2.3. Single-Cell RNA Sequencing Library Generation, Sequencing, and Alignment

Single-cell RNA sequencing (scRNA-seq) library generation and sequencing were performed using the 3’ Library Construction Kit (10x Genomics, Pleasanton, CA, USA) following the manufacturer’s recommendations. Single cell data processing was performed using standard Cell Ranger RNA pipeline (10x Genomics) using hg19 as a reference.

2.4. Downstream Single-Cell RNA Analysis

All downstream single-cell analyses were performed in R v3.6.2 (https://www.r-project.org/) using Seurat v3.1.0 [20], and analysis codes are provided in Data S2. Preprocessing included removal of genes expressed in less than three cells, removal of cells containing less than 200 genes, and removing cells with high percentage of mitochondrial genes based on distribution with general cutoff ranging between 20% and 50%. Given the size of the datasets, integration was performed using reciprocal principal component analysis as a part of standard Seurat workflow (https://satijalab.org/seurat/v3.0/integration.html). After initial integration of datasets for each organ, epithelial cells were subsetted for further analysis. Seurat normalized count greater than zero was defined as presence of expression. Gene Ontology (GO) enrichment analysis was done on geneontology.org [21,22] using genes that were positively correlated with ACE2 in all small intestine and colorectal cells with Pearson’s r > 0.1, which were obtained using cor() function.

3. Results

Analysis of scRNA-seq was performed separately for each gastrointestinal (GI) segment and available cell identities from the original studies were assigned to the new clusters after confirming the expression of relevant marker genes (Figure 1). Overall, there were 82,626 cells from the esophagus, 21,399 cells from the stomach, 13,407 cells from the pancreas, 9059 cells from the small intestine, and 24,898 cells from the colon and rectum (Table 1). Datasets in each organ contained most, if not all, cell types identified, although some datasets such as Owen [10] and Li [19] were much smaller compared to others (Figure 1, Table 1). The proportions of cells expressing ACE2 were approximately 13-fold lower in the upper GI tract (esophagus, stomach, duodenum; 1.04% or 1084/104,174 cells) than in the lower GI tract (ileum, colon, rectum; 14.06% or 4754/33,808 cells), and overall, higher proportions of cells expressed TMPRSS2 than ACE2 throughout the GI tract (Figure S1A,B). The percentages of cell types co-expressing TMPRSS2 and ACE2 in individual datasets are provided in Table S1.
Of note, higher proportions of esophageal columnar cells—which were mostly from Barrett’s esophagus samples—co-expressed ACE2 and TMPRSS2 compared to the native squamous epithelium (Figure 2). Pancreatic ductal and acinar cells co-expressed ACE2 and TMPRSS2 but endocrine cells did not show detectable co-expression (Figure 2). Parenthetically, the expression of TMPRSS2 in acinar cells (Figure S1B) underscores the rationale for using a TMPRSS2 inhibitor (camostat mesylate) in acute pancreatitis. In fact, this agent is now undergoing early phase clinical trials in COVID-19 patients [7].
Taken together, within the GI tract, the co-expression of ACE2 and TMPRSS2 transcripts was highest in the small intestine and colon/rectum (Figure 2A). Greater than 20% of enterocytes from the small intestine and approximately 5% of colonocytes co-expressed ACE2 and TMPRSS2 (Figure 2B). Recent evidence suggests that another serine protease TMPRSS4 also promotes SARS-CoV-2 entry into human enterocytes and has an additive effect with TMPRSS2 [8]. Therefore, we looked for the expression of TMPRSS4 throughout the GI tract as well as its co-expression with ACE2 and TMPRSS2 in small intestine and colon/rectum (Figure 3A, Figure S1C). While approximately 5% of enterocytes and 3% of colonocytes co-expressed all three genes, progenitor cells in the small intestine (approximately 10%) and colon/rectum (approximately 3.5%) as well as Paneth cells in the small intestine (approximately 12%) demonstrated higher proportion of cells co-expressing all three genes (Figure 3B).
Analysis of 321 genes that were positively correlated (Pearson’s r > 0.1) with ACE2 in the small intestine (Table S2) revealed the enrichment of functional Gene Ontology (GO) terms such as metabolic, digestion, and transport pathways (Figure 4A), thus confirming the inherent digestive and absorptive functions of enterocytes. Interestingly, 135 genes positively correlated with ACE2 in the colon and rectum (Table S3) showed enrichment of not only secretion-associated pathways but also immune-related processes (Figure 4B), which may be upregulated in functional colonocytes due to the microbiome.

4. Discussion

Current evidence supports the GI tract as a site of COVID-19 infection with up to 50% patients reporting digestive symptoms [5]. Our results confirm the co-expression of SARS-CoV-2 entry genes ACE2 and TMPRSS2 in a subset of epithelial cells in the GI tract, especially functional enterocytes from the lower GI tract, and provide potential insights into why entero-colitic symptoms may arise in acute COVID-19 infection.
A recent report by the Human Cell Atlas (HCA) Lung Biological Network surveyed the co-expression of ACE2 and TMPRSS2 in multiple organ systems in the body and showed the co-expression of SARS-CoV-2 entry genes in enterocytes and progenitor cells of the ileum and colon but focused their analysis on the cells of the respiratory tract [23]. Our study includes additional previously unpublished data from the colon and confirms the co-expression of ACE2 and TMPRSS2 in the lower GI tract is more prevalent than the upper GI tract. The entry of SARS-CoV-2 into the host cell begins by the binding of viral spike glycoprotein with ACE2 protein followed by processing of the spike glycoprotein by TMPRSS2 leading to membrane fusion, and recent evidence suggests an additive effect of TMPRSS4 in viral entry [8]. Therefore, we also surveyed the co-expression of TMPRSS4 with other viral entry genes in the lower GI tract and found that the progenitor cells had the highest co-expression of all three genes suggesting a mechanism for prolonged GI infection.
Another study also exploring the expression of ACE2 and TMPRSS2 from scRNA-seq data of the GI and respiratory tract demonstrated higher mean expression of these two genes in the lower GI tract than the respiratory tract and confirmed ACE2 protein expression in the mucosal cells of the lower GI tract [24]. While our study lacks protein expression data of ACE2 and TMPRSS2, other functional studies utilizing small intestine enteroids showed evidence of active infection of intestinal epithelial cells by SARS-CoV-2 [8,25], confirming the possibility of COVID-19 infection in the GI tract. Interestingly, one of the studies demonstrated the inactivation of SARS-CoV-2 by simulated human GI secretions [8], suggesting that while the GI tract is susceptible to infection, it may not be a route of further transmission.
Our results parallel the findings from recent studies that revealed the co-expression of ACE2 and TMPRSS2 in olfactory epithelium [26] and intrahepatic cholangiocytes [27], which may explain atypical COVID-19 symptoms and laboratory findings such as anosmia/dysgeusia and transaminitis. Our results further support the feasibility of SARS-CoV-2 entry into the GI tract, especially in the small intestine, with implications for GI infection.

Supplementary Materials

The following are available online at https://0-www-mdpi-com.brum.beds.ac.uk/2073-4425/11/6/645/s1, Figure S1: Proportions of ACE2-, TMPRSS2-, and TMPRSS4-expressing cells in GI tract; Table S1: Summary of percent of cell types co-expressing ACE2 and TMPRSS2 reported by individual datasets; Table S2: List of 321 genes positively correlated with ACE2 in the small intestine; Table S3: List of 135 genes positively correlated with ACE2 in the colon and rectum; Data S1: Cell meta data, dimension coordinates, and expression of marker genes in colon/rectal data set. Data S2: Analysis code.

Author Contributions

Conceptualization, J.J.L. and A.M.; formal analysis, J.J.L.; data curation, J.J.L., S.K., E.V., J.P.S., K.C., and A.M.; writing—original draft preparation, J.J.L. and A.M.; writing—review and editing, J.J.L., S.K., E.V., J.P.S., K.C., and A.M.; supervision, A.M.; project administration, S.K., E.V., J.P.S., K.C., A.M.; funding acquisition, S.K., E.V., J.P.S., K.C., and A.M. All authors have read and agreed to the published version of the manuscript.

Funding

This work was supported by the MD Anderson Pancreatic Cancer Moon Shot Program and the Khalifa Bin Zayed Foundation to A.M.; the Human Breast Cell Atlas Seed Network Grant HCA3-0000000147 from the Chan Zuckerberg Initiative to K.C.; the NIH K22 CA234406-01 and the Cancer Prevention and Research Institute of Texas (CPRIT) Scholar in Cancer Research to J.P.S.; a gift from the Feinberg Family and MD Anderson Cancer Center Pre-Cancer Atlas Project to E.V.; the MD Anderson Colorectal Cancer Moon Shot Program to S.K. and E.V.; the NIH T32 CA009599 to J.J.L.; the NIH/NCI P30 CA016672 to the MD Anderson Cancer Center Core Support Grant; and the CPRIT SINGLE CORE Facilities Grant RP180684.

Acknowledgments

We thank Charles Bowen for performing single cell dissociations from colonic samples, Kangyu Lin and Jinzhuang Dou for assistance in data acquisition and transfer, and the Single Cell Core at MD Anderson Cancer Center.

Conflicts of Interest

A.M. receives royalties for a pancreatic cancer biomarker test from Cosmos Wisdom Biotechnology, and this financial relationship is managed and monitored by the UTMDACC Conflict of Interest Committee. A.M. is also listed as an inventor on a patent that has been licensed by Johns Hopkins University to Thrive Earlier Detection. E.V. has a consulting and advisory role with Janssen research and Development. The remaining authors disclose no conflicts.

References

  1. Guan, W.J.; Ni, Z.Y.; Hu, Y.; Liang, W.H.; Ou, C.Q.; He, J.X.; Liu, L.; Shan, H.; Lei, C.L.; Hui, D.S.C.; et al. Clinical characteristics of coronavirus disease 2019 in China. N. Engl. J. Med. 2020, 382, 1708–1720. [Google Scholar] [CrossRef] [PubMed]
  2. Holshue, M.L.; DeBolt, C.; Lindquist, S.; Lofy, K.H.; Wiesman, J.; Bruce, H.; Spitters, C.; Ericson, K.; Wilkerson, S.; Tural, A.; et al. First case of 2019 novel coronavirus in the United States. N. Engl. J. Med. 2020, 382, 929–936. [Google Scholar] [CrossRef] [PubMed]
  3. Xiao, F.; Tang, M.; Zheng, X.; Liu, Y.; Li, X.; Shan, H. Evidence for gastrointestinal infection of SARS-CoV-2. Gastroenterology 2020, 158, 1831–1833. [Google Scholar] [CrossRef]
  4. Wolfel, R.; Corman, V.M.; Guggemos, W.; Seilmaier, M.; Zange, S.; Muller, M.A.; Niemeyer, D.; Jones, T.C.; Vollmar, P.; Rothe, C.; et al. Virological assessment of hospitalized patients with COVID-2019. Nature 2020, 581, 465–469. [Google Scholar] [CrossRef] [Green Version]
  5. Pan, L.; Mu, M.; Yang, P.; Sun, Y.; Wang, R.; Yan, J.; Li, P.; Hu, B.; Wang, J.; Hu, C.; et al. Clinical characteristics of COVID-19 patients with digestive symptoms in Hubei, China: A descriptive, cross-sectional, multicenter study. Am. J. Gastroenterol. 2020, 115, 766–773. [Google Scholar] [CrossRef] [PubMed]
  6. Chen, L.; Lou, J.; Bai, Y.; Wang, M. COVID-19 disease with positive fecal and negative pharyngeal and sputum viral tests. Am. J. Gastroenterol. 2020, 115, 790. [Google Scholar] [CrossRef] [PubMed]
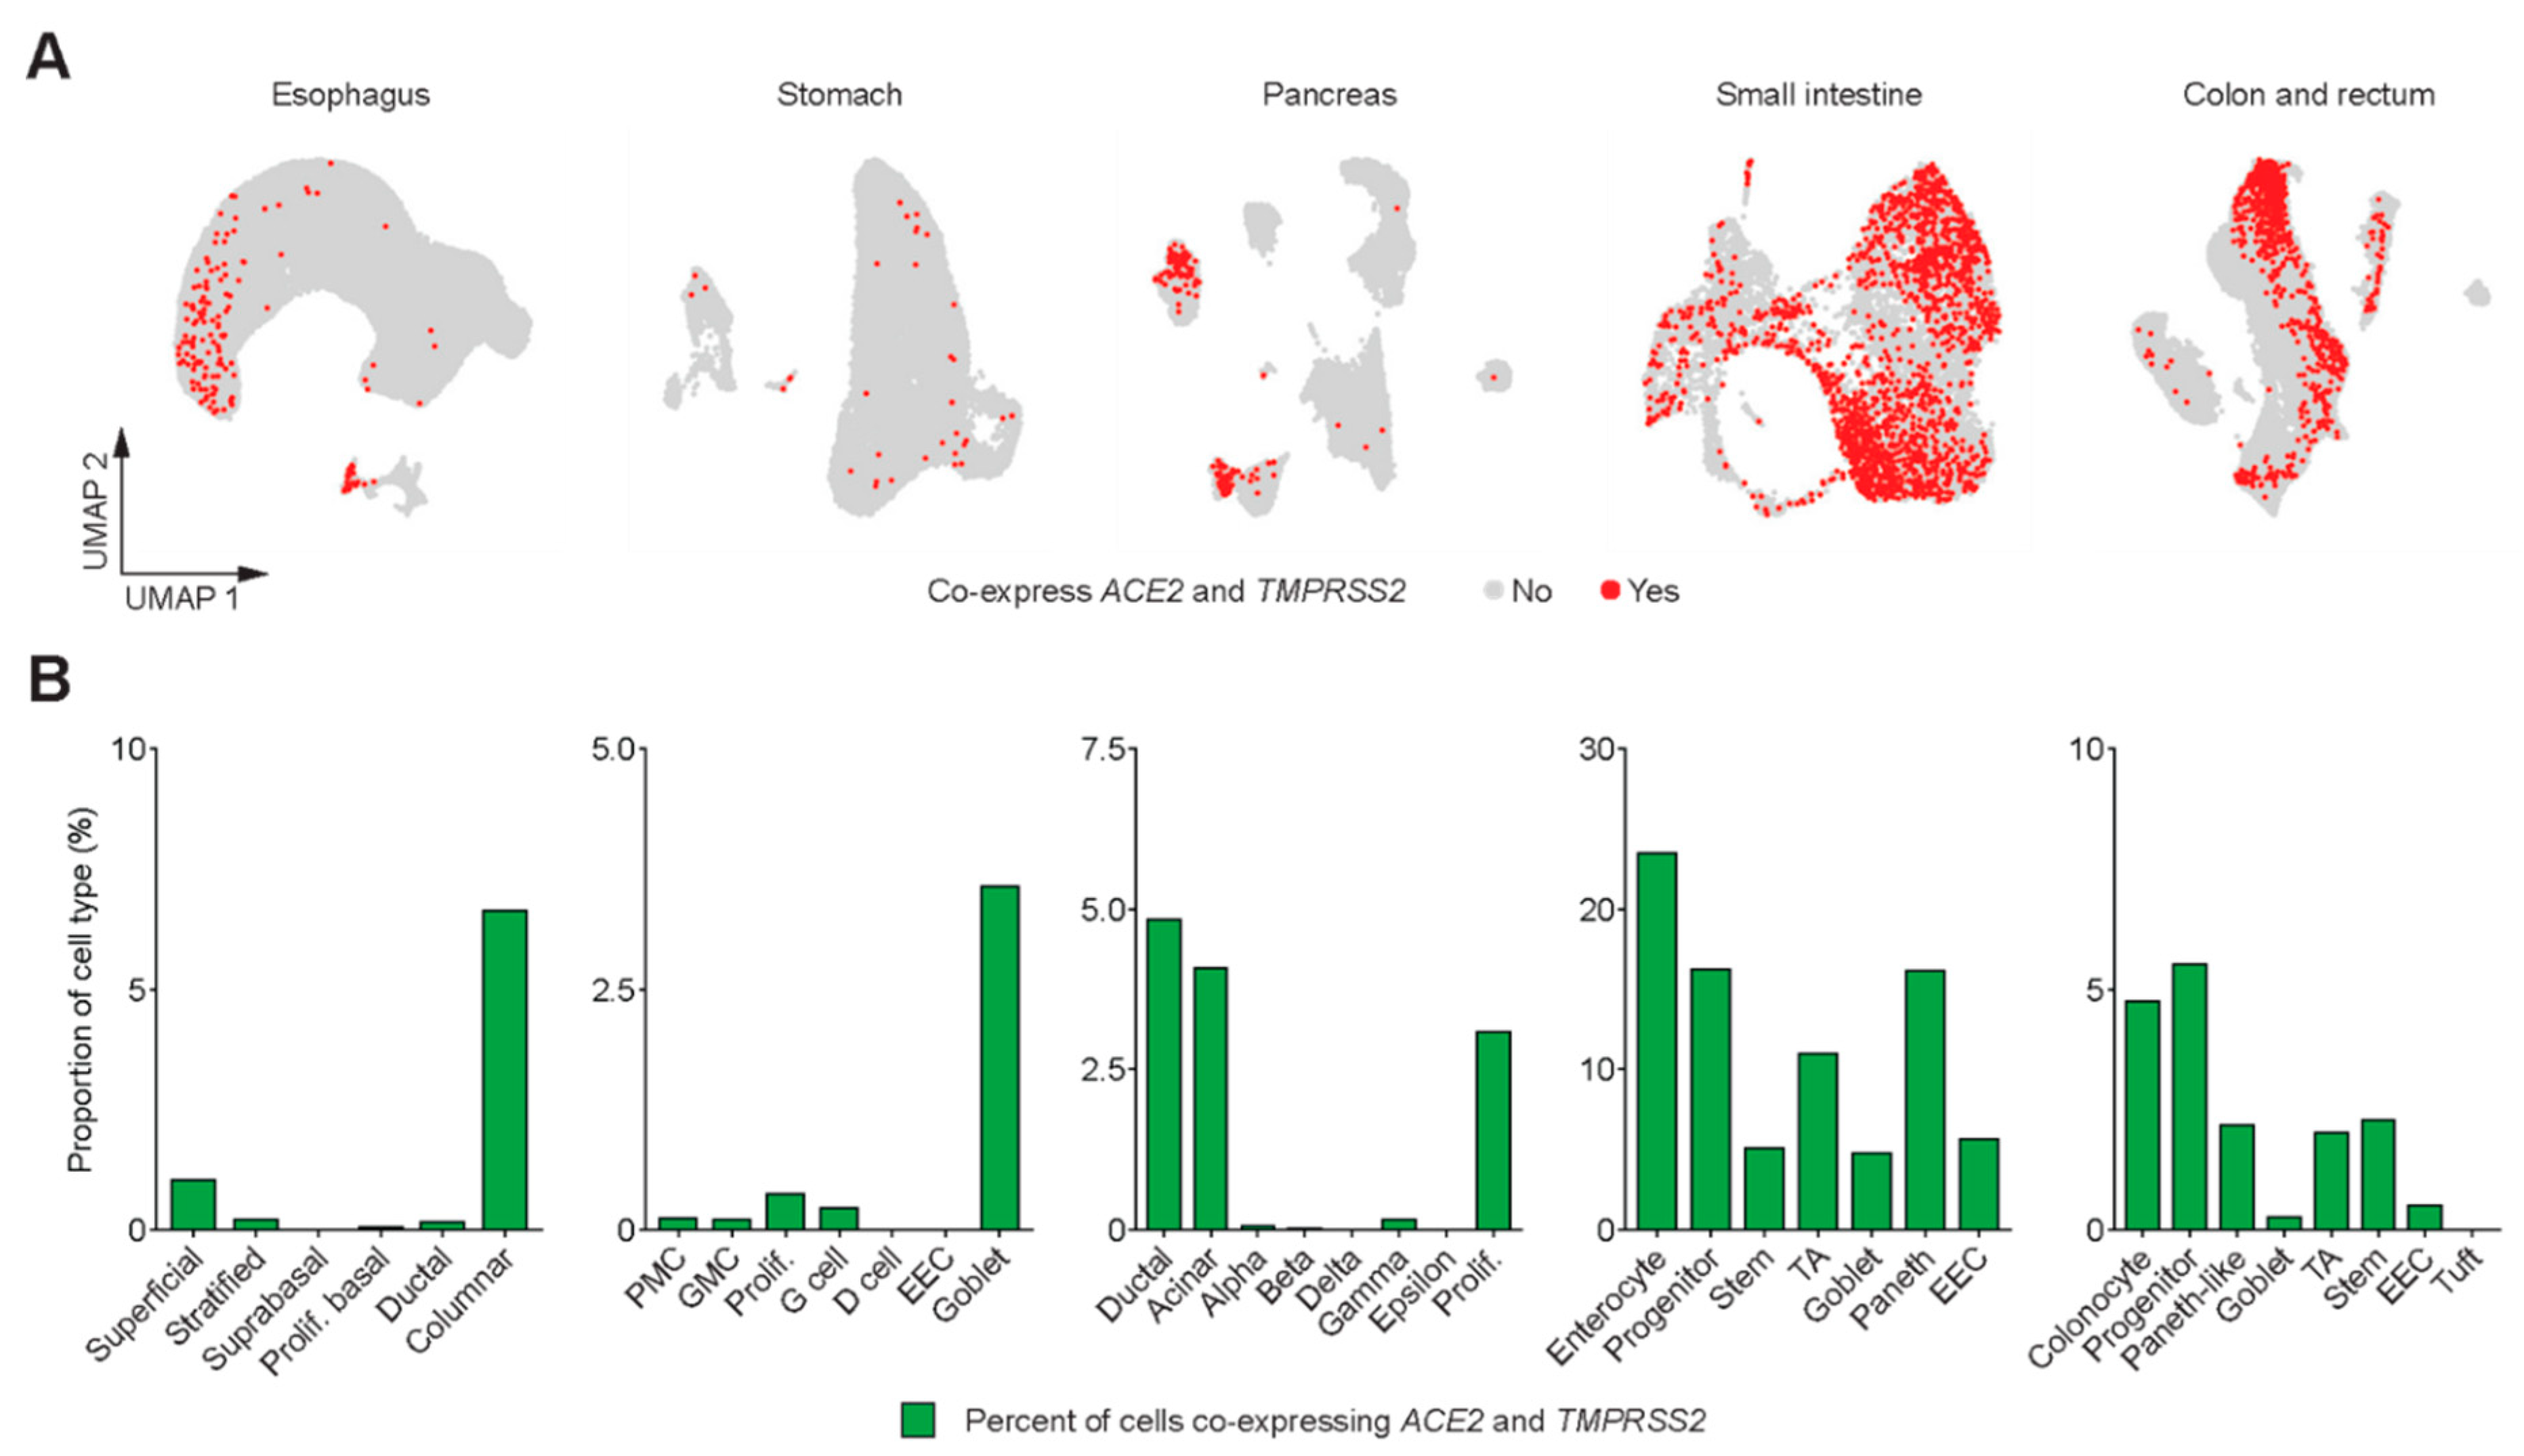
  7. Hoffmann, M.; Kleine-Weber, H.; Schroeder, S.; Kruger, N.; Herrler, T.; Erichsen, S.; Schiergens, T.S.; Herrler, G.; Wu, N.H.; Nitsche, A.; et al. SARS-CoV-2 cell entry depends on ACE2 and TMPRSS2 and is blocked by a clinically proven protease inhibitor. Cell 2020, 181, 271–280.e8. [Google Scholar] [CrossRef]
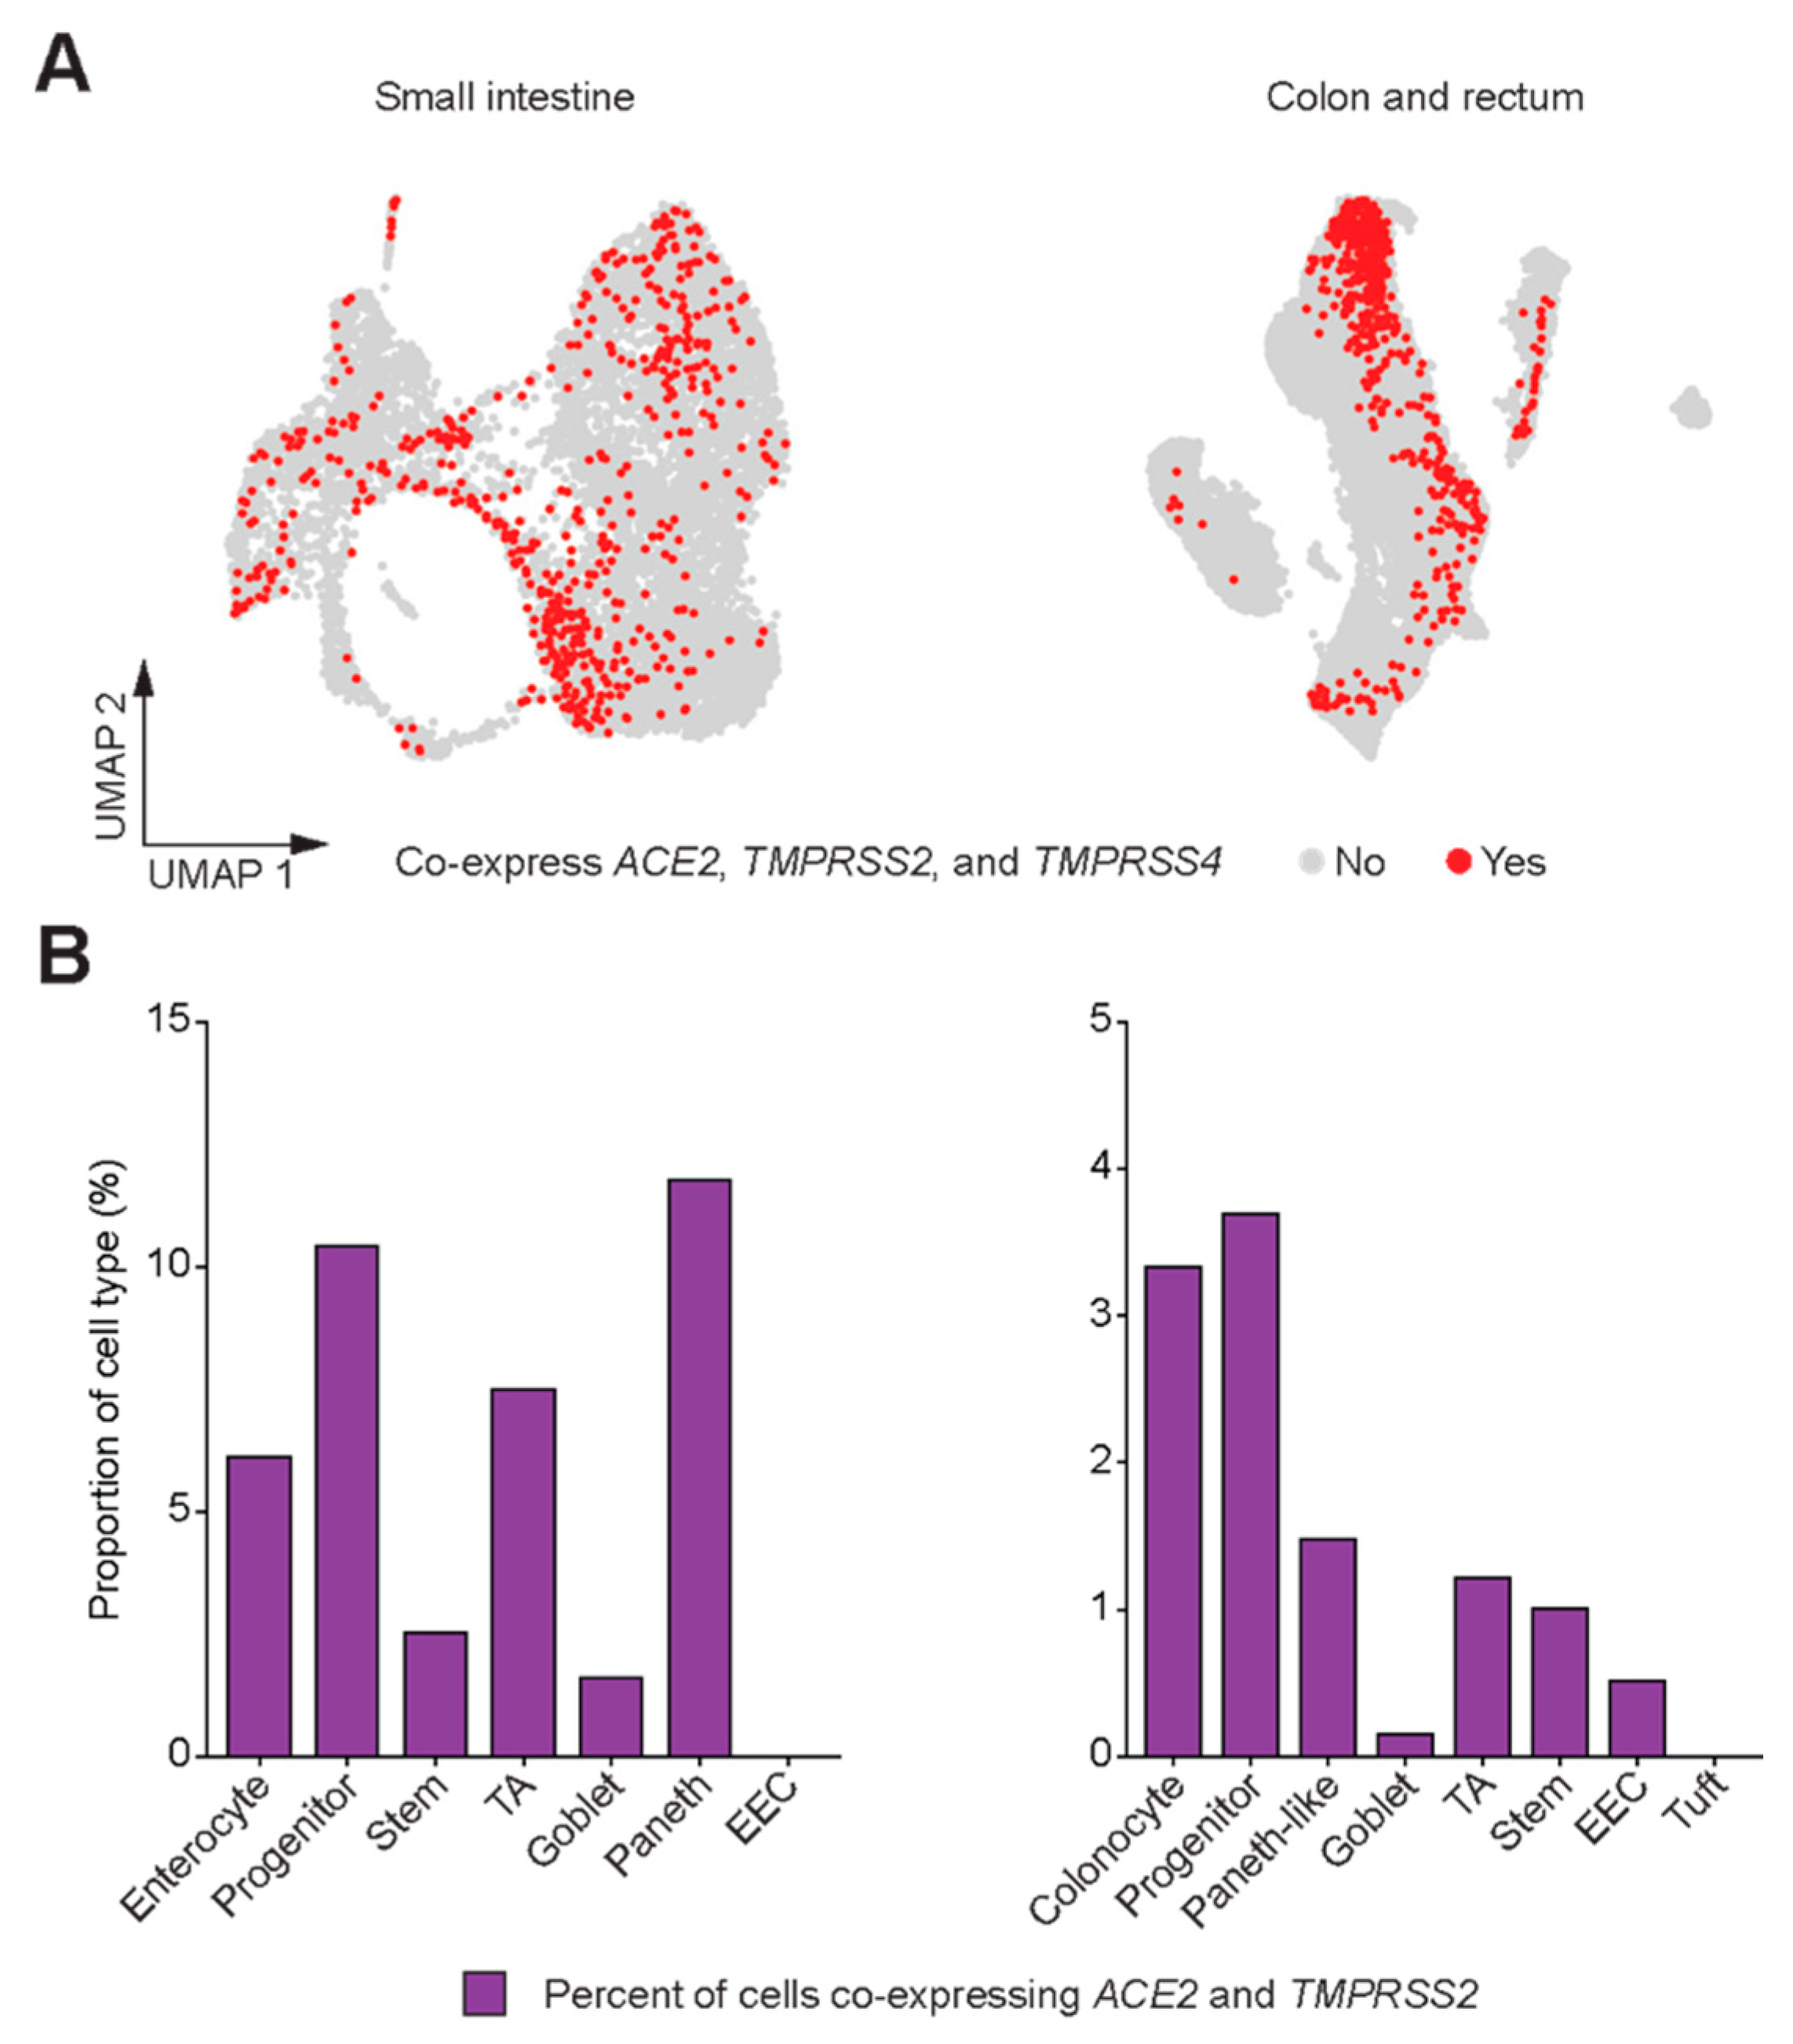
  8. Zang, R.; Gomez Castro, M.F.; McCune, B.T.; Zeng, Q.; Rothlauf, P.W.; Sonnek, N.M.; Liu, Z.; Brulois, K.F.; Wang, X.; Greenberg, H.B.; et al. TMPRSS2 and TMPRSS4 promote SARS-CoV-2 infection of human small intestinal enterocytes. Sci. Immunol. 2020, 5, eabc3582. [Google Scholar] [CrossRef] [PubMed]
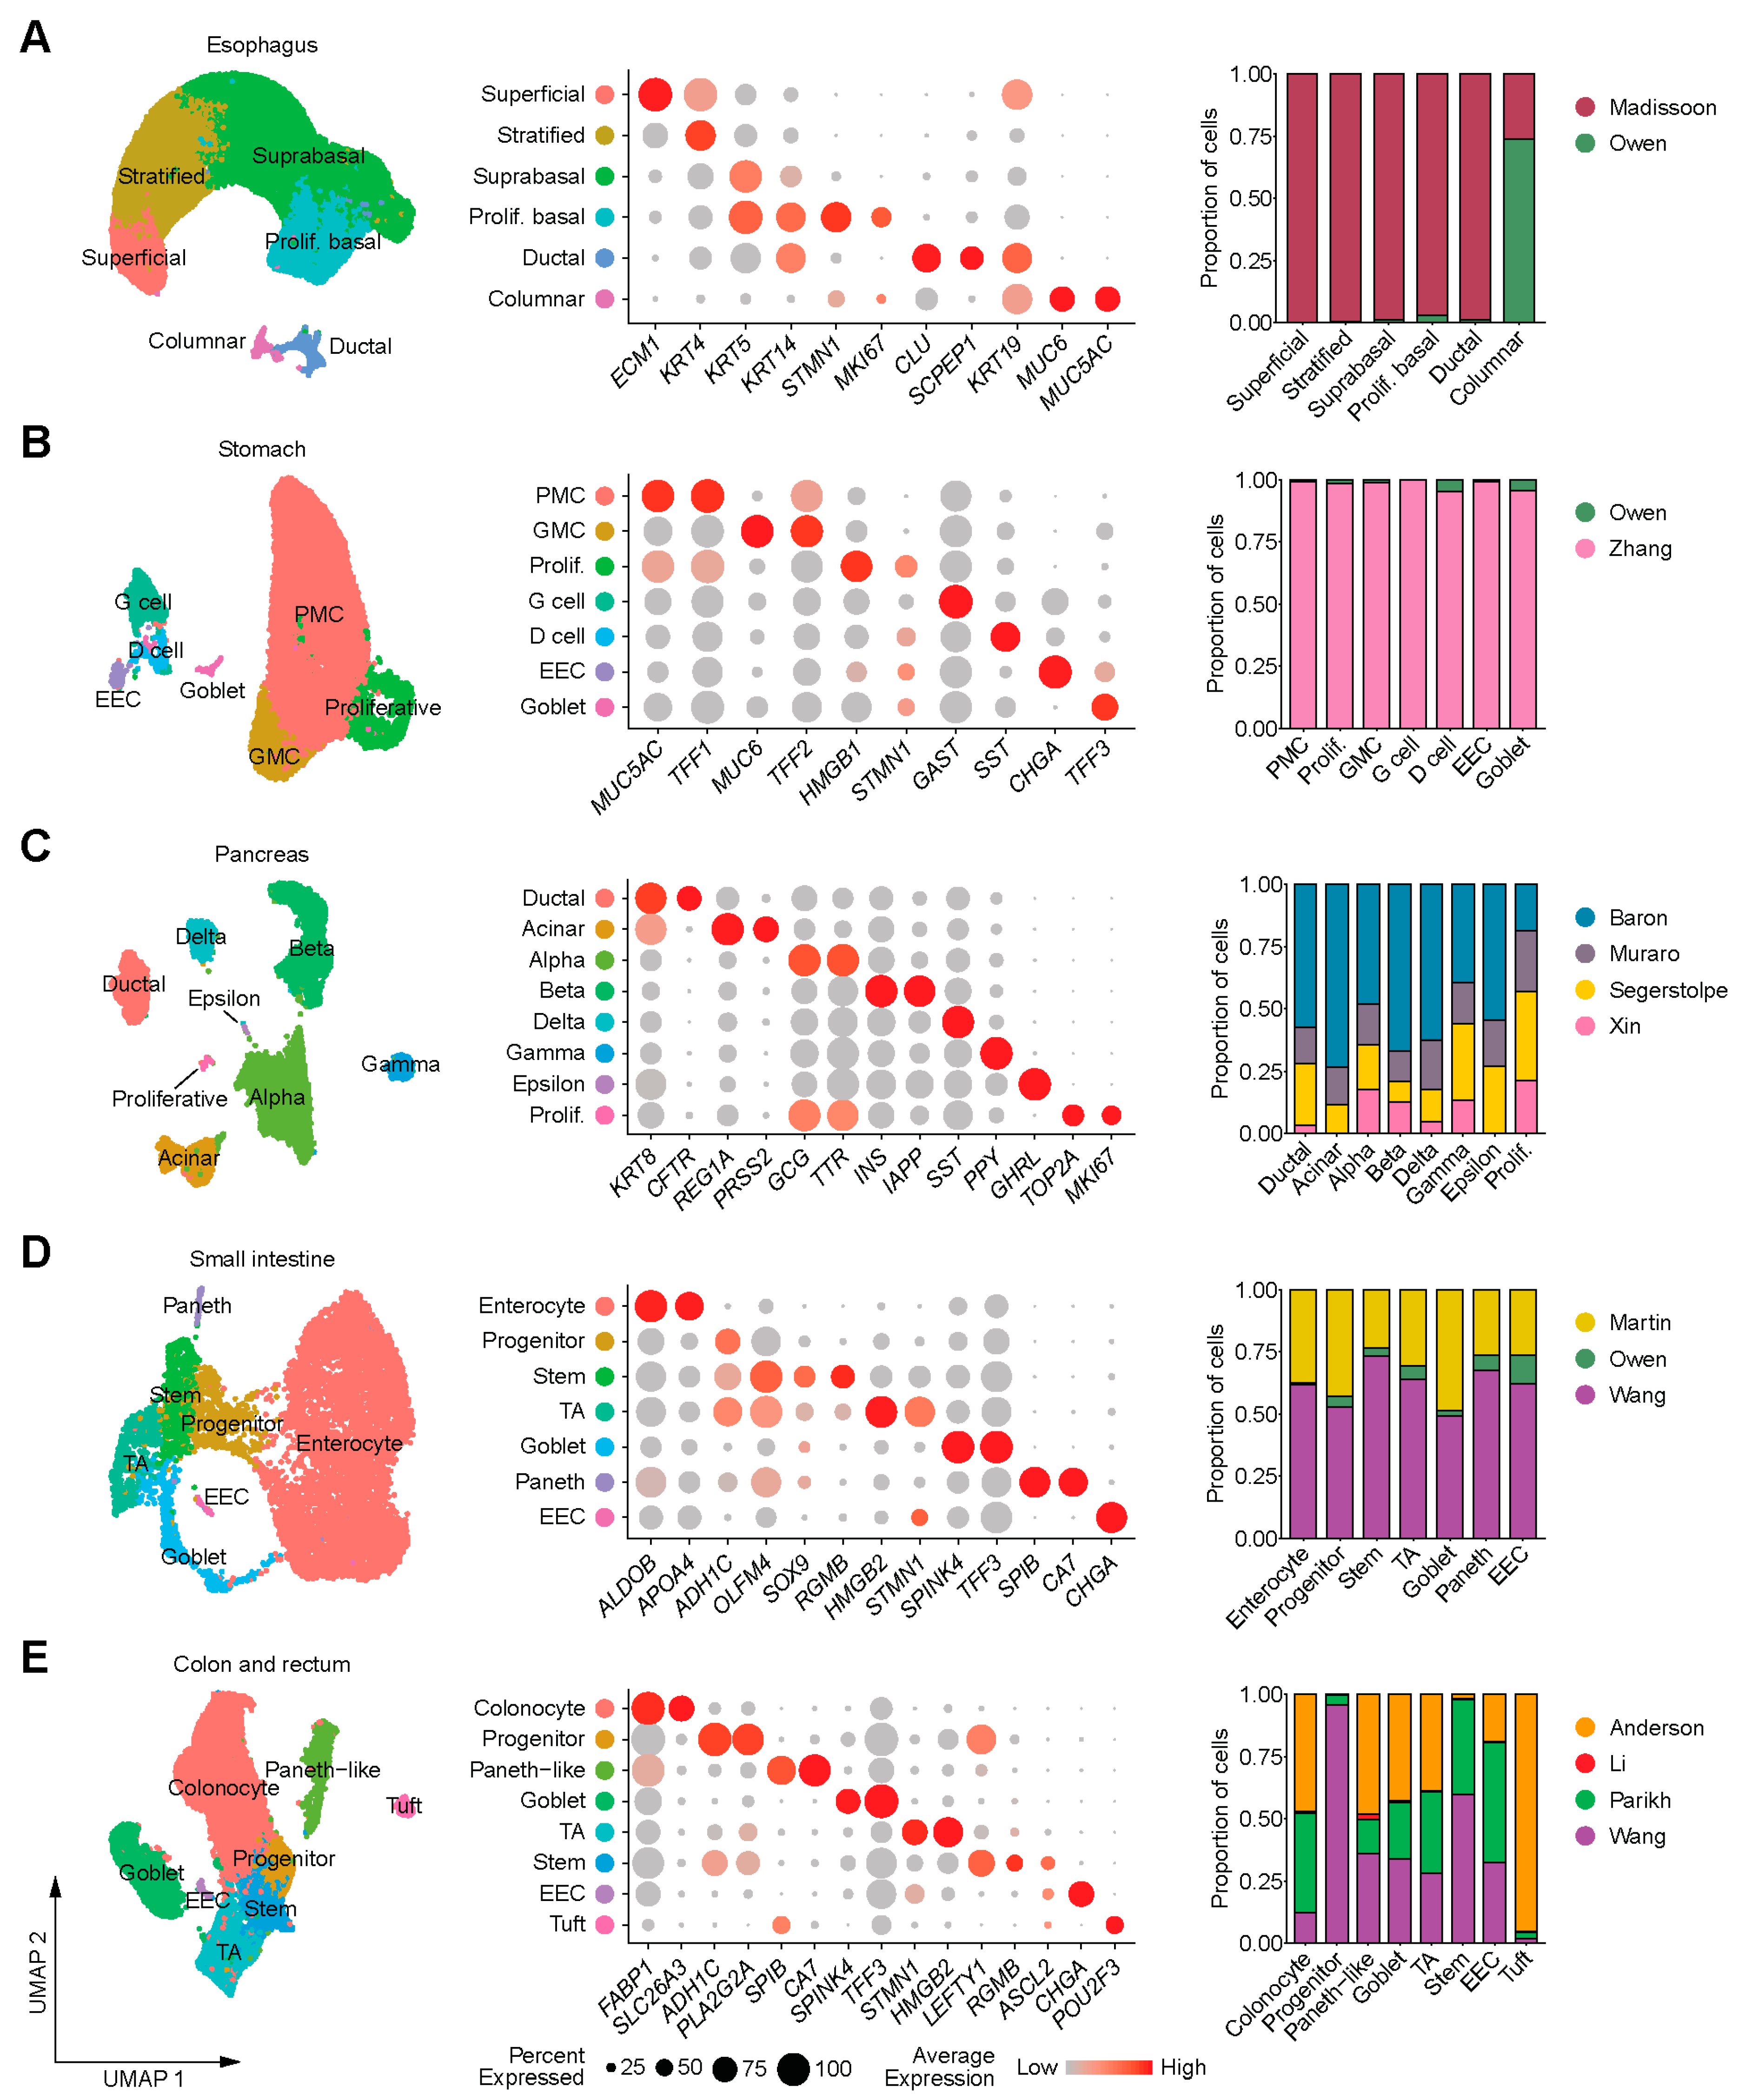
  9. Madissoon, E.; Wilbrey-Clark, A.; Miragaia, R.J.; Saeb-Parsy, K.; Mahbubani, K.T.; Georgakopoulos, N.; Harding, P.; Polanski, K.; Huang, N.; Nowicki-Osuch, K.; et al. scRNA-seq assessment of the human lung, spleen, and esophagus tissue stability after cold preservation. Genome Biol. 2019, 21, 1. [Google Scholar] [CrossRef] [Green Version]
  10. Owen, R.P.; White, M.J.; Severson, D.T.; Braden, B.; Bailey, A.; Goldin, R.; Wang, L.M.; Ruiz-Puig, C.; Maynard, N.D.; Green, A.; et al. Single cell RNA-seq reveals profound transcriptional similarity between Barrett’s oesophagus and oesophageal submucosal glands. Nat. Commun. 2018, 9, 4261. [Google Scholar] [CrossRef] [Green Version]
  11. Zhang, P.; Yang, M.; Zhang, Y.; Xiao, S.; Lai, X.; Tan, A.; Du, S.; Li, S. Dissecting the single-cell transcriptome network underlying gastric premalignant lesions and early gastric cancer. Cell Rep. 2019, 27, 1934–1947.e5. [Google Scholar] [CrossRef] [PubMed] [Green Version]
  12. Baron, M.; Veres, A.; Wolock, S.L.; Faust, A.L.; Gaujoux, R.; Vetere, A.; Ryu, J.H.; Wagner, B.K.; Shen-Orr, S.S.; Klein, A.M.; et al. A single-cell transcriptomic map of the human and mouse pancreas reveals inter- and intra-cell population structure. Cell Syst. 2016, 3, 346–360.e4. [Google Scholar] [CrossRef] [PubMed] [Green Version]
  13. Muraro, M.J.; Dharmadhikari, G.; Grun, D.; Groen, N.; Dielen, T.; Jansen, E.; van Gurp, L.; Engelse, M.A.; Carlotti, F.; de Koning, E.J.; et al. A single-cell transcriptome atlas of the human pancreas. Cell Syst. 2016, 3, 385–394.e3. [Google Scholar] [CrossRef] [PubMed] [Green Version]
  14. Segerstolpe, A.; Palasantza, A.; Eliasson, P.; Andersson, E.M.; Andreasson, A.C.; Sun, X.; Picelli, S.; Sabirsh, A.; Clausen, M.; Bjursell, M.K.; et al. Single-cell transcriptome profiling of human pancreatic islets in health and type 2 diabetes. Cell Metab. 2016, 24, 593–607. [Google Scholar] [CrossRef] [PubMed] [Green Version]
  15. Xin, Y.; Kim, J.; Okamoto, H.; Ni, M.; Wei, Y.; Adler, C.; Murphy, A.J.; Yancopoulos, G.D.; Lin, C.; Gromada, J. RNA sequencing of single human islet cells reveals type 2 diabetes genes. Cell Metab. 2016, 24, 608–615. [Google Scholar] [CrossRef] [PubMed]
  16. Martin, J.C.; Chang, C.; Boschetti, G.; Ungaro, R.; Giri, M.; Grout, J.A.; Gettler, K.; Chuang, L.S.; Nayar, S.; Greenstein, A.J.; et al. Single-cell analysis of crohn’s disease lesions identifies a pathogenic cellular module associated with resistance to anti-TNF therapy. Cell 2019, 178, 1493–1508.e20. [Google Scholar] [CrossRef]
  17. Wang, Y.; Song, W.; Wang, J.; Wang, T.; Xiong, X.; Qi, Z.; Fu, W.; Yang, X.; Chen, Y.G. Single-cell transcriptome analysis reveals differential nutrient absorption functions in human intestine. J. Exp. Med. 2020, 217, e20191130. [Google Scholar] [CrossRef]
  18. Parikh, K.; Antanaviciute, A.; Fawkner-Corbett, D.; Jagielowicz, M.; Aulicino, A.; Lagerholm, C.; Davis, S.; Kinchen, J.; Chen, H.H.; Alham, N.K.; et al. Colonic epithelial cell diversity in health and inflammatory bowel disease. Nature 2019, 567, 49–55. [Google Scholar] [CrossRef]
  19. Li, H.; Courtois, E.T.; Sengupta, D.; Tan, Y.; Chen, K.H.; Goh, J.J.L.; Kong, S.L.; Chua, C.; Hon, L.K.; Tan, W.S.; et al. Reference component analysis of single-cell transcriptomes elucidates cellular heterogeneity in human colorectal tumors. Nat. Genet. 2017, 49, 708–718. [Google Scholar] [CrossRef]
  20. Stuart, T.; Butler, A.; Hoffman, P.; Hafemeister, C.; Papalexi, E.; Mauck, W.M., 3rd; Hao, Y.; Stoeckius, M.; Smibert, P.; Satija, R. Comprehensive integration of single-cell data. Cell 2019, 177, 1888–1902.e21. [Google Scholar] [CrossRef]
  21. Ashburner, M.; Ball, C.A.; Blake, J.A.; Botstein, D.; Butler, H.; Cherry, J.M.; Davis, A.P.; Dolinski, K.; Dwight, S.S.; Eppig, J.T.; et al. Gene ontology: Tool for the unification of biology. The Gene Ontology Consortium. Nat. Genet. 2000, 25, 25–29. [Google Scholar] [CrossRef] [Green Version]
  22. Mi, H.; Muruganujan, A.; Ebert, D.; Huang, X.; Thomas, P.D. PANTHER version 14: More genomes, a new PANTHER GO-slim and improvements in enrichment analysis tools. Nucleic Acids Res. 2019, 47, D419–D426. [Google Scholar] [CrossRef] [PubMed]
  23. Sungnak, W.; Huang, N.; Becavin, C.; Berg, M.; Queen, R.; Litvinukova, M.; Talavera-Lopez, C.; Maatz, H.; Reichart, D.; Sampaziotis, F.; et al. SARS-CoV-2 entry factors are highly expressed in nasal epithelial cells together with innate immune genes. Nat. Med. 2020, 26, 681–687. [Google Scholar] [CrossRef] [PubMed] [Green Version]
  24. Zhang, H.; Kang, Z.; Gong, H.; Xu, D.; Wang, J.; Li, Z.; Li, Z.; Cui, X.; Xiao, J.; Zhan, J.; et al. Digestive system is a potential route of COVID-19: An analysis of single-cell coexpression pattern of key proteins in viral entry process. Gut 2020, 69, 1010–1018. [Google Scholar] [CrossRef]
  25. Lamers, M.M.; Beumer, J.; van der Vaart, J.; Knoops, K.; Puschhof, J.; Breugem, T.I.; Ravelli, R.B.G.; Paul van Schayck, J.; Mykytyn, A.Z.; Duimel, H.Q.; et al. SARS-CoV-2 productively infects human gut enterocytes. Science 2020. Epub ahead of print. [Google Scholar] [CrossRef]
  26. Brann, D.H.; Tsukahara, T.; Weinreb, C.; Logan, D.W.; Datta, S.R. Non-neural expression of SARS-CoV-2 entry genes in the olfactory epithelium suggests mechanisms underlying anosmia in COVID-19 patients. BioRxiv 2020. [Google Scholar] [CrossRef]
  27. Wen Seow, J.J.; Pai, R.; Mishra, A.; Shepherdson, E.; Hon Lim, T.K.; Goh, B.K.P.; Chan, J.K.Y.; Chow, P.K.H.; Ginhoux, F.; DasGupta, R.; et al. scRNA-seq reveals ACE2 and TMPRSS2 expression in TROP2+ Liver Progenitor Cells: Implications in COVID-19 associated Liver Dysfunction. BioRxiv 2020. [Google Scholar] [CrossRef] [Green Version]
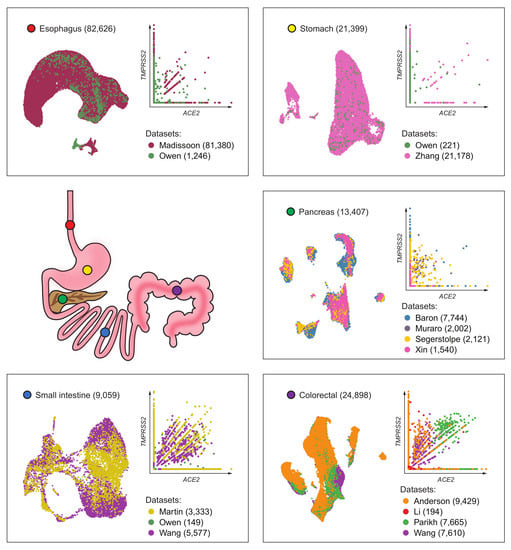
Figure 1. Uniform manifold approximation and projection (UMAP) plots (left) of single-cell RNA-seq (scRNA-seq) data from (A) esophagus, (B) stomach, (C) pancreas, (D) small intestine and colon and (E) rectum; bubble plots showing expression levels of cell-type marker genes (middle) and bar plots depicting the distribution of different datasets in each cell type (right). EEC: Enteroendocrine cell, GMC: Antral basal gland mucous cell, PMC: Pit mucous cell, Prolif: Proliferative, TA: Transit-amplifying cell.
Genes 11 00645 g001
Figure 2. SARS-CoV-2 entry gene co-expression in cells of the gastrointestinal (GI) tract. (A) UMAP plots depicting cells that co-express ACE2 and TMPRSS2. (B) Bar plots depicting proportions of cell types in the GI tract that co-express ACE2 and TMPRSS2.
Genes 11 00645 g002
Figure 3. Co-expression of ACE2 and TMPRSS2 with TMPRSS4. (A) UMAP plots depicting cells that co-express ACE2, TMPRSS2, and TMPRSS4 in small intestine and colon/rectum. (B) Bar plots depicting proportions of cell types in the small intestine and colon/rectum that co-express ACE2, TMPRSS2, and TMPRSS4.
Genes 11 00645 g003
Figure 4. ACE2 co-regulatory networks in the lower gastrointestinal (GI) tract. Bar plots of top Gene Ontology (GO) biological process terms enriched in 321 genes that are positively correlated with ACE2 expression in (A) the small intestine and in (B) the colon/rectum. Vertical dashed line (red) represents significance threshold at false discovery rate (FDR) of 0.05.
Genes 11 00645 g004
Table 1. Summary of datasets used in the study.
TissueDatasetNumber of CellsSequencing Depth (Total Counts *)SourceNotes
EsophagusMadissoon [9]81,3807.58 × 108Seurat object from HCA
Owen [10]12461.81 × 108Counts matrix from Supplementary DataContains Barrett’s esophagus samples
All82,626
StomachOwen [10]2211.75 × 107Counts matrix from Supplementary Data
Zhang [11]21,1787.11 × 107Counts matrix (GSE134520)Included non-atrophic gastritis and chronic atrophic gastritis
All21,399
Pancreatic isletsBaron [12]77444.61 × 107Single Cell Experiment objects from Hemberg’s GroupAll samples were enriched for endocrine cells
Muraro [13]2002n/a
Segerstolpe [14]21211.03 × 109
Xin [15]1540n/a
All13,407
Small intestineMartin [16]33331.37 × 107Counts matrices (GSE134809)Excluded diseased samples (Crohn’s)
Owen [10]1491.61 × 107Counts matrix from Supplementary Data
Wang [17]55775.97 × 107Counts matrix (GSE125970)
All9059
Colon and rectumParikh [18]76651.65 × 107Counts matrices (GSE116222)Excluded diseased samples (ulcerative colitis)
Wang [17]76101.30 × 108Counts matrix (GSE125970)
MDACC94294.92 × 107In-house data
Li [19]1941.65 × 108Counts matrix (GSE81861)
All24,898
* Unique molecular identifier counts from filtered Seurat object were summed to obtain total counts with the exception for Muraro and Xin datasets, which only contain normalized and log-transformed counts. HCA: Human Cell Atlas, MDACC: MD Anderson Cancer Center.

