Differentially Expressed miRNA-Gene Targets Related to Intramuscular Fat in Musculus Longissimus Dorsi of Charolais × Holstein F2-Crossbred Bulls

 ,
,  , , and
Abstract
:1. Introduction
2. Materials and Methods
2.1. Animals
2.2. Samples and RNA Preparation
2.3. MicroRNA Microarray Assay
2.4. Database and Identification of Differentially Expressed miRNAs
2.5. Prediction of Potential Target Genes
2.6. Construction of miRNA-Target Co-Expression Interaction Network
2.7. GO Function and KEGG Pathway Enrichment Analysis
3. Results
3.1. Differentially Expressed miRNAs and Their Predicted mRNA Targets
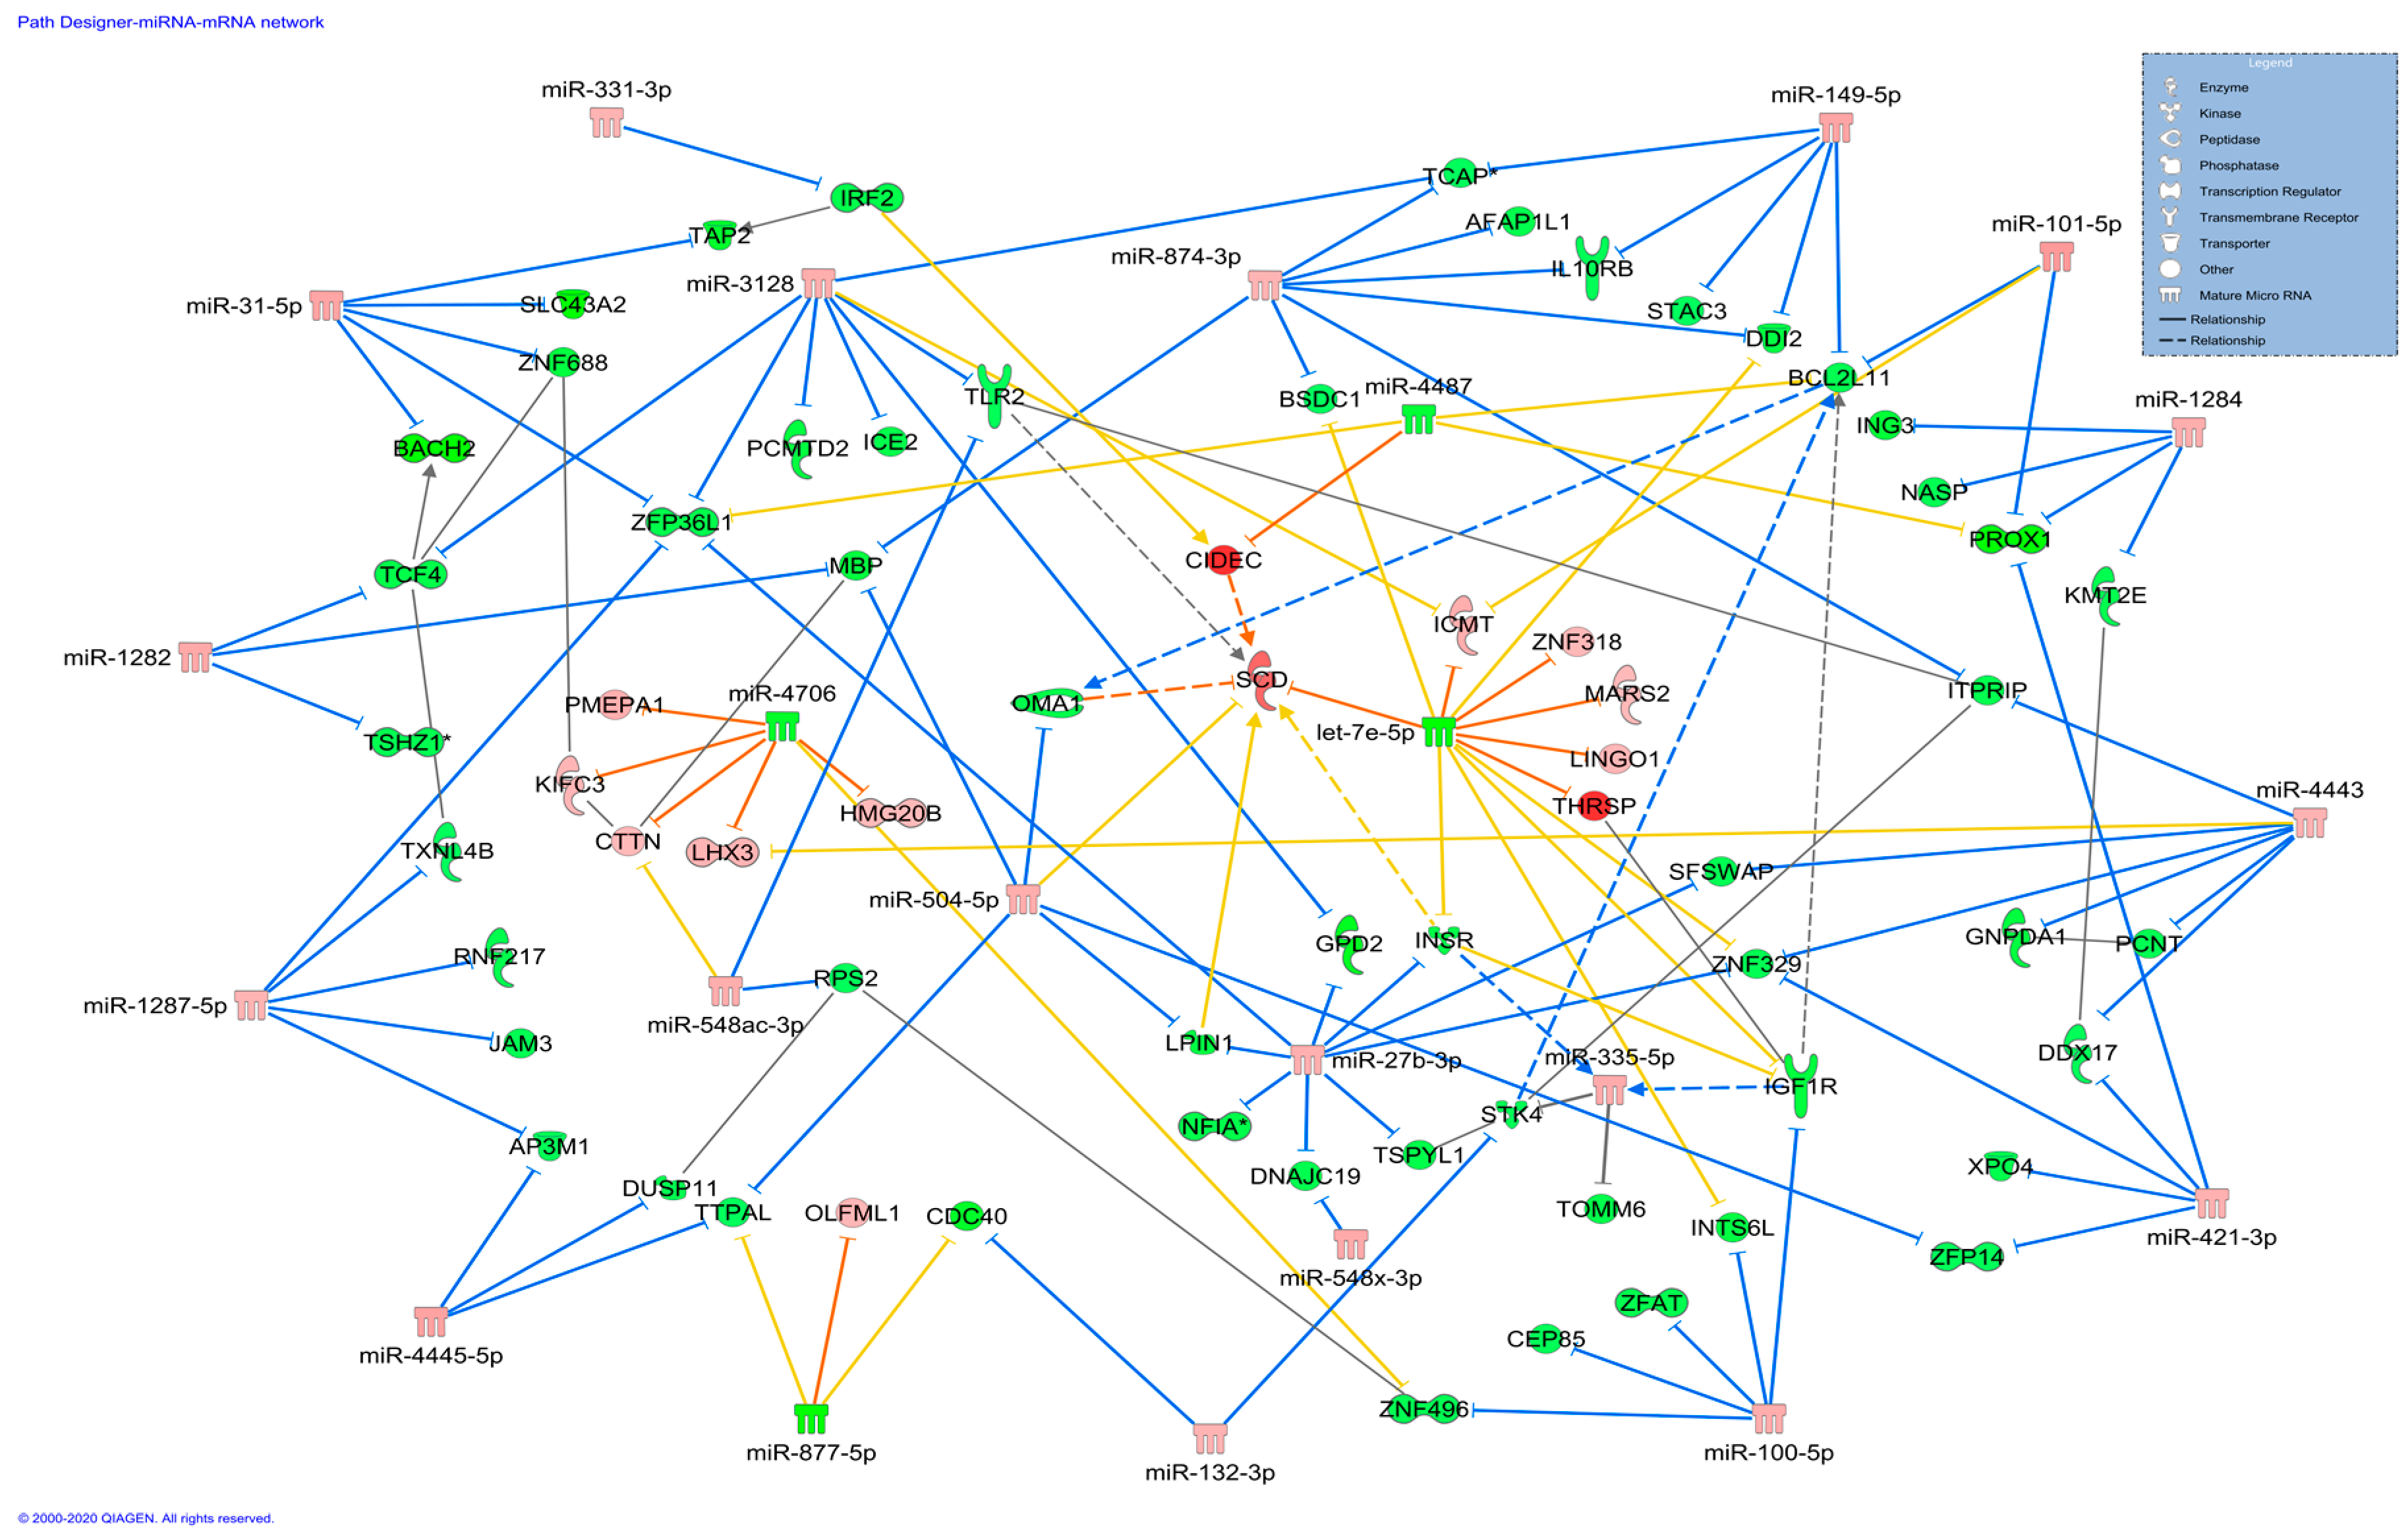
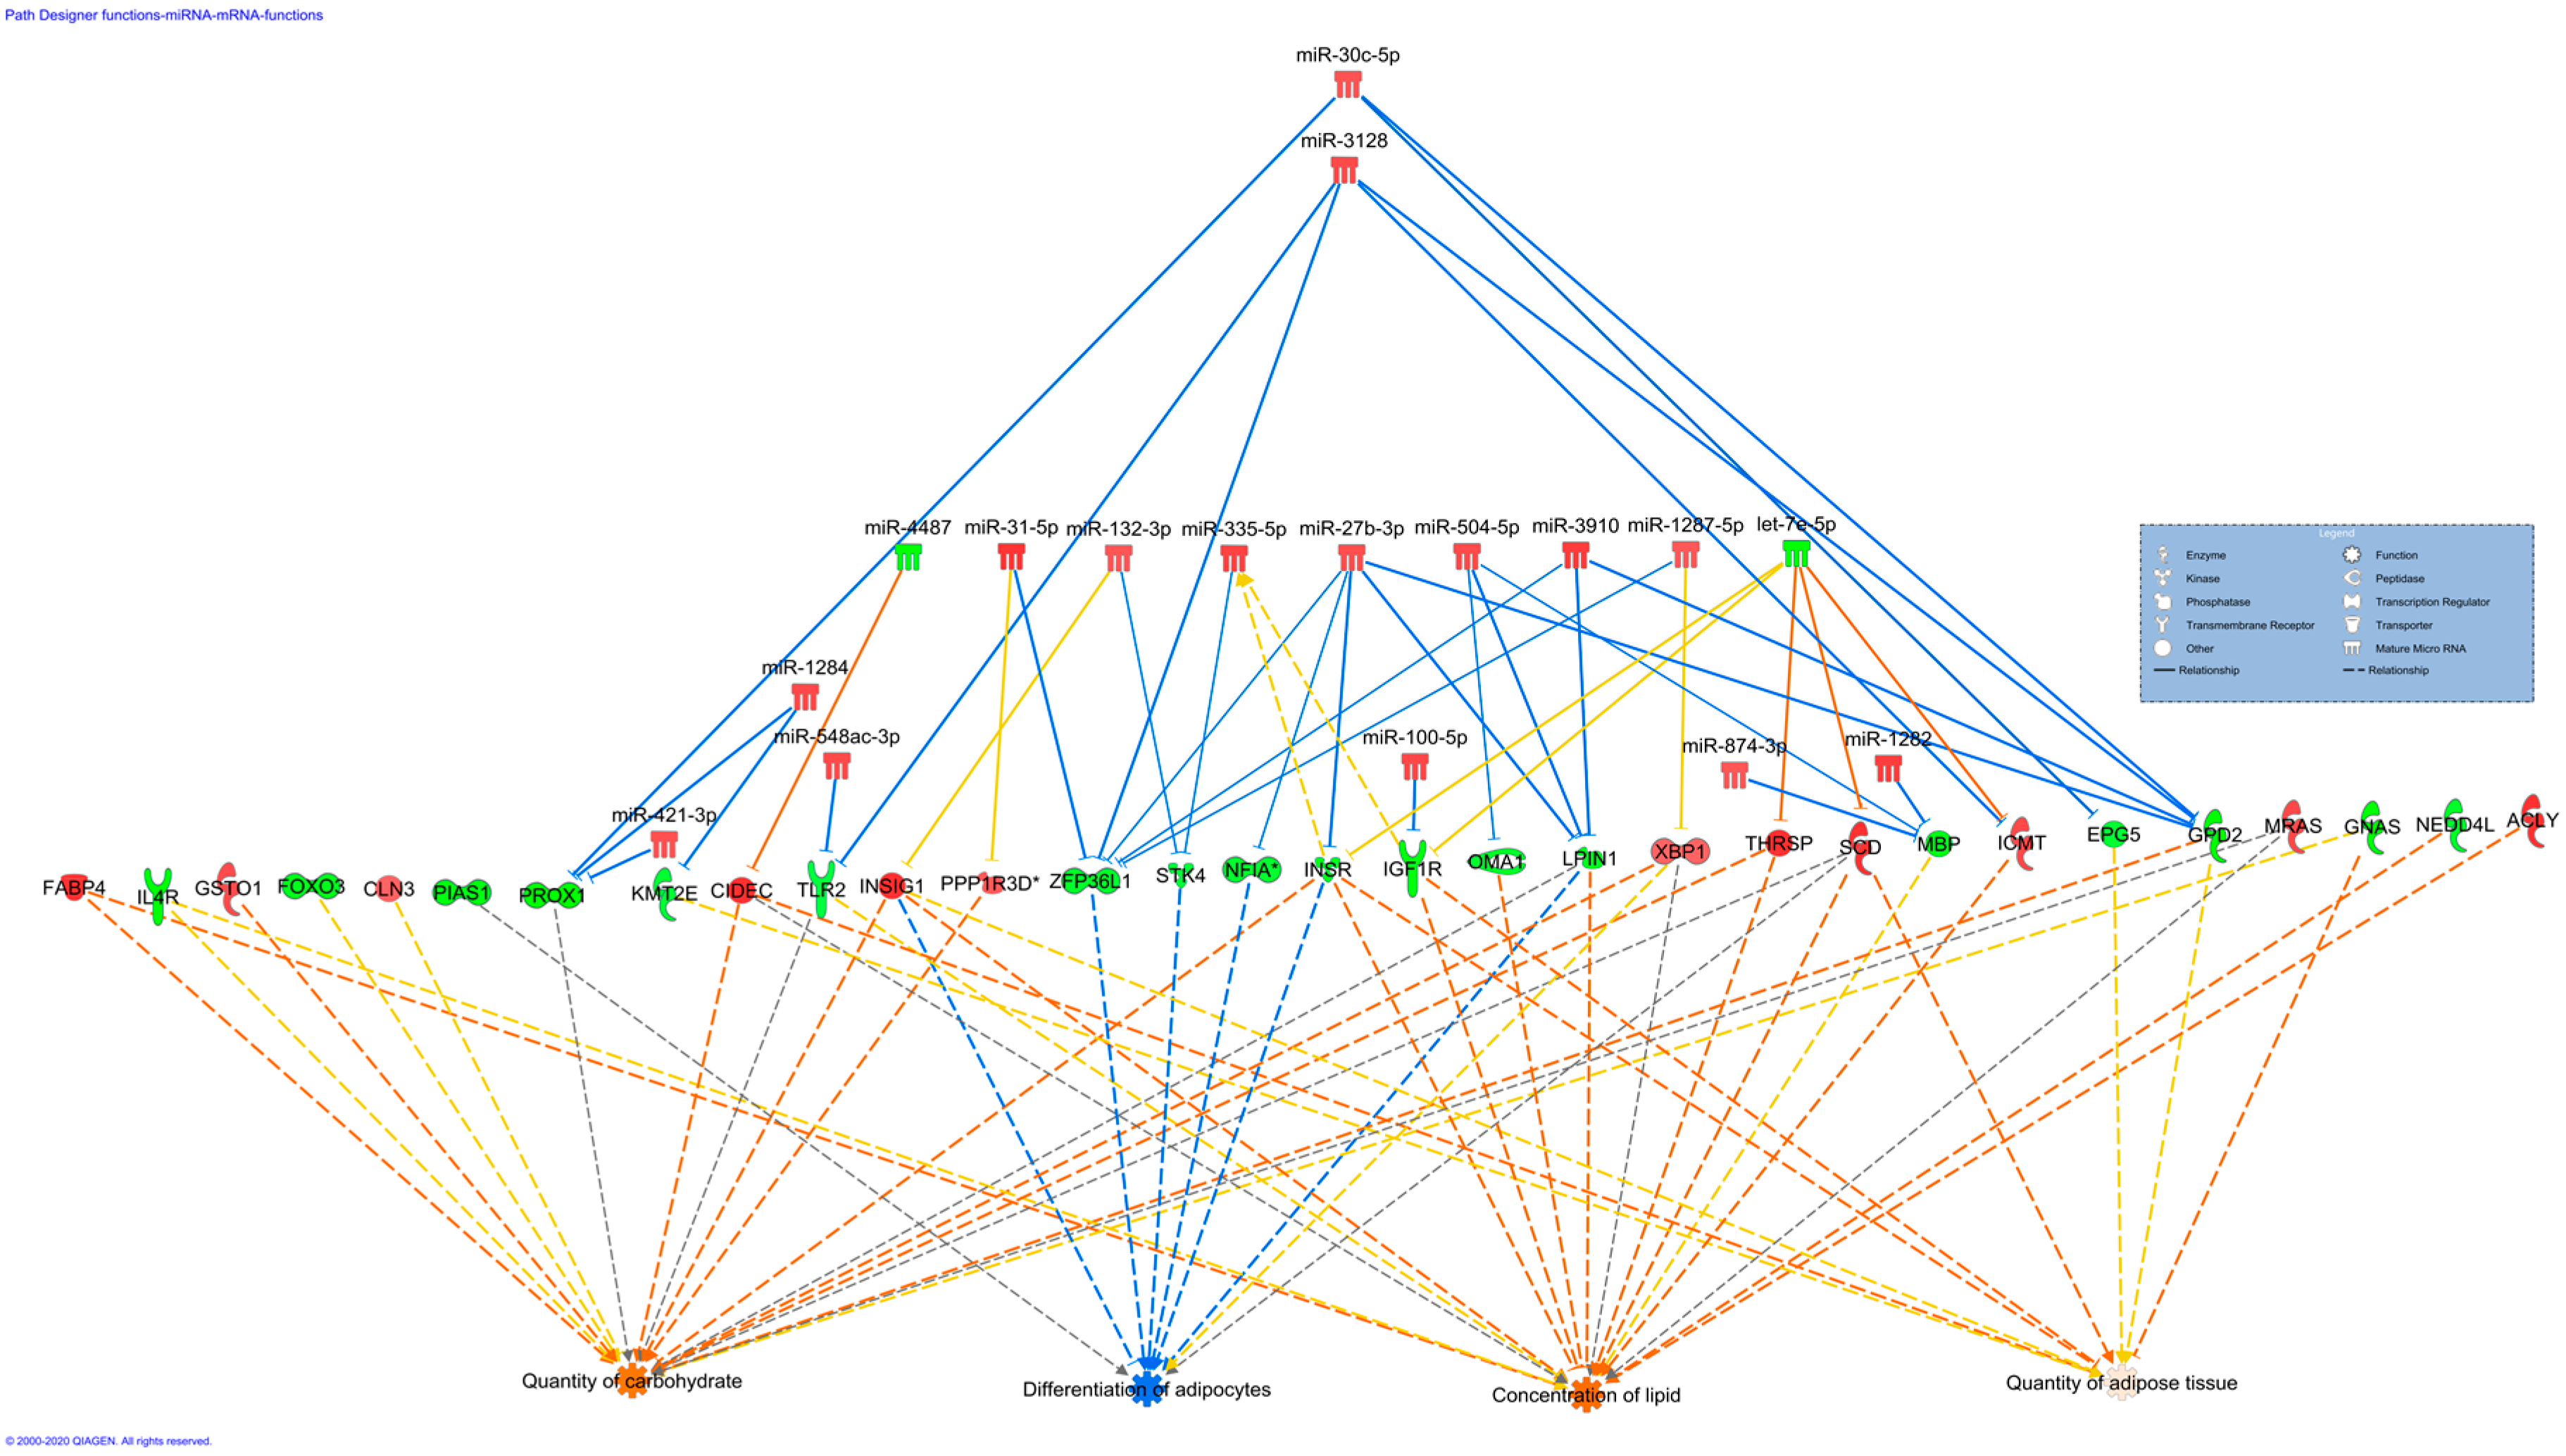
3.2. DE miRNA and DEGs Co-Expression Network and Functional Classification
3.3. Gene Ontology (GO) and KEGG Pathway Enrichment Analyses of Target Genes of the DE miRNAs
4. Discussion
Supplementary Materials
Author Contributions
Funding
Acknowledgments
Conflicts of Interest
References
- Hausman, G.J.; Dodson, M.V.; Ajuwon, K.; Azain, M.; Barnes, K.M.; Guan, L.L.; Jiang, Z.; Poulos, S.; Sainz, R.D.; Smith, S.; et al. BOARD-INVITED REVIEW: The biology and regulation of preadipocytes and adipocytes in meat animals1,2. J. Anim. Sci. 2009, 87, 1218–1246. [Google Scholar] [CrossRef] [PubMed] [Green Version]
- Fan, Y.; Fu, G.; Fu, C.; Zan, L.; Tian, W. A missense mutant of the PPAR-γgene associated with carcass and meat quality traits in Chinese cattle breeds. Genet. Mol. Res. 2012, 11, 3781–3788. [Google Scholar] [CrossRef] [PubMed]
- Pethick, D.W.; Harper, G.; Oddy, V.H. Growth, development and nutritional manipulation of marbling in cattle: A review. Aust. J. Exp. Agric. 2004, 44, 705–715. [Google Scholar] [CrossRef]
- Bong, J.J.; Jeong, J.Y.; Rajasekar, P.; Cho, Y.M.; Kwon, E.G.; Kim, H.C.; Paek, B.H.; Baik, M. Differential expression of genes associated with lipid metabolism in longissimus dorsi of Korean bulls and steers. Meat Sci. 2012, 91, 284–293. [Google Scholar] [CrossRef]
- Albrecht, E.; Schering, L.; Liu, Y.; Komolka, K.; Kühn, C.; Wimmers, K.; Gotoh, T.; Maak, S. TRIENNIAL GROWTH AND DEVELOPMENT SYMPOSIUM: Factors influencing bovine intramuscular adipose tissue development and cellularity. J. Anim. Sci. 2017, 95, 2244–2254. [Google Scholar] [CrossRef]
- Cianzio, D.S.; Topel, D.G.; Whitehurst, G.B.; Beitz, D.C.; Self, H.L. Adipose Tissue Growth and Cellularity: Changes in Bovine Adipocyte Size and Number. J. Anim. Sci. 1985, 60, 970–976. [Google Scholar] [CrossRef]
- Hocquette, J.; Cassar-Malek, I.; Jurie, C.; Bauchart, D.; Picard, B.; Renand, G. Relationships between muscle growth potential, intramuscular fat content and different indicators of muscle fibre types in young Charolais bulls. Anim. Sci. J. 2012, 83, 750–758. [Google Scholar] [CrossRef]
- Martínez-Álvaro, M.; Agha, S.; Blasco, A.; Hernández, P. Muscle lipid metabolism in two rabbit lines divergently selected for intramuscular fat. J. Anim. Sci. 2017, 95, 2576–2584. [Google Scholar] [CrossRef]
- Lowe, C.E.; O’Rahilly, S.; Rochford, J.J. Adipogenesis at a glance. J. Cell. Sci. 2011, 124, 2681–2686. [Google Scholar] [CrossRef] [Green Version]
- De Sá, P.M.; Richard, A.J.; Hang, H.; Stephens, J.M. Transcriptional Regulation of Adipogenesis. Compr. Physiol. 2017, 272, 635–674. [Google Scholar] [CrossRef]
- O’Brien, J.; Hayder, H.; Zayed, Y.; Peng, C. Overview of MicroRNA Biogenesis, Mechanisms of Actions, and Circulation. Front. Endocrinol. 2018, 9, 402. [Google Scholar] [CrossRef] [PubMed] [Green Version]
- Bartel, B. MicroRNAs: Genomics, biogenesis, mechanism, and function. Cell 2004, 116, 281–297. [Google Scholar] [CrossRef] [Green Version]
- Bartel, B. MicroRNAs: Target Recognition and Regulatory Functions. Cell 2009, 136, 215–233. [Google Scholar] [CrossRef] [PubMed] [Green Version]
- Yang, Z.; Cappello, T.; Wang, L. Emerging role of microRNAs in lipid metabolism. Acta Pharm. Sin. B 2015, 5, 145–150. [Google Scholar] [CrossRef] [Green Version]
- Du, J.; Xu, Y.; Zhang, P.; Zhao, X.; Gan, M.; Li, Q.; Ma, J.; Tang, G.; Jiang, Y.; Wang, J.; et al. MicroRNA-125a-5p Affects Adipocytes Proliferation, Differentiation and Fatty Acid Composition of Porcine Intramuscular Fat. Int. J. Mol. Sci. 2018, 19, 501. [Google Scholar] [CrossRef] [Green Version]
- Engin, A.B. MicroRNA and Adipogenesis. Adv. Exp. Med. Biol. 2017, 960, 489–509. [Google Scholar] [CrossRef]
- Son, Y.H.; Ka, S.; Kim, A.Y.; Kim, J.B. Regulation of Adipocyte Differentiation via MicroRNAs. Endocrinol. Metab. 2014, 29, 122–135. [Google Scholar] [CrossRef] [Green Version]
- Guan, L.; Hu, X.; Liu, L.; Xing, Y.; Zhou, Z.; Liang, X.; Yang, Q.; Jin, S.; Bao, J.; Gao, H.; et al. bta-miR-23a involves in adipogenesis of progenitor cells derived from fetal bovine skeletal muscle. Sci. Rep. 2017, 7, 43716. [Google Scholar] [CrossRef]
- Gu, Z.; Eleswarapu, S.; Jiang, H. Identification and characterization of microRNAs from the bovine adipose tissue and mammary gland. FEBS Lett. 2007, 581, 981–988. [Google Scholar] [CrossRef] [Green Version]
- Jin, W.; Dodson, M.V.; Moore, S.; Basarab, J.A.; Guan, L.L. Characterization of microRNA expression in bovine adipose tissues: A potential regulatory mechanism of subcutaneous adipose tissue development. BMC Mol. Boil. 2010, 11, 29. [Google Scholar] [CrossRef] [Green Version]
- Li, N.; Zhang, Y.; Li, H.-P.; Han, L.; Yan, X.-M.; Li, H.-B.; Du, W.; Zhang, J.-S.; Yu, Q.-L. Differential expression of mRNA-miRNAs related to intramuscular fat content in the longissimus dorsi in Xinjiang brown cattle. PLoS ONE 2018, 13, e0206757. [Google Scholar] [CrossRef] [PubMed] [Green Version]
- Huang, J.; Wang, S.; Feng, X.; Liu, X.; Zhao, J.; Zheng, Q.; Wei, X.; Ma, Y. miRNA transcriptome comparison between muscle and adipose tissues indicates potential miRNAs associated with intramuscular fat in Chinese swamp buffalo. Genome 2019, 62, 729–738. [Google Scholar] [CrossRef] [PubMed]
- Oliveira, G.; Regitano, L.C.D.A.; Cesar, A.S.M.; Reecy, J.M.; Degaki, K.Y.; Poleti, M.; Felício, A.M.; Koltes, J.E.; Coutinho, L.L. Integrative analysis of microRNAs and mRNAs revealed regulation of composition and metabolism in Nelore cattle. BMC Genom. 2018, 19, 126. [Google Scholar] [CrossRef]
- Guo, Y.; Zhang, X.; Huang, W.; Miao, X. Identification and characterization of differentially expressed miRNAs in subcutaneous adipose between Wagyu and Holstein cattle. Sci. Rep. 2017, 7, 44026. [Google Scholar] [CrossRef] [PubMed] [Green Version]
- Wang, H.; Zheng, Y.; Wang, G.; Li, H. Identification of microRNA and bioinformatics target gene analysis in beef cattle intramuscular fat and subcutaneous fat. Mol. BioSyst. 2013, 9, 2154. [Google Scholar] [CrossRef]
- Komolka, K.; Ponsuksili, S.; Albrecht, E.; Kühn, C.; Wimmers, K.; Maak, S. Gene expression profile of Musculus longissimus dorsi in bulls of a Charolais × Holstein F2-cross with divergent intramuscular fat content. Genomics data 2015, 7, 131–133. [Google Scholar] [CrossRef] [Green Version]
- Kühn, C.; Bellmann, O.; Voigt, J.; Wegner, J.; Guiard, V.; Ender, K. An experimental approach for studying the genetic and physiological background of nutrient transformation in cattle with respect to nutrient secretion and accretion type. Arch. Anim. Breed. 2002, 45, 317–330. [Google Scholar] [CrossRef]
- Pfuhl, R.; Bellmann, O.; Teuscher, F.; Ender, K.; Wegner, J.; Kühn, C. Beef versus dairy cattle: A comparison of feed conversion, carcass composition, and meat quality. Arch. Anim. Breed. 2007, 50, 59–70. [Google Scholar] [CrossRef]
- McDonald, J.H. Handbook of Biological Statistics, 3rd ed.; Sparky House Publishing: Baltimore, MD, USA, 2014; pp. 254–260. [Google Scholar]
- Sticht, C.; De La Torre, C.; Parveen, A.; Gretz, N. miRWalk: An online resource for prediction of microRNA binding sites. PLoS ONE 2018, 13, e0206239. [Google Scholar] [CrossRef]
- Chen, Y.; Wang, X. miRDB: An online database for prediction of functional microRNA targets. Nucleic Acids Res. 2019, 48, D127–D131. [Google Scholar] [CrossRef] [Green Version]
- Betel, D.; Wilson, M.; Gabow, A.; Marks, S.D.; Sander, C. The microRNA.org resource: Targets and expression. Nucleic Acids Res. 2008, 36, D149–D153. [Google Scholar] [CrossRef] [PubMed] [Green Version]
- Krämer, A.; Green, J.; Pollard, J., Jr.; Tugendreich, S. Causal analysis approaches in Ingenuity Pathway Analysis. Bioinformatics 2014, 30, 523–530. [Google Scholar] [CrossRef] [PubMed]
- Friedman, R.; Farh, K.K.-H.; Burge, C.B.; Bartel, B. Most mammalian mRNAs are conserved targets of microRNAs. Genome Res. 2008, 19, 92–105. [Google Scholar] [CrossRef] [PubMed] [Green Version]
- Naeem, A.; Zhong, K.; Moisá, S.; Drackley, J.; Moyes, K.; Loor, J. Bioinformatics analysis of microRNA and putative target genes in bovine mammary tissue infected with Streptococcus uberis. J. Dairy Sci. 2012, 95, 6397–6408. [Google Scholar] [CrossRef] [PubMed] [Green Version]
- Huang, D.W.; Sherman, B.T.; Lempicki, R.A. Systematic and integrative analysis of large gene lists using DAVID bioinformatics resources. Nat. Protoc. 2009, 4, 44–57. [Google Scholar] [CrossRef]
- Huang, D.W.; Sherman, B.T.; Lempicki, R. Bioinformatics enrichment tools: Paths toward the comprehensive functional analysis of large gene lists. Nucleic Acids Res. 2008, 37, 1–13. [Google Scholar] [CrossRef] [Green Version]
- Weber, M.J. New human and mouse microRNA genes found by homology search. FEBS J. 2004, 272, 59–73. [Google Scholar] [CrossRef]
- Hudson, N.; Reverter, A.; Greenwood, P.; Guo, B.; Cafe, L.M.; Dalrymple, B.P. Longitudinal muscle gene expression patterns associated with differential intramuscular fat in cattle. Animal 2014, 9, 650–659. [Google Scholar] [CrossRef] [Green Version]
- Nardelli, C.; Iaffaldano, L.; Pilone, V.; Labruna, G.; Ferrigno, M.; Carlomagno, N.; Dodaro, C.A.; Forestieri, P.; Buono, P.; Salvatore, F.; et al. Changes in the MicroRNA Profile Observed in the Subcutaneous Adipose Tissue of Obese Patients after Laparoscopic Adjustable Gastric Banding. J. Obes. 2017, 2017, 1–6. [Google Scholar] [CrossRef]
- Higuchi, C.; Nakatsuka, A.; Eguchi, J.; Teshigawara, S.; Kanzaki, M.; Katayama, A.; Yamaguchi, S.; Takahashi, N.; Murakami, K.; Ogawa, D.; et al. Identification of Circulating miR-101, miR-375 and miR-802 as Biomarkers for Type 2 Diabetes. Metabolism 2015, 64, 489–497. [Google Scholar] [CrossRef] [Green Version]
- Soronen, J.; Yki-Jarvinen, H.; Zhou, Y.; Sädevirta, S.; Sarin, A.; Leivonen, M.; Sevastianova, K.; Perttilä, J.; Laurila, P.; Sigruener, A.; et al. Novel hepatic microRNAs upregulated in human nonalcoholic fatty liver disease. Physiol. Rep. 2016, 4, e12661. [Google Scholar] [CrossRef] [PubMed] [Green Version]
- Khan, R.; Raza, S.H.A.; Junjvlieke, Z.; Wang, X.; Wang, H.; Cheng, G.; Mei, C.; Elnour, I.E.; Zan, L. Bta-miR-149-5p inhibits proliferation and differentiation of bovine adipocytes through targeting CRTCs at both transcriptional and posttranscriptional levels. J. Cell. Physiol. 2020, 235, 5796–5810. [Google Scholar] [CrossRef] [PubMed]
- Meng, Y.; Eirin, A.; Zhu, X.-Y.; Tang, H.; Chanana, P.; Lerman, L.O.; Van Wijnen, A.J.; Lerman, L.O. Obesity-induced mitochondrial dysfunction in porcine adipose tissue-derived mesenchymal stem cells. J. Cell. Physiol. 2018, 233, 5926–5936. [Google Scholar] [CrossRef] [PubMed]
- Klöting, N.; Berthold, S.; Kovács, P.; Schön, M.P.; Fasshauer, M.; Ruschke, K.; Stumvoll, M.; Blüher, M. MicroRNA Expression in Human Omental and Subcutaneous Adipose Tissue. PLoS ONE 2009, 4, e4699. [Google Scholar] [CrossRef] [PubMed] [Green Version]
- Cheng, Y.; Mai, J.; Hou, T.; Ping, J. MicroRNA-421 induces hepatic mitochondrial dysfunction in non-alcoholic fatty liver disease mice by inhibiting sirtuin 3. Biochem. Biophys. Res. Commun. 2016, 474, 57–63. [Google Scholar] [CrossRef] [PubMed]
- Tsiloulis, T.; Pike, J.; Powell, D.; Rossello, F.J.; Canny, B.J.; Meex, R.C.R.; Watt, M.J. Impact of endurance exercise training on adipocyte microRNA expression in overweight men. FASEB J. 2016, 31, 161–171. [Google Scholar] [CrossRef] [Green Version]
- Irani, S.; Hussain, M.M. Role of microRNA-30c in lipid metabolism, adipogenesis, cardiac remodeling and cancer. Curr. Opin. Lipidol. 2015, 26, 139–146. [Google Scholar] [CrossRef]
- Karbiener, M.; Neuhold, C.; Opriessnig, P.; Prokesch, A.; Bogner-Strauss, J.G.; Scheideler, M. MicroRNA-30c promotes human adipocyte differentiation and co-repressesPAI-1andALK2. RNA Boil. 2011, 8, 850–860. [Google Scholar] [CrossRef] [Green Version]
- Shi, C.; Huang, F.; Gu, X.; Zhang, M.; Wen, J.; Wang, X.; You, L.; Cui, X.; Ji, C.; Guo, X. Adipogenic miRNA and meta-signature miRNAs involved in human adipocyte differentiation and obesity. Oncotarget 2016, 7, 40830–40845. [Google Scholar] [CrossRef] [Green Version]
- Yi, X.; Liu, J.; Wu, P.; Gong, Y.; Xu, X.; Li, W. The key microRNA on lipid droplet formation during adipogenesis from human mesenchymal stem cells. J. Cell. Physiol. 2019, 235, 328–338. [Google Scholar] [CrossRef]
- Chen, T.; Cui, J.; Ma, L.; Zeng, Y.; Chen, W. The Effect of MicroRNA-331-3p on Preadipocytes Proliferation and Differentiation and Fatty Acid Accumulation in Laiwu Pigs. BioMed Res. Int. 2019, 2019, 9287804-13. [Google Scholar] [CrossRef] [PubMed] [Green Version]
- Zhu, L.; Chen, L.; Shi, C.-M.; Xu, G.-F.; Xu, L.-L.; Zhu, L.-L.; Guo, X.-R.; Ni, Y.; Cui, Y.; Ji, C. MiR-335, an Adipogenesis-Related MicroRNA, is Involved in Adipose Tissue Inflammation. Cell Biophys. 2013, 68, 283–290. [Google Scholar] [CrossRef] [PubMed]
- Qi, R.; Wang, J.; Wang, Q.; Qiu, X.; Yang, F.; Liu, Z.; Huang, J. MicroRNA-425 controls lipogenesis and lipolysis in adipocytes. Biochim. Biophys. Acta (BBA)-Mol. Cell Boil. Lipids 2019, 1864, 744–755. [Google Scholar] [CrossRef] [PubMed]
- Zheng, L.; Lv, G.-C.; Sheng, J.; Yang, Y. Effect of miRNA-10b in regulating cellular steatosis level by targeting PPAR-α expression, a novel mechanism for the pathogenesis of NAFLD. J. Gastroenterol. Hepatol. 2010, 25, 156–163. [Google Scholar] [CrossRef]
- Li, H.; Ma, Z.; Jia, L.; Li, Y.; Xu, C.; Wang, T.; Han, R.; Jiang, R.; Li, Z.; Sun, G.; et al. Systematic analysis of the regulatory functions of microRNAs in chicken hepatic lipid metabolism. Sci. Rep. 2016, 6, 31766. [Google Scholar] [CrossRef] [Green Version]
- Pek, S.L.T.; Sum, C.F.; Lin, M.X.; Cheng, A.K.S.; Wong, M.T.K.; Lim, S.C.; Tavintharan, S. Circulating and visceral adipose miR-100 is down-regulated in patients with obesity and Type 2 diabetes. Mol. Cell. Endocrinol. 2016, 427, 112–123. [Google Scholar] [CrossRef]
- Hu, Y.; Zhang, R.; Zhang, Y.; Li, J.; Grossmann, R.; Zhao, R. In ovo leptin administration affects hepatic lipid metabolism and microRNA expression in newly hatched broiler chickens. J. Anim. Sci. Biotechnol. 2012, 3, 16. [Google Scholar] [CrossRef] [Green Version]
- Chen, C.; Peng, Y.; Peng, J.; Jiang, S. miR-135a-5p inhibits 3T3-L1 adipogenesis through activation of canonical Wnt/ -catenin signaling. J. Mol. Endocrinol. 2014, 52, 311–320. [Google Scholar] [CrossRef] [Green Version]
- Sun, F.; Wang, J.; Pan, Q.; Yu, Y.; Zhang, Y.; Wan, Y.; Wang, J.; Li, X.; Hong, A. Characterization of function and regulation of miR-24-1 and miR-31. Biochem. Biophys. Res. Commun. 2009, 380, 660–665. [Google Scholar] [CrossRef]
- Tang, Y.-F.; Zhang, Y.; Li, X.-Y.; Li, C.; Tian, W.; Liu, L. Expression of miR-31, miR-125b-5p, and miR-326 in the Adipogenic Differentiation Process of Adipose-Derived Stem Cells. OMICS A J. Integr. Boil. 2009, 13, 331–336. [Google Scholar] [CrossRef]
- Monfared, Y.K.; Honardoost, M.; Sarookhani, M.R.; Farzam, S.A. Circulating miR-135 May Serve as a Novel Co-biomarker of HbA1c in Type 2 Diabetes. Appl. Biochem. Biotechnol. 2019, 191, 623–630. [Google Scholar] [CrossRef] [PubMed]
- Machal, J.; Novak, J.; Hezova, R.; Zlamal, F.; Vasku, A.; Slaby, O.; Bienertová-Vašků, J. Polymorphism in miR-31 and miR-584 binding site in the angiotensinogen gene differentially influences body fat distribution in both sexes. Genes Nutr. 2015, 10, 37. [Google Scholar] [CrossRef] [PubMed]
- Xie, H.; Lim, B.; Lodish, H.F. MicroRNAs Induced During Adipogenesis that Accelerate Fat Cell Development Are Downregulated in Obesity. Diabetes 2009, 58, 1050–1057. [Google Scholar] [CrossRef] [Green Version]
- Chen, T.; Yan, N.; Cheng, X.; Ji, X.; Yin, W. MiR-1224-5p enhances hepatic lipogenesis by targeting Adenosine monophosphate activated protein kinase? 1 in male mice. Endocrinology 2018, 159, 2008–2021. [Google Scholar] [CrossRef] [PubMed] [Green Version]
- Ji, J.; Zhang, J.; Huang, G.; Qian, J.; Wang, X.; Mei, S. Over-expressed microRNA-27a and 27b influence fat accumulation and cell proliferation during rat hepatic stellate cell activation. FEBS Lett. 2009, 583, 759–766. [Google Scholar] [CrossRef] [PubMed] [Green Version]
- Jennewein, C.; von Knethen, A.; Schmid, T.; Brüne, B. MicroRNA-27b contributes to lipopolysaccharide-mediated peroxisome proliferator-activated receptor gamma (PPARgamma) mRNA destabilization. J. Biol. Chem. 2010, 285, 11846–11853. [Google Scholar] [CrossRef] [Green Version]
- Niu, Y.; Mo, D.; Qin, L.; Wang, C.; Li, A.; Zhao, X.; Wang, X.; Xiao, S.; Wang, Q.; Xie, Y.; et al. Lipopolysaccharide-induced miR-1224 negatively regulates tumour necrosis factor-α gene expression by modulating Sp1. Immunology 2011, 133, 8–20. [Google Scholar] [CrossRef]
- Cawthorn, W.P.; Sethi, J.K. TNF-alpha and adipocyte biology. FEBS Lett. 2007, 582, 117–131. [Google Scholar] [CrossRef] [Green Version]
- Rosen, E.D.; Sarraf, P.; E Troy, A.; Bradwin, G.; Moore, K.; Milstone, D.S.; Spiegelman, B.M.; Mortensen, R.M. PPARγ Is Required for the Differentiation of Adipose Tissue In Vivo and In Vitro. Mol. Cell 1999, 4, 611–617. [Google Scholar] [CrossRef]
- Ma, X.; Wang, N.; Zhao, W.; Xu, L. Deciphering the Roles of PPARγ in Adipocytes via Dynamic Change of Transcription Complex. Front. Endocrinol. 2018, 9, 473. [Google Scholar] [CrossRef] [Green Version]
- Ogunyemi, D.; Xu, J.; Mahesan, A.M.; Rad, S.; Kim, E.; Yano, J.; Alexander, C.; Rotter, J.I.; Chen, Y.-D.I. Differentially expressed genes in adipocytokine signaling pathway of adipose tissue in pregnancy. J. Diabetes Mellit. 2013, 3, 86–95. [Google Scholar] [CrossRef] [PubMed] [Green Version]
- Tilg, H.; Moschen, A.R. Adipocytokines: Mediators linking adipose tissue, inflammation and immunity. Nat. Rev. Immunol. 2006, 6, 772–783. [Google Scholar] [CrossRef] [PubMed]


| Upregulated miRNAs | FC | p-Value | Corr. p-Value |
| bta-let-7a-5p | 1.36 | 0.001 | 0.017 |
| bta-mir-10b-5p | 1.35 | 0.007 | 0.02 |
| bta-mir-100-5p | 1.32 | 0.003 | 0.014 |
| bta-mir-101-5p | 1.48 | 0.006 | 0.02 |
| bta-mir-105a/b | 1.39 | 0.004 | 0.018 |
| bta-mir-135a-5p | 1.31 | 0.045 | 0.045 |
| bta-mir-1193 | 1.33 | 0.013 | 0.024 |
| bta-mir-1224-5p | 1.26 | 0.009 | 0.02 |
| bta-mir-1282 | 1.38 | 0.022 | 0.034 |
| bta-mir-1284 | 1.31 | 0.029 | 0.036 |
| bta-mir-1287-5p | 1.20 | 0.0301 | 0.036 |
| hsa-mir-27b | 1.27 | 0.023 | 0.033 |
| hsa-mir-30c-5p | 1.24 | 0.027 | 0.036 |
| hsa-mir-31-5p | 1.36 | 0.044 | 0.045 |
| hsa-mir-149-5p | 1.34 | 0.008 | 0.02 |
| hsa-mir-331-3p | 1.21 | 0.035 | 0.04 |
| hsa-mir-504-5p | 1.3 | 0.021 | 0.032 |
| hsa-mir-548a-3p | 1.27 | 0.028 | 0.036 |
| hsa-mir-874-3p | 1.21 | 0.036 | 0.04 |
| hsa-mir-3128 | 1.30 | 0.005 | 0.018 |
| hsa-mir-3178 | 1.21 | 0.014 | 0.023 |
| hsa-mir-3910 | 1.40 | 0.01 | 0.02 |
| hsa-mir-4443 | 1.22 | 0.008 | 0.019 |
| hsa-mir-4445-5p | 1.47 | 0.021 | 0.033 |
| hsa-mir-4745-5p | 1.32 | 0.043 | 0.045 |
| mmu-mir-30c-5p | 1.21 | 0.029 | 0.037 |
| mmu-mir-31-5p | 1.44 | 0.004 | 0.017 |
| mmu-mir-132-3p | 1.22 | 0.032 | 0.037 |
| mmu-mir-149-5p | 1.45 | 0.008 | 0.018 |
| mmu-mir-335-5p | 1.35 | 0.008 | 0.017 |
| mmu-mir-421-3p | 1.25 | 0.024 | 0.033 |
| mmu-mir-425-5p | 1.26 | 0.042 | 0.045 |
| mmu-mir-695 | 1.41 | 0.002 | 0.012 |
| Downregulated miRNAs | FC | p-Value | Corr. p-Value |
| bta-let-7e-5p | −1.30 | 0.0014 | 0.015 |
| bta-let-7f-5p | −1.52 | 0.002 | 0.011 |
| hsa-mir-877-5p | −1.30 | 0.0139 | 0.024 |
| hsa-mir-4487 | −1.30 | 0.00004 | 0.001 |
| hsa-mir-4706 | −1.35 | 0.000006 | 0.0001 |
| Upregulated DE miRNA | Count | PredictedDownregulated DEGTargets |
| miR-1224-5p | 16 | ATXN7L1, GPD2, IL4R, PROX1, SLC43A2, BACH2, GNAS, RAD50, SMARCAD1, TAP2, CDC40, SESN1, ART3, PPDPFL, C2H2orf88, TBXAS1 |
| miR-1287-5p | 16 | ATXN7L1, GPD2, IL4R, PROX1, SLC43A2, BACH2, GNAS, RAD50, SMARCAD1, TAP2, CDC40, ART3, PPDPFL, C2H2orf88, TBXAS1, FRAT2 |
| miR-31-5p | 15 | ATXN7L1, GPD2, IL4R, PROX1, SLC43A2, BACH2, GNAS, RAD50, SMARCAD1, TAP2, CDC40, SESN1, ART3, PPDPFL, TBXAS1 |
| miR-149-5p | 15 | ATXN7L1, GPD2, IL4R, PROX1, SLC43A2, GNAS, RAD50, SMARCAD1, TAP2, CDC40, SESN1, ART3, PPDPFL, C2H2orf88, FRAT2 |
| miR-331-3p | 15 | ATXN7L1, GPD2, IL4R, PROX1, SLC43A2, BACH2, GNAS, RAD50, SMARCAD1, TAP2, SESN1, ART3, PPDPFL, C2H2orf88, CETN3 |
| miR-874-3p | 15 | ATXN7L1, GPD2, IL4R, PROX1, SLC43A2, BACH2, GNAS, SMARCAD1, CDC40, SESN1, ART3, PPDPFL, C2H2orf88, TBXAS1, CETN3 |
| Let-7b | 14 | ATXN7L1, GPD2, IL4R, PROX1, SLC43A2, BACH2, GNAS, RAD50, SMARCAD1, TAP2, CDC40, SESN1, ART3, TBXAS1 |
| miR-425-5p | 14 | ATXN7L1, GPD2, IL4R, PROX1, SLC43A2, BACH2, GNAS, RAD50, SMARCAD1, TAP2, CDC40, SESN1, PPDPFL, C2H2orf88 |
| miR-1284 | 13 | ATXN7L1, GPD2, IL4R, PROX1, SLC43A2, BACH2, RAD50, TAP2, CDC40, SESN1, ART3, CETN3, FRAT2 |
| miR-1282 | 12 | ATXN7L1, GPD2, IL4R, PROX1, SLC43A2, BACH2, GNAS, RAD50, SMARCAD1, CDC40, SESN1, PPDPFL |
| miR-504-5p | 12 | ATXN7L1, GPD2, IL4R, PROX1, SLC43A2, BACH2, GNAS, RAD50, SMARCAD1, TAP2, PPDPFL, TBXAS1 |
| miR-105a | 9 | ART3, BACH2, BACH2, CDC40, GNAS, GPD2, GPD2, IL4R, TBXAS1 |
| miR-105b | 9 | BACH2, PPDPFL, GNAS, GPD2, GPD2, IL4R, PROX1, RAD50, SLC43A2 |
| miR-27b-3p | 8 | BACH2, CETN3, IL4R, SESN1, RAD50, SMARCAD1, TAP2, FRAT2 |
| miR-132-3p | 8 | SLC43A2, BACH2, CDC40, FRAT2, GNAS, GNAS, SESN1, SESN1 |
| miR-100-5p | 6 | CDC40, GPD2, SESN1, SLC43A2, SMARCAD1, CETN3 |
| miR-10b-5p | 6 | ATXN7L1, GPD2, IL4R, RAD50, SLC43A2, TAP2 |
| miR-1193 | 6 | BACH2, BACH2, GPD2, IL4R, PROX1, TBXAS1 |
| miR-421-3p | 3 | GPD2, RAD50, SLC43A2 |
| Downregulated DE miRNA | Count | PredictedUpregulated DEGTargets |
| bta-let-7e-5p | 8 | ACLY, AGRN, CIDEC, THRSP, MRAS, SCD, INSIG1, MGST1 |
| bta-miR-877-5p | 7 | ACLY, AGRN, CIDEC, THRSP, MRAS, SCD, INSIG1 |
| Category | Term | Count | % | p-Value | Fold Enrichment | FDR |
|---|---|---|---|---|---|---|
| GOTERM_BP_FAT | GO:0042127~regulation of cell proliferation | 154 | 12.09741 | 7.95 × 10⁻²² | 2.204126802 | 1.49 × 10⁻¹⁸ |
| GOTERM_BP_FAT | GO:0006631~fatty acid metabolic process | 43 | 3.377848 | 7.30 × 10⁻⁸ | 2.446210649 | 1.37 × 10⁻⁴ |
| GOTERM_BP_FAT | GO:0019216~regulation of lipid metabolic process | 35 | 2.749411 | 7.02 × 10⁻¹¹ | 3.519983347 | 1.32 × 10⁻⁷ |
| GOTERM_BP_FAT | GO:0008203~cholesterol metabolic process | 29 | 2.278083 | 3.13 × 10⁻⁹ | 3.550591898 | 5.86 × 10⁻⁶ |
| GOTERM_CC_FAT | GO:0000267~cell fraction | 179 | 14.06127 | 2.80 × 10⁻²² | 2.06715238 | 4.09 × 10⁻¹⁹ |
| GOTERM_CC_FAT | GO:0005792~microsome | 47 | 3.692066 | 1.22 × 10⁻⁸ | 2.480261257 | 1.79 × 10⁻⁵ |
| GOTERM_CC_FAT | GO:0043235~receptor complex | 34 | 2.670856 | 5.61 × 10⁻¹¹ | 3.665800661 | 8.20 × 10⁻⁸ |
| GOTERM_CC_FAT | GO:0032994~protein-lipid complex | 10 | 0.785546 | 0.001348 | 3.573385519 | 1.952788 |
| GOTERM_MF_FAT | GO:0005125~cytokine activity | 55 | 4.320503 | 2.43 × 10⁻¹⁴ | 3.129804953 | 4.04 × 10⁻¹¹ |
| GOTERM_MF_FAT | GO:0003707~steroid hormone receptor activity | 21 | 1.649647 | 2.33 × 10⁻⁹ | 4.755677656 | 3.87 × 10⁻⁶ |
| GOTERM_MF_FAT | GO:0008289~lipid binding | 69 | 5.420267 | 1.34 × 10⁻⁵ | 1.701475783 | 0.022292 |
| GOTERM_MF_FAT | GO:0008134~transcription factor binding | 84 | 6.598586 | 7.99 × 10⁻⁸ | 1.816984056 | 1.33 × 10⁻⁴ |
| Category | Term | Count | % | p-Value | Fold Enrichment | FDR |
|---|---|---|---|---|---|---|
| KEGG_PATHWAY | hsa04060:Cytokine-cytokine receptor interaction | 86 | 6.755695 | 1.72 × 10⁻¹¹ | 2.025634 | 2.13 × 10⁻⁸ |
| KEGG_PATHWAY | hsa00562:Inositol phosphate metabolism | 23 | 1.806756 | 1.31 × 10⁻⁵ | 2.628439 | 0.016234 |
| KEGG_PATHWAY | hsa03320:PPAR signaling pathway | 25 | 1.963865 | 1.14 × 10⁻⁴ | 2.235912 | 0.141802 |
| KEGG_PATHWAY | hsa00071:Fatty acid metabolism | 17 | 1.335428 | 2.57 × 10⁻⁴ | 2.622725 | 0.317883 |
| KEGG_PATHWAY | hsa04930:Type II diabetes mellitus | 17 | 1.335428 | 0.002012 | 2.232106 | 2.465567 |
| KEGG_PATHWAY | hsa00561:Glycerolipid metabolism | 15 | 1.178319 | 0.009253 | 2.057039 | 10.88421 |
| KEGG_PATHWAY | hsa00830:Retinol metabolism | 17 | 1.335428 | 0.00932 | 1.942759 | 10.95931 |
| KEGG_PATHWAY | hsa04920:Adipocytokine signaling pathway | 17 | 1.335428 | 0.06505 | 1.565806 | 56.55956 |
© 2020 by the authors. Licensee MDPI, Basel, Switzerland. This article is an open access article distributed under the terms and conditions of the Creative Commons Attribution (CC BY) license (http://creativecommons.org/licenses/by/4.0/).
Share and Cite
Mir, B.A.; Reyer, H.; Komolka, K.; Ponsuksili, S.; Kühn, C.; Maak, S. Differentially Expressed miRNA-Gene Targets Related to Intramuscular Fat in Musculus Longissimus Dorsi of Charolais × Holstein F2-Crossbred Bulls. Genes 2020, 11, 700. https://0-doi-org.brum.beds.ac.uk/10.3390/genes11060700
Mir BA, Reyer H, Komolka K, Ponsuksili S, Kühn C, Maak S. Differentially Expressed miRNA-Gene Targets Related to Intramuscular Fat in Musculus Longissimus Dorsi of Charolais × Holstein F2-Crossbred Bulls. Genes. 2020; 11(6):700. https://0-doi-org.brum.beds.ac.uk/10.3390/genes11060700
Chicago/Turabian StyleMir, Bilal Ahmad, Henry Reyer, Katrin Komolka, Siriluck Ponsuksili, Christa Kühn, and Steffen Maak. 2020. "Differentially Expressed miRNA-Gene Targets Related to Intramuscular Fat in Musculus Longissimus Dorsi of Charolais × Holstein F2-Crossbred Bulls" Genes 11, no. 6: 700. https://0-doi-org.brum.beds.ac.uk/10.3390/genes11060700