Article

Cortical Granule Distribution and Expression Pattern of Genes Regulating Cellular Component Size, Morphogenesis, and Potential to Differentiation are Related to Oocyte Developmental Competence and Maturational Capacity In Vivo and In Vitro

by
Magdalena Kulus
1,
Wiesława Kranc
2,
Michal Jeseta
3,4,
Patrycja Sujka-Kordowska
5,6,
Aneta Konwerska
5,
Sylwia Ciesiółka
5,
Piotr Celichowski
5,
Lisa Moncrieff
5,7,
Ievgeniia Kocherova
2,
Małgorzata Józkowiak
8,
Jakub Kulus
9,
Maria Wieczorkiewicz
10,
Hanna Piotrowska-Kempisty
8,
Mariusz T. Skowroński
10,
Dorota Bukowska
9,
Marie Machatkova
11,
Sarka Hanulakova
11,
Paul Mozdziak
12,
Jędrzej M. Jaśkowski
9,
Bartosz Kempisty
1,2,3,5,* and
Paweł Antosik
1
add Show full author list remove Hide full author list
1
Department of Veterinary Surgery, Institute of Veterinary Medicine, Nicolaus Copernicus University in Torun, 87-100 Torun, Poland
2
Department of Anatomy, Poznan University of Medical Sciences, 60-781 Poznan, Poland
3
Department of Obstetrics and Gynecology, University Hospital and Masaryk University, 602 00 Brno, Czech Republic
4
Department of Veterinary Sciences, Czech University of Life Sciences in Prague, 165 00 Prague, Czech Republic
5
Department of Histology and Embryology, Poznan University of Medical Sciences, 60-781 Poznan, Poland
6
Department of Anatomy and Histology, University of Zielona Gora, 65-046 Zielona Gora, Poland
7
School of Medicine, Medical Sciences and Nutrition, University of Aberdeen, Aberdeen AB25 2ZD, UK
8
Department of Toxicology, Poznan University of Medical Sciences, 60-631 Poznan, Poland
9
Department of Diagnostics and Clinical Sciences, Institute of Veterinary Medicine, Nicolaus Copernicus University in Torun, 87-100 Torun, Poland
10
Department of Basic and Preclinical Sciences, Institute of Veterinary Medicine, Nicolaus Copernicus University in Torun, 87-100 Torun, Poland
11
Veterinary Research Institute, 621 00 Brno, Czech Republic
12
Prestage Department of Poultry Science, North Carolina State University, Raleigh, NC 27695, USA
*
Author to whom correspondence should be addressed.
Submission received: 13 June 2020 / Revised: 10 July 2020 / Accepted: 13 July 2020 / Published: 17 July 2020
(This article belongs to the Special Issue Genomic Studies in the Mammalian Reproductive Tract)

Abstract

:
Polyspermia is an adverse phenomenon during mammalian fertilization when more than one sperm fuses with a single oocyte. The egg cell is prepared to prevent polyspermia by, among other ways, producing cortical granules (CGs), which are specialized intracellular structures containing enzymes that aim to harden the zona pellucida and block the fusion of subsequent sperm. This work focused on exploring the expression profile of genes that may be associated with cortical reactions, and evaluated the distribution of CGs in immature oocytes and the peripheral density of CGs in mature oocytes. Oocytes were isolated and then processed for in vitro maturation (IVM). Transcriptomic analysis of genes belonging to five ontological groups has been conducted. Six genes showed increased expression after IVM (ARHGEF2, MAP1B, CXCL12, FN1, DAB2, and SOX9), while the majority of genes decreased expression after IVM. Using CG distribution analysis in immature oocytes, movement towards the cortical zone of the oocyte during meiotic competence acquisition was observed. CGs peripheral density decreased with the rise in meiotic competence during the IVM process. The current results reveal important new insights into the in vitro maturation of oocytes. Our results may serve as a basis for further studies to investigate the cortical reaction of oocytes.

1. Introduction

Knowledge of molecular mechanisms that protect oocytes against polyspermia is important both in basic research and in the future of human medicine, as well as to improve the efficiency of in vitro production (IVP) in animals. It is known that there are two mechanisms that prevent more than one sperm from entering the oocyte [1]. The first barrier works at the level of the plasma membrane of the oocyte, which is depolarized after sperm fusion and excretion of the egg’s sperm receptor Folr4 (folate receptor 4, also known as Juno) [2]. The second mechanism under consideration is the “cortical reaction”, which consists of exocytosis of cortical granules (CGs) containing enzymes (e.g., ovastacin [3]) that harden the zona pellucida, which reduces the affinity to connect with subsequent sperm [4]. The cortical reaction itself is a well-known phenomenon, but its molecular background is not fully explained. So far, there have been reports related to the transport of CGs from the cytoplasmic center to the periphery of the cell [5,6], docking to the plasma membrane [6] or resulting in exocytosis of CGs [7,8,9], but not fully illustrating these processes. Therefore, it is very significant to know the expression profile of the genes involved in the cortical reaction, which, in turn, will expand the possibilities of detailed research.
It is generally accepted that frequent abnormal development of in-vitro-produced porcine embryos and early embryonic mortality are often caused by polyspermic penetration. Previous studies described the relationship of higher occurrence of polyspermic penetration with lower meiotic competence, which is characteristic of oocytes of prepubertal gilts [10,11]. Machatkova et al. stated that meiotic and developmental competence is an ability of oocytes to undertake resumption and successful termination of meiosis and is acquired gradually with follicle growth and completed during maturation. This implies that satisfactory levels of meiotic and developmental competence can be achieved only after the onset of the oestrous cycle [12].
Due to the requirements for large numbers of oocytes, prepubertal gilts represent the prevailing source of experimental porcine oocytes. Oocytes of prepubertal gilts before the onset of oestrus do not reach the optimal developmental competence, which results in higher polyspermy rate and significantly lower blastocyst yield than in adult sows, despite there being no differences in nuclear maturation [13,14]. The majority of juvenile oocytes from prepubertal gilts are smaller than 3 mm in diameter, and these were proved to be cytoplasmatically deficient, and their ability to finish maturation may be limited [15].
Knowledge of the mechanism of oocyte development during folliculogenesis and its effect on developmental potential of the oocyte is an essential prerequisite for improvement of in vitro fertilization (IVF) and in vitro production (IVP) systems. Low monospermic penetration rate and high rate of polyspermy are still the main unsolved problems in porcine embryo production [16]. Although in vitro maturation (IVM) porcine oocytes are successfully cultured up to the blastocyst stage, a high polyspermy rate, often reaching more than 50%, is still an obstacle despite the fact that the oocytes have their own mechanisms for blocking polyspermic penetration [16]. The major role in prevention of polyspermy is played by cortical granules. CGs are secretory vesicles present only in female germ cells. In mammals, they range in size from 0.2 to 0.6 µm in diameter [17] and are formed continuously from the early stages of oocyte growth. During follicular development and maturation, they translocate from throughout the ooplasm to the cortex up until the time of ovulation. Migration of CGs depends on the functioning cytoskeleton and is considered to be a criterion of successful cytoplasmic maturation, which is characterized, among several factors, by redistribution of organelles [18]. Migration of CGs is a preparatory phase for triggering a cortical reaction, which is a calcium-dependent exocytotic process started by sperm–oocyte fusion [19]. This binding activates a range of signaling pathways leading to release of the cortical granules’ content to the perivitelline space. It initiates structural and biochemical modifications of zona pellucida to form the impermeable barrier [20].
The function of CGs was long believed to start and finish by exocytosis of their contents at the moment of oocyte penetration. However, in some recent studies, authors reported that some CGs undergo exocytosis prior to fertilization, and some cortical granules components function beyond the time of fertilization in regulation of embryonic cleavage and preimplantation development [17].
The process of the oocyte acquiring maturity is highly advanced and requires the involvement of many genes that directly or indirectly influence the achievement of MII stage. The molecular background during the reorganization of intracellular structures in the maturing oocyte has not been well known. Further research is needed to establish the thorough mechanisms regulating these processes.
The objective of the study was to further understand the expression of genes related to morphogenesis before and after in vitro maturation of swine oocytes to better define gene pathways involved in maturation. Furthermore, the aim was to better understand the distribution and density of CGs in porcine oocytes in regard to meiotic competency for IVM porcine oocytes.

2. Materials and Methods

All chemicals used in the present study were purchased from Sigma-Aldrich Chemicals Co. (Prague, Czech Republic) unless otherwise stated.

2.1. Animals, Oocyte Collection, and Selection

Ovaries from adult cycling sows were obtained from an experimental slaughterhouse and transported to the laboratory within 2 h at 31–33 °C. The average age of the animals was 40 months and they were derived from crossbred Landrace X Czech Large White. The ovaries of each donor were evaluated and only those with proper morphologic status (presence of ovarian follicles of different sizes) were used. Ovaries were assessed according to morphology of follicles and presence of corpora lutea.
Oocytes with higher meiotic competence from medium follicles (MF)—5–9 mm and with lower meiotic competence from follicles smaller than 5 mm (SF)—were collected from ovaries by follicle aspiration and cutting of the ovarian cortex, respectively. Oocytes from larger follicles (≥10 mm) were not included in the study. All healthy cumulus–oocyte complexes with dark, evenly granulated ooplasm and at least two cumulus layers were used for the experiments.
The Brilliant Cresyl Blue (BCB) staining assay was performed for assessment of porcine oocytes’ quality and maturity and for selection of oocytes for later tests. The enzyme glucose-6-phosphate converts the BCB stain from blue to colourless. In oocytes that completed the growth, activity of the enzyme decreases, and the stain cannot be reduced, resulting in blue oocytes (BCB+). Oocytes were rinsed twice with modified Dulbecco PBS (DPBS) (Sigma-Aldrich, St. Louis, MO, USA) supplemented with 50 μg/mL streptomycin, 50 IU/mL penicillin (Sigma-Aldrich, St. Louis, MO, USA), 0.4% BSA (w/v), 0.34 mM pyruvate, and 5.5 mM glucose (DPBSm). They were then treated with 13 μM BCB (Sigma-Aldrich, St. Louis, MO, USA) diluted in DPBSm at 38.5 °C and 5% CO2 for 90 min. Then, the oocytes were transferred to DPBSm and washed twice. During the washing procedure, oocytes were examined under inverted microscope and classified as blue stained (BCB+) or colorless (BCB−). Only BCB+ oocytes were used in molecular analyses (“Before IVM” group) or IVM followed by second BCB test and molecular analyses (“After IVM” group).

2.2. Oocytes Maturation and Examination

Isolated cumulus–oocyte complexes that were not used for examination at germinal vesicle (GV) stage were matured in groups of 25–30 in 500 µL of M199 medium (with Earle’s salts), supplemented with 0.20 mM sodium pyruvate, 0.57 mM cysteamine, 50 IU mL−1 penicillin, 50 µg mL−1 streptomycin, 10% BFS (bovine fetal serum), and gonadotropins (P.G.600 15 IU mL−1, Intervet, Holland) in a four-well multidish (Nunc, Intermed, Denmark) for 44 h at 39 °C in a humidified atmosphere of 5% CO2. The mean maturation rate was 85%. Only oocytes with verified MII stage represented matured oocytes in the experiment. Oocytes in germinal vesicle stage and mature oocytes were manually denuded of cumulus cells in IVM culture medium with 0.1% (w/v) hyaluronidase (Sigma Aldrich). After washing, the oocytes were fixed in 3.7% paraformaldehyde for 60 min at room temperature. They were washed in PBS and mounted on glass slides, avoiding oocyte compression, using Vectashield medium (Vector Lab, Burlingame, CA, USA) containing 1 μM of DNA dye (SYTOX Orange, Invitrogen; Carlsbad, CA, USA) specific for dyeing of chromatin. The slides were stored below 0 °C until examination. The oocytes were examined with the use of a laser scanning confocal microscope (Leica TCS SP2 AOBS; Leica, Heidelberg, Germany) equipped with argon and helium–neon lasers. The 532 nm excitation band and 550–590 nm detector were used for detection of chromatin. The 40× Leica HCX PL APO CS objective, pinhole, offsets, gain, and Acousto-Optical Beam Splitter (AOBS) were adapted.

2.3. Cortical Granule Staining and Evaluation of Their Distribution

The methods for staining CGs were based on those reported by Yoshida et al. [21] and Wang et al. [22] with a few modifications. Immature and in-vitro-matured oocytes were denuded of cumulus cells by vortex. Experimental groups of oocytes were washed three times in PBS containing 0.4% BSA and then fixed with 3.7% paraformaldehyde for 1 h at room temperature, followed by three washes in PBS containing 0.4% BSA for 10 min each. This procedure was followed by treatment with 1% Triton X-100 for 1 h and washing three times in PBS containing 0.4% BSA for 10 min each time. Oocytes were then cultured in 10 μg/mL fluorescein isothiocyanate (FITC)-labelled Peanut Agglutinin (PNA) in PBS for 30 min in a dark box. After staining, the immature oocytes were washed three times in PBS containing 0.4% BSA for 10 min. In-vitro-matured oocytes were washed three times in PBS containing 0.4% BSA for 2 min. Nuclear status of oocytes was visualized by staining of the oocytes using Vectashield medium (Vector Lab, Burlingame, CA, USA) containing 1 μM of DNA dye (SYTOX Orange, Invitrogen). Finally, the oocytes were mounted on slides with teflon anticompression layer and observed under a laser scanning confocal microscope (Leica TCS SP2 AOBS; Leica, Heidelberg, Germany) equipped with an argon ion laser for visualization of cortical granules via excitation of FITC and a helium–neon laser for excitation of Sytox Orange visualizing DNA. The 40× Leica HCX PL APO CS objective, pinhole, offsets, gain, and AOBS were adjusted. These parameters were maintained throughout the whole experiment. The oocytes were scanned in equatorial optical sections and microphotographs were saved and processed using the NIS-ELEMENTS AR 3.0 software (Laboratory Imaging, Prague, Czech Republic). A total of 185 immature oocytes were evaluated for CGs distribution. Two parts in each optical section of oocyte were measured—the central area, which occupied 80%, and the peripheral area, which occupied 20% of the optical section. The movement of CGs was assessed with the index of cortical granules distribution (Icgd). The Index of CGs distribution represents the ratio between mean intensity signal in the peripheral part of oocyte and the mean intensity signal in the central part of oocyte. In matured oocytes (n = 197) all CGs were localized in the peripheral area. The density of CGs from each optical section, scanned at the apical pole of each oocyte, was counted at three different areas on each optical section. Number of CGs/100 µm2 in each oocyte was counted.
Microphotographs of CGs distribution from confocal microscopy were saved and processed using the NIS-ELEMENTS AR 3.0 software (Laboratory Imaging, Prague, Czech Republic). The values of Icgd and density of cortical granules were statistically analyzed by the independent samples t-test using STATISTICA CZ, version 10 software (StatSoft, Inc., Prague, Czech Republic). Differences with p < 0.05 were considered as statistically significant.

2.4. Histological Examination

For histological purposes, ovaries from five animals were collected. Immediately after collection, samples were fixed in the Bouin’s solution for 48 h. Consequently, ovaries were dehydrated with increasing concentrations of ethyl alcohol and xylen and then embedded in paraffin blocks. Subsequently, they were cut into 3–4 μm thick sections with a semiautomatic rotary microtome (Leica RM 2145, Leica Microsystems, Nussloch, Germany). All ovary sections were stained with a routine hematoxylin and eosin (H&E) staining method following the protocol: deparaffinization and rehydration, staining with H&E, and dehydration. Histological sections were evaluated by light microscope and selected pictures were taken with a use of high-resolution scanning technique and Mirax Midi BF/FL microscope scanner (Carl Zeiss MicroImaging GmbH, Göttingen, Germany).

2.5. RNA Isolation

The oocyte samples were divided into two groups. The first group contained pooled oocytes (SF and MF) before IVM, the second group included pooled oocytes (SF and MF) after IVM. Each group was combined into three independent samples representing separate experimental groups. Total RNA was extracted from the samples with RNeasy MinElute Kit Cleanup (Qiagen, Hilden, Germany) and TRI Reagent® (Sigma, St. Louis, MO, USA). The obtained amount of total mRNA was measured using the optical density at 260 nm, and the purity of RNA from the absorption ratio 260/280 nm (above 1.8) (NanoDrop spectrophotometer, Thermo Scientific, ALAB, Waltham, MA, USA). RNA quality was determined with the use of Bioanalyzer 2100 (Agilent Technologies, Inc., Santa Clara, CA, USA). Obtained RNA integrity (RIN) ranged from 8.5 to 10 with an average of 9.2 (Agilent Technologies, Inc., Santa Clara, CA, USA). RNA was diluted to a 100 ng/L concentration with an OD260/OD280 ratio of 1.8/2.0. Each sample was separated and secured for further analysis; only 100 ng was used for microarray assays. The remaining RNA was used for RT-qPCR analysis.

2.6. Microarray Expression Analysis and Statistics

All the experiments were carried out in triplicate [23,24]. Total RNA (100 ng) from each pooled sample was subjected to two-round sense cDNA amplification (Ambion® WT Expression Kit, Thermo Fisher Scientific, Inc., Waltham, MA, USA). The cDNA was used for biotin labeling and fragmentation by Affymetrix GeneChip® WT Terminal Labeling and Hybridization (Affymetrix, Thermo Fisher Scientific, Santa Clara, CA, USA). Biotin-labeled fragments of cDNA (5.5 μg) were hybridized to Affymetrix® Porcine Gene 1.1 ST Array Strip (48 °C/20 h). Then, microarrays were washed and stained according to the technical protocol, using Affymetrix GeneAtlas Fluidics Station (Affymetrix, Thermo Fisher Scientific, Santa Clara, CA, USA). The array strips were scanned employing Imaging Station of GeneAtlas System (Affymetrix, Thermo Fisher Scientific, Santa Clara, CA, USA). The preliminary analysis of the scanned chips was performed using Affymetrix GeneAtlasTM Operating Software (version 2.0.0.460; Affymetrix; Thermo Fisher Scientific, Inc. Waltham, MA, USA). Quality of gene expression data was checked according to quality control criteria provided by the software. Obtained CEL files were imported into downstream data analysis software [25,26,27].
All analyses were performed using BioConductor software (open source project; version 3.11; http://www.bioconductor.org/), based on the statistical R (version 3.5.1; www.r-project.org) programming language. For background correction, normalization and summation of raw data, the Robust Multiarray Averaging (RMA) algorithm implemented in “affy” package of BioConductor (open source project; version 3.11; http://www.bioconductor.org/) was applied. Biological annotation was taken from BioConductor “oligo” package where annotated data frame object was merged with normalized data set, leading to a complete gene data table. Statistical significance of analyzed genes was performed by moderated t-statistics from the empirical Bayes method. Obtained p values were corrected for multiple comparisons using Benjamini and Hochberg’s false discovery rate. The selection of significantly changed gene expression was based on p value beneath 0.05 and expression fold higher than |2|.
Functional annotation clustering of differentially expressed genes was performed using DAVID (Database for Annotation, Visualization and Integrated Discovery) (open source project; version 6.8; DAVID, https://david.ncifcrf.gov/). Gene symbols for up- or downregulated genes from each of the compared groups were loaded to DAVID by “RDAVIDWebService” BioConductor package (open source project; version 3.11; http://www.bioconductor.org/). For further analysis, we chose the enriched GO terms that had at least five genes and p-value (Benjamini) lower than 0.05. The enriched GO terms were subjected to the hierarchical clusterization algorithm and presented as heat maps.
Subsequently, we analyzed the relationship between the genes belonging to chosen GO terms with the GOplot 1.0.2 package (open source project; https://wencke.github.io/) [28]. The GoPlot package calculated the Z-score: the number of upregulated genes minus the number of downregulated genes divided by the square root of the count. This information allowed estimating the change course of each gene ontology term.
Interactions between differentially expressed genes/proteins belonging to an ontology group were investigated by STRING10 software (Search Tool for the Retrieval of Interacting Genes) (open source project; https://string-db.org/). A list of gene names was used as query for interaction prediction. Searching criteria were based on co-occurrences of genes/proteins in scientific texts (text mining), coexpression, and experimentally observed interactions. The results of such analysis generated a gene–protein interaction network where the intensity of the edges reflects the strength of the interaction score. Besides interaction prediction, STRING also allowed us to perform functional enrichments of GO terms based on previously uploaded gene sets.
Finally, the functional interaction between genes that belong to the chosen GO BP terms were investigated by REACTOME FIViz application to the Cytoscape 3.6.0 software (https://cytoscape.org/). The Reactome FIViz (open source project; https://reactome.org/tools/reactome-fiviz) app is designed to find pathways and network patterns related to cancer and other types of diseases. This app accesses the pathways stored in the Reactome database, allowing pathway enrichment analysis for a set of genes, visualizing hit pathways using manually laid-out pathway diagrams directly in Cytoscape 3.6.0 software (open source project; https://cytoscape.org/), and then investigating functional relationships among genes in hit pathways. The app can also access the Reactome Functional Interaction (FI) network, a highly reliable, manually curated, pathway-based protein functional interaction network covering over 60% of human proteins.

2.7. Quantitative Analysis of Polymerase Chain Reaction in Real Time (RT-qPCR) Analysis

For RT-qPCR, total RNA isolated earlier from oocytes groups before and/or after IVM was used. RNA samples were resuspended in 20 μL of RNase-free water and stored in a −80 °C freezer. RNA samples were treated with DNase I and reverse transcribed (RT) into cDNA. RT-qPCR was performed in a real-time LightCycler PCR detection system (Roche Diagnostics GmbH, Mannheim, Germany) using SYBRR Green I as a detection dye, with target cDNA quantified using a relative quantification method [29]. The relative abundance of all tested genes transcripts in each sample was normalized to internal standards (PBGD, β-actin, 18S rRNA). For amplification, 2 μL of diluted cDNA was added to 18 μL PCR QuantiTectR SYBRR Green PCR (Master Mix Qiagen GmbH, Hilden, Germany) and primers (Table A1, see the Appendix A). To provide a negative control for subsequent PCR, one RNA sample from each preparation was analyzed without an RT reaction.

3. Results

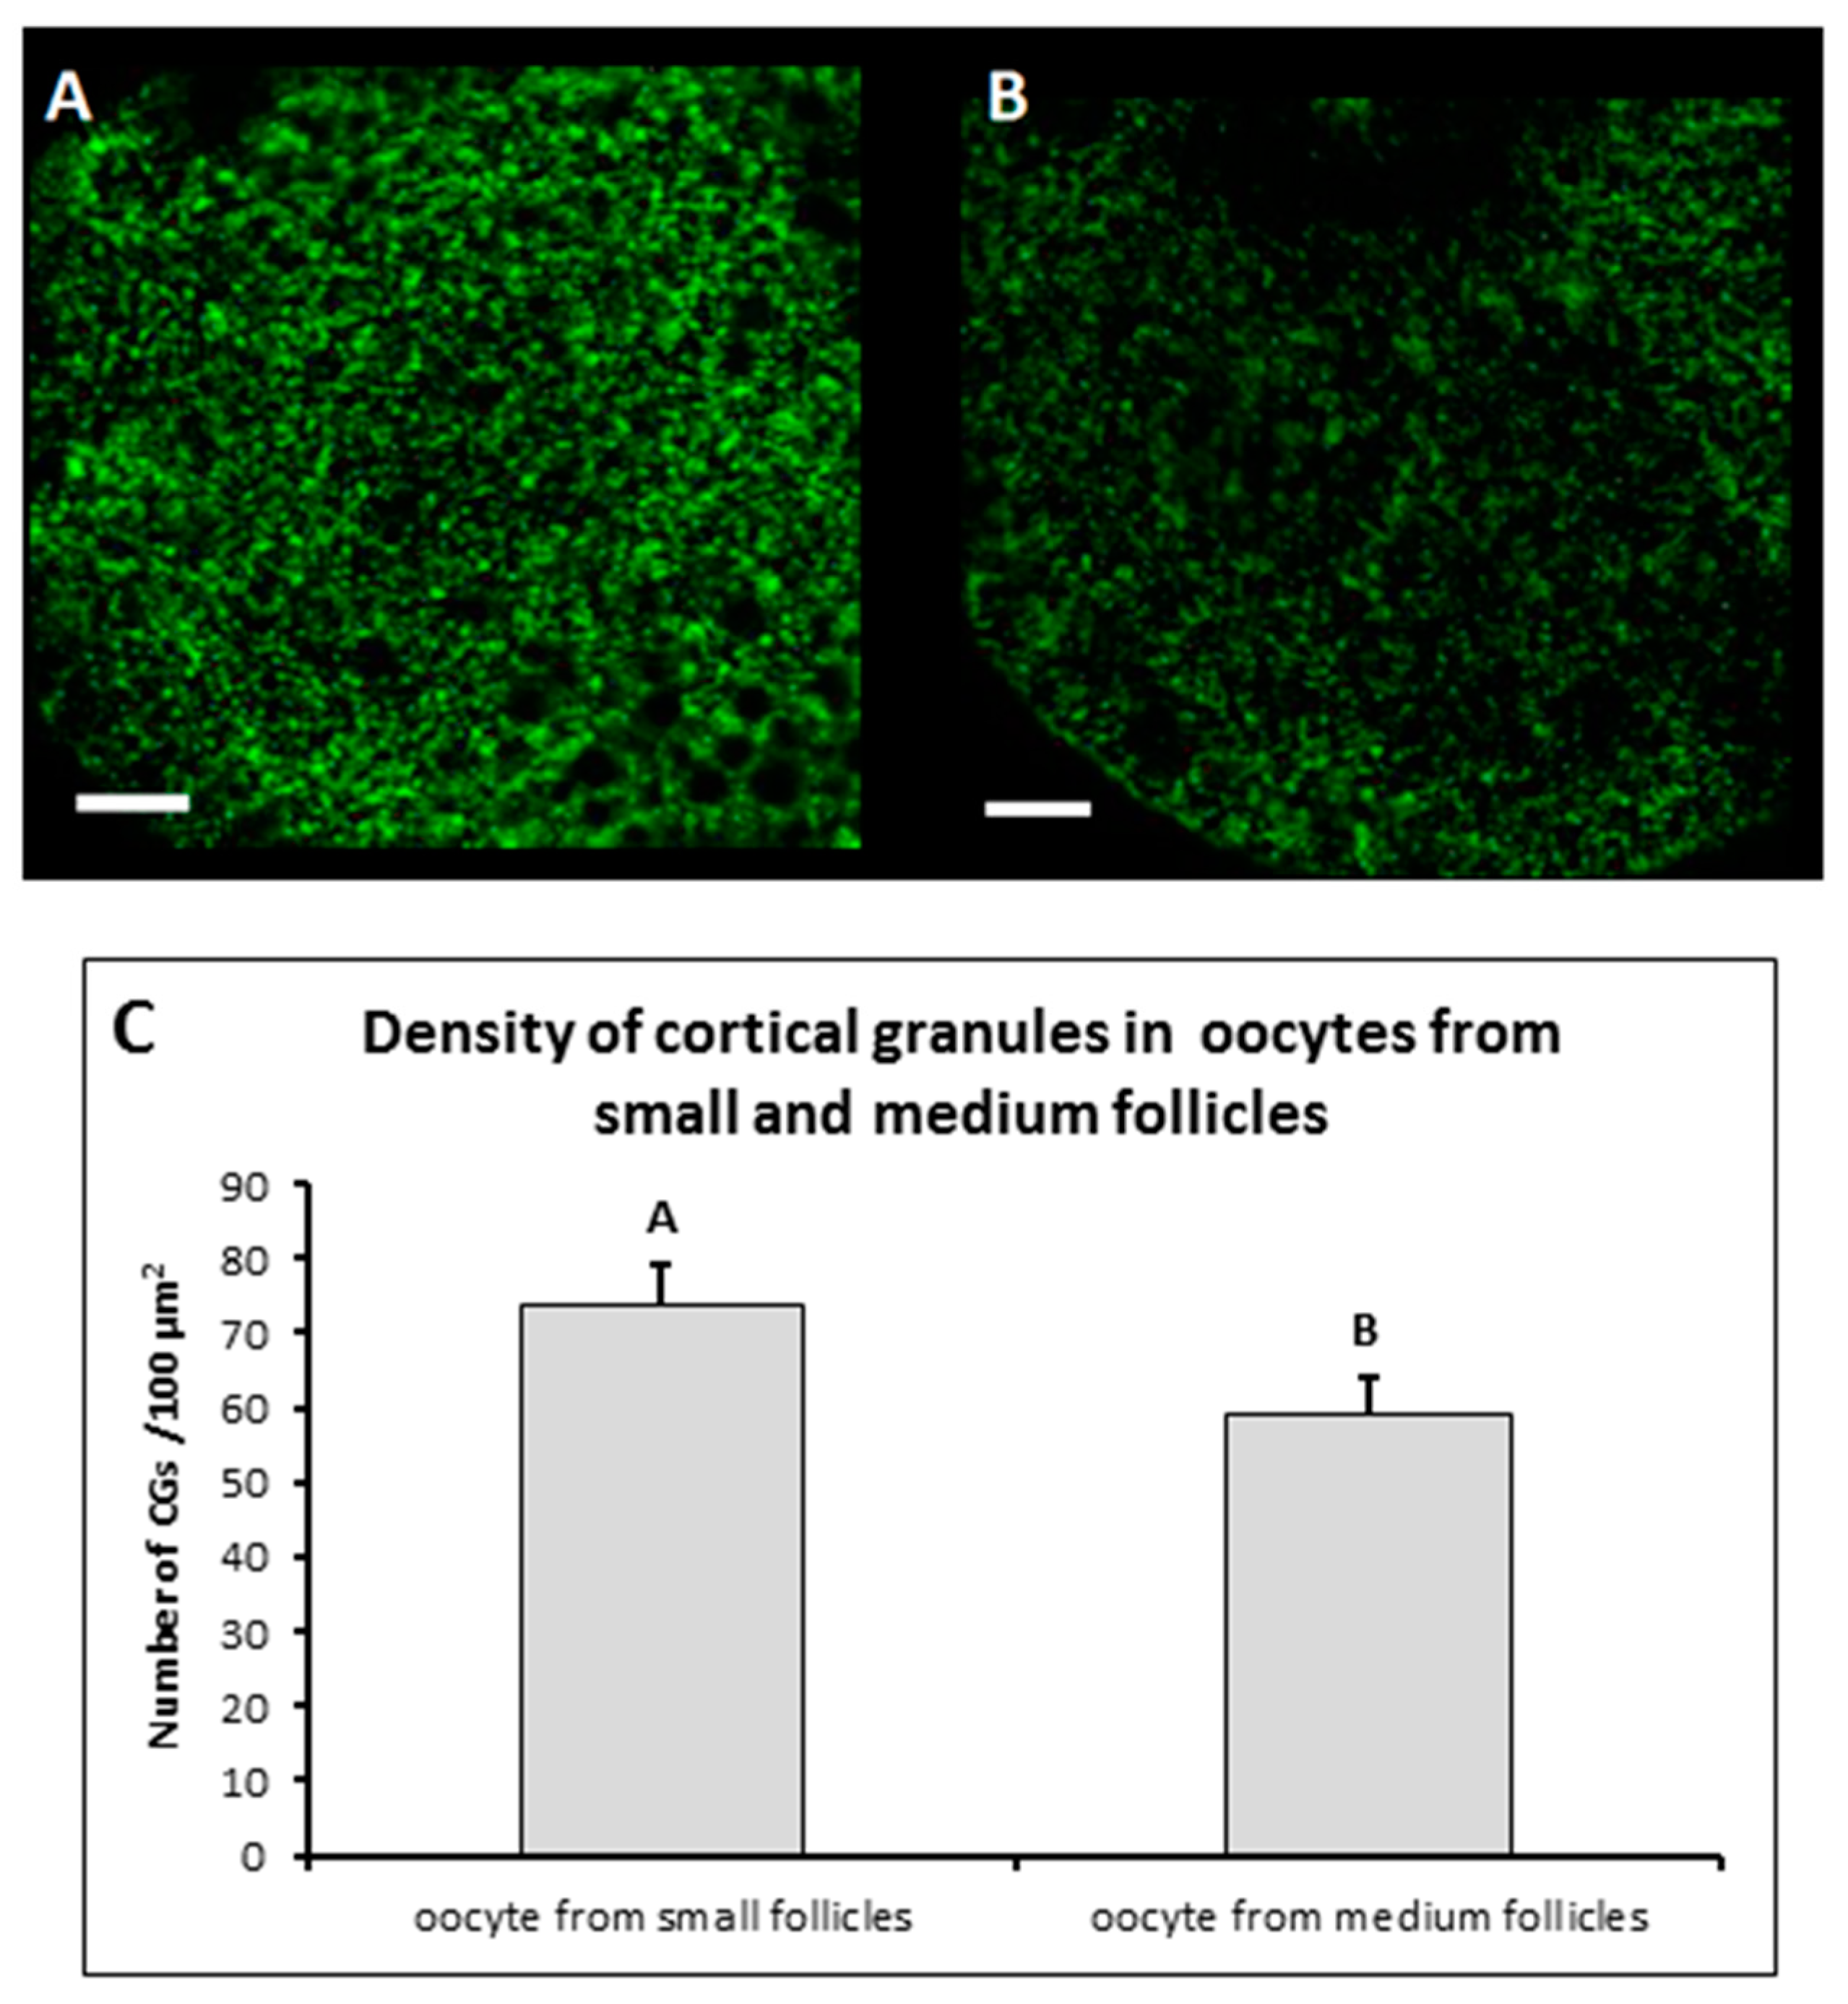
3.1. Distribution of CGs in Immature MF and SF Oocytes

The values of the Index of CGs distribution (Icgd) in MF and SF oocytes regardless to the size of follicles are presented in Table 1. The difference of the Icgd values between oocytes with higher and lower meiotic competence derived from medium and small follicles, respectively, was statistically significant (p < 0.05). Icgd in oocytes with lower meiotic competence (1.48 ± 0.31) shows a tendency of central orientation of CGs in the cytoplasm of oocytes derived from SF (Figure 1). On the opposite, in oocytes with higher meiotic competence the peripheral concentration of CGs was more than two-fold higher (Icgd = 2.22 ± 0.49) than their concentration in the central part, indicating movement of CGs towards the cortical area during the acquisition of meiotic competence.

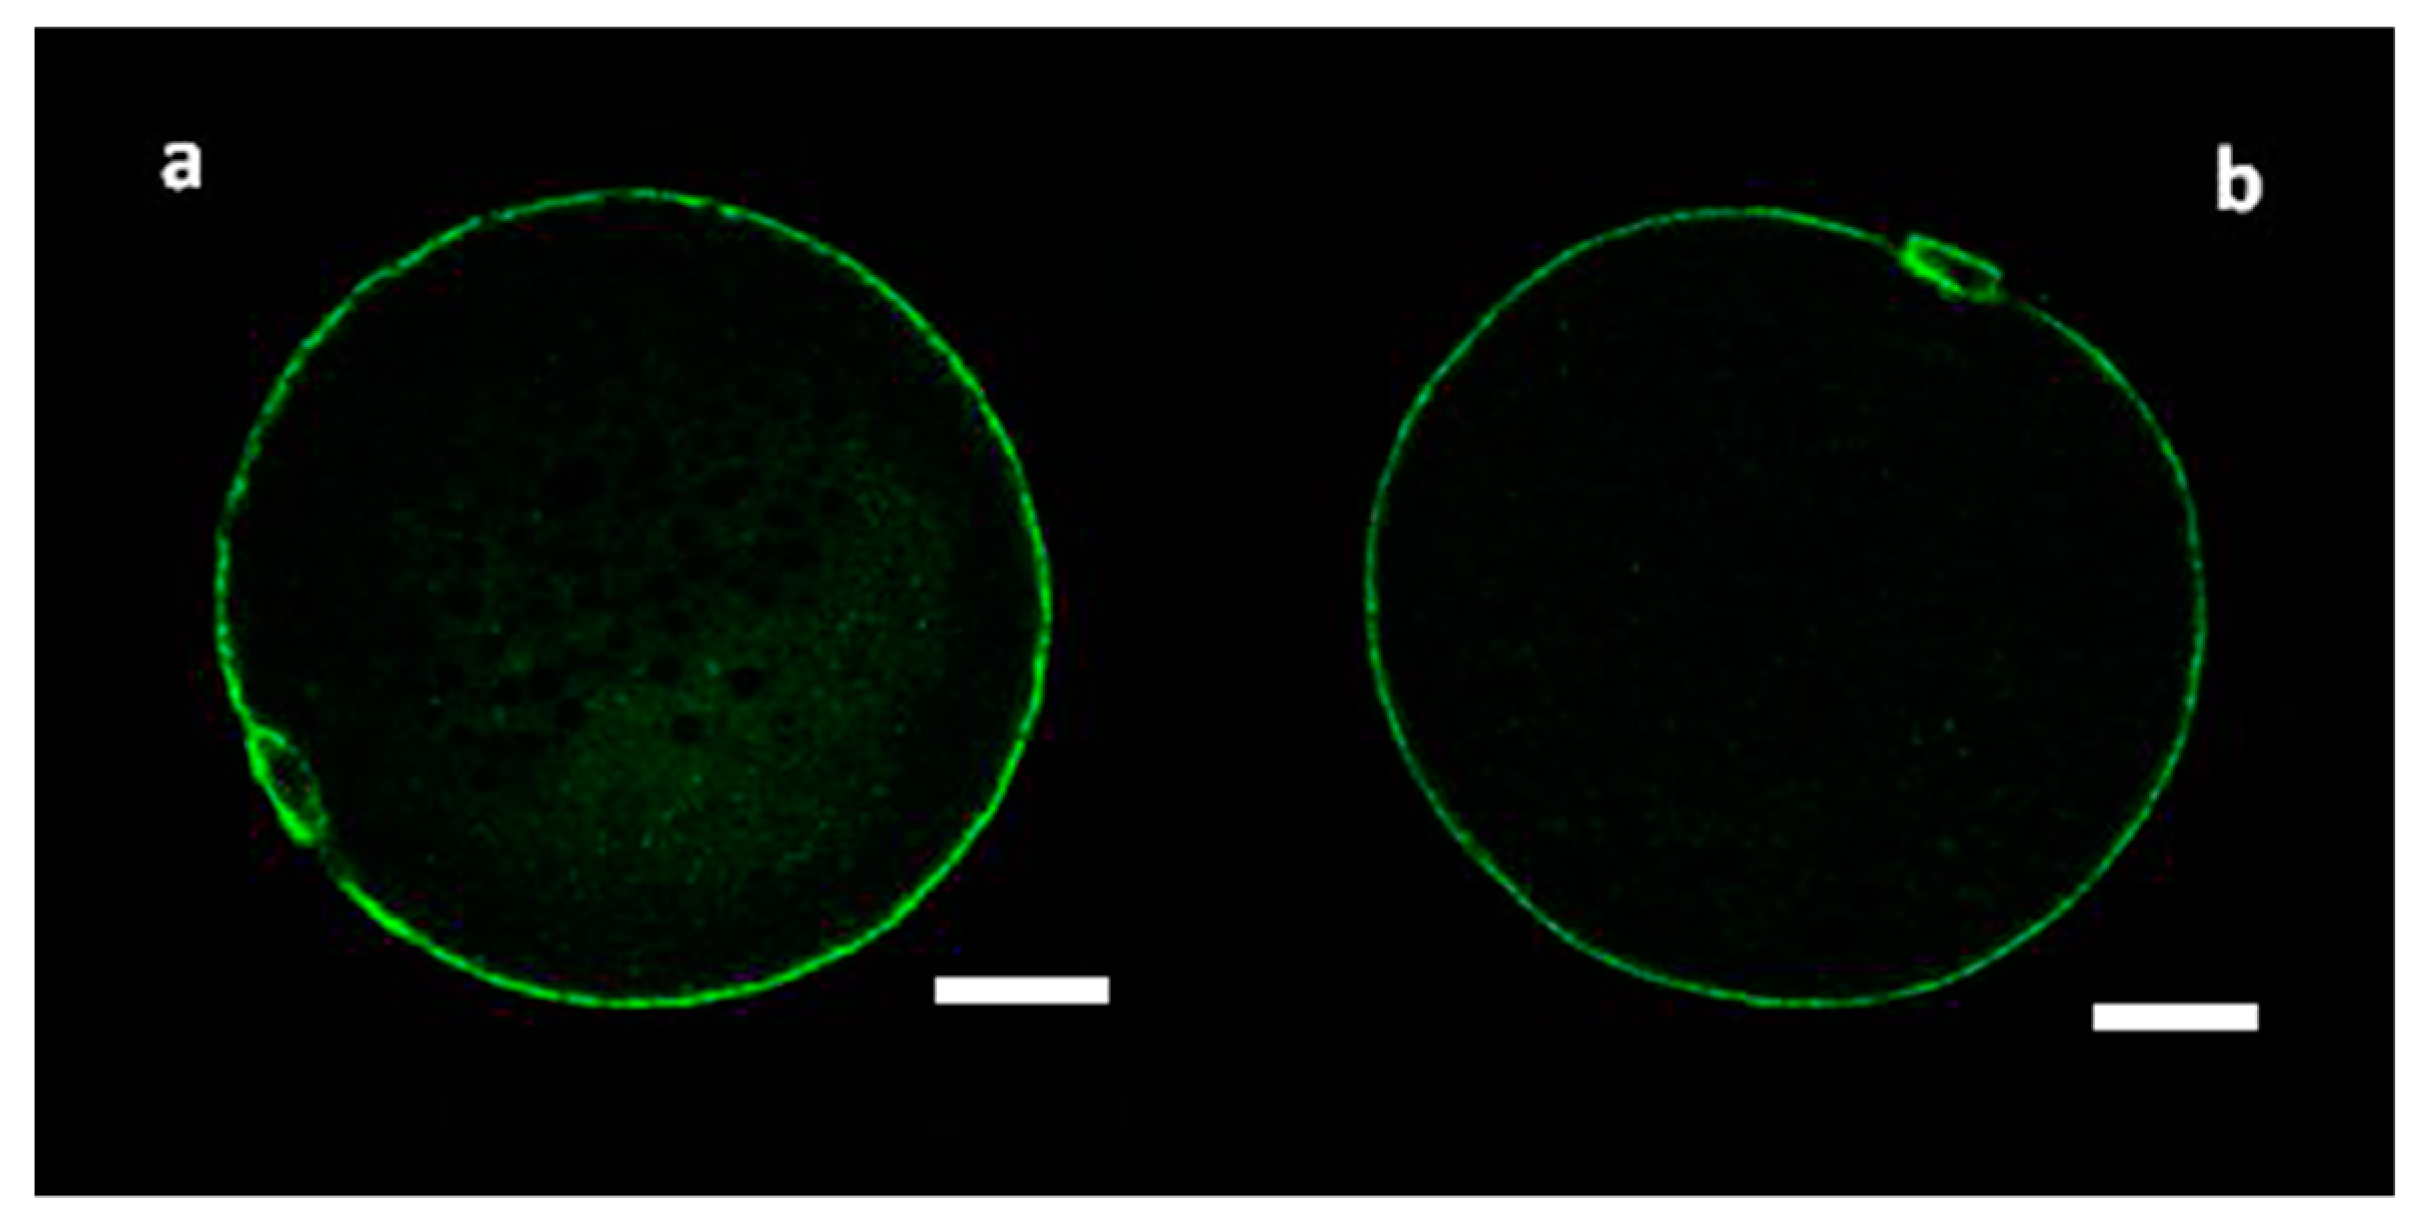
3.2. Peripheral Density of CGs in Mature MF and SF Oocytes

The comparison of CGs density in the cortical area with regard to size of the follicles from which the oocytes were derived showed statistically significant difference (p ˂ 0.05) between these experimental groups (Figure 2). The density of CGs recorded in more meiotically competent oocytes from medium follicles reached a mean value of 59.31 ± 13.2, while in oocytes with lower meiotic competence derived from small follicles, the mean value of CGs density was 73.89 ± 18.7. These results proved that, together with increasing meiotic competence, the numbers of CGs per 100 µm2 of cortical area of ooplasm declines during the IVM process.

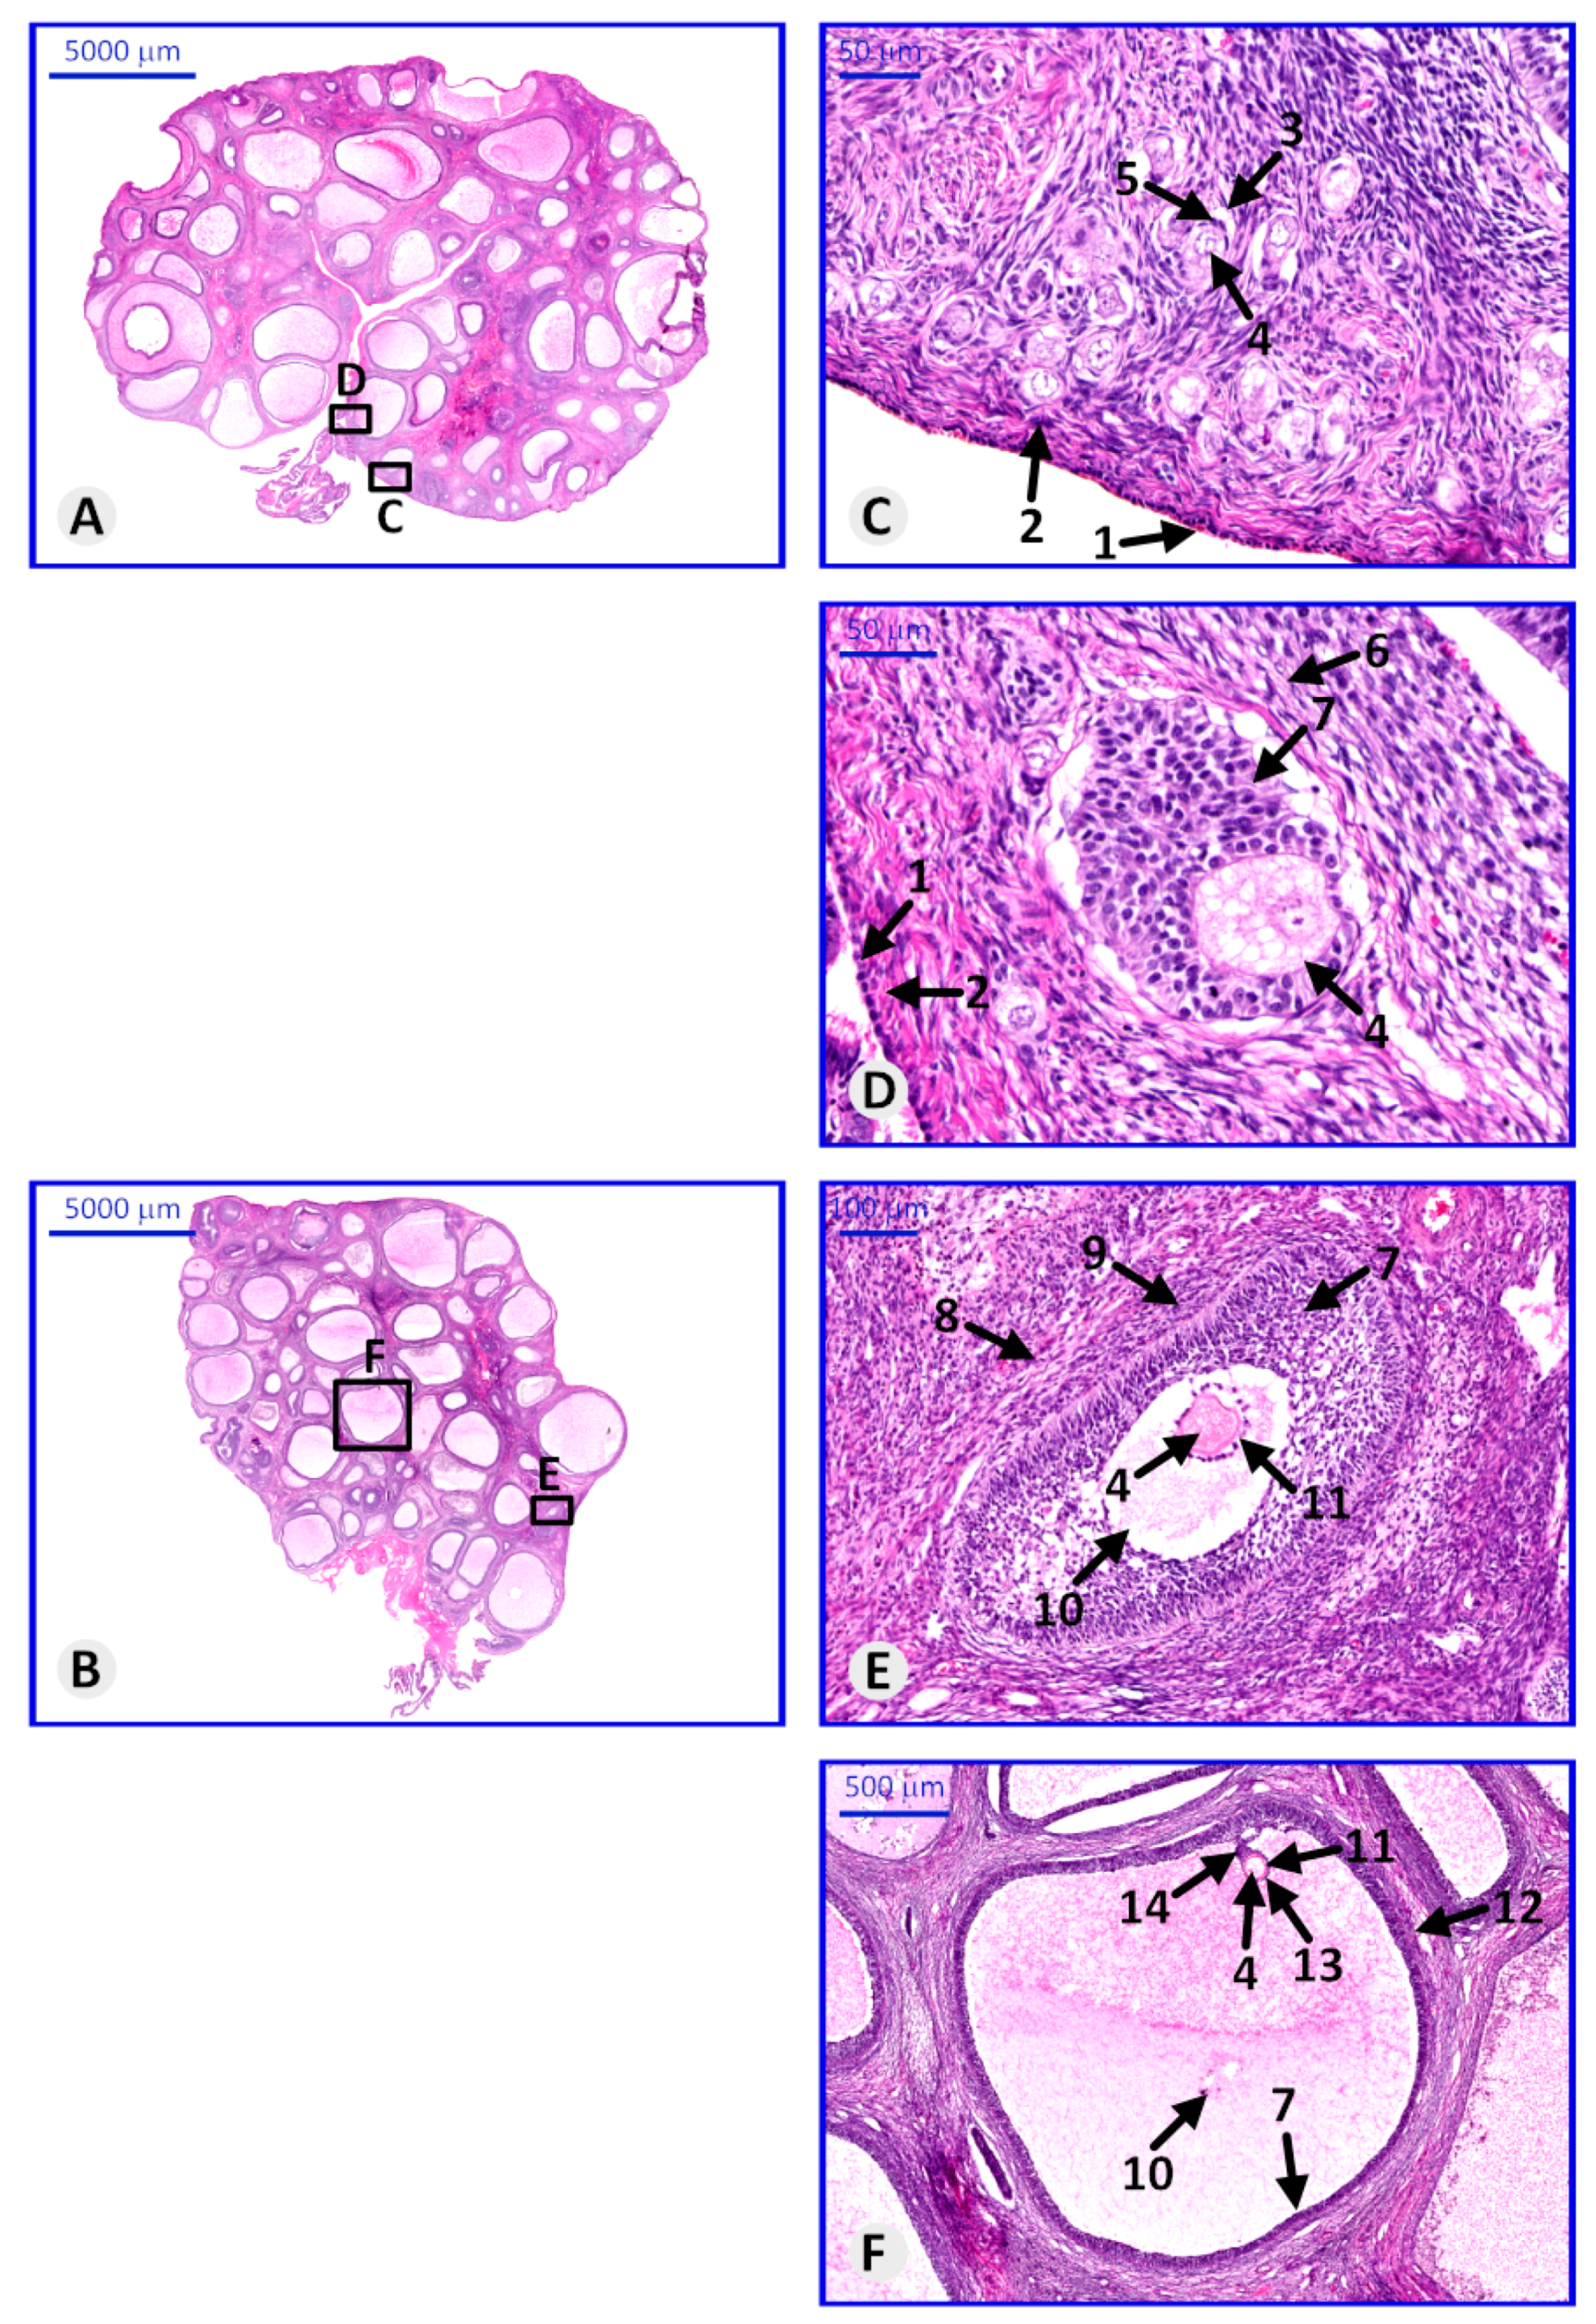
3.3. Histological Structure of Porcine Ovary and Follicles

Histological analysis allowed us to evaluate the morphological structure of the collected ovaries. Ovarian follicles were observed at all stages of maturation. Clusters of primordial follicles were visible just beneath the tunica albuginea. Primary follicles are characterized by one or many layers of granulosa cells surrounding the oocyte with zona pellucida. In the secondary follicle, formation of antrum was observed between the granulosa cells. In the mature ovarian follicle, the oocyte is located on one of the poles of the follicle, and it is surrounded by cells forming a corona radiata (Figure 3).

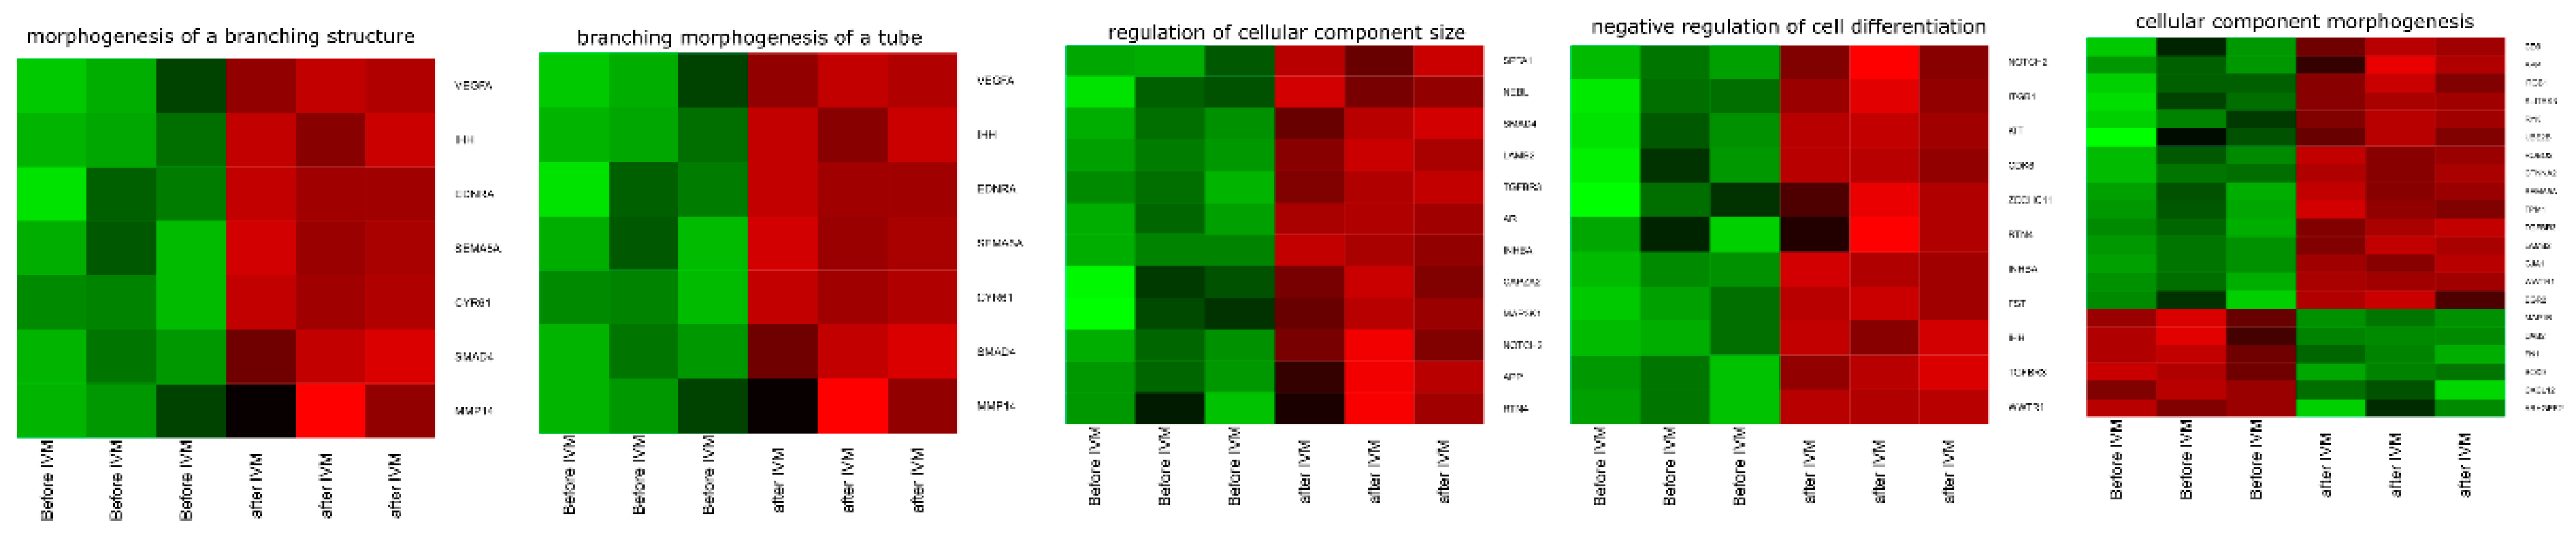
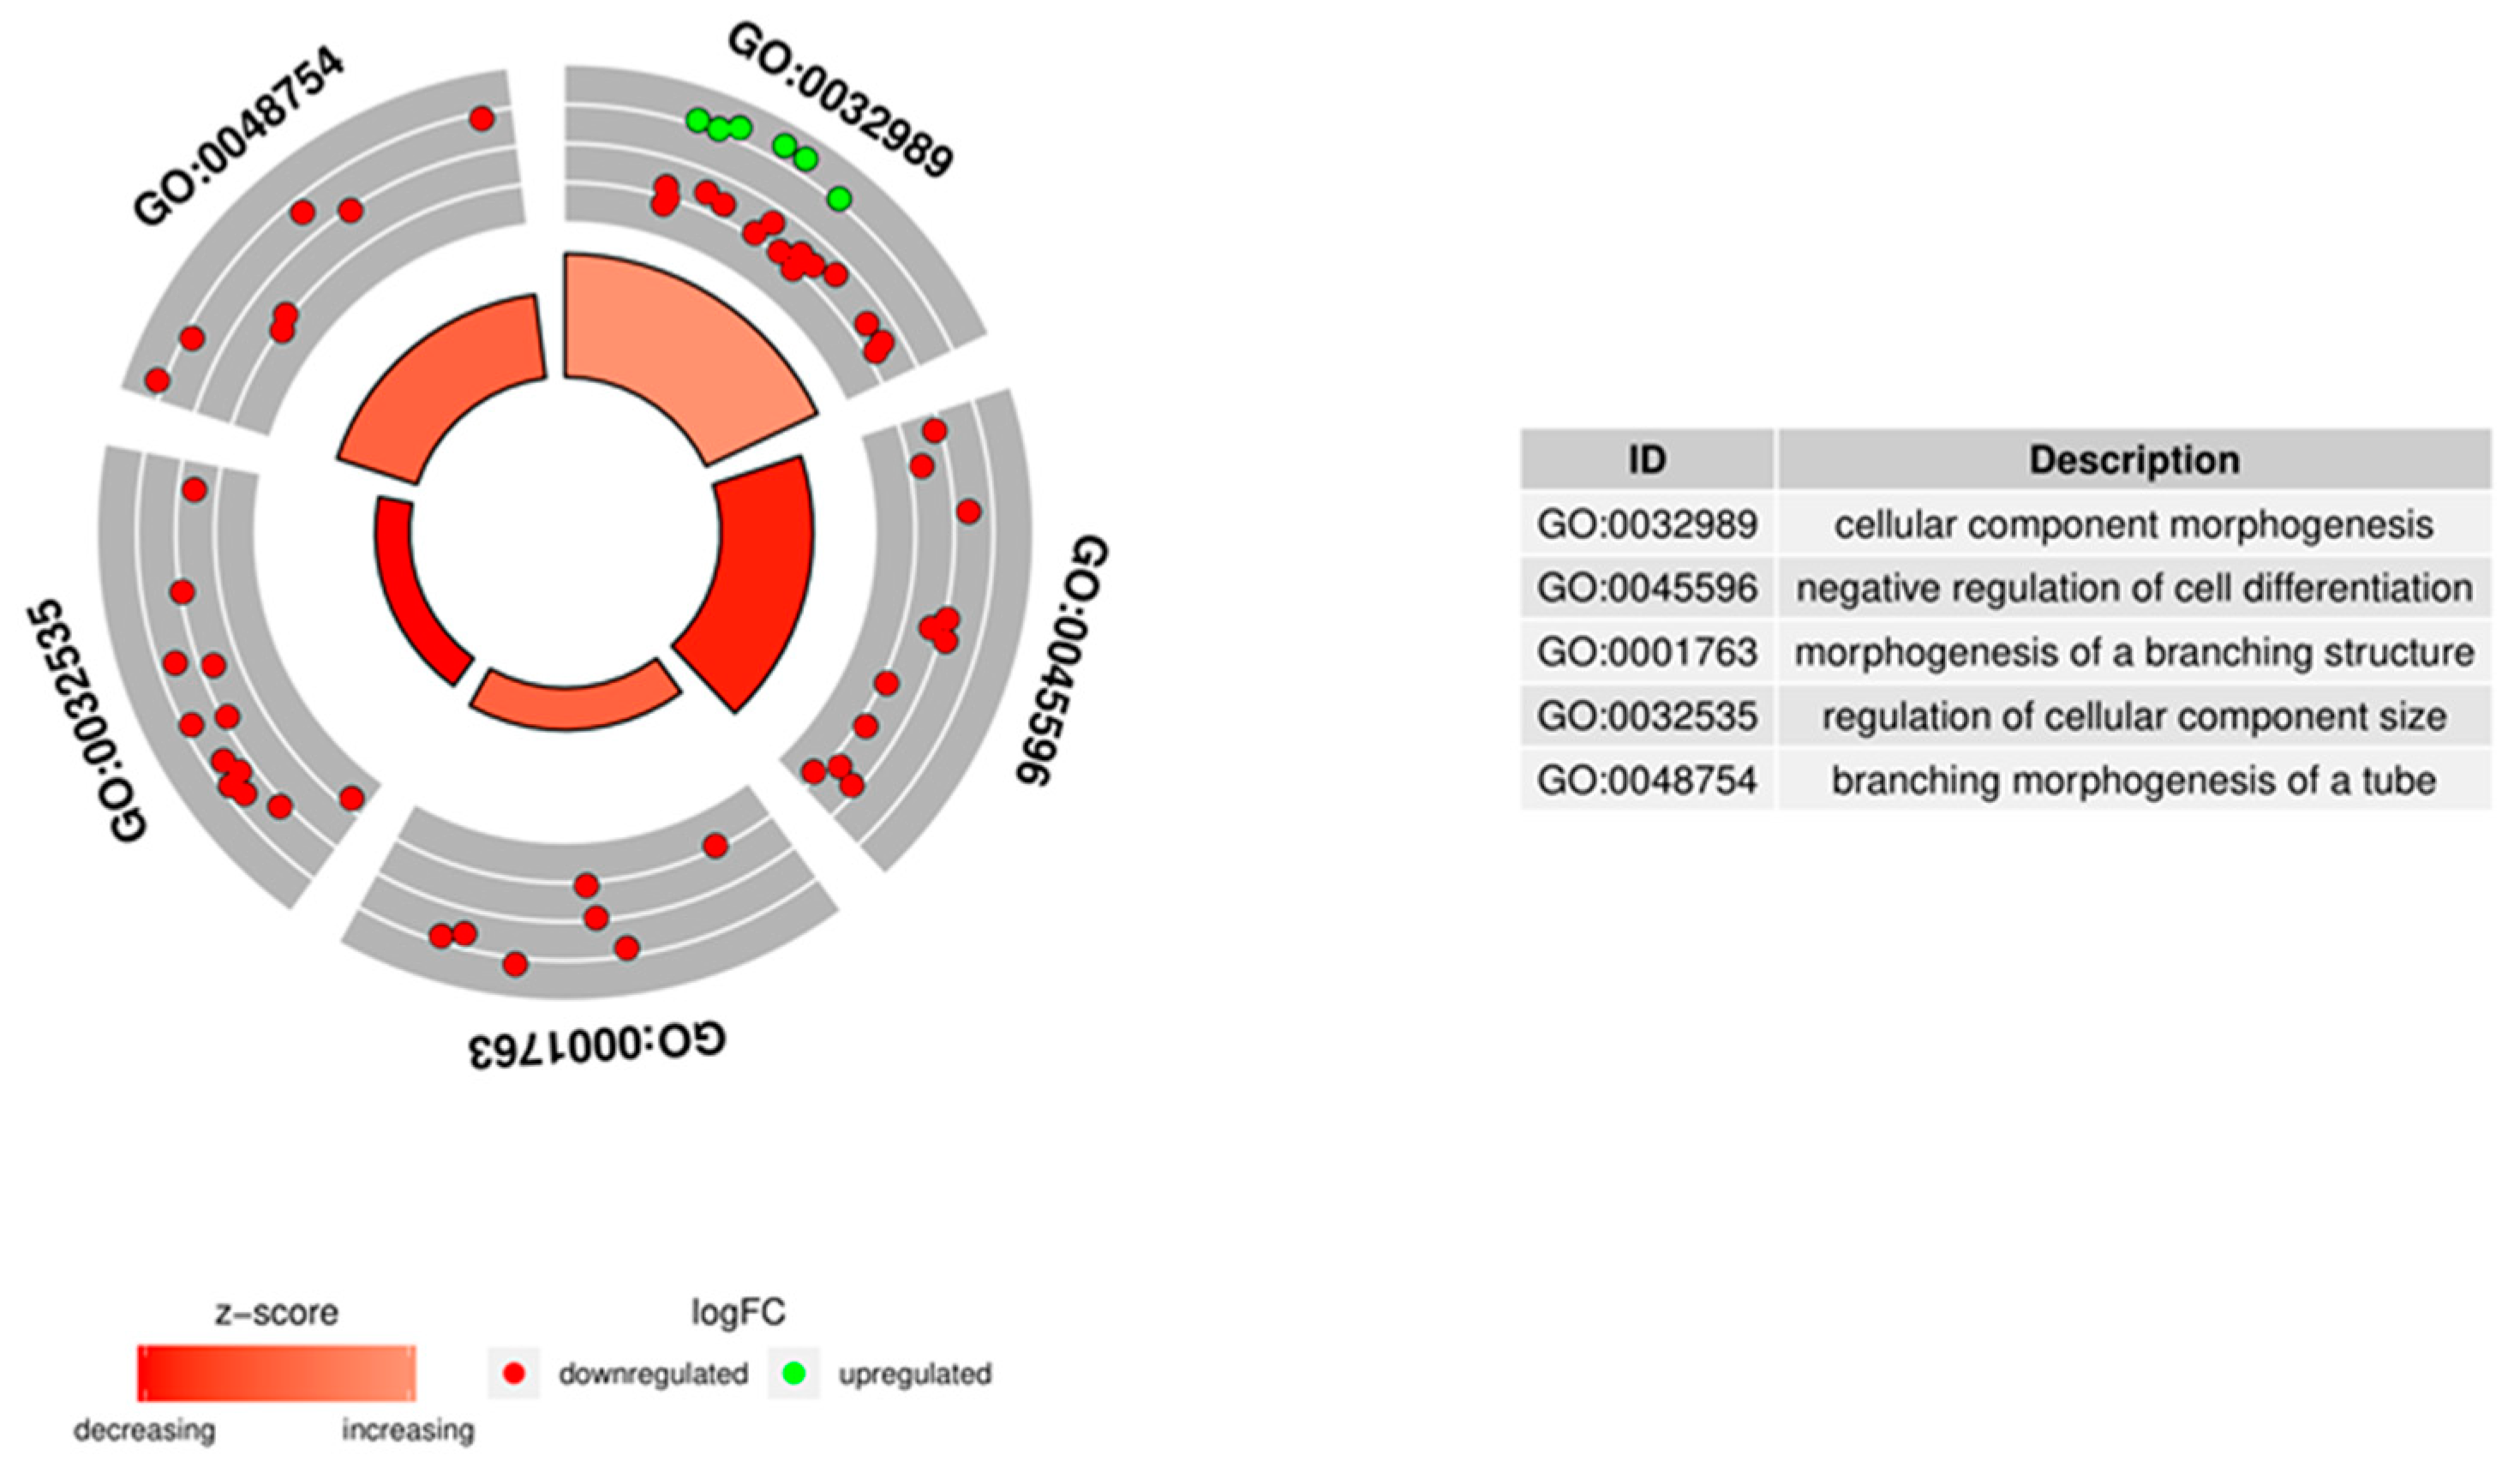
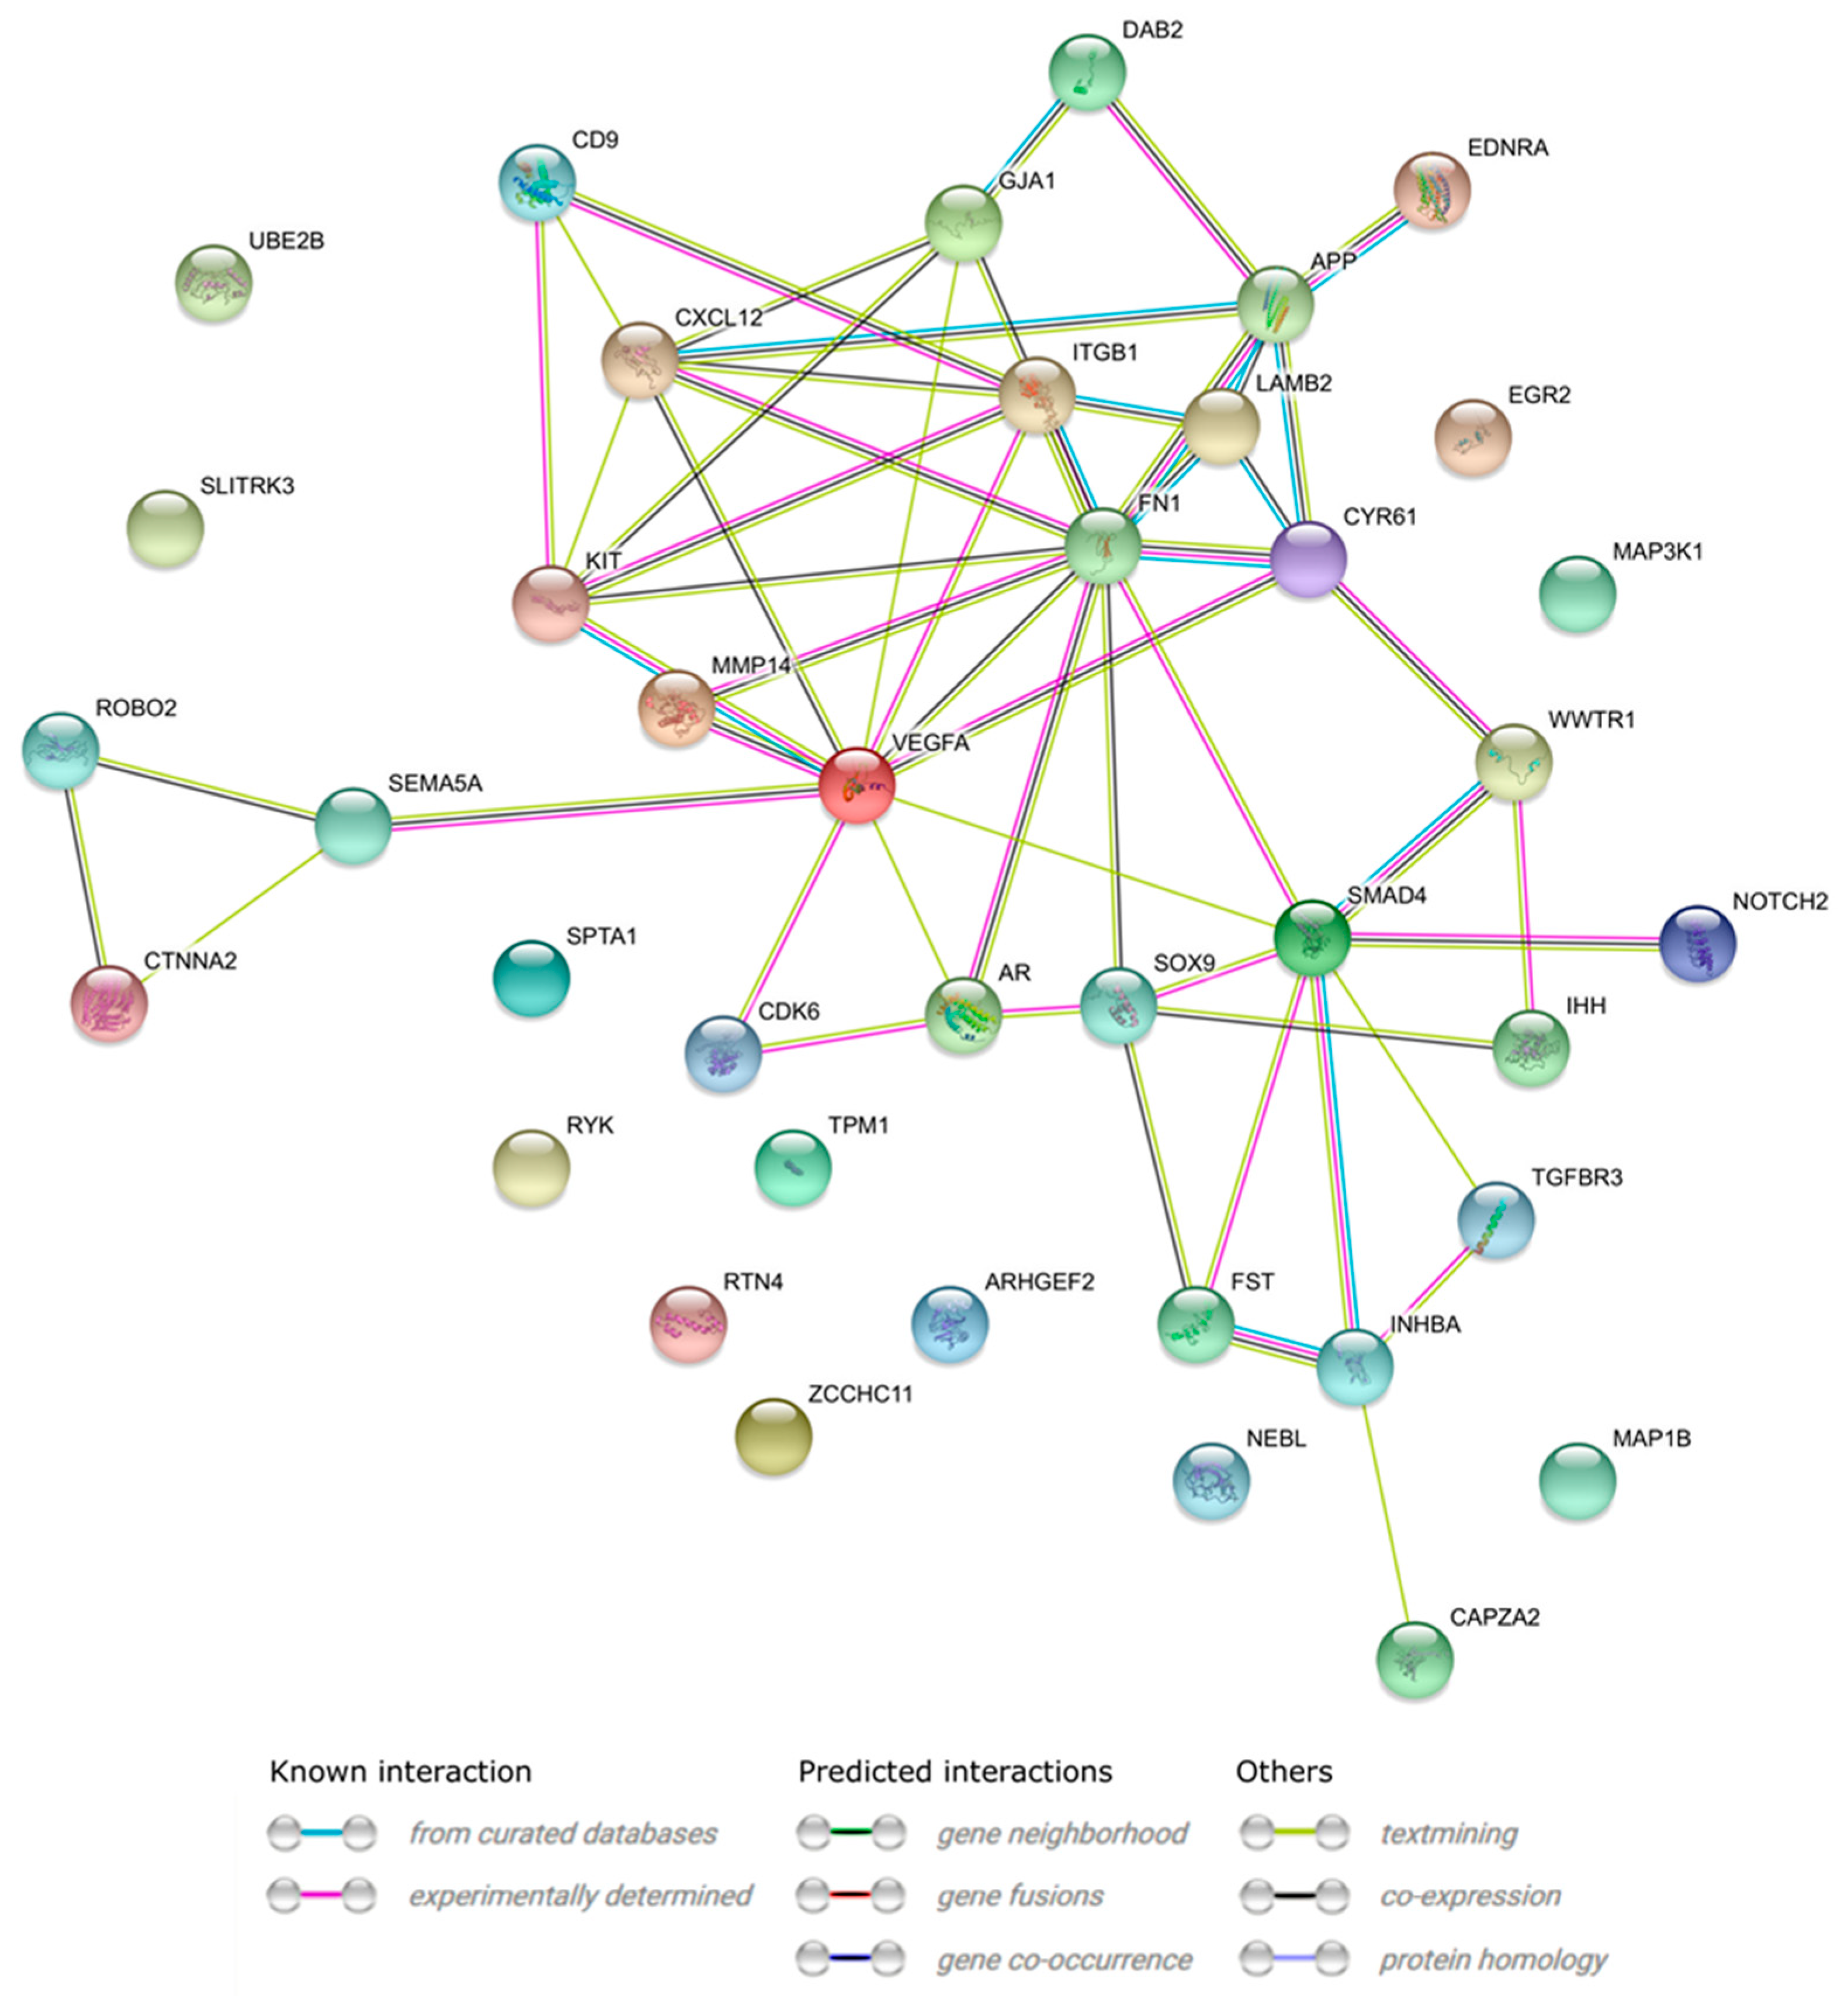
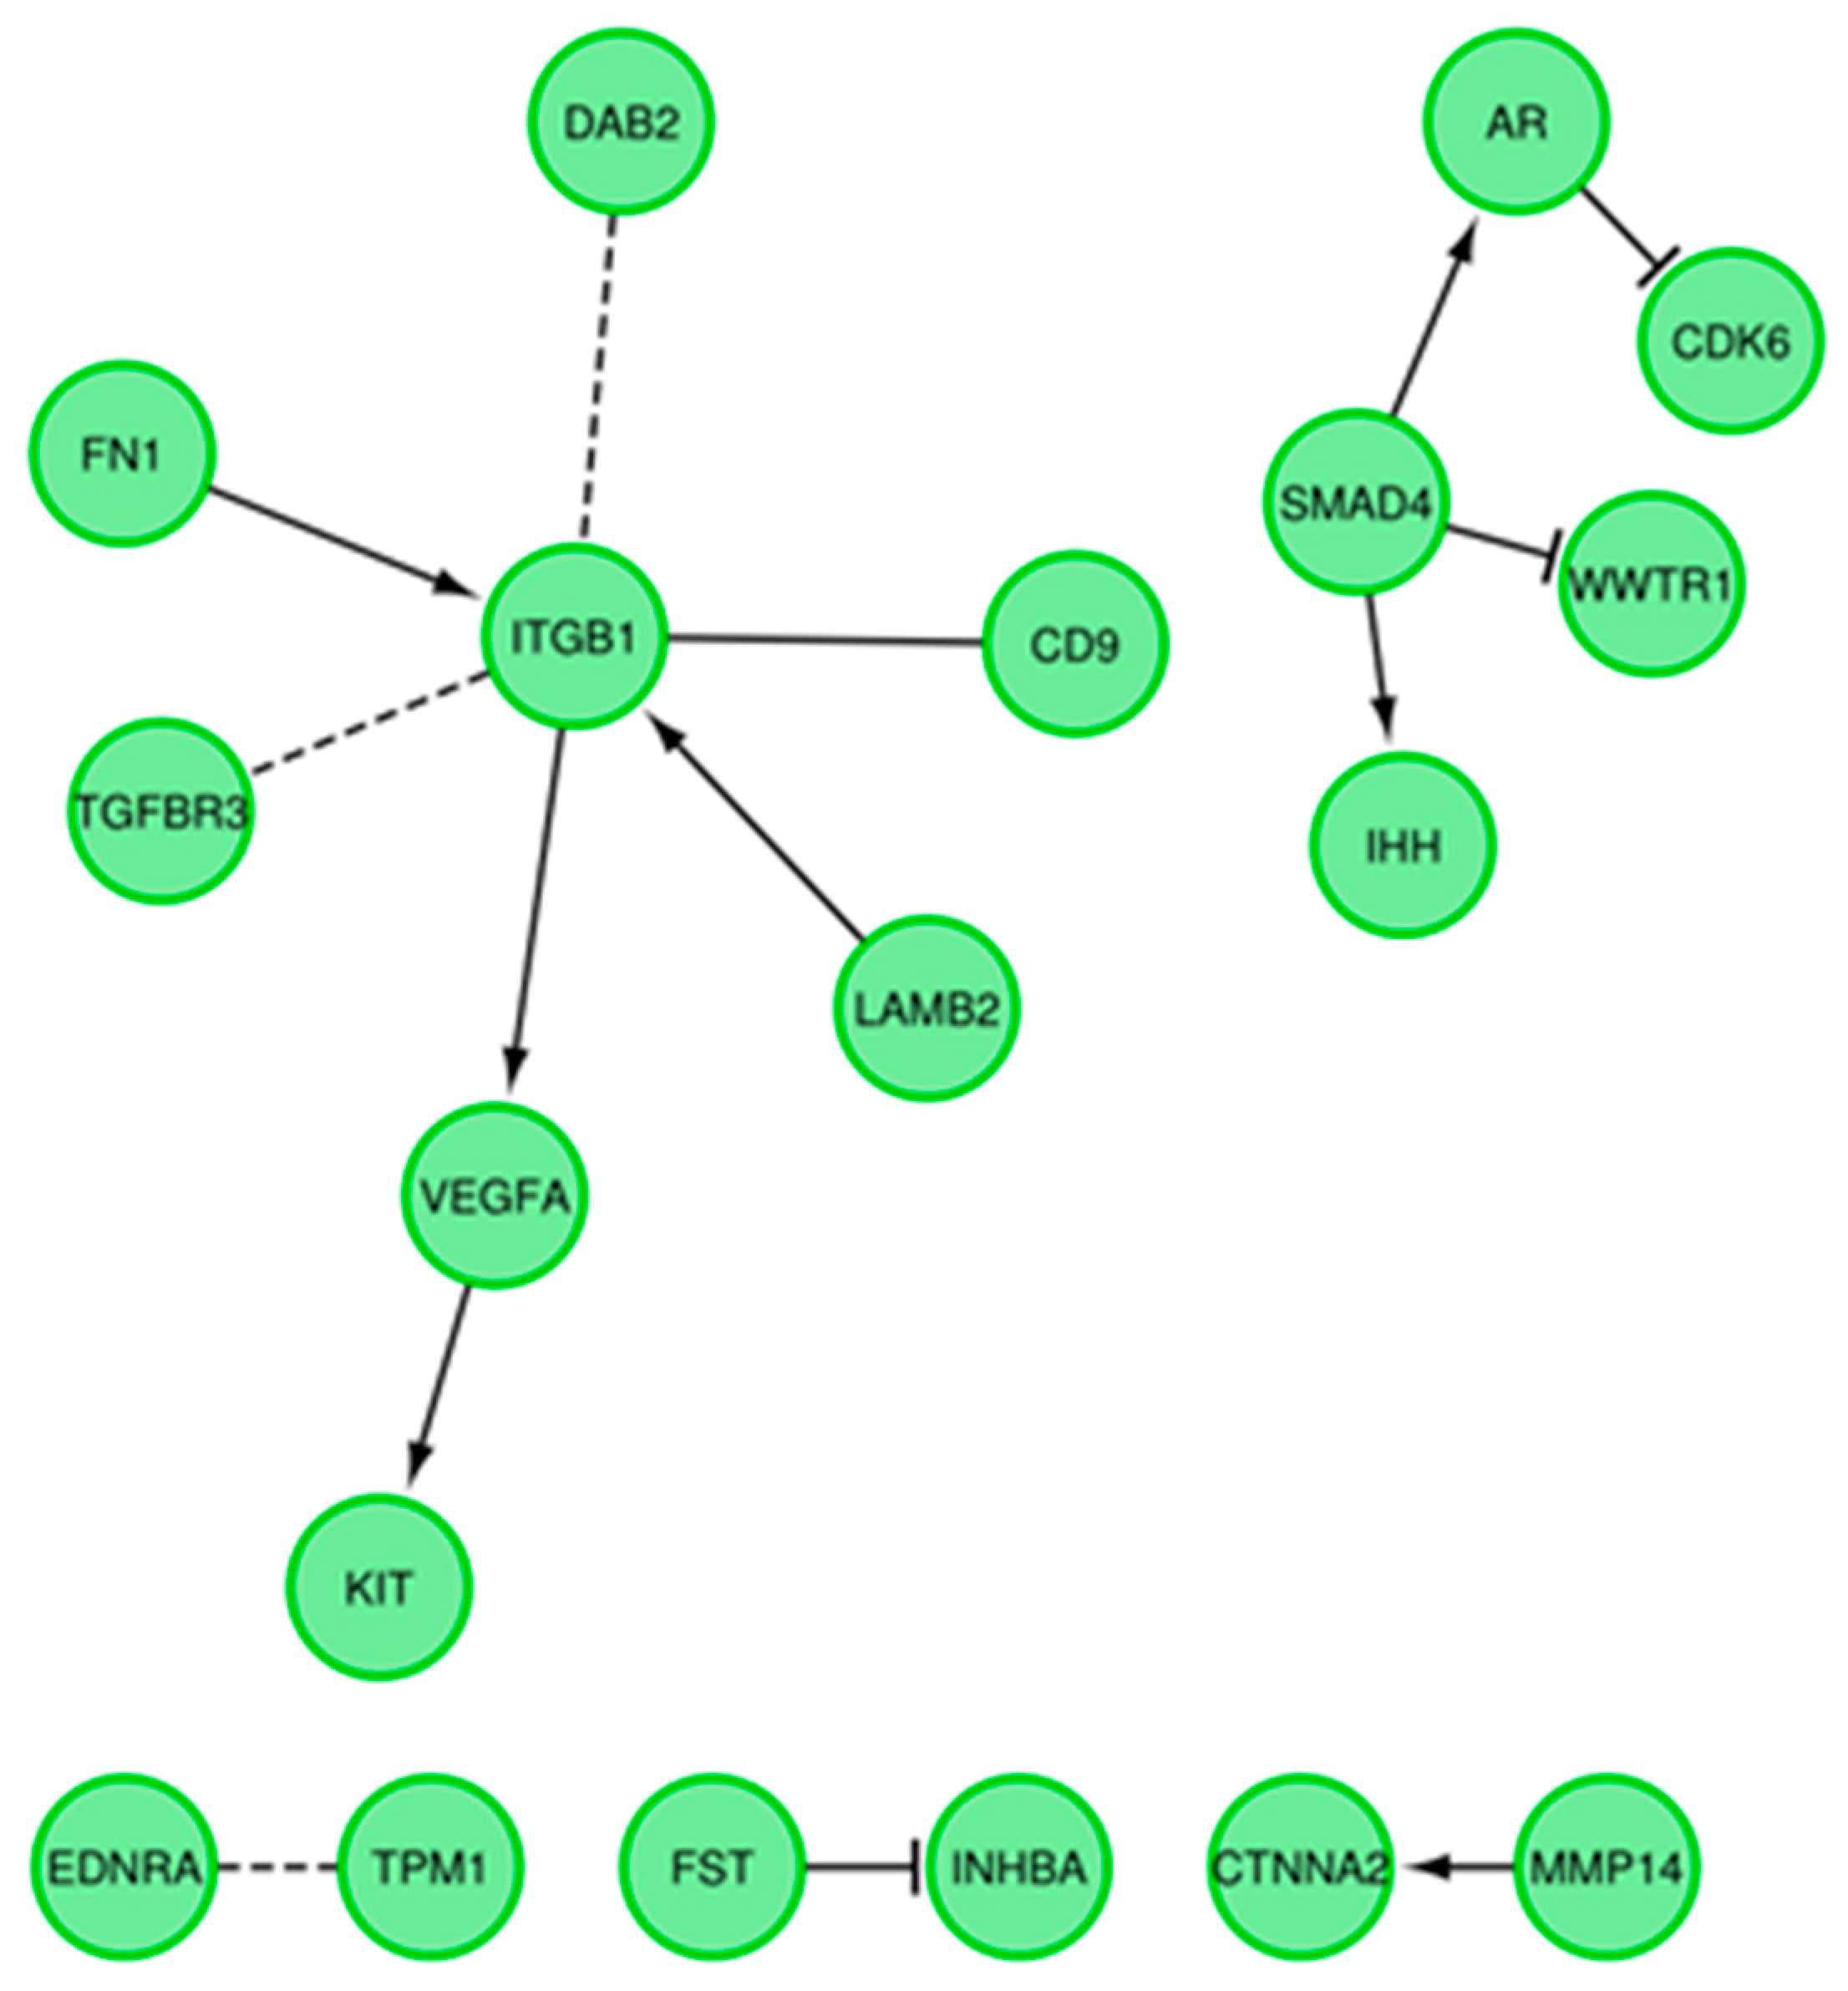
3.4. Microarrays Analysis

Whole transcriptome profiling by Affymetrix microarray allowed us to analyze the gene expression changes in freshly isolated oocytes before the in vitro procedure (“before IVM”) compared to after in vitro maturation (“after IVM”), as pooled samples from SF and MF. Using Affymetrix® Porcine Gene 1.1 ST Array (Affymetrix, Thermo Fisher Scientific, Santa Clara, CA, USA), 12,258 porcine transcripts were analyzed. Genes with fold change higher than |2| and with corrected p value lower than 0.05 were considered as differentially expressed. This set of genes consisted of 419 different transcripts. Subsequently, the genes were used for identification of significantly enriched GO BP terms.
DAVID software was used for extraction of the genes belonging to “cellular component morphogenesis”, “negative regulation of cell differentiation”, “morphogenesis of a branching structure”, “regulation of cellular component size”, and “branching morphogenesis of a tube” Gene Ontology Biological Process terms (GO BP). We found 39 genes belonging to the ontological group GO BP terms described above. From the results obtained during the analysis of microarrays, 33 genes were significantly represented in downregulated, and only six were upregulated after in vitro maturation. These sets of genes were subjected to the hierarchical clusterization procedure and are presented as heat maps (Figure 4).
Sets of the differentially expressed genes belonging to “cellular component morphogenesis”, “negative regulation of cell differentiation”, “morphogenesis of a branching structure”, “regulation of cellular component size”, and “branching morphogenesis of a tube” GO BP terms with their official gene symbols, fold changes in expression, corrected p values, and LogFC are shown in Table 2.
The enrichment of each GO BP term and KEGG (Kyoto Encyclopedia of Genes and Genomes) pathway were calculated as Z-score and are shown on the circle diagram in Figure 5.
Moreover, in the Gene Ontology database, genes that formed one particular GO group can also belong to other different GO term categories. For this reason, we explored the gene intersections between the selected GO BP terms. The relation between those GO BP terms was presented as a circle plot (Figure 6) as well as a heatmap (Figure 7).
A STRING-generated interaction network was created with differentially expressed genes belonging to the “cellular component morphogenesis”, “negative regulation of cell differentiation”, “morphogenesis of a branching structure”, “regulation of cellular component size”, and “branching morphogenesis of a tube” ontology groups. The intensity of the edges reflects the strength of interaction score (Figure 8). Finally, the functional interactions between chosen genes with REACTOME FIViz app to Cytoscape 3.6.0 software (https://cytoscape.org/) are shown in Figure 9.

3.5. Microarray Validation—RT-qPCR

The results obtained from the expression microarrays were subjected to quantitative verification using the RT-qPCR technique. The direction of changes in the expression of 37 of 39 genes has been confirmed (Figure 10). Such divergences may be the result of differences in the sensitivity of both methods used (microarray and RT-qPCR). RT-qPCR is a method much more sensitive to changes in gene expression.

4. Discussion

The presented research, both at the molecular level of gene expression and distribution of cortical granules, was aimed at identifying processes leading to full maturity by the oocyte. In vitro maturation of oocytes is still difficult, which translates into a decrease in IVF process efficiency.
The transfer of CGs is associated with meiotic maturation of oocytes and is often considered a determinant of maturity. Therefore, it is very important to know the mechanisms regulating the dynamics of CGs. We have evaluated the distribution of CGs in immature oocytes, both from small and medium follicles. There is a tendency towards central CGs orientation in SF oocytes with lower meiotic competence. On the contrary, in MF oocytes, the peripheral CGs concentration was twice as high as the central concentration (Figure 1, Table 1) suggesting the movement of CGs towards the plasma membrane from the central part of the oocyte, which takes place during puberty and meiotic competence acquisition.
Additionally, the average value of peripheral density of CGs in MF was lower than in SF (Figure 2). Therefore, it can be concluded that with the increase in meiotic competence, the number of CGs per 100 um2 of the cortical ooplasm surface decreases during the IVM process. CGs appear to be a dynamic structure, dependent on many factors, and are characterized by a complex distribution during the development of oocytes. The molecular mechanism of formation and releasing of cortical granules are not well known. Many studies emphasize that the fate of the embryo is determined at a very early stage of development, before embryo genome activation (EGA), and even before fertilization. It is also suggested that all mechanical actions on cells are reflected at the molecular level [30].
The microarray study was concentrated on the analysis of genes belonging to “cellular component morphogenesis”, “negative regulation of cell differentiation”, “morphogenesis of a branching structure”, “branching morphogenesis of a tube”, and “regulation of cellular component size” ontological groups by conducting in vitro culture of porcine oocytes in primary culture. The chosen groups refer to the organization of cell structure and its morphogenesis or component size, which may be of key importance for the proper development of oocytes and its usefulness for IVF processes. Analysis of microarrays was performed before and after in vitro maturation of swine oocytes, which enabled us to evaluate molecular markers during IVM. In general, downregulation of the expression of the genes after IVM was observed, except for the group “cellular component morphogenesis”, which, in part, showed upregulation after IVM (Figure 4).
The gene expression profile in in-vitro-maturing porcine oocytes showed an increased expression in relation to the state before IVM. All upregulated genes belonged exclusively to the “cellular component morphogenesis” group, associated with the creation of new cells and their components. The gene that is involved in the organization of cytoskeleton, especially microtubules and actin filaments—ARHGEF2 (Rho/Rac guanine nucleotide exchange factor 2) [31]—is upregulated after IVM. ARHGEF2 regulates the RhoGTP-azes signal pathways, which are important factors in the fundamental cellular processes associated with migration, proliferation, and survival [32]. Zhong et al. [33] described that RhoA is a key element in ooplasmic segregation and spindle rotation, and studies on swine oocytes indicated participation in meiosis regulation and early embryonic development [34]. Similarly, research on in vitro mouse embryos has shown that an impairment of the ARHGEF2 gene associated with the organization of actin may have an impact on embryonic development [35]. However, earlier studies in cows with subclinical endometritis showed a decrease in ARHGEF2 expression, which will probably affect the gene profile of the embryo and its further development [36]. High expression of ARHGEF2 in mature oocytes may, therefore, indicate correct cytoskeleton formation and may be a candidate as an in vitro maturation marker of oocytes.
The second analyzed gene is closely related to the assembly of the microtubules. The MAP1B gene (microtubule associated protein 1B) plays a predominant role in the development of the nervous system and neural flexibility [37], although its participation in other tissues has been shown in kidney podocytes in humans and mice [38], or in ovarian tissues [39]. Reduced expression was shown in studies on swine mammary during later gestation [40]. Upregulation of this gene was demonstrated in swine granulosa cells (GCs) during the analysis of follicular atresia [41] and appeared in studies comparing GCs and theca cells of bovine animals [42]. Budna et al. [43] showed upregulation after porcine oocytes IVM, which was suggested to be related to the reorganization of microtubules in maturing oocytes.
Furthermore, it was demonstrated that the transport of CGs from the central part of the cell to the membrane is actin-dependent [5,6]. It is due to the existence of the actin cytoplasmatic network connected with Rab11a that vesicles can be transferred [44]. Recent studies on mouse oocytes have shown that CGs move along the cytoplasmic actin network in a process regulated by Rab27a (Ras superfamily of GTPases). Additionally, Rab27a mutants showed increased polyspermia [4]. On the other hand, earlier studies have shown that CGs diffuse freely in cytoplasm before meiosis, and binding to microfilaments occurs at the beginning of meiosis, which results in the transfer of CGs to the cortical area [5]. Wessel et al. studied the transport of CGs dependent on cytoskeleton by adding inhibitors such as nocodozoles and colchicine. The addition of these inhibitors did not completely block the transport, but the packing of CGs along the plasma membrane was leaking and incomplete, which resulted in the impossibility of exocytosis. However, addition of microfilament inhibitors (cytochalasin D and latrunculin A) caused an absence of cortical transport. CGs were dispersed in cytoplasm [5], suggesting a key role of the actin network in the transport of CGs, and microtubes were proposed as the motor. Significant increase in expression of ARHGEF2 and MAP1B genes, which are closely related to the structure of cytoskeleton, may indicate the participation of these genes in CGs distribution and, at the same time, indicate the maturity of oocytes.
A recently published study on oocytes (OCs) from pigs showed no progression of meiosis and poor distribution of CGs after exposure of OCs to BFA (brefeldin A—a beta-lactam antibiotic) [45]. The indisposition of these processes was explained by a clearly defective cytoplasmic system, which consequently weakens the ability to fertilize. Therefore, it is a further proof of the key importance of microfilaments in oocytes maturation and CGs dynamics. Miao et al. described the important role of dynein (cytoskeletal motor proteins) in the meiotic progression of porcine oocytes through the regulation of cytoskeletal dynamics, including the stability of microtubules [46], reflecting the distribution of CGs and ovastacin exocytosis.
The next gene, CXCL12 (C-X-C motif chemokine ligand 12), is an extremely important gene that exhibited an increase in expression after IVM of swine oocytes. CXCL12 is also known as SDF-1 (stromal cell-derived factor) and is a CXC group chemokine with a wide range of effects, including hematopoiesis and embryo development [47]. Due to its receptor in the cell membrane (CXCR4), it has an important role in the mechanism called “cell homing”, which turns out to be an important process in cell therapy with the use of stem cells [47,48,49]. It acts as a chemoattractant, which is suggested by Zuccarello et al. [50] to be important in the mechanism of guiding sperm to the oocyte, because human preovulatory oocytes express SDF-1. The expression of this gene is also documented in GCs and theca cells of cattle [42] and porcine cheeks (downregulation during in vitro culture) [51]. Additionally, it was shown that CXCL12 acts synergistically with VEGF, which induces angiogenesis in human ovarian cancer [52], but also supports angiogenesis after ovulation [53]. Through analyzing literature data and the obtained results, it can be assumed that CXCL12 plays an important role in the maturity of oocytes for fertilization.
In contrast, increased expression of DAB2 (DAB adaptor protein 2) gene was shown. DAB2 is involved in regulation processes such as cellular adhesion [54], which is important in cell culture. The expression of this gene was recorded in granulosa cells and theca cells in bovine, during comparative studies of these two groups of ovarian follicle cells [42,55]. The work of Stefańska et al. [56] observed a high increase in DAB2 expression in oviduct epithelial cells (OECs) in primary culture, which indicated high participation of this gene in morphogenesis. Additionally, this gene is considered important for the functioning of the female reproductive system [57] and plays a role in the TGF-beta pathway as a link between TGF-beta receptors and proteins from the SMAD family [58]. Taking into account the participation of this gene in the processes of reproductive system cells, it can be concluded that it has marker potential, which requires further confirmatory studies.
The FN1 gene (fibronectin) was upregulated in our current studies and is also strongly associated with cellular adhesion processes. Fibronectin is a major component of the extracellular matrix, also involved in the migration of cells associated with the basement membrane from connective tissue [59]. The expression of this gene was also recorded in the aforementioned studies on bovine GCs and theca cells [42] and on swine GCs [25,60], where an increase in expression during primary in vitro culture was observed. Significant expression of this gene in reproductive system tissues may provide insight into its role in ovarian follicle and oocyte morphogenesis.
However, the SOX9 gene (SRY-box transcription factor 9) is associated with the processes related to sex differentiation—its activation of transcription and gonadal development [61,62]. It also has a role in skeletal development and chondrogenesis [63,64,65]. The increase in the expression of this gene may indicate the maturation of gametes from the female gonads. Increased expression of the three previously mentioned genes (FN1, DAB2, and SOX9) was also described in the primary culture of cells obtained from the porcine buccal cheek, which was accompanied by cell proliferation [51].
The remainder of the analyzed genes showed downregulation after IVM of swine oocytes in vitro culture. A large group of genes was closely or indirectly related to oocytes, ovarian follicles, or the reproductive system in general. The first gene that belonged only to the “cellular component morphogenesis” of the ontological group was GJA1 (gap junction protein Alpha 1), one of the key factors in oocyte maturation [66,67]. GJA1, also known as CX43, is involved in building gap junction connections (GJCs) between individual cumulus cells (CCs) or between CCs and oocytes. Its expression is particularly manifested in granulosa cells. The protein channels make it possible to transfer small molecules, acquire competence through the oocyte, and resume its meiosis [68]. Mutations in the GJCs building genes lead to oocytes immaturity and cause infertility [69]. The CX43 gene was proposed as a marker of oocyte maturity [70]. The decreased expression of GJA1 was observed in studies on CCs derived from mature ovarian follicles [71], as was downregulation of this gene after IVM of mice cumulus–oocyte complexes [72]. Comparing these data with our results, which indicate downregulation after IVM of swine oocytes, we can assume that GJA1 is a marker of mature oocytes, showing a decrease in expression in relation to immature oocytes.
The second gene that may function as a potential marker of oocytes maturation is MAP3K1 (mitogen-activated protein kinase kinase kinase 1). It was shown that this gene plays a role in follicular atresia, which was associated with inhibition of MAP3K1 expression in porcine GCs, indicating its antiapoptotic effect [73]. Previously, studies on mice GCs showed that MAP3K1 is one of the most important factors influencing fertility, which it does through involvement in the regulation of folliculogenesis and oogenesis [74]. Recent studies on swine oocytes in in vitro culture have also shown downregulation of this gene [75,76]. A decrease in the expression after IVM of the KIT gene (proto-oncogene, tyrosine kinase receptor) was revealed in the current study, and it was recently suggested as a marker of undifferentiated cells of the spermatogenesis pathway in swine testes [77]. Saatcioglu et al. suggested that KIT may function as a factor of oocytes reawakening [78], while studies by Moniruzzaman and Miyano showed that it does not influence the initiation of growth of primary oocytes, but affects their survival [79].
The MMP14 (Matrix metalloproteinase-14) gene is responsible for a wide range of functions associated with angiogenesis, cell migration, and apoptosis [80]. There are various reports on the relationship between MMP14 and ovulation [81,82,83], but the role of this gene in oocytes maturation has not been established. Earlier studies were also concerned with the expression of MMP14 in GCs cells in various species, where an increase in expression was observed after administration of hCG [82] and in the period before ovulation [83]. Due to the wide range of functions performed by MMP14, this gene belongs to “branching morphogenesis of a tube” and “morphogenesis of a branching structure”, and its expression was noted to decrease after IVM.
The next gene that showed a decrease in expression after IVM is inhibit subunit beta A (INHBA). It is believed that it plays an important role in reproduction and development through the coding of activins from TGF-beta superfamily [84,85] and is involved in the secretion of FSH from the pituitary [86], being also a marker of porcine oocyte quality [87]. A study on boars showed that INHBA is significant in testicular development, especially during puberty [88]. Reduced expression of INHBA was demonstrated in studies on swine GCs in vitro culture during follicular atresia analysis [41]. Recently published research on human GCs [86] supports a strong association of this gene with folliculogenesis and ovulation.
Among many genes influencing the morphology and maturity of oocytes, the extracellular component of the matrix, laminin subunit beta 2 (LAMB2), is probably an important factor. It is a noncollagen component of the basement membrane in the ovarian follicle. Studies on bovine ovarian follicles showed that the expression of this gene in GCs cells was different depending on the location of these cells in the follicle, which also resulted in their hormonal activity [89]. LAMB2 downregulation in porcine GCs [41] and porcine oocytes [43] was demonstrated, which correlates with the results obtained during our study.
The SMAD4 (Mothers against decapentaplegic homolog 4) gene is also strongly associated with ovarian follicle development and GCs function through its association with the TGF-beta signal pathway, moderating apoptosis [90,91]. In addition, it was shown that it is strongly associated with the response of swine GCs to FSH signals [92].
Downregulation of IHH, ITGB1, and CD9 connected with folliculogenesis or oogenesis was revealed after IVM. IHH (Indian hedgehog signaling molecule), whose expression in the mucous membrane of the murine uterus was caused by the addition of progesterone [93], and its expression was documented in swine GCs [25,60], also the ITGB1 (integrin subunit beta 1) gene associated with the embryogenesis processes [94], and the CD9 gene, whose contribution to fertility is not yet clear, although it is known to be important in gametes [95]. CD9 is an important factor associated with oocyte membrane and microvilli, playing an active part in the fusion of oocyte and sperm [96].
The expression of the FST gene (follistatin) is observed in many tissues of the body, and its product is also called activin-binding protein. FST plays an important role in the regulation of activin and other members of the TGF-beta superfamily [97,98], which causes effects in the reproductive system, including the formation of female gonads [99]. The expression of FST fluctuates over the course of the reproductive cycle and shows a decrease before ovulation [100]. The downregulation after IVM obtained in our studies may, therefore, indicate that oocytes have reached maturity and may predispose FST to become a marker of maturity of porcine oocytes in vitro.
A decrease in expression of a large number of genes, which until now were not directly or indirectly related to reproductive processes of the maturation of oocytes or folliculogenesis, was revealed in the current study. The genes exhibiting a decrease in expression were involved in the broadly understood angiogenesis and development of the cardiovascular system, although the mechanisms involved in the building of the corpus luteum after ovulation are often based on the construction of vessels and remodeling of the resulting hemorrhagic corpus luteum. VEGFA (vascular endothelial growth factor A), which may have a role in oocyte maturation, [101], CYR61 (cellular communication network factor 1) [102,103], EDNRA (endothelin receptor type A) [104], NEBL (nebulette), the expression of which has been demonstrated in pig GCs [25,60] and is involved in the construction of muscle sarcomeres, and TGFBR3 (transforming growth factor beta receptor 3) were associated with the formation of coronary arteries [105]. Downregulation of genes associated with angiogenesis may be the result of cultures of oocytes themselves, deprived of granulosa cells and other cells involved in corpus luteum formation after ovulation in vivo.
An analogous situation corresponds to the second subgroup of genes, which, in the vast majority, relate to the nervous system, including neurite outgrowth and neural development, and appear here: EGR2 (early growth response 2) [106], CTNNA2 (catenin Alpha 2) [107], RTN4 (reticulon 4) [108], SLITRK3 (SLIT and NTRK like family member 3) [109], ROBO2 (roundabout guidance receptor 2) [110], APP (amyloid beta precursor protein) [111], SEMA5A (semaphorin 5A) [112], and RYK (receptor like tyrosine kinase) [113].
The last subgroup of genes that are characterized by many different functions with a wide range of mechanisms, but are usually not related to ovaries. The CDK6 (cyclin dependent kinase 6), ZCCHC11 (also known as TUT4, terminal uridylyl transferase 4), WWTR1 (WW domain containing transcription regulator 1), UBE2B (ubiquitin conjugating enzyme E2 B), NOTCH2 (notch receptor 2), SPTA1 (spectrin Alpha, erythrocytic 1), TPM1 (tropomyosin 1), which may be linked to oocyte maturation [76], and CAPZA2 (capping actin protein of muscle Z-line subunit Alpha 2) genes showed reduced expression. Their relationship with folliculogenesis requires more thorough studies and evidence.

5. Conclusions

The present study was based on estimation of CGs distribution in the cytoplasm of oocytes acquiring meiotic competence and determination of their gene expression profile. The above changes are caused by many factors and should be further studied. During the maturation of oocytes, the density of CGs in the cytoplasm decreases. It is also worth noting that the distribution of CGs during oocyte maturation becomes more peripheral and probably occurs in concert with cytoskeleton filaments inside the oocyte. The described ARHGEF2 and MAP1B genes, whose increased expression was observed during this study, are closely related to the development of the cytoskeleton, and may therefore constitute an important new marker for the acquisition of meiotic competence of the oocyte. Among the analyzed ontological groups of genes, the increased expression group only concerned genes from the “cellular component morphogenesis” group, which includes the previously mentioned ARHGEF2 and MAP1B genes. Significant changes in the expression level of the examined genes before and after IVM of porcine oocytes may indicate their potential use as markers of competence acquisition by the oocyte. However, it should be noted that our results may serve as a preliminary study and a reference point for subsequent studies. Additionally, the advantage of the study is the research on a pig model, whose genetic homology to humans is very high. Therefore, the obtained results could be used to improve methods of acquiring oocytes of the best competence of both animals and, after validation in humans, in carrying out in vitro fertilization.

Author Contributions

M.K.—formal analysis, investigation, writing—original draft; W.K.—data curation, investigation, methodology, writing—original draft; M.J. (Michal Jeseta)—data curation, investigation, methodology, writing—original draft; P.S.-K.—methodology, visualization; A.K.—methodology, visualization; S.C.—data curation, validation; P.C.—formal analysis, software, visualization, investigation; L.M.—formal analysis, investigation; I.K., M.J. (Małgorzata Józkowiak), J.K., H.P.-K., M.W.—data curation, validation; M.T.S.—software, resources; D.B.—data curation; M.M.—conceptualisation, writing—original draft, methodology; S.H.—data curation, investigation, methodology; P.M.—funding acquisition, supervision; J.M.J.—funding acquisition, resources; B.K.—project administration, supervision, writing—review and editing; P.A.—formal analysis, methodology, project administration. All authors have read and agreed to the published version of the manuscript.

Funding

This study was funded by grant number UMO-2016/21/B/NZ9/03535 from Polish National Centre of Science.

Acknowledgments

All of the contributors of this study have been listed as authors of the manuscript.

Conflicts of Interest

The authors declare no conflict of interest.

Abbreviations

APPAmyloid beta precursor protein gene
ARHGEF2Rho/Rac guanine nucleotide exchange factor 2 gene
BCBThe Brilliant Cresyl Blue staining
BFABrefeldin A—beta-lactam antibiotic
BFSBovine fetal serum
CAPZA2Capping actin protein of muscle Z-line subunit Alpha 2 gene
CCsCumulus cells
CDK6Cyclin dependent kinase 6 gene
CGsCortical granules
CTNNA2Catenin Alpha 2 gene
CXCL12C-X-C motif chemokine ligand 12 gene
CYR61Cellular communication network factor 1 gene
DAB2DAB adaptor protein 2 gene
DAVIDDatabase for Annotation, Visualization and Integrated Discovery
EDNRAEndothelin receptor type A gene
EGR2Early growth response 2 gene
FIFunctional interaction
FITCfluorescein isothiocyanate
FN1Fibronectin gene
Folr4Folate receptor 4, Juno
FSTFollistatin gene
GCsGranulosa cells
GJA1Gap junction protein Alpha 1
GJCsGap junctions connections
GO BPGene Ontology Biological Process term
GVGerminal vesicle stage
H&EHaematoxylin and eosin staining
hCGHuman chorionic gonadotropin
IcdgIndex of cortical granules distribution
IHHIndian hedgehog signalling molecule gene
INHBAInhibit subunit beta A gene
ITGB1Integrin subunit beta 1 gene
IVFIn vitro fertilization
IVMIn vitro maturation
IVPIn vitro production
KEGGKyoto Encyclopedia of Genes and Genomes
KITTyrosine kinase receptor gene
LAMB2Laminin subunit beta 2 gene
MAP1BMicrotubule associated protein 1B
MAP3K1Mitogen-activated protein kinase kinase kinase 1 gene
MFMedium follicles
MMP14Matrix metalloproteinase-14 gene
NEBLNebulette gene
NOTCH2Notch receptor 2 gene
OCsOocytes
OECsOviduct epithelial cells
Rab27aRas superfamily of GTPases
RMARobust Multiarray Averaging algorithm
ROBO2Roundabout guidance receptor 2 gene
RTN4Reticulon 4 gene
RYKReceptor like tyrosine kinase gene
SDF-1Stromal cell-derived factor gene
SEMA5A Semaphorin 5A gene
SFSmall follicles
SLITRK3SLIT and NTRK like family member 3 gene
SMAD4Mothers against decapentaplegic homolog 4 gene
SOX9SRY-box transcription factor 9 gene
SPTA1Spectrin Alpha, erythrocytic 1 gene
TGFBR3Transforming growth factor beta receptor 3 gene
TPM1Tropomyosin 1 gene
TUT4Terminal uridylyl transferase 4 gene
UBE2BUbiquitin conjugating enzyme E2 B gene
VEGFAVascular endothelial growth factor A gene
WWTR1WW domain containing transcription regulator 1 gene

Appendix A

Table A1. Oligonucleotide primers.
GeneGene IDPrimer Sequence (5’–3’)Product Size (bp)
VEGFA397157GCGGATCAAACCTCACCAAG
CGTCTGCGGATCTTGTACAA
233
CYR61100153791CTAGATGCTGCTCGGGTTTC
AGCTCCAAAATGAAGCAGGA
246
AR397582GGCAAAAGCAACGAAGAGAC
CGACTCGGATAGGCTGCTAC
188
EGR2100038004ACCCAGAAGGCATCATCAAC
GAGGGGTCCTGGTAGAGGTC
232
TACR3397457TCATTTATGCGCTTCACAGC
GTCTGGGTTTCAAGGGATCA
156
EDNRA100522395GGCCCTTTGAGAACCATGAC
GCTGTGACCAATGGAATCCC
223
NEBL397512CAAACCCTTCAAGGCTACCA
CTGAGAACACGCTTCCATCA
177
TGFBR3100518636TTTGTTTTAGCTGGGGGTTG
TGGCCACAGGGATTTTTAAG
177
GJA1445002ATGAGCAGTCTGCCTTTCGT
TTGGGCAACTTTGAGTTCCT
205
FST100525337CTGAGCACCTCCGACGAG
ACGTTTCTTTACATGGGATGC
100
RTN4100170118TGGTGCCTTGTTCAATGGTC
TTTTCGCTTCAATCCAGGGA
181
SLITRK3106504067CGTATTGAGAGTGGGGCATT
TCTGCCAATGTGGTCTAGCA
183
INHBA397093AAGCTTCATGTGGGCAAAGT
TCACTGCCCTCTTTGGAGAT
214
CDK6100518921GGTACAGAGCGCCAGAAGTC
GAGGCCAGTCCTCTTCTCCT
170
ROBO2101101688TCGTGGTGGAAAACTGATGA
CCTGGACCTGACAACGAAAT
157
LAMB2100517681ATTGAGCCATCCACTGAAGG
GTTGTCCCCCAGTGTGTGTA
153
IHH397174CTCCACTGCCCTCTCAGAAC
AGCTCGCAGCTGTGTCACTA
182
ZCCHC11100516979TGACACCTGAGCAGAGGCTA
ATGTGCTCCCTGGATGTTTT
167
APP397663CAAGGAAGGCATCTTGCAGT
CTAAGCAGCGGTACGGAATC
151
WWTR1100522573GCCACTGGCCAGAGATACTT
TCTGCTGCTGGTGATGATTC
160
CD9397067GGCTCCGATTTGACTCTCAG
CACCTGATCCTTGTGGGAAT
154
SEMA5A100737194CCTGGTTACGGGAGTTCAGA
TTCATCACACTCCCACTCCA
176
ITGB1397019AAATTCAAGCGAGCTGAGGA
TCCACAAAAGAGCCAAATCC
154
SMAD4397142CACAAGTCAGCCTGCCAGTA
ATAGGTGGGTGGTGCTGAAG
228
MAP3K1396617AGCCCAGACAACAAATACCG
TGCGTGAAACAAACTTCTGG
161
UBE2B100513527TGGCATCTCCACTATGAGCA
ACCTGCCTTGTTCAACCAAC
164
NOTCH2100153369CCAGGTTTCGAAGGCATCAC
AGCGGCAGTTGTAAGTGTTG
160
RYK100523513ATTTCTGCTCAGGGGGAAGT
GCTGCATGTACGGGATCATA
185
SPTA1100152068TGCTGACATCTTGGAGTGGA
TCACTCCATTCACTCGTCCC
153
KIT396810ACCATCCATCCATCCAGCAA
TGCTTTCTCCACGATCCACT
228
TPM1100037999CGCAAGTATGAAGAGGTGGC
CTCTTCTTCAAGCTCGGCAC
201
CAPZA2100037958ATGGTCGTTGGAGGTCAGAG
CTTTTGCTGTTTGCACCTCA
175
MMP14397471TCCAGAACTACACCCCCAAG
GCTGTCACCATGGAAACCTT
185
ARHGEF2100145887CCACAACCGCTGTAAAGACA
AAGCTGTCGGAGGGGTAGAT
205
FN1397620TGAGCCTGAAGAGACCTGCT
CAGCTCCAATGCAGGTACAG
113
MAP1B100519062TGGGACACAAACCTGATTGA
TCTGAGGGGTTGATCAGGAC
224
SOX9396840GACTCTGGGCAAACTCTGGA
AAGATGGCGTTGGGAGAGAT
183
CXCL12494460CCTTGCCGATTCTTTGAGAG
AGAGAGTGGGACTGGGTTTG
214
DAB2100519746CCGTGATGTGACAGACAACC
CTGCTTTGTTGGCTTCTTCC
170

References

  1. Rybska, M.; Knap, S.; Jankowski, M.; Jeseta, M.; Bukowska, D.; Antosik, P.; Nowicki, M.; Zabel, M.; Kempisty, B.; Jaśkowski, J.M. Cytoplasmic and nuclear maturation of oocytes in mammals—Living in the shadow of cells developmental capability. Med. J. Cell Biol. 2018, 6, 13–17. [Google Scholar] [CrossRef] [Green Version]
  2. Bianchi, E.; Doe, B.; Goulding, D.; Wright, G.J. Juno is the egg Izumo receptor and is essential for mammalian fertilization. Nature 2014, 508, 483–487. [Google Scholar] [CrossRef] [PubMed]
  3. Burkart, A.D.; Xiong, B.; Baibakov, B.; Jiménez-Movilla, M.; Dean, J. Ovastacin, a cortical granule protease, cleaves ZP2 in the zona pellucida to prevent polyspermy. J. Cell Biol. 2012, 197, 37–44. [Google Scholar] [CrossRef] [PubMed] [Green Version]
  4. Cheeseman, L.P.; Boulanger, J.; Bond, L.M.; Schuh, M. Two pathways regulate cortical granule translocation to prevent polyspermy in mouse oocytes. Nat. Commun. 2016, 7. [Google Scholar] [CrossRef]
  5. Wessel, G.M.; Conner, S.D.; Berg, L. Cortical granule translocation is microfilament mediated and linked to meiotic maturation in the sea urchin oocyte. Development 2002, 126, 567–576. [Google Scholar]
  6. Connors, S.A.; Kanatsu-Shinohara, M.; Schultz, R.M.; Kopf, G.S. Involvement of the Cytoskeleton in the Movement of Cortical Granules during Oocyte Maturation, and Cortical Granule Anchoring in Mouse Eggs. Dev. Biol. 1998, 200, 103–115. [Google Scholar] [CrossRef] [PubMed]
  7. Wang, H.H.; Cui, Q.; Zhang, T.; Wang, Z.B.; Ouyang, Y.C.; Shen, W.; Ma, J.Y.; Schatten, H.; Sun, Q.Y. Rab3A, Rab27A, and Rab35 regulate different events during mouse oocyte meiotic maturation and activation. Histochem. Cell Biol. 2016, 145, 647–657. [Google Scholar] [CrossRef]
  8. de Paola, M.; Bello, O.D.; Michaut, M.A. Cortical Granule Exocytosis Is Mediated by α-SNAP and N-Ethilmaleimide Sensitive Factor in Mouse Oocytes. PLoS ONE 2015, 10. [Google Scholar] [CrossRef]
  9. Kimura, K.; Kimura, A. Rab6 is required for the exocytosis of cortical granules and the recruitment of separase to the granules during the oocyte-to-embryo transition in Caenorhabditis elegans. J. Cell Sci. 2012, 125, 5897–5905. [Google Scholar] [CrossRef] [Green Version]
  10. Hulinska, P.; Martecikova, S.; Jeseta, M.; Machatkova, M. Efficiency of in vitro fertilization is influenced by the meiotic competence of porcine oocytes and time of their maturation. Anim. Reprod. Sci. 2011, 124, 112–117. [Google Scholar] [CrossRef]
  11. Schoevers, E.J.; Colenbrander, B.; Roelen, B.A.J. Developmental stage of the oocyte during antral follicle growth and cumulus investment determines in vitro embryo development of sow oocytes. Theriogenology 2007, 67, 1108–1122. [Google Scholar] [CrossRef] [PubMed]
  12. Machatkova, M.; Horakova, J.; Hulinska, P.; Reckova, Z.; Hanzalova, K. Early oocyte penetration can predict the efficiency of bovine embryo production in vitro. Zygote 2008, 16, 203–209. [Google Scholar] [CrossRef] [PubMed]
  13. Marchal, R.; Feugang, J.M.; Perreau, C.; Venturi, E.; Terqui, M.; Mermillod, P. Meiotic and developmental competence of prepubertal and adult swine oocytes. Theriogenology 2001, 56, 17–29. [Google Scholar] [CrossRef]
  14. Bagg, M.A.; Nottle, M.B.; Armstrong, D.T.; Grupen, C.G. Relationship between follicle size and oocyte developmental competence in prepubertal and adult pigs. Reprod. Fertil. Dev. 2007, 19, 797–803. [Google Scholar] [CrossRef] [PubMed]
  15. Sun, Q.Y.; Lai, L.; Bonk, A.; Prather, R.S.; Schatten, H. Cytoplasmic changes in relation to nuclear maturation and early embryo developmental potential of porcine oocytes: Effects of gonadotropins, cumulus cells, follicular size, and protein synthesis inhibition. Mol. Reprod. Dev. 2001, 59, 192–198. [Google Scholar] [CrossRef] [PubMed]
  16. Funahashi, H. Polyspermic penetration in porcine IVM-IVF systems. Reprod. Fertil. Dev. 2003, 15, 167–177. [Google Scholar] [CrossRef]
  17. Liu, M. The biology and dynamics of mammalian cortical granules. Reprod. Biol. Endocrinol. 2011, 9, 149. [Google Scholar] [CrossRef] [Green Version]
  18. Zhou, C.; Zhang, X.; ShiYang, X.; Wang, H.; Xiong, B. Tea polyphenol protects against cisplatin-induced meiotic defects in porcine oocytes. Aging (Albany N. Y.) 2019, 11, 4706–4719. [Google Scholar] [CrossRef]
  19. Gardner, A.J.; Knott, J.G.; Jones, K.T.; Evans, J.P. CaMKII can participate in but is not sufficient for the establishment of the membrane block to polyspermy in mouse eggs. J. Cell. Physiol. 2007, 212, 275–280. [Google Scholar] [CrossRef]
  20. Ducibella, T. The cortical reaction and development of activation competence in mammalian oocytes. Hum. Reprod. Update 1996, 2, 29–42. [Google Scholar] [CrossRef] [Green Version]
  21. Yoshida, M.; Cran, D.G.; Pursel, V.G. Confocal and fluorescence microscopic study using lectins of the distribution of cortical granules during the maturation and fertilization of pig oocytes. Mol. Reprod. Dev. 1993, 36, 462–468. [Google Scholar] [CrossRef] [PubMed]
  22. Wang, W.-H.; Sun, Q.-Y.; Hosoe, M.; Shioya, Y.; Day, B.N. Quantified Analysis of Cortical Granule Distribution and Exocytosis of Porcine Oocytes during Meiotic Maturation and Activation1. Biol. Reprod. 1997, 56, 1376–1382. [Google Scholar] [CrossRef]
  23. Wiesława, K.; Maurycy, J.; Joanna, B.; Piotr, C.; Ronza, K.; Artur, B.; Sylwia, B.; Marta, D.; Michal, J.; Magdalena, M.; et al. Amino acids metabolism and degradation is regulated during porcine oviductal epithelial cells (OECs) primary culture in vitro–signaling pathway activation approach. Med. J. Cell Biol. 2018, 6. [Google Scholar] [CrossRef] [Green Version]
  24. Budna, J.; Celichowski, P.; Knap, S.; Jankowski, M.; Magas, M.; Nawrocki, M.J.; Ramlau, P.; Nowicki, A.; Rojewska, M.; Chermuła, B.; et al. Fatty Acids Related Genes Expression Undergo Substantial Changes in Porcine Oviductal Epithelial Cells During Long-Term Primary Culture. Med. J. Cell Biol. 2018, 6, 39–47. [Google Scholar] [CrossRef] [Green Version]
  25. Kulus, M.; Sujka-kordowska, P.; Konwerska, A.; Celichowski, P.; Kranc, W.; Kulus, J.; Piotrowska-kempisty, H.; Antosik, P. New Molecular Markers Involved in Regulation of Ovarian Granulosa Cell Morphogenesis, Development and Di ff erentiation during Short-Term Primary In Vitro Culture—Transcriptomic and Histochemical Study Based on Ovaries and Individual Separated Follicle. Int. J. Mol. Sci. 2019, 20, 3966. [Google Scholar] [CrossRef] [PubMed] [Green Version]
  26. Stefańska, K.; Kocherova, I.; Knap, S.; Kulus, M.; Celichowski, P.; Jeseta, M. The genes regulating maintenance of cellular protein location are differentially expressed in porcine epithelial oviductal cells during longterm in vitro cultivation. Med. J. Cell Biol. 2019, 7, 77–85. [Google Scholar] [CrossRef] [Green Version]
  27. Chamier-Gliszczyńska, A.; Kałuzna, S.; Stefańska, K.; Celichowski, P.; Antosik, P.; Bukowska, D.; Bruska, M.; Zakova, J.; Machatkova, M.; Jeseta, M.; et al. Analysis of expression of genes responsible for regulation of cellular proliferation and migration-Microarray approach based on porcine oocyte model. Med. J. Cell Biol. 2019, 7, 48–57. [Google Scholar] [CrossRef] [Green Version]
  28. Walter, W.; Sánchez-Cabo, F.; Ricote, M. GOplot: An R package for visually combining expression data with functional analysis: Fig. 1. Bioinformatics 2015, 31, 2912–2914. [Google Scholar] [CrossRef]
  29. Kocherova, I.; Kulus, M.; Dompe, C.; Antosik, P.; Bukowska, D. Biochemical properties of cofactor and coenzyme metabolism in porcine oviductal epithelial cells—A microarray study. Med. J. Cell Biol. 2019, 7, 125–133. [Google Scholar] [CrossRef] [Green Version]
  30. Yanez, L.Z.; Han, J.; Behr, B.B.; Pera, R.A.R.; Camarillo, D.B. Human oocyte developmental potential is predicted by mechanical properties within hours after fertilization. Nat. Commun. 2016, 7. [Google Scholar] [CrossRef] [Green Version]
  31. Krendel, M.; Zenke, F.T.; Bokoch, G.M. Nucleotide exchange factor GEF-H1 mediates cross-talk between microtubules and the actin cytoskeleton. Nat. Cell Biol. 2002, 4, 294–301. [Google Scholar] [CrossRef]
  32. Aznar, S.; Fernández-Valerón, P.; Espina, C.; Lacal, J.C. Rho GTPases: Potential candidates for anticancer therapy. Cancer Lett. 2004, 206, 181–191. [Google Scholar] [CrossRef]
  33. Zhong, Z.-S.; Huo, L.-J.; Liang, C.-G.; Chen, D.-Y.; Sun, Q.-Y. Small GTPase RhoA is required for ooplasmic segregation and spindle rotation, but not for spindle organization and chromosome separation during mouse oocyte maturation, fertilization, and early cleavage. Mol. Reprod. Dev. 2005, 71, 256–261. [Google Scholar] [CrossRef] [PubMed]
  34. Zhang, Y.; Duan, X.; Cao, R.; Liu, H.-L.; Cui, X.-S.; Kim, N.-H.; Rui, R.; Sun, S.-C. Small GTPase RhoA regulates cytoskeleton dynamics during porcine oocyte maturation and early embryo development. Cell Cycle 2014, 13, 3390–3403. [Google Scholar] [CrossRef] [PubMed] [Green Version]
  35. Tan, K.; An, L.; Wang, S.-M.; Wang, X.-D.; Zhang, Z.-N.; Miao, K.; Sui, L.-L.; He, S.-Z.; Nie, J.-Z.; Wu, Z.-H.; et al. Actin Disorganization Plays a Vital Role in Impaired Embryonic Development of In Vitro-Produced Mouse Preimplantation Embryos. PLoS ONE 2015, 10, e0130382. [Google Scholar] [CrossRef] [PubMed]
  36. Hoelker, M.; Salilew-Wondim, D.; Drillich, M.; Christine, G.-B.; Ghanem, N.; Goetze, L.; Tesfaye, D.; Schellander, K.; Heuwieser, W. Transcriptional response of the bovine endometrium and embryo to endometrial polymorphonuclear neutrophil infiltration as an indicator of subclinical inflammation of the uterine environment. Reprod. Fertil. Dev. 2012, 24, 778. [Google Scholar] [CrossRef] [PubMed]
  37. Villarroel-Campos, D.; Gonzalez-Billault, C. The MAP1B case: An old MAP that is new again. Dev. Neurobiol. 2014, 74, 953–971. [Google Scholar] [CrossRef] [PubMed]
  38. Gödel, M.; Temerinac, D.; Grahammer, F.; Hartleben, B.; Kretz, O.; Riederer, B.M.; Propst, F.; Kohl, S.; Huber, T.B. Microtubule Associated Protein 1b (MAP1B) Is a Marker of the Microtubular Cytoskeleton in Podocytes but Is Not Essential for the Function of the Kidney Filtration Barrier in Mice. PLoS ONE 2015, 10, e0140116. [Google Scholar] [CrossRef] [Green Version]
  39. Kim, J.-M.; Park, J.-E.; Yoo, I.; Han, J.; Kim, N.; Lim, W.-J.; Cho, E.-S.; Choi, B.; Choi, S.; Kim, T.-H.; et al. Integrated transcriptomes throughout swine oestrous cycle reveal dynamic changes in reproductive tissues interacting networks. Sci. Rep. 2018, 8, 5436. [Google Scholar] [CrossRef]
  40. Zhao, W.; Shahzad, K.; Jiang, M.; Graugnard, D.E.; Rodriguez-Zas, S.L.; Luo, J.; Loor, J.J.; Hurley, W.L. Bioinformatics and Gene Network Analyses of the Swine Mammary Gland Transcriptome during Late Gestation. Bioinform. Biol. Insights 2013, 7, 193–216. [Google Scholar] [CrossRef] [Green Version]
  41. Terenina, E.; Fabre, S.; Bonnet, A.; Monniaux, D.; Robert-Granié, C.; SanCristobal, M.; Sarry, J.; Vignoles, F.; Gondret, F.; Monget, P.; et al. Differentially expressed genes and gene networks involved in pig ovarian follicular atresia. Physiol. Genom. 2017, 49, 67–80. [Google Scholar] [CrossRef]
  42. Hatzirodos, N.; Hummitzsch, K.; Irving-Rodgers, H.F.; Rodgers, R.J. Transcriptome comparisons identify new cell markers for theca interna and granulosa cells from small and large antral ovarian follicles. PLoS ONE 2015, 10. [Google Scholar] [CrossRef] [Green Version]
  43. Budna, J.; Bryja, A.; Celichowski, P.; Kahan, R.; Kranc, W.; Ciesiółka, S.; Rybska, M.; Borys, S.; Jeseta, M.; Bukowska, D.; et al. Genes of cellular components of morphogenesis in porcine oocytes before and after IVM. Reproduction 2017, 154, 535–545. [Google Scholar] [CrossRef]
  44. Schuh, M. An actin-dependent mechanism for long range vesicle transport. Nat. Cell Biol. 2011, 13, 1431. [Google Scholar] [CrossRef]
  45. Cui, Z.; Yu, L.; Shi Yang, X.; Zhang, Y.; Shi, X.; Li, Y.; Chen, Q.; Xiong, B. Brefeldin A impairs porcine oocyte meiotic maturation via interruption of organelle dynamics. J. Cell. Physiol. 2019, 234, 20111–20117. [Google Scholar] [CrossRef] [PubMed]
  46. Miao, Y.; Zhou, C.; Cui, Z.; Tang, L.; ShiYang, X.; Lu, Y.; Zhang, M.; Dai, X.; Xiong, B. Dynein promotes porcine oocyte meiotic progression by maintaining cytoskeletal structures and cortical granule arrangement. Cell Cycle 2017, 16, 2139–2145. [Google Scholar] [CrossRef] [PubMed] [Green Version]
  47. Gieryng, A.; Bogunia-Kubik, K. Znaczenie interakcji między SDF-1 i CXCR4 w hematopoezie i mobilizacji macierzystych komórek hematopoetycznych do krwi obwodowej. Postepy Hig. Med. Dosw. 2007, 61, 369–383. [Google Scholar]
  48. Kulus, M.; Kulus, J.; Jankowski, M.; Borowiec, B.; Jeseta, M.; Bukowska, D.; Brüssow, K.P.; Kempisty, B.; Antosik, P. The use of mesenchymal stem cells in veterinary medicine. Med. J. Cell Biol. 2018, 6, 101–107. [Google Scholar] [CrossRef] [Green Version]
  49. Lorenz, M.; Mozdziak, P.; Kempisty, B.; Dyszkiewicz-konwińska, M. Application potential and plasticity of human stem cells. Med J. Cell Boil. 2019, 7, 140–145. [Google Scholar] [CrossRef] [Green Version]
  50. Zuccarello, D.; Ferlin, A.; Garolla, A.; Menegazzo, M.; Perilli, L.; Ambrosini, G.; Foresta, C. How the human spermatozoa sense the oocyte: A new role of SDF1-CXCR4 signalling. Int. J. Androl. 2011, 34, e554–e565. [Google Scholar] [CrossRef]
  51. Dyszkiewicz-Konwińska, M.; Bryja, A.; Jopek, K.; Budna, J.; Khozmi, R.; Jeseta, M.; Bukowska, D.; Antosik, P.; Bruska, M.; Nowicki, M.; et al. Expression of genes responsible for cell morphogenesis involved in differentiation in porcine buccal pouch mucosal cells during long-term primary culture and real-time proliferation in vitro. J. Biol. Regul. Homeost. Agents 2017, 31, 855–864. [Google Scholar]
  52. Kryczek, I.; Lange, A.; Mottram, P.; Alvarez, X.; Cheng, P.; Hogan, M.; Moons, L.; Wei, S.; Zou, L.; Machelon, V.; et al. CXCL12 and Vascular Endothelial Growth Factor Synergistically Induce Neoangiogenesis in Human Ovarian Cancers. Cancer Res. 2005, 65, 465–472. [Google Scholar] [PubMed]
  53. Nishigaki, A.; Okada, H.; Okamoto, R.; Shimoi, K.; Miyashiro, H.; Yasuda, K.; Kanzaki, H. The concentration of human follicular fluid stromal cell-derived factor-1 is correlated with luteinization in follicles. Gynecol. Endocrinol. 2013, 29, 230–234. [Google Scholar] [CrossRef] [PubMed]
  54. Chao, W.-T.; Kunz, J. Focal adhesion disassembly requires clathrin-dependent endocytosis of integrins. FEBS Lett. 2009, 583, 1337–1343. [Google Scholar] [CrossRef] [PubMed] [Green Version]
  55. Moncrieff, L.; Mozdziak, P.; Jeseta, M.; Machatkova, M.; Kranc, W. Ovarian follicular cells–living in the shadow of stemness cellular competence. Med J. Cell Boil. 2019, 7, 134–140. [Google Scholar] [CrossRef] [Green Version]
  56. Stefańska, K.; Chamier-Gliszczyńska, A.; Jankowski, M.; Celichowski, P.; Kulus, M.; Rojewska, M.; Antosik, P.; Bukowska, D.; Bruska, M.; Nowicki, M.; et al. Epithelium morphogenesis and oviduct development are regulated by significant increase of expression of genes after long-term in vitro primary culture—A microarray assays. Med. J. Cell Biol. 2018, 6, 195–204. [Google Scholar] [CrossRef] [Green Version]
  57. Mok, S.C.; Wong, K.-K.; Chan, R.K.W.; Lau, C.C.; Tsao, S.-W.; Knapp, R.C.; Berkowitz, R.S. Molecular Cloning of Differentially Expressed Genes in Human Epithelial Ovarian Cancer. Gynecol. Oncol. 1994, 52, 247–252. [Google Scholar] [CrossRef]
  58. Hocevar, B.A.; Smine, A.; Xu, X.X.; Howe, P.H. The adaptor molecule Disabled-2 links the transforming growth factor β receptors to the Smad pathway. Embo J. 2001, 20, 2789–2801. [Google Scholar] [CrossRef]
  59. Benito-Jardón, M.; Klapproth, S.; Gimeno-LLuch, I.; Petzold, T.; Bharadwaj, M.; Müller, D.J.; Zuchtriegel, G.; Reichel, C.A.; Costell, M. The fibronectin synergy site re-enforces cell adhesion and mediates a crosstalk between integrin classes. Elife 2017, 6. [Google Scholar] [CrossRef]
  60. Chermuła, B.; Brązert, M.; Iżycki, D.; Ciesiółka, S.; Kranc, W.; Celichowski, P.; Ożegowska, K.; Nawrocki, M.J.; Jankowski, M.; Jeseta, M.; et al. New Gene Markers of Angiogenesis and Blood Vessels Development in Porcine Ovarian Granulosa Cells during Short-Term Primary Culture In Vitro. Biomed Res. Int. 2019, 2019, 6545210. [Google Scholar] [CrossRef]
  61. Gonen, N.; Quinn, A.; O’Neill, H.C.; Koopman, P.; Lovell-Badge, R. Normal Levels of Sox9 Expression in the Developing Mouse Testis Depend on the TES/TESCO Enhancer, but This Does Not Act Alone. PLoS Genet. 2017, 13, e1006520. [Google Scholar]
  62. Uhlenhaut, N.H.; Jakob, S.; Anlag, K.; Eisenberger, T.; Sekido, R.; Kress, J.; Treier, A.-C.; Klugmann, C.; Klasen, C.; Holter, N.I.; et al. Somatic Sex Reprogramming of Adult Ovaries to Testes by FOXL2 Ablation. Cell 2009, 139, 1130–1142. [Google Scholar] [CrossRef] [PubMed] [Green Version]
  63. Li, J.; Dong, S. The Signaling Pathways Involved in Chondrocyte Differentiation and Hypertrophic Differentiation. Stem Cells Int. 2016, 2016, 1–12. [Google Scholar] [CrossRef] [PubMed] [Green Version]
  64. Montero, J.A.; Lorda-Diez, C.I.; Francisco-Morcillo, J.; Chimal-Monroy, J.; Garcia-Porrero, J.A.; Hurle, J.M. Sox9 Expression in Amniotes: Species-Specific Differences in the Formation of Digits. Front. Cell Dev. Biol. 2017, 5, 23. [Google Scholar] [CrossRef] [PubMed] [Green Version]
  65. Di Giancamillo, A.; Deponti, D.; Modina, S.; Tessaro, I.; Domeneghini, C.; Peretti, G.M. Age-related modulation of angiogenesis-regulating factors in the swine meniscus. J. Cell. Mol. Med. 2017, 21, 3066–3075. [Google Scholar] [CrossRef]
  66. Kempisty, B.; Ziółkowska, A.; Ciesiółka, S.; Piotrowska, H.; Antosik, P.; Bukowska, D.; Nowicki, M.; Brüssow, K.P.; Zabel, M. Study on connexin gene and protein expression and cellular distribution in relation to real-time proliferation of porcine granulosa cells. J. Biol. Regul. Homeost. Agents 2014, 28, 625–635. [Google Scholar]
  67. Rybska, M.; Knap, S.; Jankowski, M.; Jeseta, M.; Bukowska, D.; Antosik, P.; Nowicki, M.; Zabel, M.; Kempisty, B.; Jaśkowski, J.M. Characteristic of factors influencing the proper course of folliculogenesis in mammals. Med. J. Cell Biol. 2018, 6, 33–38. [Google Scholar] [CrossRef] [Green Version]
  68. Kempisty, B.; Ziółkowska, A.; Piotrowska, H.; Ciesiółka, S.; Antosik, P.; Bukowska, D.; Zawierucha, P.; Woźna, M.; Jaśkowski, J.M.; Brüssow, K.P.; et al. Short-term cultivation of porcine cumulus cells influences the cyclin-dependent kinase 4 (Cdk4) and connexin 43 (Cx43) protein expression--a real-time cell proliferation approach. J. Reprod. Dev. 2013, 59, 339–345. [Google Scholar] [CrossRef] [Green Version]
  69. Simon, A.M.; Goodenough, D.A.; Li, E.; Paul, D.L. Female infertility in mice lacking connexin 37. Nature 1997, 385, 525–529. [Google Scholar] [CrossRef] [PubMed]
  70. Wang, H.X.; Tong, D.; El-Gehani, F.; Tekpetey, F.R.; Kidder, G.M. Connexin expression and gap junctional coupling in human cumulus cells: Contribution to embryo quality. J. Cell. Mol. Med. 2009, 13, 972–984. [Google Scholar] [CrossRef] [PubMed]
  71. Li, S.-H.; Lin, M.-H.; Hwu, Y.-M.; Lu, C.-H.; Yeh, L.-Y.; Chen, Y.-J.; Lee, R.K.-K. Correlation of cumulus gene expression of GJA1, PRSS35, PTX3, and SERPINE2 with oocyte maturation, fertilization, and embryo development. Reprod. Biol. Endocrinol. 2015, 13, 93. [Google Scholar] [CrossRef] [PubMed] [Green Version]
  72. Shao, L.; Chian, R.-C.; Xu, Y.; Yan, Z.; Zhang, Y.; Gao, C.; Gao, L.; Liu, J.; Cui, Y. Genomic expression profiles in cumulus cells derived from germinal vesicle and MII mouse oocytes. Reprod. Fertil. Dev. 2016, 28, 1798. [Google Scholar] [CrossRef]
  73. Cao, R.; Wu, W.; Zhou, X.; Liu, K.; Li, B.; Huang, X.; Zhang, Y.; Liu, H. Let-7g induces granulosa cell apoptosis by targeting MAP3K1 in the porcine ovary. Int. J. Biochem. Cell Biol. 2015, 68, 148–157. [Google Scholar] [CrossRef] [PubMed]
  74. Fan, H.-Y.; Liu, Z.; Shimada, M.; Sterneck, E.; Johnson, P.F.; Hedrick, S.M.; Richards, J.S. MAPK3/1 (ERK1/2) in Ovarian Granulosa Cells Are Essential for Female Fertility. Science 2009, 324, 938–941. [Google Scholar] [CrossRef] [PubMed] [Green Version]
  75. Borys-Wójcik, S.; Kocherova, I.; Celichowski, P.; Popis, M.; Jeseta, M.; Bukowska, D.; Antosik, P.; Nowicki, M.; Kempisty, B. Protein oligomerization is the biochemical process highly up-regulated in porcine oocytes before in vitro maturation (IVM). Med. J. Cell Biol. 2018, 6, 155–162. [Google Scholar] [CrossRef] [Green Version]
  76. Kranc, W.; Budna, J.; Chachuła, A.; Borys, S.; Bryja, A.; Rybska, M.; Ciesiółka, S.; Sumelka, E.; Jeseta, M.; Brüssow, K.P.; et al. Cell Migration Is the Ontology Group Differentially Expressed in Porcine Oocytes before and after in Vitro Maturation: A Microarray Approach. DNA Cell Biol. 2017, 36, 273–282. [Google Scholar] [CrossRef]
  77. Lee, R.; Lee, W.-Y.; Park, H.-J.; Ha, W.-T.; Woo, J.-S.; Chung, H.-J.; Lee, J.-H.; Hong, K.; Song, H. Stage-specific expression of DDX4 and c-kit at different developmental stages of the porcine testis. Anim. Reprod. Sci. 2018, 190, 18–26. [Google Scholar] [CrossRef]
  78. Saatcioglu, H.D.; Cuevas, I.; Castrillon, D.H. Control of Oocyte Reawakening by Kit. PLoS Genet. 2016, 12, e1006215. [Google Scholar] [CrossRef]
  79. Moniruzzaman, M.; Miyano, T. KIT-KIT Ligand in the Growth of Porcine Oocytes in Primordial Follicles. J. Reprod. Dev. 2007, 53, 1273–1281. [Google Scholar] [CrossRef] [Green Version]
  80. Sternlicht, M.; Werb, Z. How Matrix metalloproteinases regulate cell behavior. Annu. Rev. Cell. Biol. 2009, 463–516. [Google Scholar] [CrossRef] [Green Version]
  81. Hägglund, A.C.; Ny, A.; Leonardsson, G.; Ny, T. Regulation and localization of matrix metalloproteinases and tissue inhibitors of metalloproteinases in the mouse ovary during gonadotropin-induced ovulation. Endocrinology 1999, 140, 4351–4358. [Google Scholar] [CrossRef] [PubMed]
  82. Puttabyatappa, M.; Jacot, T.A.; Al-Alem, L.F.; Rosewell, K.L.; Duffy, D.M.; Brännström, M.; Curry, T.E. Ovarian Membrane-Type Matrix Metalloproteinases: Induction of MMP14 and MMP16 During the Periovulatory Period in the Rat, Macaque, and Human1. Biol. Reprod. 2014, 91. [Google Scholar] [CrossRef] [Green Version]
  83. Bakke, L.J.; Dow, M.P.; Cassar, C.A.; Peters, M.W.; Pursley, J.R.; Smith, G.W. Effect of the preovulatory gonadotropin surge on matrix metalloproteinase (MMP)-14, MMP-2, and tissue inhibitor of metalloproteinases-2 expression within bovine periovulatory follicular and luteal tissue. Biol. Reprod. 2002, 66, 1627–1634. [Google Scholar] [CrossRef] [PubMed] [Green Version]
  84. Kempisty, B.; Piotrowska, H.; Rybska, M.; Woźna, M.; Antosik, P.; Bukowska, D.; Zawierucha, P.; Ciesiółka, S.; Jaśkowski, J.M.; Nowicki, M.; et al. Expression of INHβA and INHβB proteins in porcine oocytes cultured in vitro is dependent on the follicle size. Zygote 2015, 23, 205–211. [Google Scholar] [CrossRef] [PubMed] [Green Version]
  85. Matzuk, M.M.; Brown, C.W.; Houston-Hawkins, D.E.; Woodruff, T.K. Insertion of Inhbb into the Inhba locus rescues the Inhba-null phenotype and reveals new activin functions. Nat. Genet. 2000, 25, 453–457. [Google Scholar]
  86. Richani, D.; Constance, K.; Lien, S.; Agapiou, D.; Stocker, W.A.; Hedger, M.P.; Ledger, W.L.; Thompson, J.G.; Robertson, D.M.; Mottershead, D.G.; et al. Cumulin and FSH Cooperate to Regulate Inhibin B and Activin B Production by Human Granulosa-Lutein Cells In Vitro. Endocrinology 2019, 160, 853–862. [Google Scholar] [CrossRef]
  87. Kempisty, B.; Jackowska, M.; Woźna, M.; Antosik, P.; Piotrowska, H.; Zawierucha, P.; Bukowska, D.; Jaśkowski, J.M.; Nowicki, M.; Brüssow, K.P. Expression and cellular distribution of INHA and INHB before and after in vitro cultivation of porcine oocytes isolated from follicles of different size. J. Biomed. Biotechnol. 2012, 2012, 742829. [Google Scholar] [CrossRef] [Green Version]
  88. Ohnuma, K.; Kaneko, H.; Noguchi, J.; Kikuchi, K.; Ozawa, M.; Hasegawa, Y. Production of inhibin A and inhibin B in boars: Changes in testicular and circulating levels of dimeric inhibins and characterization of inhibin forms during testis growth. Domest. Anim. Endocrinol. 2007, 33, 410–421. [Google Scholar] [CrossRef]
  89. Nguyen, T.; Lee, S.; Hatzirodos, N.; Hummitzsch, K.; Sullivan, T.R.; Rodgers, R.J.; Irving-Rodgers, H.F. Spatial differences within the membrana granulosa in the expression of focimatrix and steroidogenic capacity. Mol. Cell. Endocrinol. 2012, 363, 62–73. [Google Scholar] [CrossRef]
  90. Du, X.; Pan, Z.; Li, Q.; Liu, H.; Li, Q. SMAD4 feedback regulates the canonical TGF-β signaling pathway to control granulosa cell apoptosis. Cell Death Dis. 2018, 9, 151. [Google Scholar] [CrossRef]
  91. Li, Q.; Du, X.; Pan, Z.; Zhang, L.; Li, Q. The transcription factor SMAD4 and miR-10b contribute to E2 release and cell apoptosis in ovarian granulosa cells by targeting CYP19A1. Mol. Cell. Endocrinol. 2018, 476, 84–95. [Google Scholar] [CrossRef] [PubMed]
  92. Wang, W.; Chen, X.; Li, X.; Wang, L.; Zhang, H.; He, Y.; Wang, J.; Zhao, Y.; Zhang, B.; Xu, Y. Interference RNA-based silencing of endogenous SMAD4 in porcine granulosa cells resulted in decreased FSH-mediated granulosa cells proliferation and steroidogenesis. Reproduction 2011, 141, 643–651. [Google Scholar] [CrossRef] [PubMed] [Green Version]
  93. Matsumoto, H.; Zhao, X.; Das, S.K.; Hogan, B.L.M.; Dey, S.K. Indian Hedgehog as a Progesterone-Responsive Factor Mediating Epithelial–Mesenchymal Interactions in the Mouse Uterus. Dev. Biol. 2002, 245, 280–290. [Google Scholar] [CrossRef] [PubMed]
  94. Goossens, K.; Van Soom, A.; Van Zeveren, A.; Favoreel, H.; Peelman, L.J. Quantification of Fibronectin 1 (FN1) splice variants, including two novel ones, and analysis of integrins as candidate FN1 receptors in bovine preimplantation embryos. Bmc Dev. Biol. 2009, 9, 1. [Google Scholar] [CrossRef] [Green Version]
  95. Jankovicova, J.; Secova, P.; Manaskova-Postlerova, P.; Simonik, O.; Frolikova, M.; Chmelikova, E.; Horovska, L.; Michalkova, K.; Dvorakova-Hortova, K.; Antalikova, J. Detection of CD9 and CD81 tetraspanins in bovine and porcine oocytes and embryos. Int. J. Biol. Macromol. 2019, 123, 931–938. [Google Scholar] [CrossRef]
  96. Runge, K.E.; Evans, J.E.; He, Z.-Y.; Gupta, S.; McDonald, K.L.; Stahlberg, H.; Primakoff, P.; Myles, D.G. Oocyte CD9 is enriched on the microvillar membrane and required for normal microvillar shape and distribution. Dev. Biol. 2007, 304, 317–325. [Google Scholar] [CrossRef] [Green Version]
  97. Schneyer, A.; Sidis, Y.; Xia, Y.; Saito, S.; Del Re, E.; Lin, H.Y.; Keutmann, H. Differential actions of follistatin and follistatin-like 3. Mol. Cell. Endocrinol. 2004, 225, 25–28. [Google Scholar]
  98. Tortoriello, D.V.; Sidis, Y.; Holtzman, D.A.; Holmes, W.E.; Schneyer, A.L. Human follistatin-related protein: A structural homologue of follistatin with nuclear localization. Endocrinology 2001, 142, 3426–3434. [Google Scholar] [CrossRef]
  99. Yao, H.H.C.; Matzuk, M.M.; Jorgez, C.J.; Menke, D.B.; Page, D.C.; Swain, A.; Capel, B. Follistatin operates downstream ofWnt4 in mammalian ovary organogenesis. Dev. Dyn. 2004, 230, 210–215. [Google Scholar] [CrossRef] [Green Version]
  100. Wang, Y.; Ge, W. Developmental profiles of activin betaA, betaB, and follistatin expression in the zebrafish ovary: Evidence for their differential roles during sexual maturation and ovulatory cycle. Biol. Reprod. 2004, 71, 2056–2064. [Google Scholar] [CrossRef]
  101. Zand-Vakili, M.; Golkar-Narenji, A.; Mozdziak, P.E.; Eimani, H. An in vitro study on oocyte and follicles of transplanted ovaries treated with vascular endothelial growth factor. J. Turk. Ger. Gynecol. Assoc. 2017, 18, 167–173. [Google Scholar] [CrossRef] [PubMed]
  102. Hanna, M.; Liu, H.; Amir, J.; Sun, Y.; Morris, S.W.; Siddiqui, M.A.Q.; Lau, L.F.; Chaqour, B. Mechanical regulation of the proangiogenic factor CCN1/CYR61 gene requires the combined activities of MRTF-A and CREB-binding protein histone acetyltransferase. J. Biol. Chem. 2009, 284, 23125–23136. [Google Scholar] [CrossRef] [PubMed] [Green Version]
  103. Lau, L.F. CCN1/CYR61: The very model of a modern matricellular protein. Cell. Mol. Life Sci. 2011, 68, 3149–3163. [Google Scholar] [CrossRef] [PubMed] [Green Version]
  104. Bigham, A.W.; Julian, C.G.; Wilson, M.J.; Vargas, E.; Browne, V.A.; Shriver, M.D.; Moore, L.G. Maternal PRKAA1 and EDNRA genotypes are associated with birth weight, and PRKAA1 with uterine artery diameter and metabolic homeostasis at high altitude. Physiol. Genom. 2014, 46, 687–697. [Google Scholar] [CrossRef] [PubMed] [Green Version]
  105. DeLaughter, D.M.; Clark, C.R.; Christodoulou, D.C.; Seidman, C.E.; Baldwin, H.S.; Seidman, J.G.; Barnett, J.V. Transcriptional Profiling of Cultured, Embryonic Epicardial Cells Identifies Novel Genes and Signaling Pathways Regulated by TGFβR3 In Vitro. PLoS ONE 2016, 11, e0159710. [Google Scholar] [CrossRef]
  106. Sevilla, T.; Sivera, R.; Martínez-Rubio, D.; Lupo, V.; Chumillas, M.J.; Calpena, E.; Dopazo, J.; Vílchez, J.J.; Palau, F.; Espinós, C. The EGR2 gene is involved in axonal Charcot−Marie−Tooth disease. Eur. J. Neurol. 2015, 22, 1548–1555. [Google Scholar] [CrossRef]
  107. Vite, A.; Li, J.; Radice, G.L. New functions for α-catenins in health and disease: From cancer to heart regeneration. Cell Tissue Res. 2015, 360, 773–783. [Google Scholar] [CrossRef] [Green Version]
  108. Watari, A.; Yutsudo, M. Multi-functional gene ASY/Nogo/RTN-X/RTN4: Apoptosis, tumor suppression, and inhibition of neuronal regeneration. Apoptosis 2003, 8, 5–9. [Google Scholar] [CrossRef]
  109. Wang, C.-J.; Zhang, Z.-Z.; Xu, J.; Wang, M.; Zhao, W.-Y.; Tu, L.; Zhuang, C.; Liu, Q.; Shen, Y.-Y.; Cao, H.; et al. SLITRK3 expression correlation to gastrointestinal stromal tumor risk rating and prognosis. World. J. Gastroenterol. 2015, 21, 8398. [Google Scholar] [CrossRef]
  110. Kidd, T.; Brose, K.; Mitchell, K.J.; Fetter, R.D.; Tessier-Lavigne, M.; Goodman, C.S.; Tear, G. Roundabout Controls Axon Crossing of the CNS Midline and Defines a Novel Subfamily of Evolutionarily Conserved Guidance Receptors. Cell 1998, 92, 205–215. [Google Scholar] [CrossRef] [Green Version]
  111. Wu, Y.; Zhang, S.; Xu, Q.; Zou, H.; Zhou, W.; Cai, F.; Li, T.; Song, W. Regulation of global gene expression and cell proliferation by APP. Sci. Rep. 2016, 6, 22460. [Google Scholar] [CrossRef] [Green Version]
  112. Purohit, A.; Sadanandam, A.; Myneni, P.; Singh, R.K. Semaphorin 5A mediated cellular navigation: Connecting nervous system and cancer. Biochim. Biophys. Acta Rev. Cancer 2014, 1846, 485–493. [Google Scholar] [CrossRef] [PubMed] [Green Version]
  113. Onishi, K.; Hollis, E.; Zou, Y. Axon guidance and injury—Lessons from Wnts and Wnt signaling. Curr. Opin. Neurobiol. 2014, 27, 232–240. [Google Scholar] [CrossRef] [PubMed] [Green Version]
Figure 1. Cortical granule localization before in vitro maturation (IVM). Representative images of porcine oocytes after isolation of oocytes from small (a) and medium (b) follicles. Oocytes were stained by PNA-labeled FITC (green color—cortical granules). Scale bar represents 20 µm.
Genes 11 00815 g001
Figure 2. Cortical granule density after IVM. Representative images of porcine oocytes periphery after 44 h maturation in oocytes from small (A) and medium (B) follicles. Oocytes were stained by PNA-labeled FITC (green color—cortical granules). Scale bar represents 10 µm. The mean (±SD) of cortical granule density was significantly higher in oocytes from small follicles than in oocytes from medium follicles (C).
Genes 11 00815 g002
Figure 3. Paraffin section of porcine ovary stained with hematoxylin and eosin (H&E), representing the histological structure of ovary and follicles in particular stages of maturation. (A,B)—representative ovaries with visible follicles in small magnification; (C)—primordial follicles, (D)—primary follicle, (E)—secondary follicle, (F)—Graafian follicle. Arrows: 1—germinal epithelium, 2—tunica albuginea, 3—primordial follicle, 4—oocyte, 5—follicular cells, 6—primary oocyte, 7—granulosa cells, 8—secondary follicle, 9—tunica interna and externa, 10—antrum, 11—zona pellucida, 12—Graafian (mature) follicle, 13—corona radiate, 14—cumulus oophorum.
Genes 11 00815 g003
Figure 4. Heat map representations of differentially expressed genes belonging to “cellular component morphogenesis”, “negative regulation of cell differentiation”, “morphogenesis of a branching structure”, “regulation of cellular component size”, and “branching morphogenesis of a tube” GO BP terms. Arbitrary signal intensity acquired from microarray analysis is represented by colors (green, higher; red, lower expression). Log2 signal intensity values for any single gene were resized to Row Z-Score scale (from −2, the lowest expression to +2, the highest expression for single gene).
Genes 11 00815 g004
Figure 5. Circle plot showing the differently expressed genes and Z-scores of the “cellular component morphogenesis”, “negative regulation of cell differentiation”, “morphogenesis of a branching structure”, “regulation of cellular component size”, and “branching morphogenesis of a tube” Gene Ontology Biological Process (GO BP) terms. The outer circle shows a scatter plot for each term of the fold change of the assigned genes. Green circles represent upregulation and red ones represent downregulation. The inner circle shows the Z-score of each GO BP term. The width of each bar corresponds to the number of genes within GO BP term and the color corresponds to the Z-score.
Genes 11 00815 g005
Figure 6. The representation of the mutual relationship between differently expressed genes that belong to the “cellular component morphogenesis”, “negative regulation of cell differentiation”, “morphogenesis of a branching structure”, “regulation of cellular component size”, and “branching morphogenesis of a tube” GO BP terms. The ribbons indicate the genes belonging to specific categories. The middle circle represents logarithm from fold change (LogFC). The genes were sorted by logFC by differences in gene expression. The color of the each LogFC bar corresponds to the LogFC value.
Genes 11 00815 g006
Figure 7. Heatmap showing the gene occurrence between differently expressed genes that belong to the “cellular component morphogenesis”, “negative regulation of cell differentiation”, “morphogenesis of a branching structure”, “regulation of cellular component size”, and “branching morphogenesis of a tube” GO BP terms. The yellow color is associated with gene occurrence in the GO Term. The intensity of the color corresponds to the amount of GO BP terms that each gene belongs to.
Genes 11 00815 g007
Figure 8. STRING-generated interaction network between genes that belong to the “cellular component morphogenesis”, “negative regulation of cell differentiation”, “morphogenesis of a branching structure”, “regulation of cellular component size”, and “branching morphogenesis of a tube” GO BP terms. The intensity of the edges reflects the strength of interaction score.
Genes 11 00815 g008
Figure 9. Functional interaction (FI) between differently expressed genes that belong to “cellular component morphogenesis”, “negative regulation of cell differentiation”, “morphogenesis of a branching structure”, “regulation of cellular component size”, and “branching morphogenesis of a tube” GO BP terms. In following figure “->” stands for activating/catalyzing, “-|” for inhibition, “-” for FIs extracted from complexes or inputs, and “---” for predicted FIs.
Genes 11 00815 g009
Figure 10. RT-qPCR—microarray validation.
Genes 11 00815 g010
Table 1. Cortical granule distribution in porcine germinal vesicle stage (GV) oocytes collected from different-sized follicles.
Follicle SizeOocytes
No. of Oocytes ExaminedIndex of Cortical Granules Distribution Icgd * (Mean ± SD)
Small1341.48 a ± 0.31
Medium512.22 b ± 0.49
Values with different superscript were significantly different (p ˂ 0.01). * Icgd = average signal intensity (FITC) in peripheral part of oocyte/average signal intensity (FITC) in central part of oocyte. a—small follicles, b—medium follicles.
Table 2. Gene symbols, ratio of fold change in expression, corrected p values, and LogFC of studied genes.
GeneGene IDFold Changep Value
VEGFA3971570.0696893890.001912689
CYR611001537910.0806570360.0000754
AR3975820.10598630.000138367
EGR21000380040.1655038320.007949861
EDNRA3974570.1669390280.00185422
NEBL1005223950.1872134680.005937926
TGFBR33975120.1965222440.000405979
GJA11005186360.2069073470.000107676
FST4450020.2246965580.000364693
CTNNA21005253370.2299252460.000512181
RTN41001701180.231377730.027495815
SLITRK31065040670.2391419110.004260951
INHBA3970930.2412597710.000148036
CDK61005189210.2480014130.006042481
LAMB21011016880.2788579470.000187911
ROBO21005176810.2837488640.001183495
IHH3971740.3049958430.000551261
ZCCHC111005169790.32162230.019809962
APP3976630.3241386050.005602323
WWTR11005225730.3272020920.000254025
CD93970670.3292831050.006332387
SEMA5A1007371940.3533917150.001092396
ITGB13970190.3662330170.003705215
SMAD43971420.3678022010.001238681
MAP3K13966170.368765380.024748462
UBE2B1005135270.3827796670.041104659
NOTCH21001533690.38482620.002523723
RYK1005235130.4219030060.00439989
SPTA11001520680.4270421210.002476662
KIT3968100.4304442150.00255635
TPM11000379990.4339631090.001632742
CAPZA21000379580.4343753090.017755958
MMP143974710.4887211470.038060423
ARHGEF21001458872.6561998580.006431804
FN13976202.6795806560.001210303
MAP1B1005190622.7885541050.00105385
SOX93968403.5033401740.000620008
CXCL124944603.9347057910.003163632
DAB21005197464.0082081780.001912689

