Author Contributions
A.Z. and V.S. designed the study and wrote the manuscript. A.Z. and A.M. (Anton Markov) performed bioinformatics analyses. N.K., V.K., S.L., N.E., M.D., N.M., A.S., O.S., E.K., A.M. (Andrey Marusin), M.S., I.K. and M.R. collected and prepared samples. N.K. and V.K. genotyped samples. A.Z., V.S. and A.M. (Anton Markov) revised the methodologies and the manuscript. All authors have read and agreed to the published version of the manuscript.
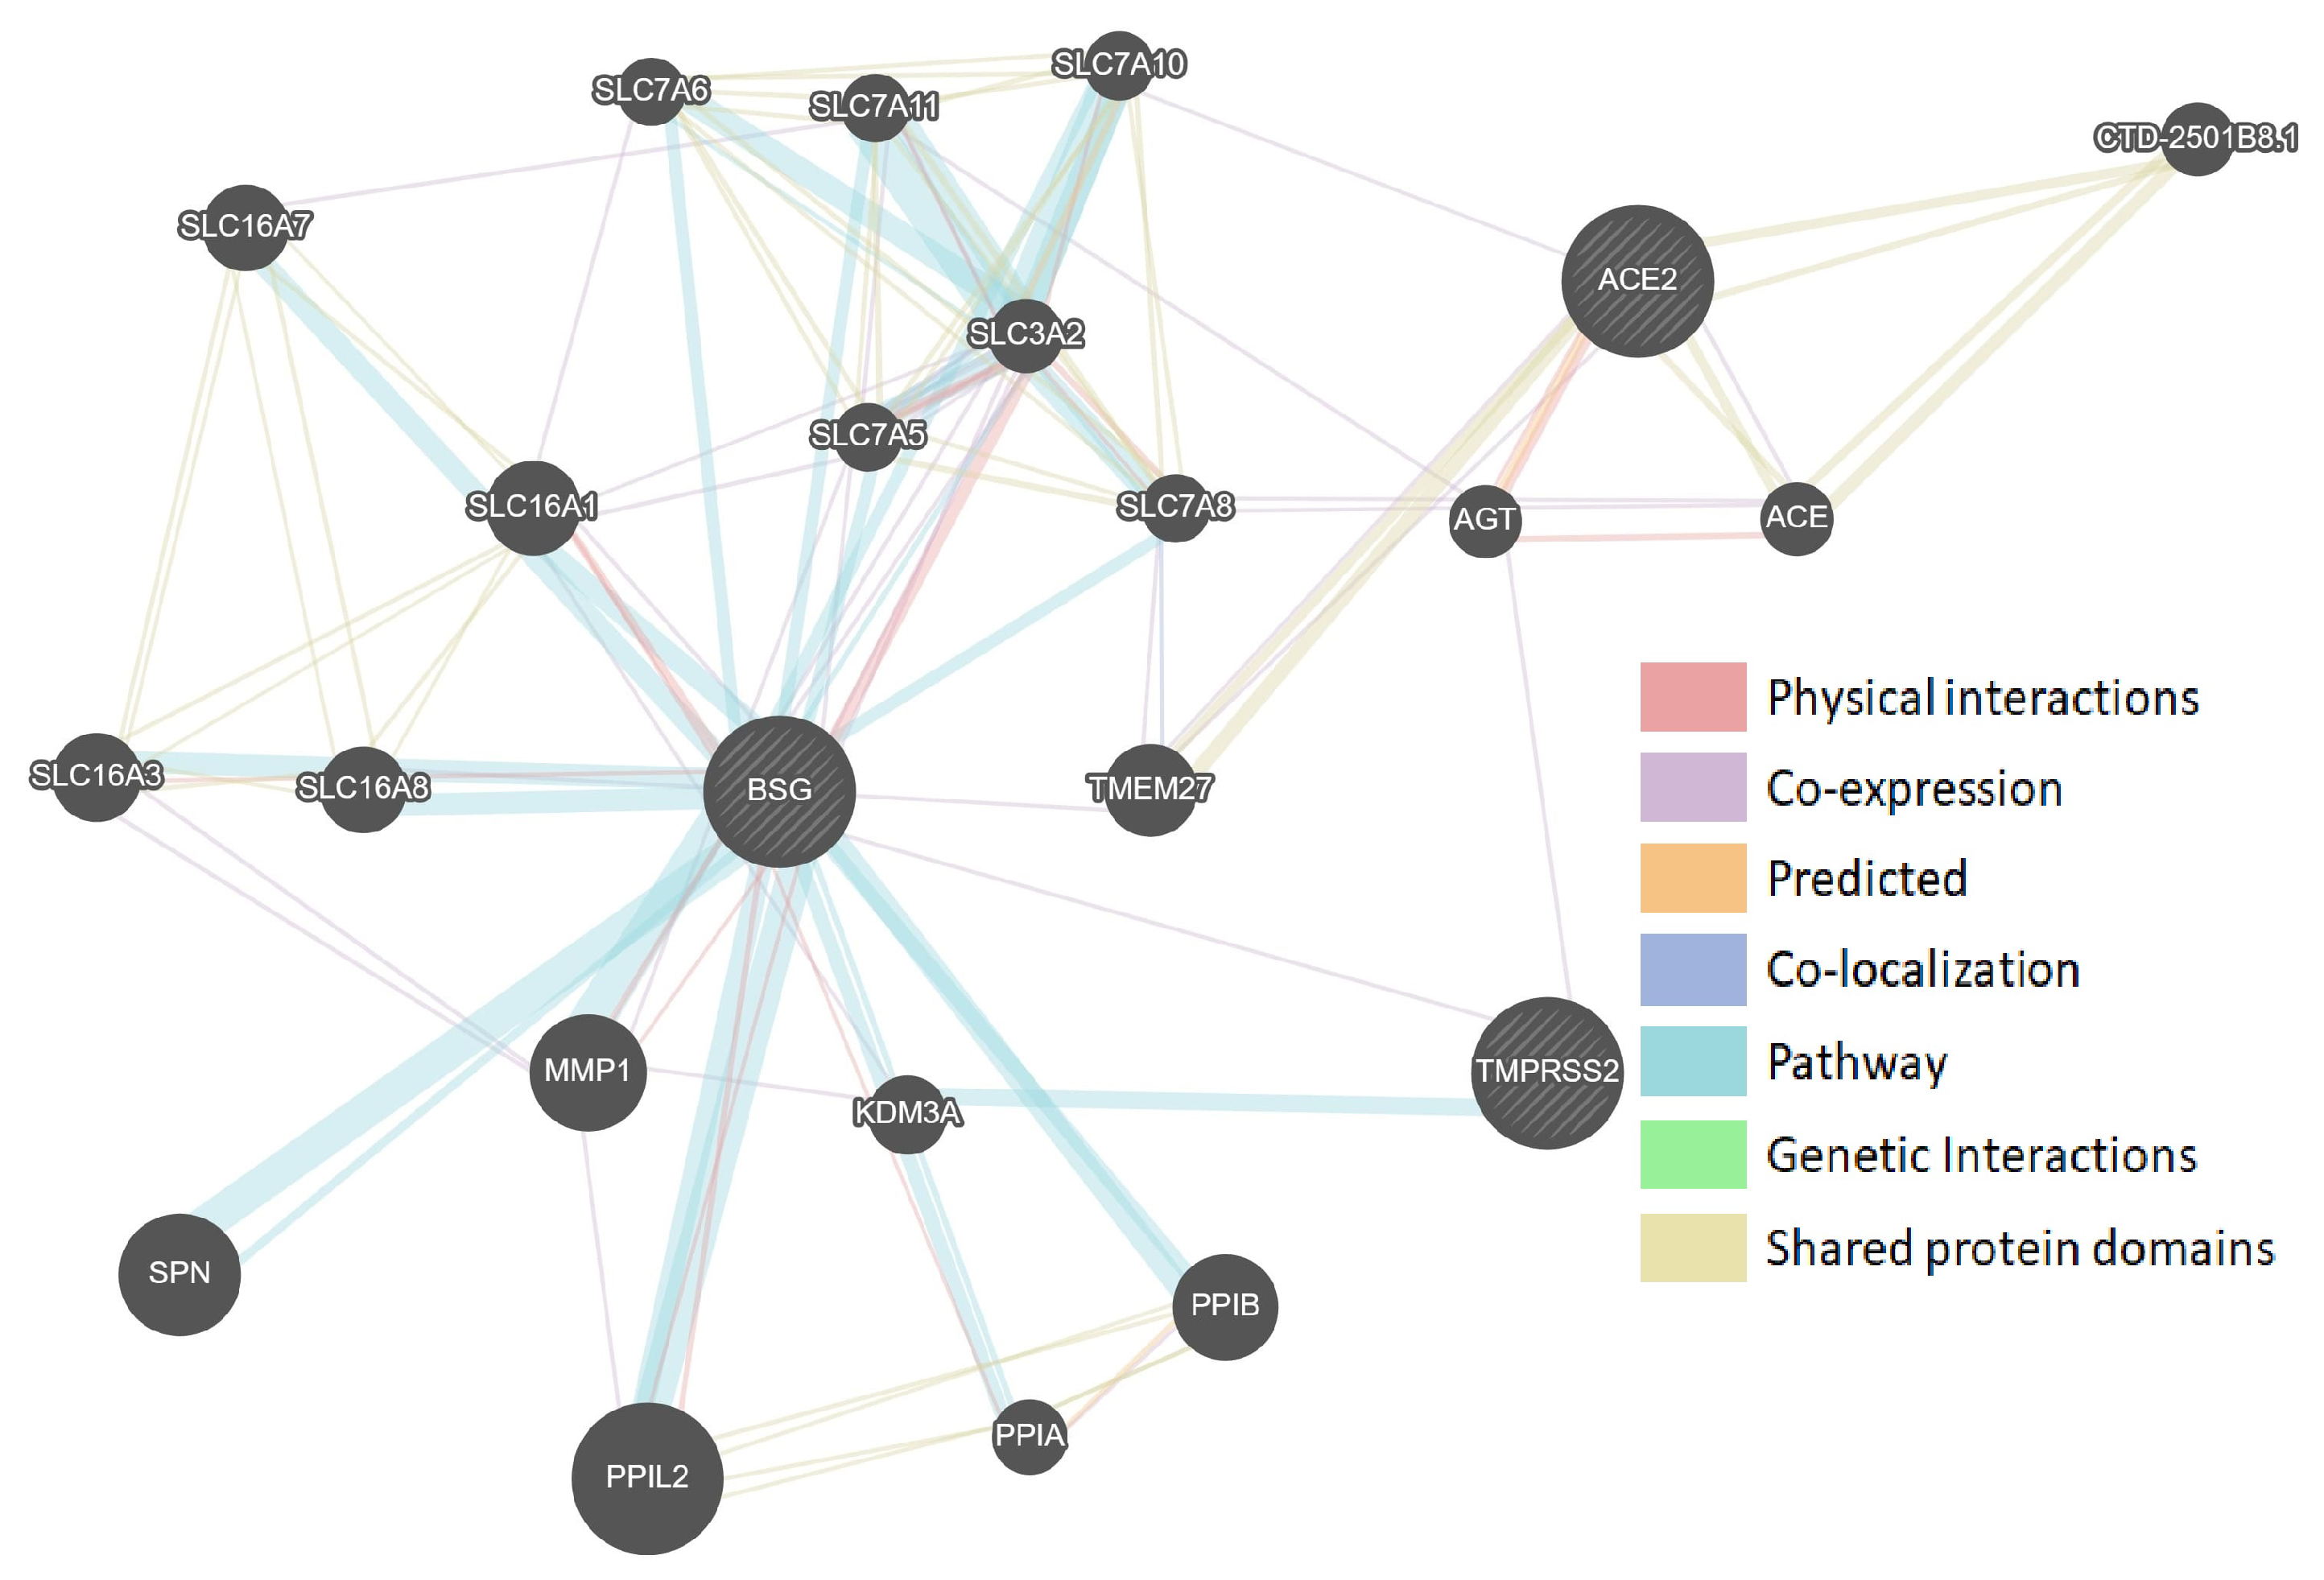
Figure 1.
Protein–protein interaction network of SARS-CoV-2-interacting genes (GeneMANIA). The size of the circles indicates the strength of the bond with the gene being assessed.
Figure 1.
Protein–protein interaction network of SARS-CoV-2-interacting genes (GeneMANIA). The size of the circles indicates the strength of the bond with the gene being assessed.
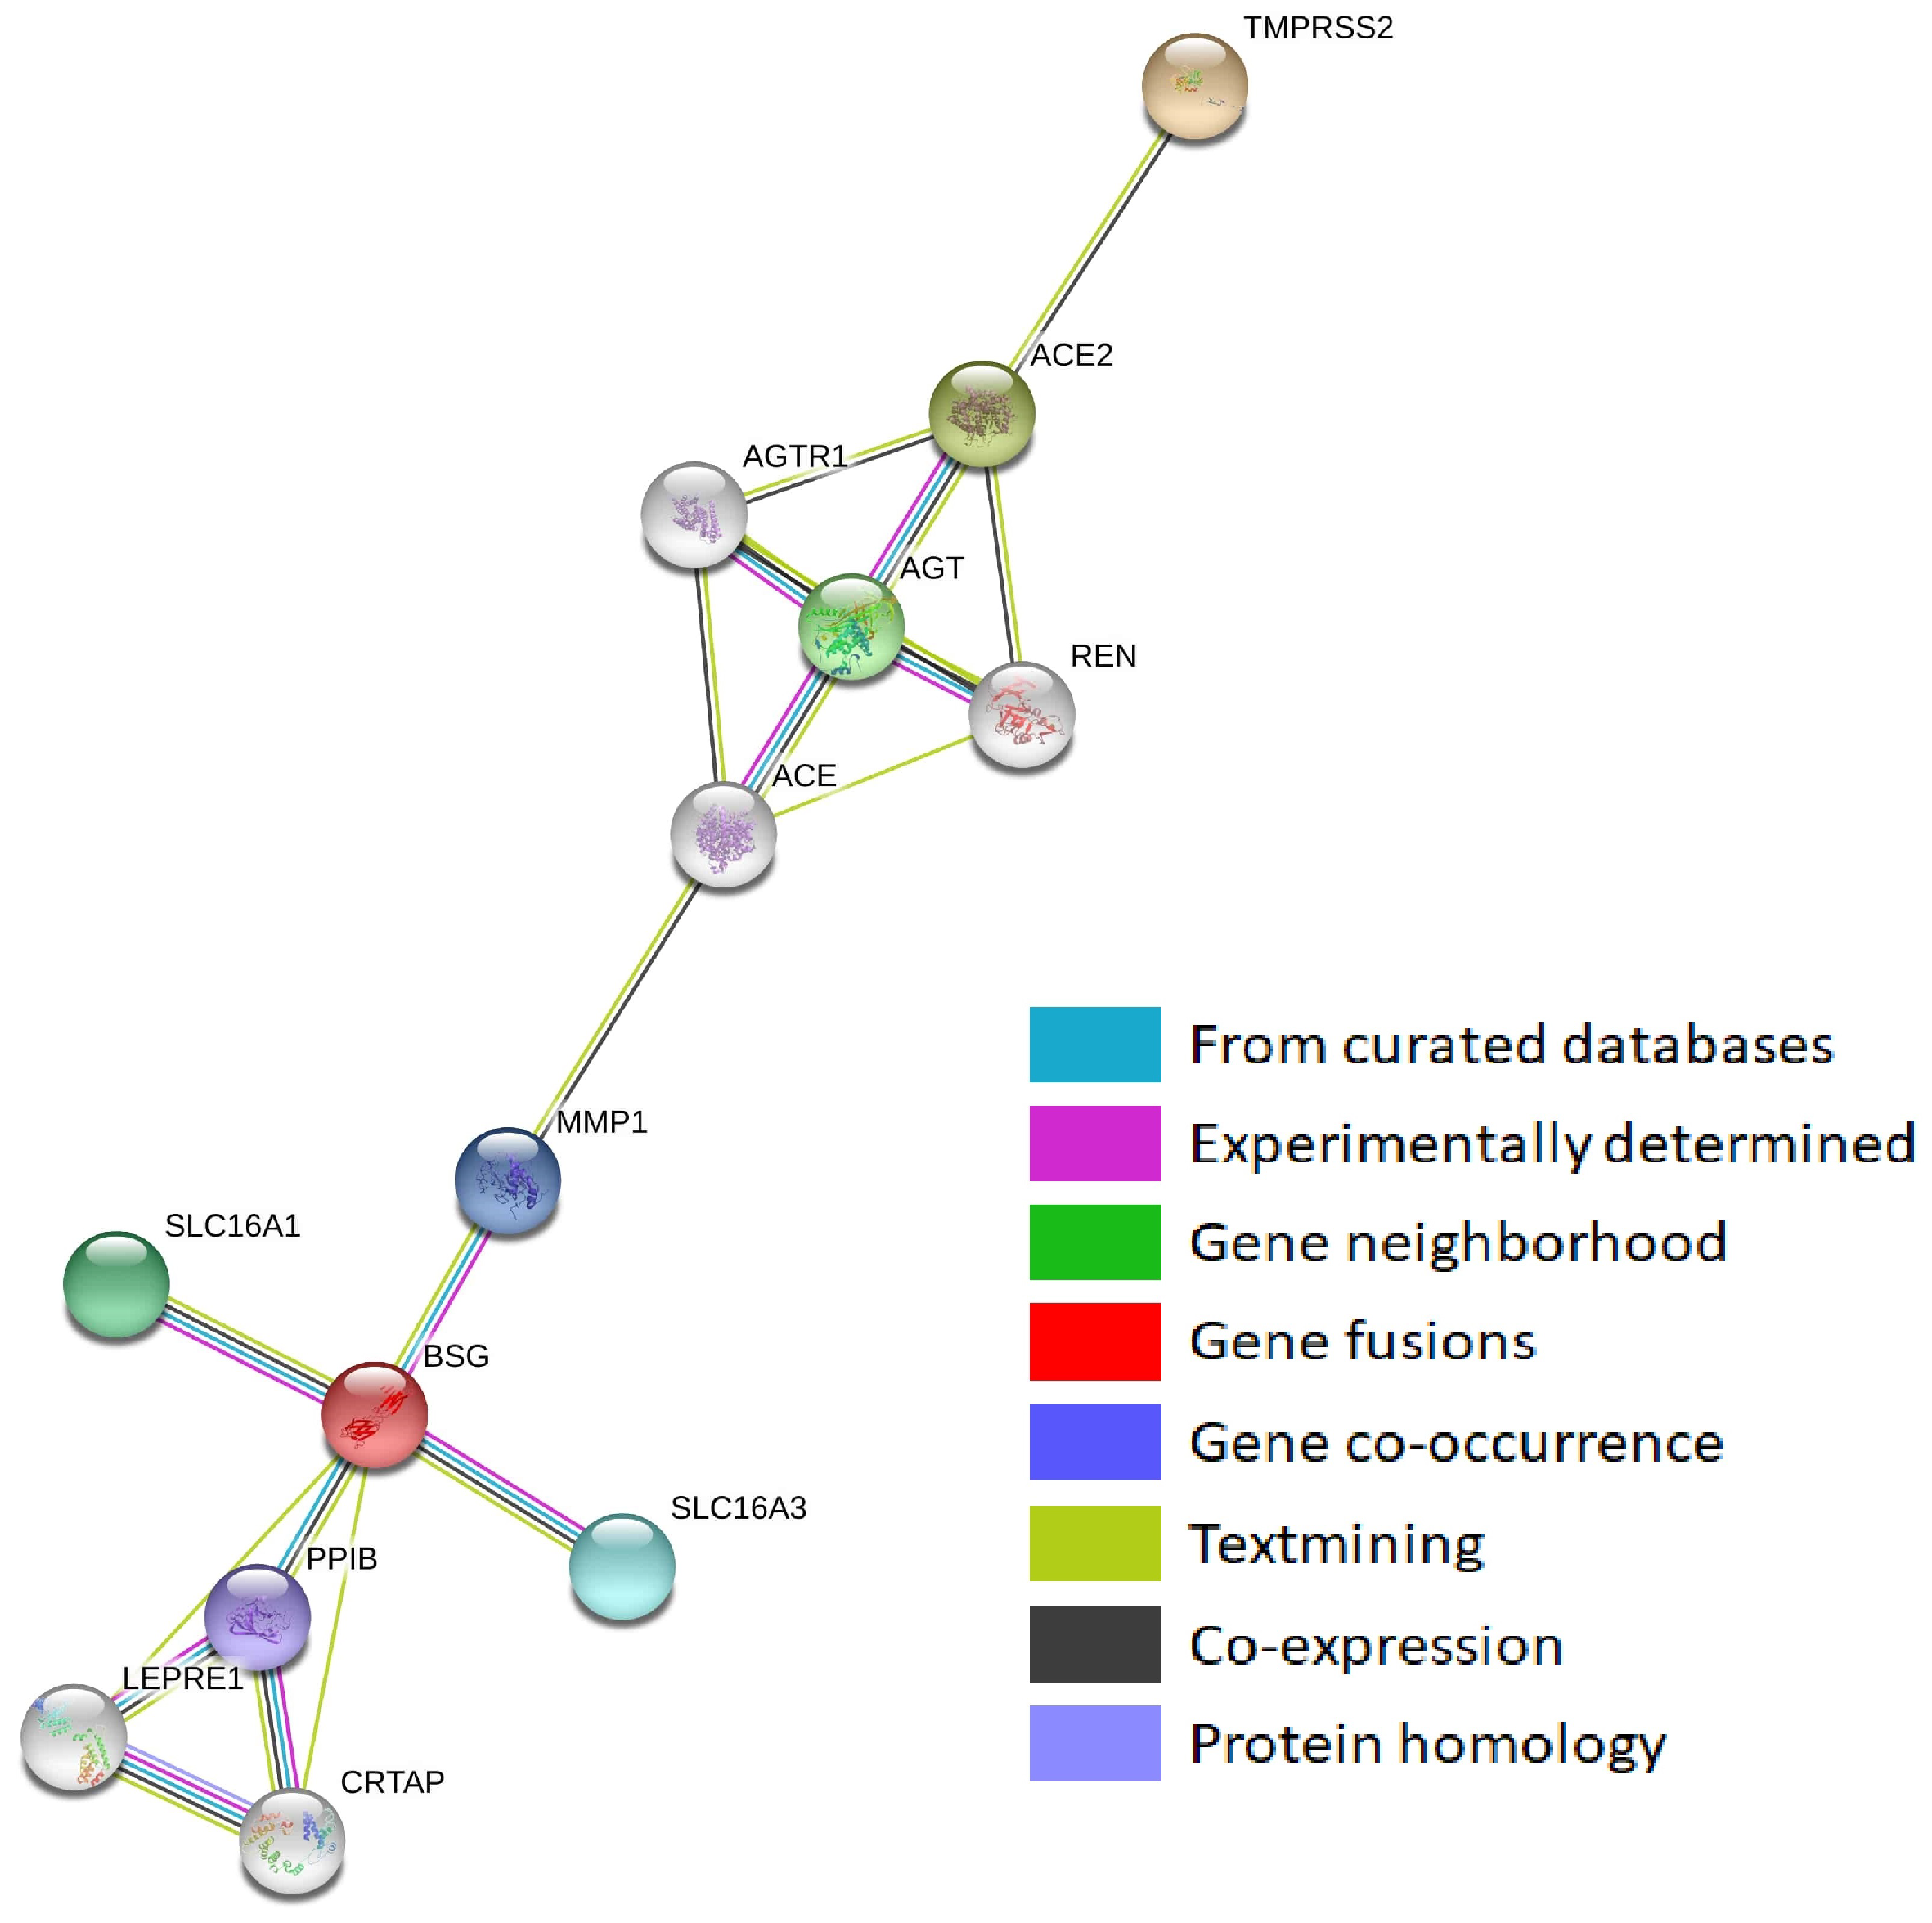
Figure 2.
Protein–protein interaction network of SARS-CoV-2-interacting genes (STRING).
Figure 2.
Protein–protein interaction network of SARS-CoV-2-interacting genes (STRING).
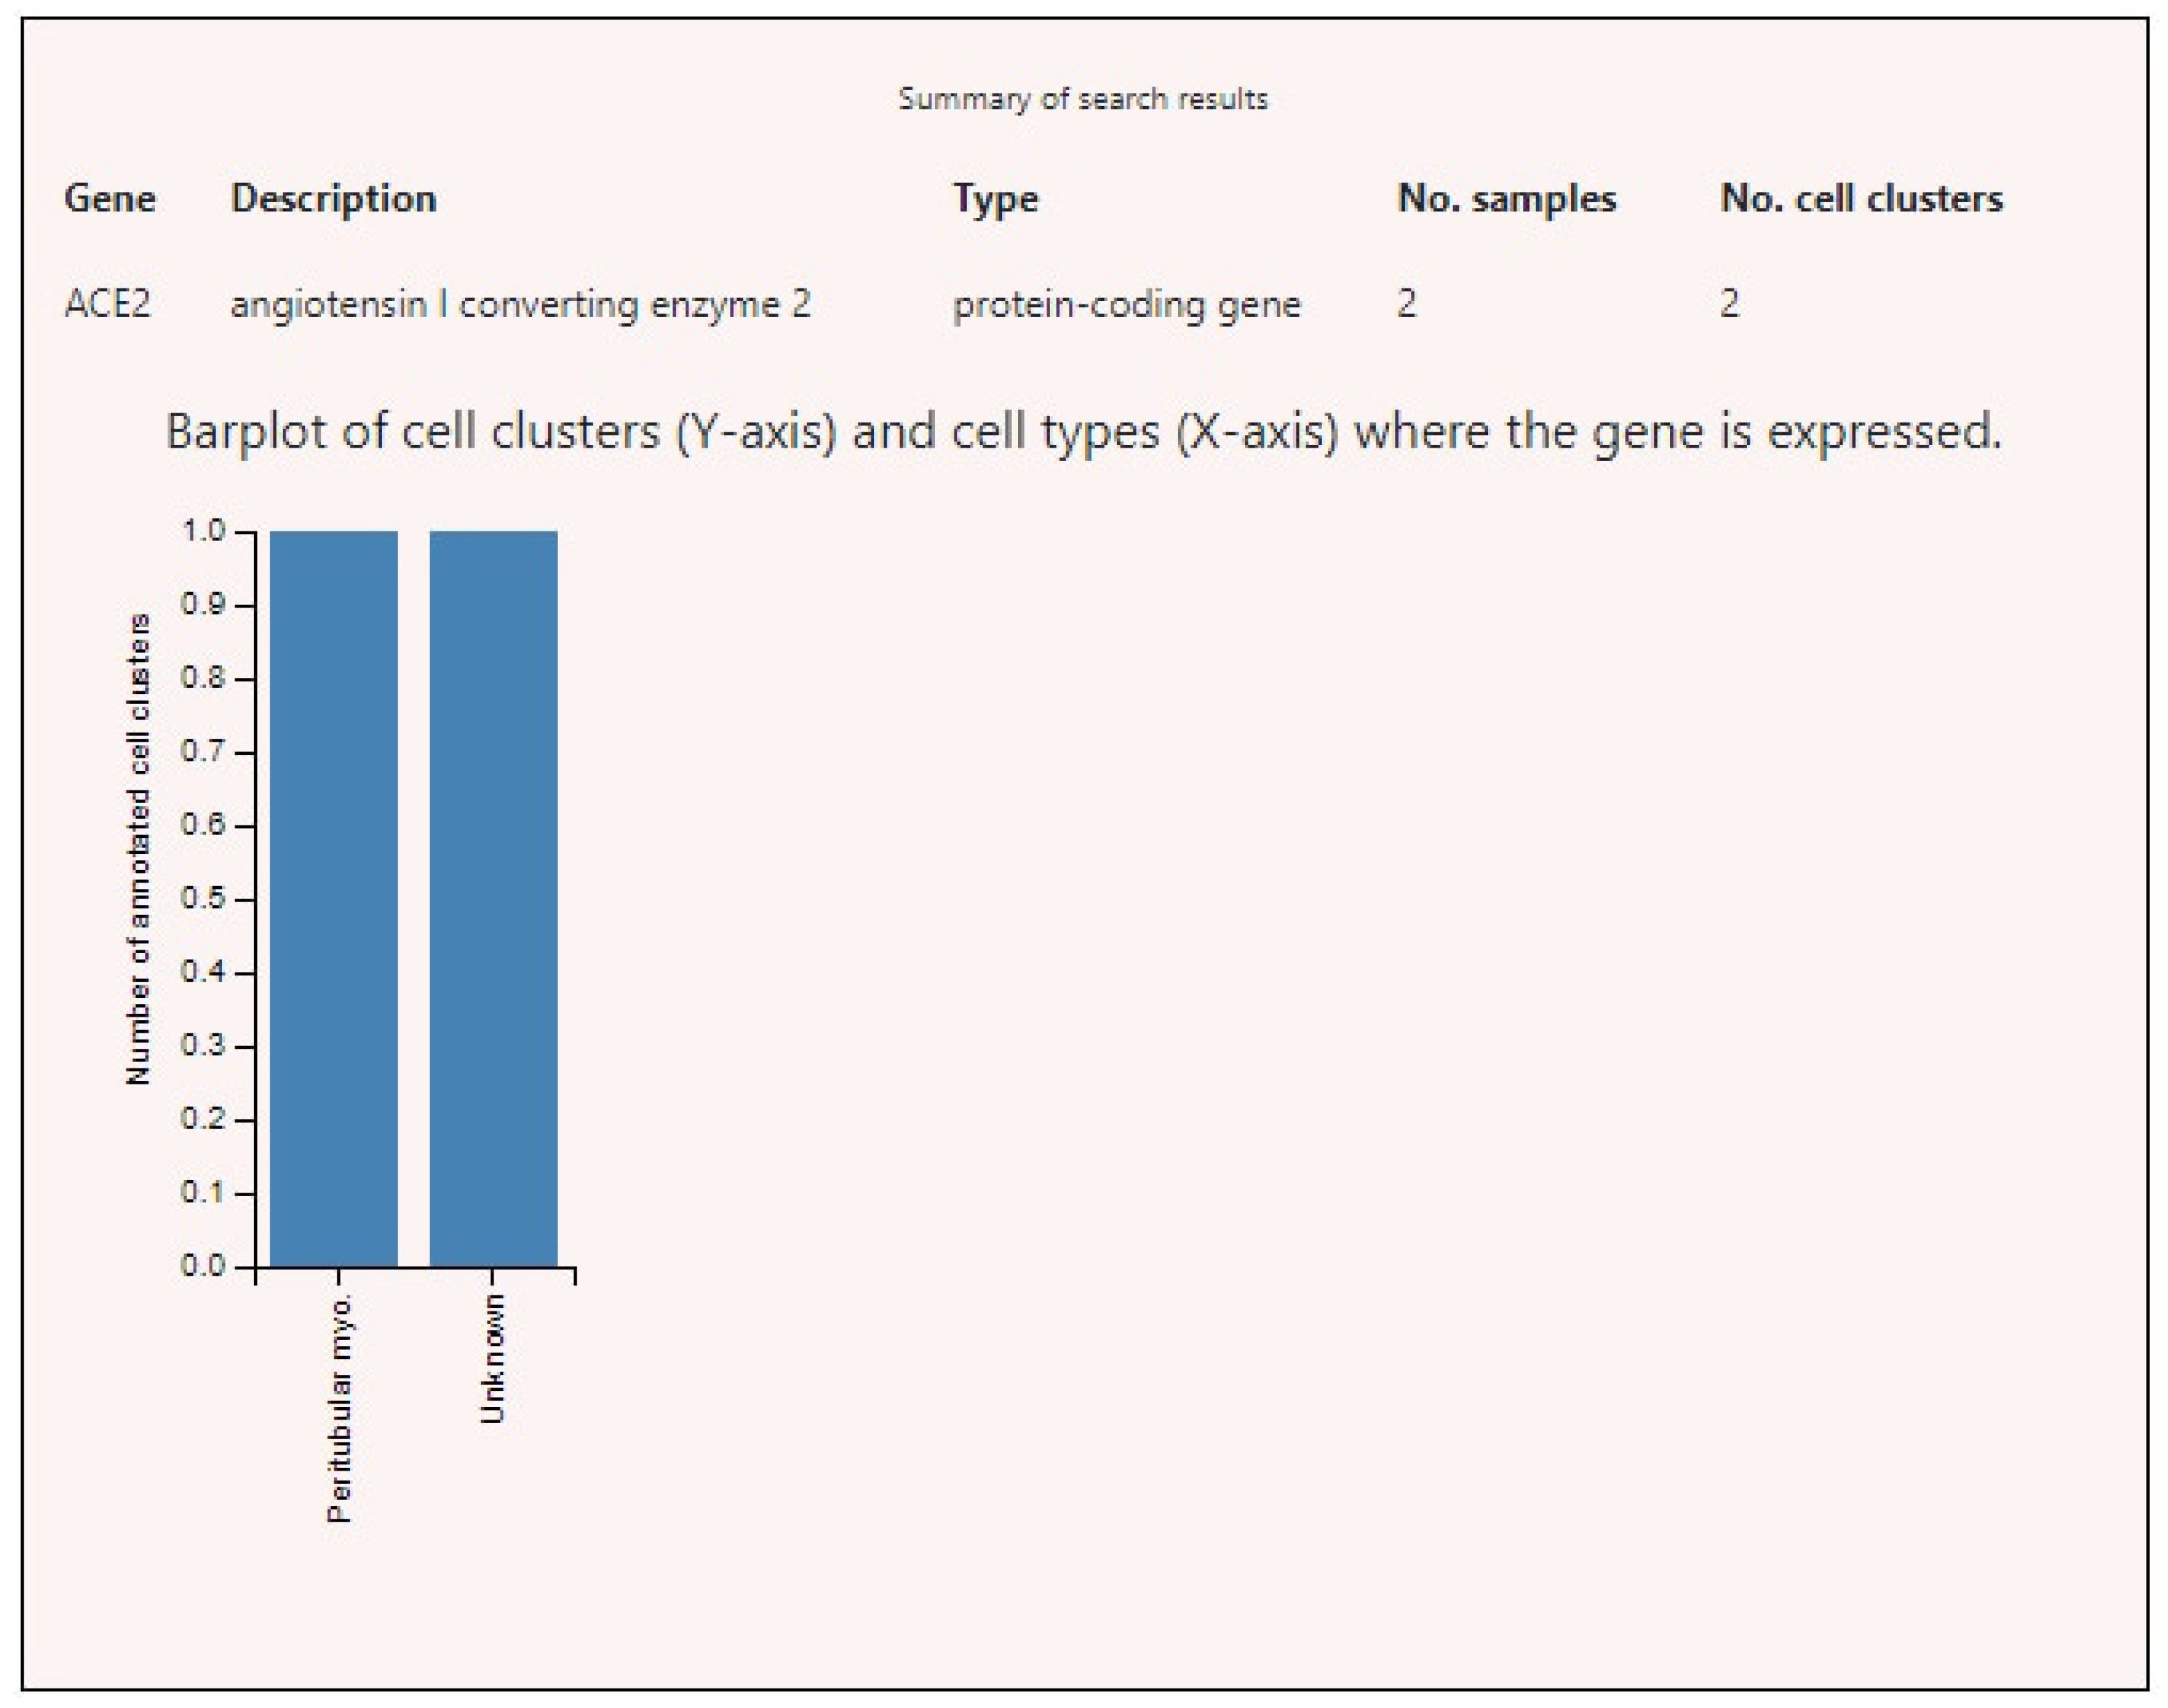
Figure 3.
Angiotensin-converting enzyme 2 (ACE2) expression levels in various human cells. Note: Unknown cells of unknown types present in testicle tissue specimens.
Figure 3.
Angiotensin-converting enzyme 2 (ACE2) expression levels in various human cells. Note: Unknown cells of unknown types present in testicle tissue specimens.
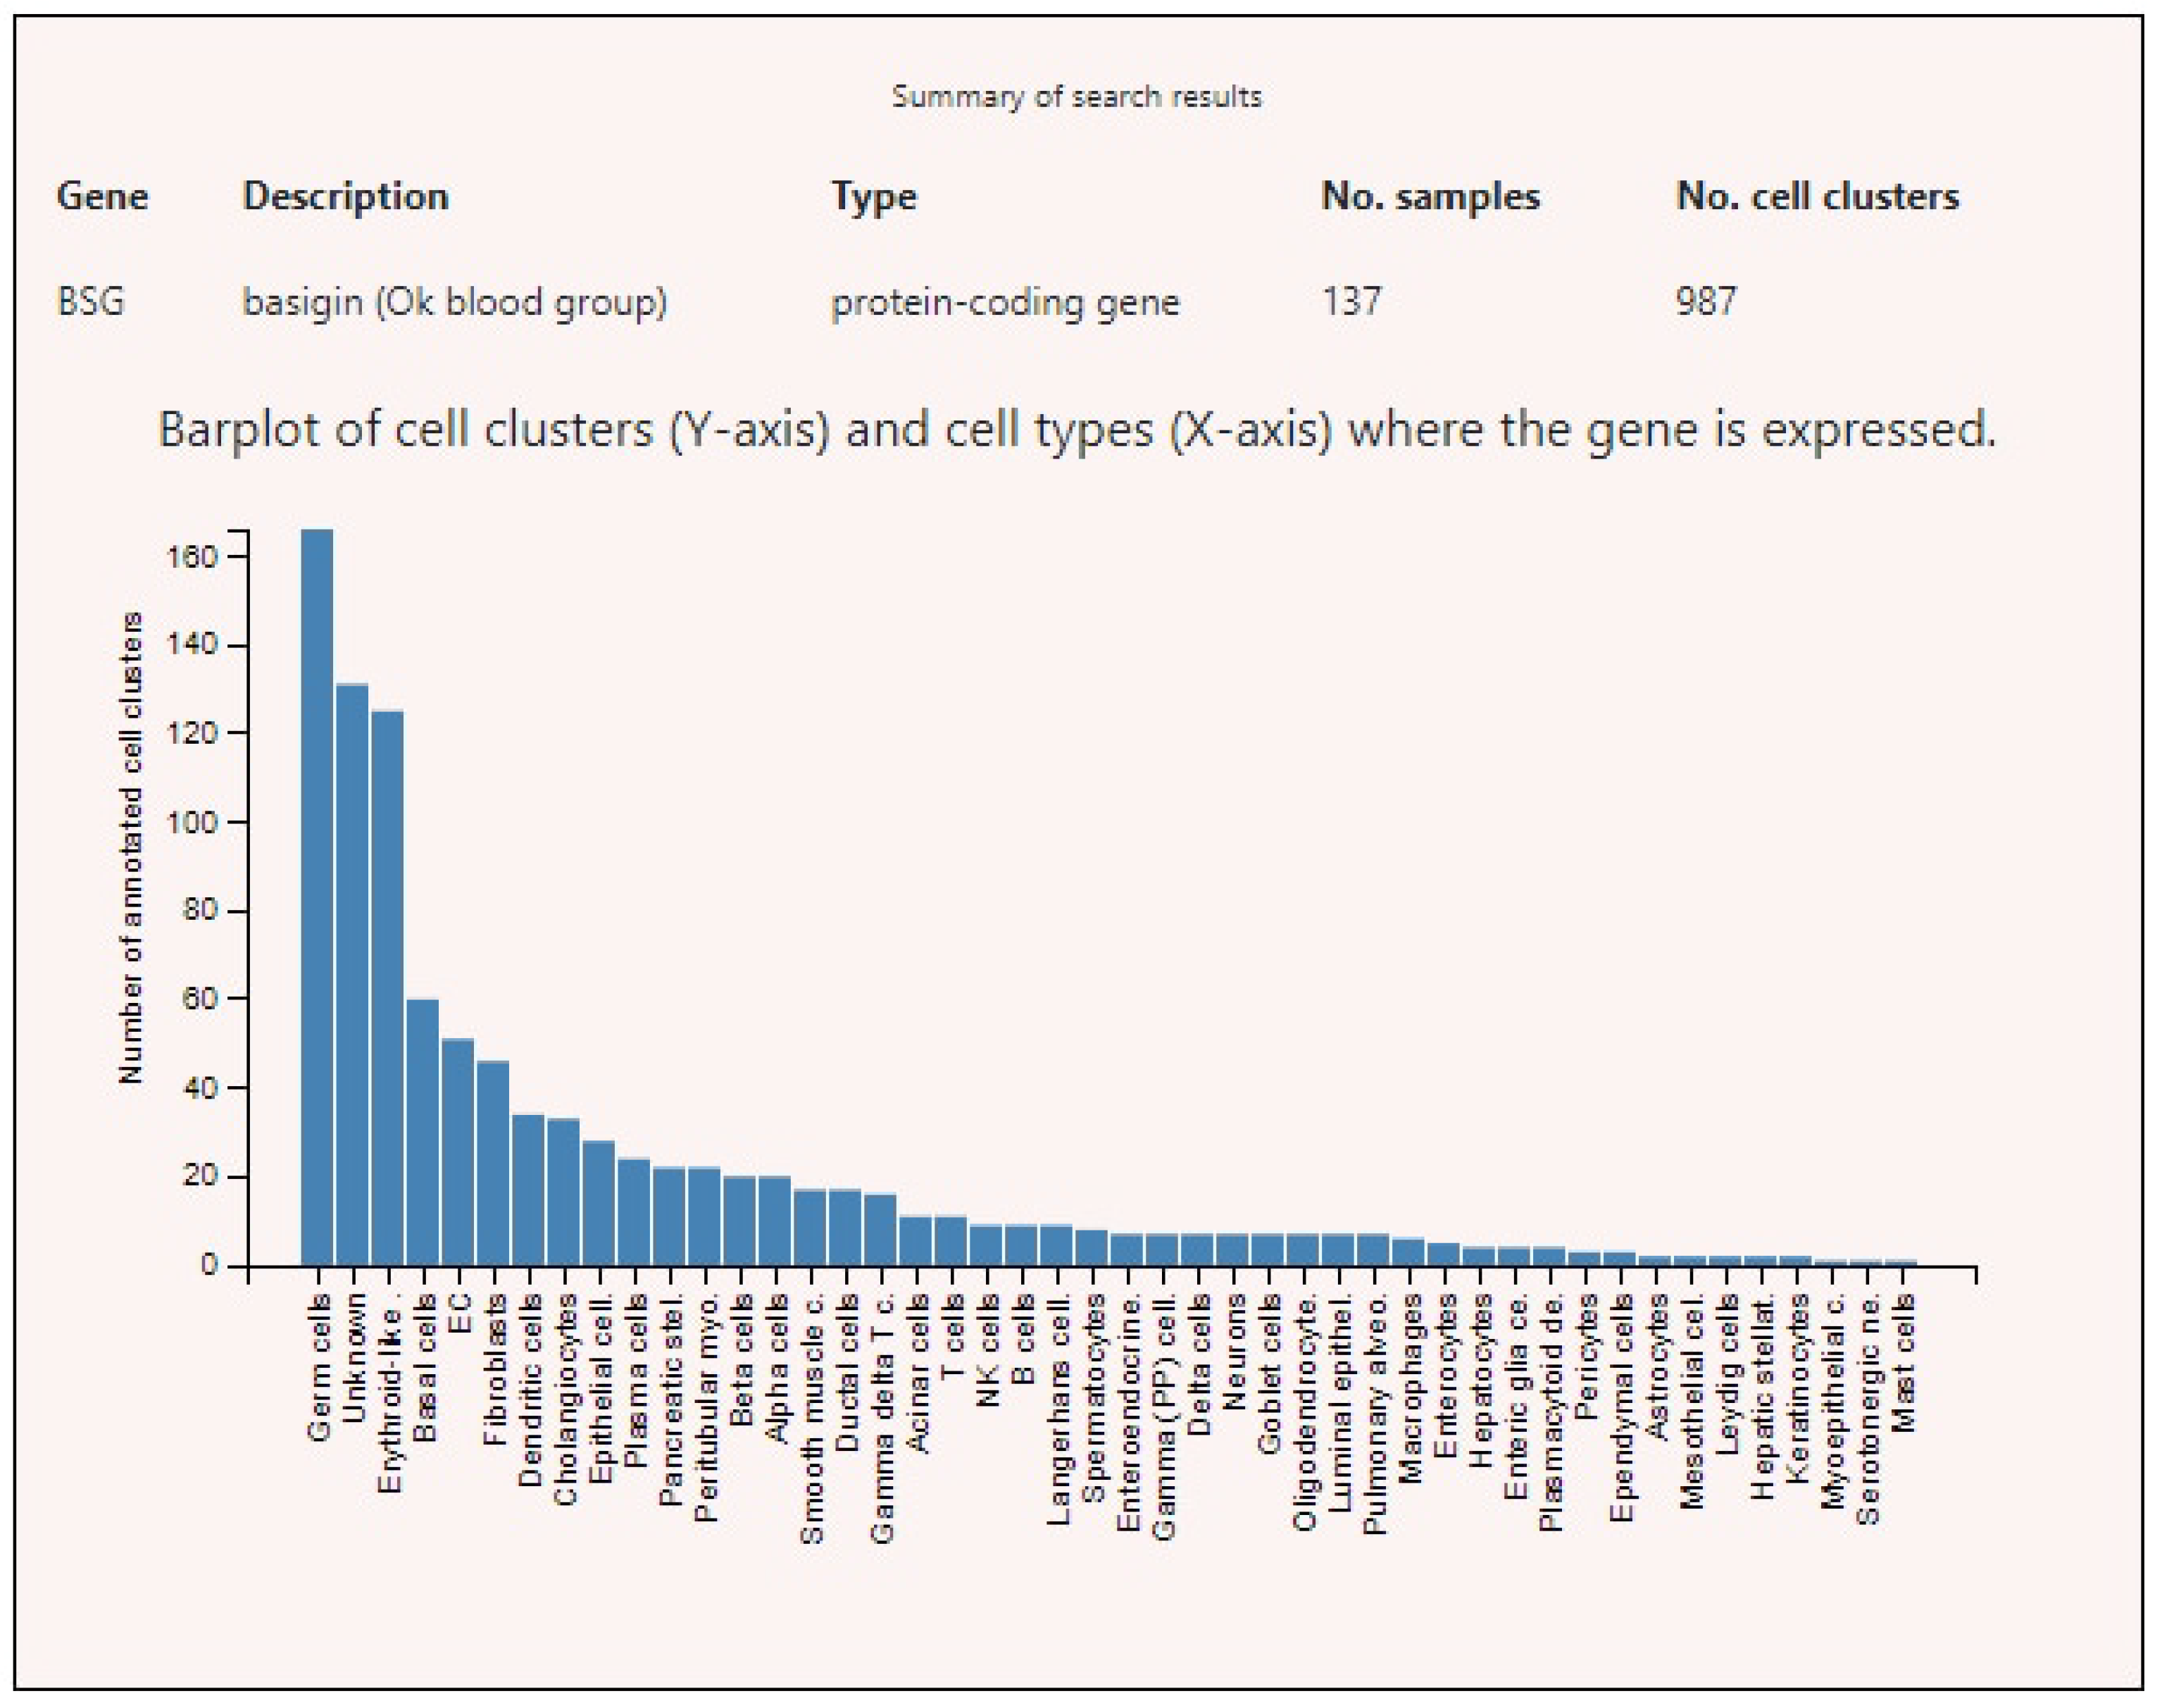
Figure 4.
Basigin (BSG) expression levels in various human cells.
Figure 4.
Basigin (BSG) expression levels in various human cells.
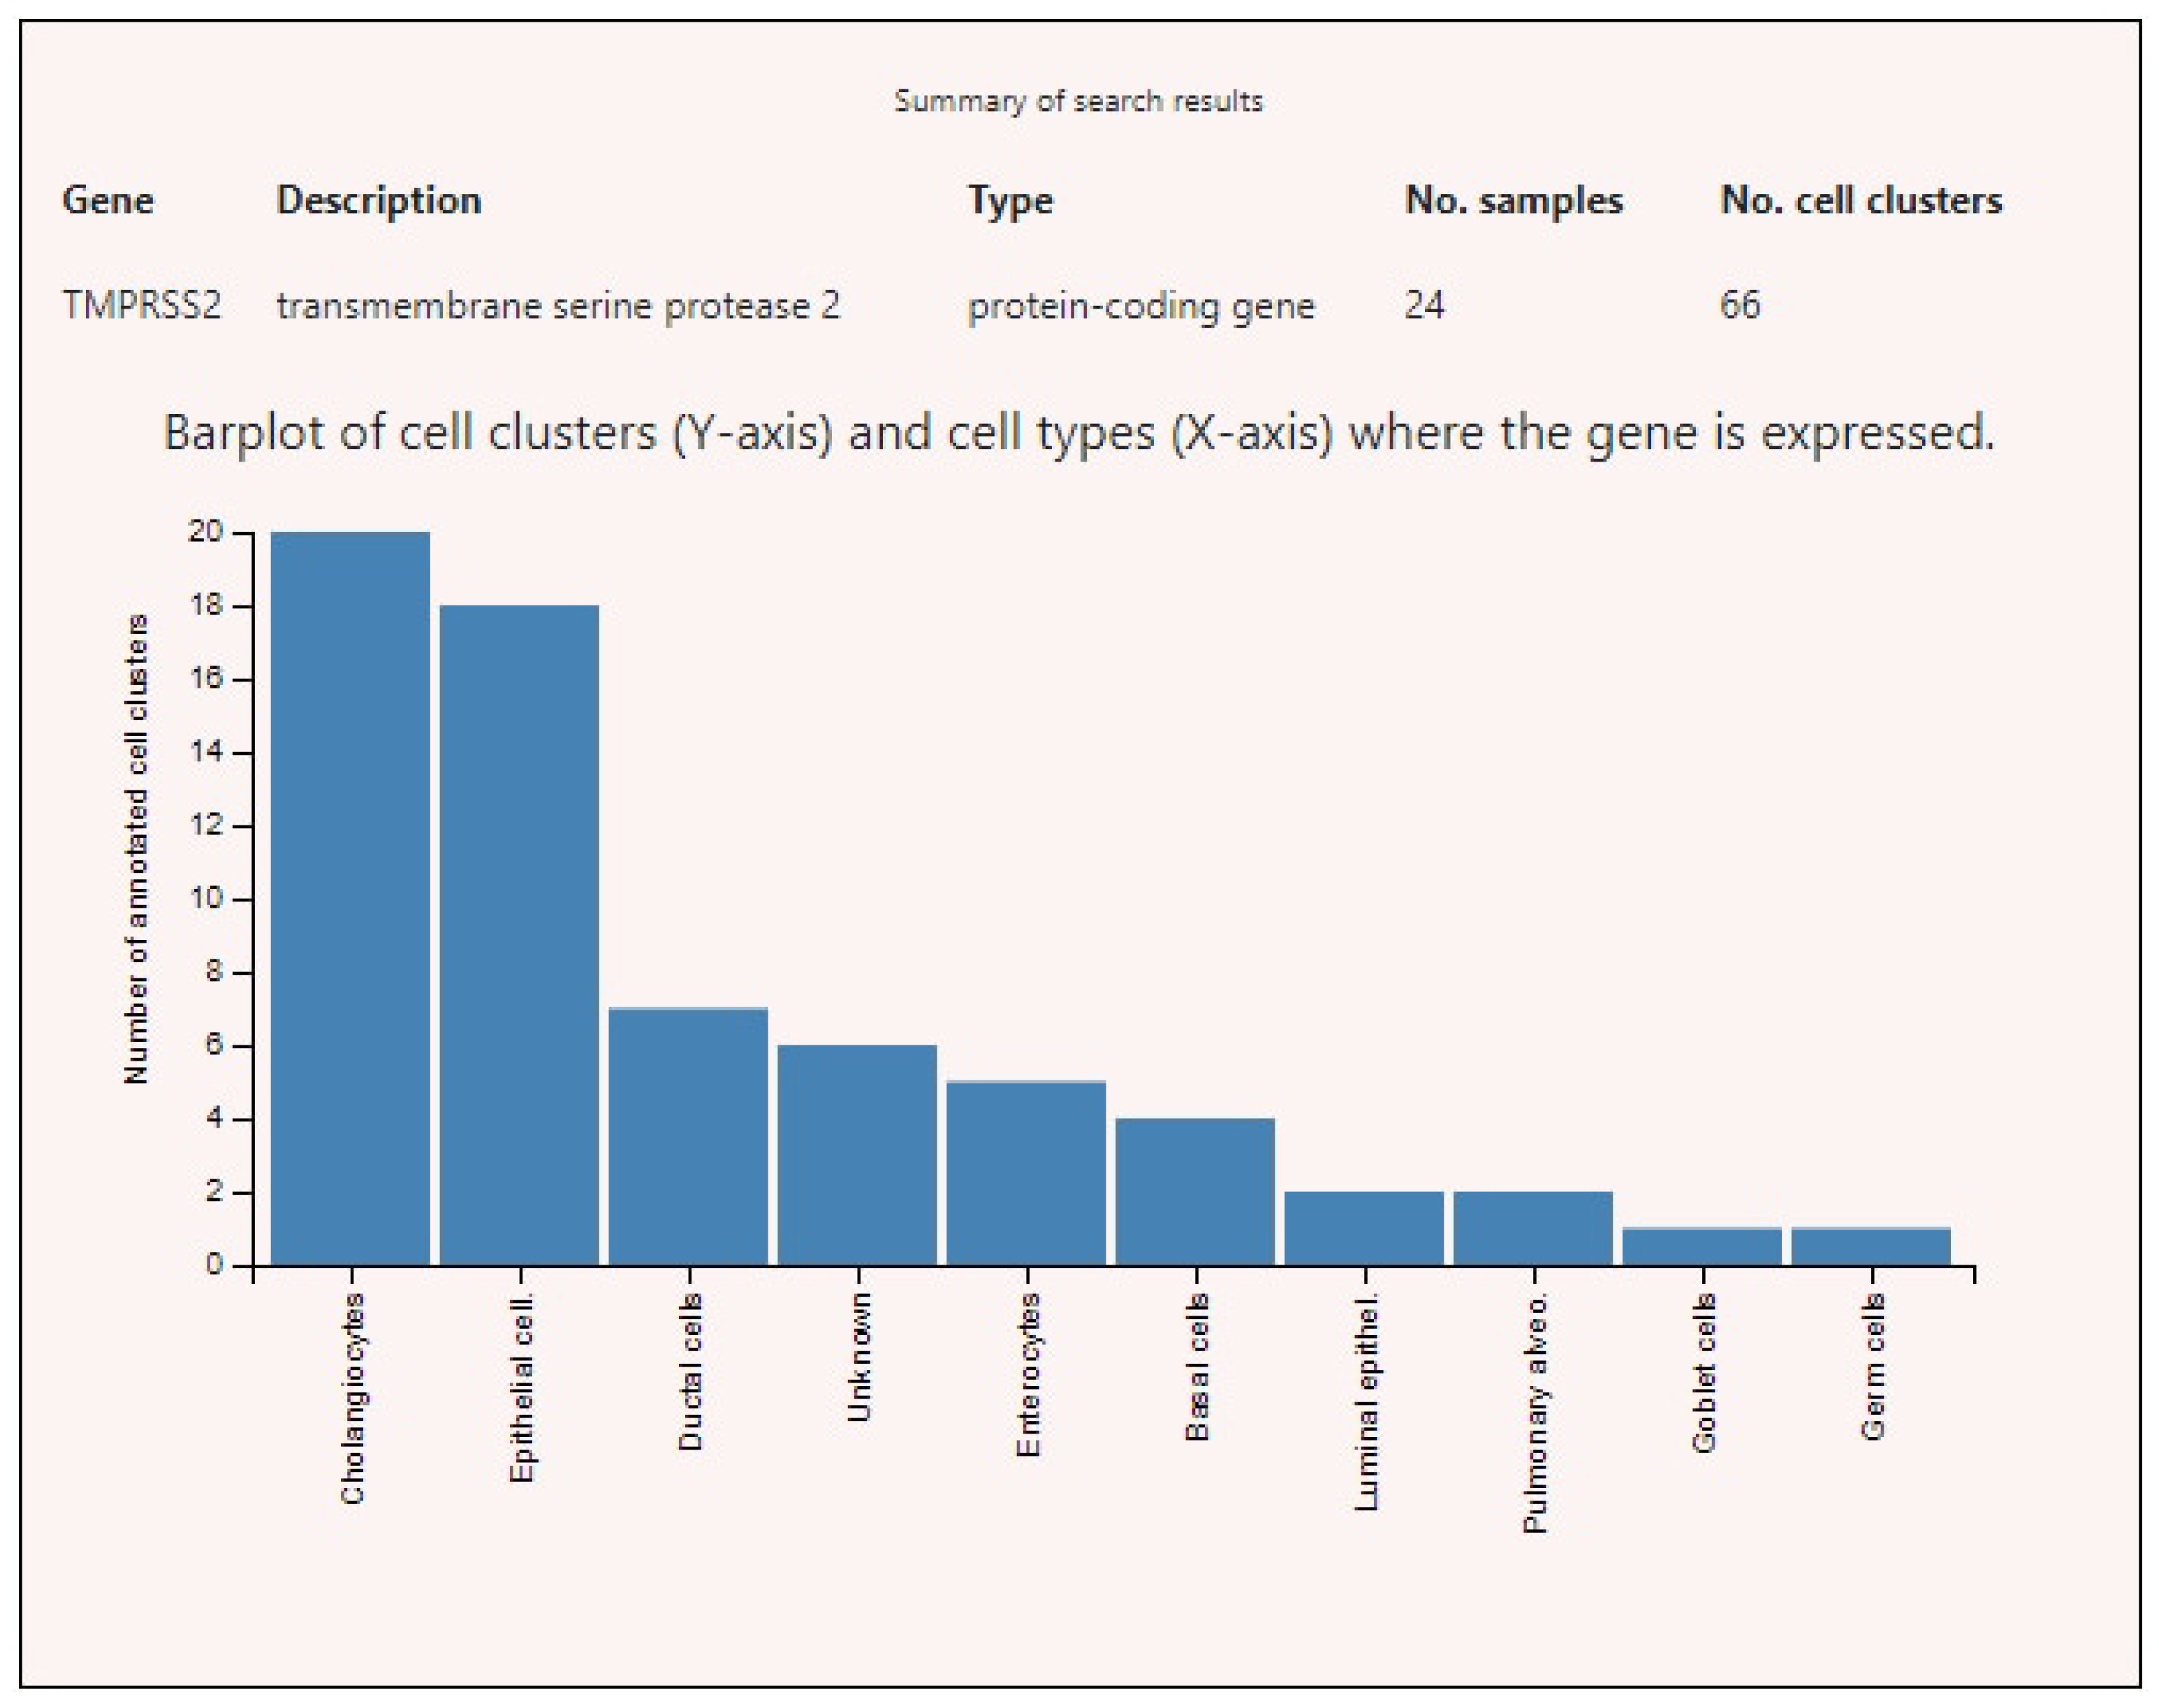
Figure 5.
TMPRESS2 expression levels in various human cells.
Figure 5.
TMPRESS2 expression levels in various human cells.
Figure 6.
Cell types in a single sample (SRS2769051) of proximal stromal lung cells. PA, pulmonary alveolar type II cells; Fib, fibroblasts; EC, endothelial cells; SMC, smooth muscle cells; LuEC, luminal epithelial cells; BC, basal cells; Ker, keratinocytes. Color intensity indicates the level of expression in a single cell.
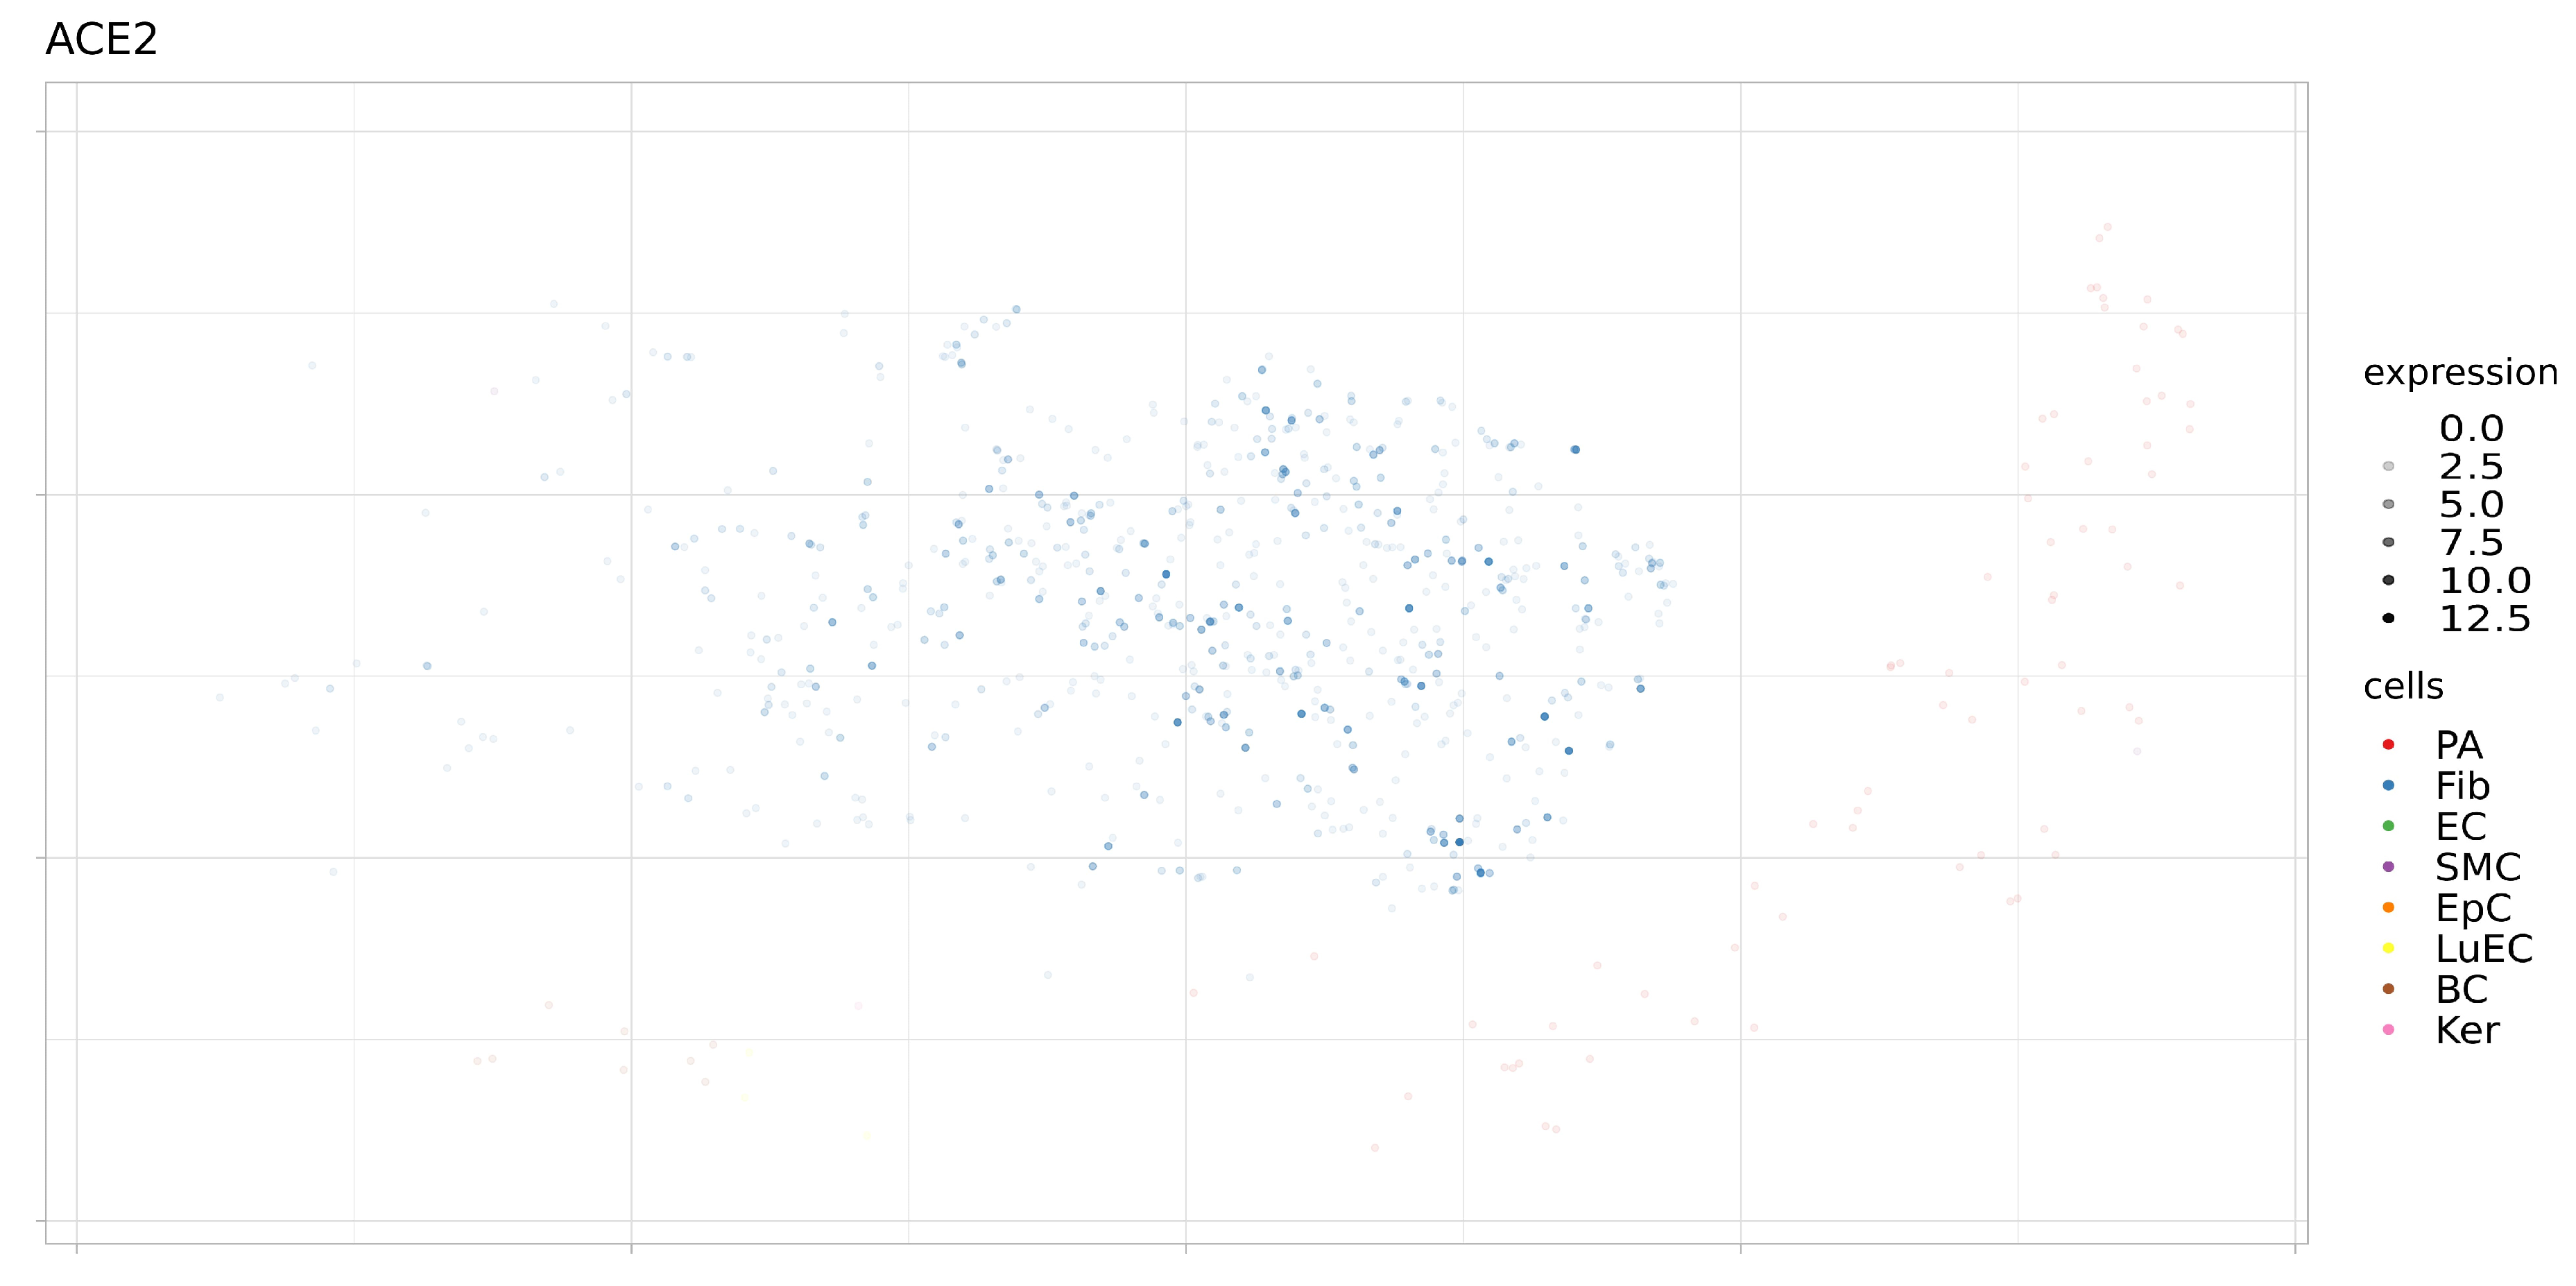
Figure 7.
Expression levels ACE2 in separate cells of proximal stromal lung (SRS2769051). PA, pulmonary alveolar type II cells; Fib, fibroblasts; EC, endothelial cells; SMC, smooth muscle cells; LuEC, luminal epithelial cells; BC, basal cells; Ker, keratinocytes. Color intensity indicates the level of expression in a single cell.
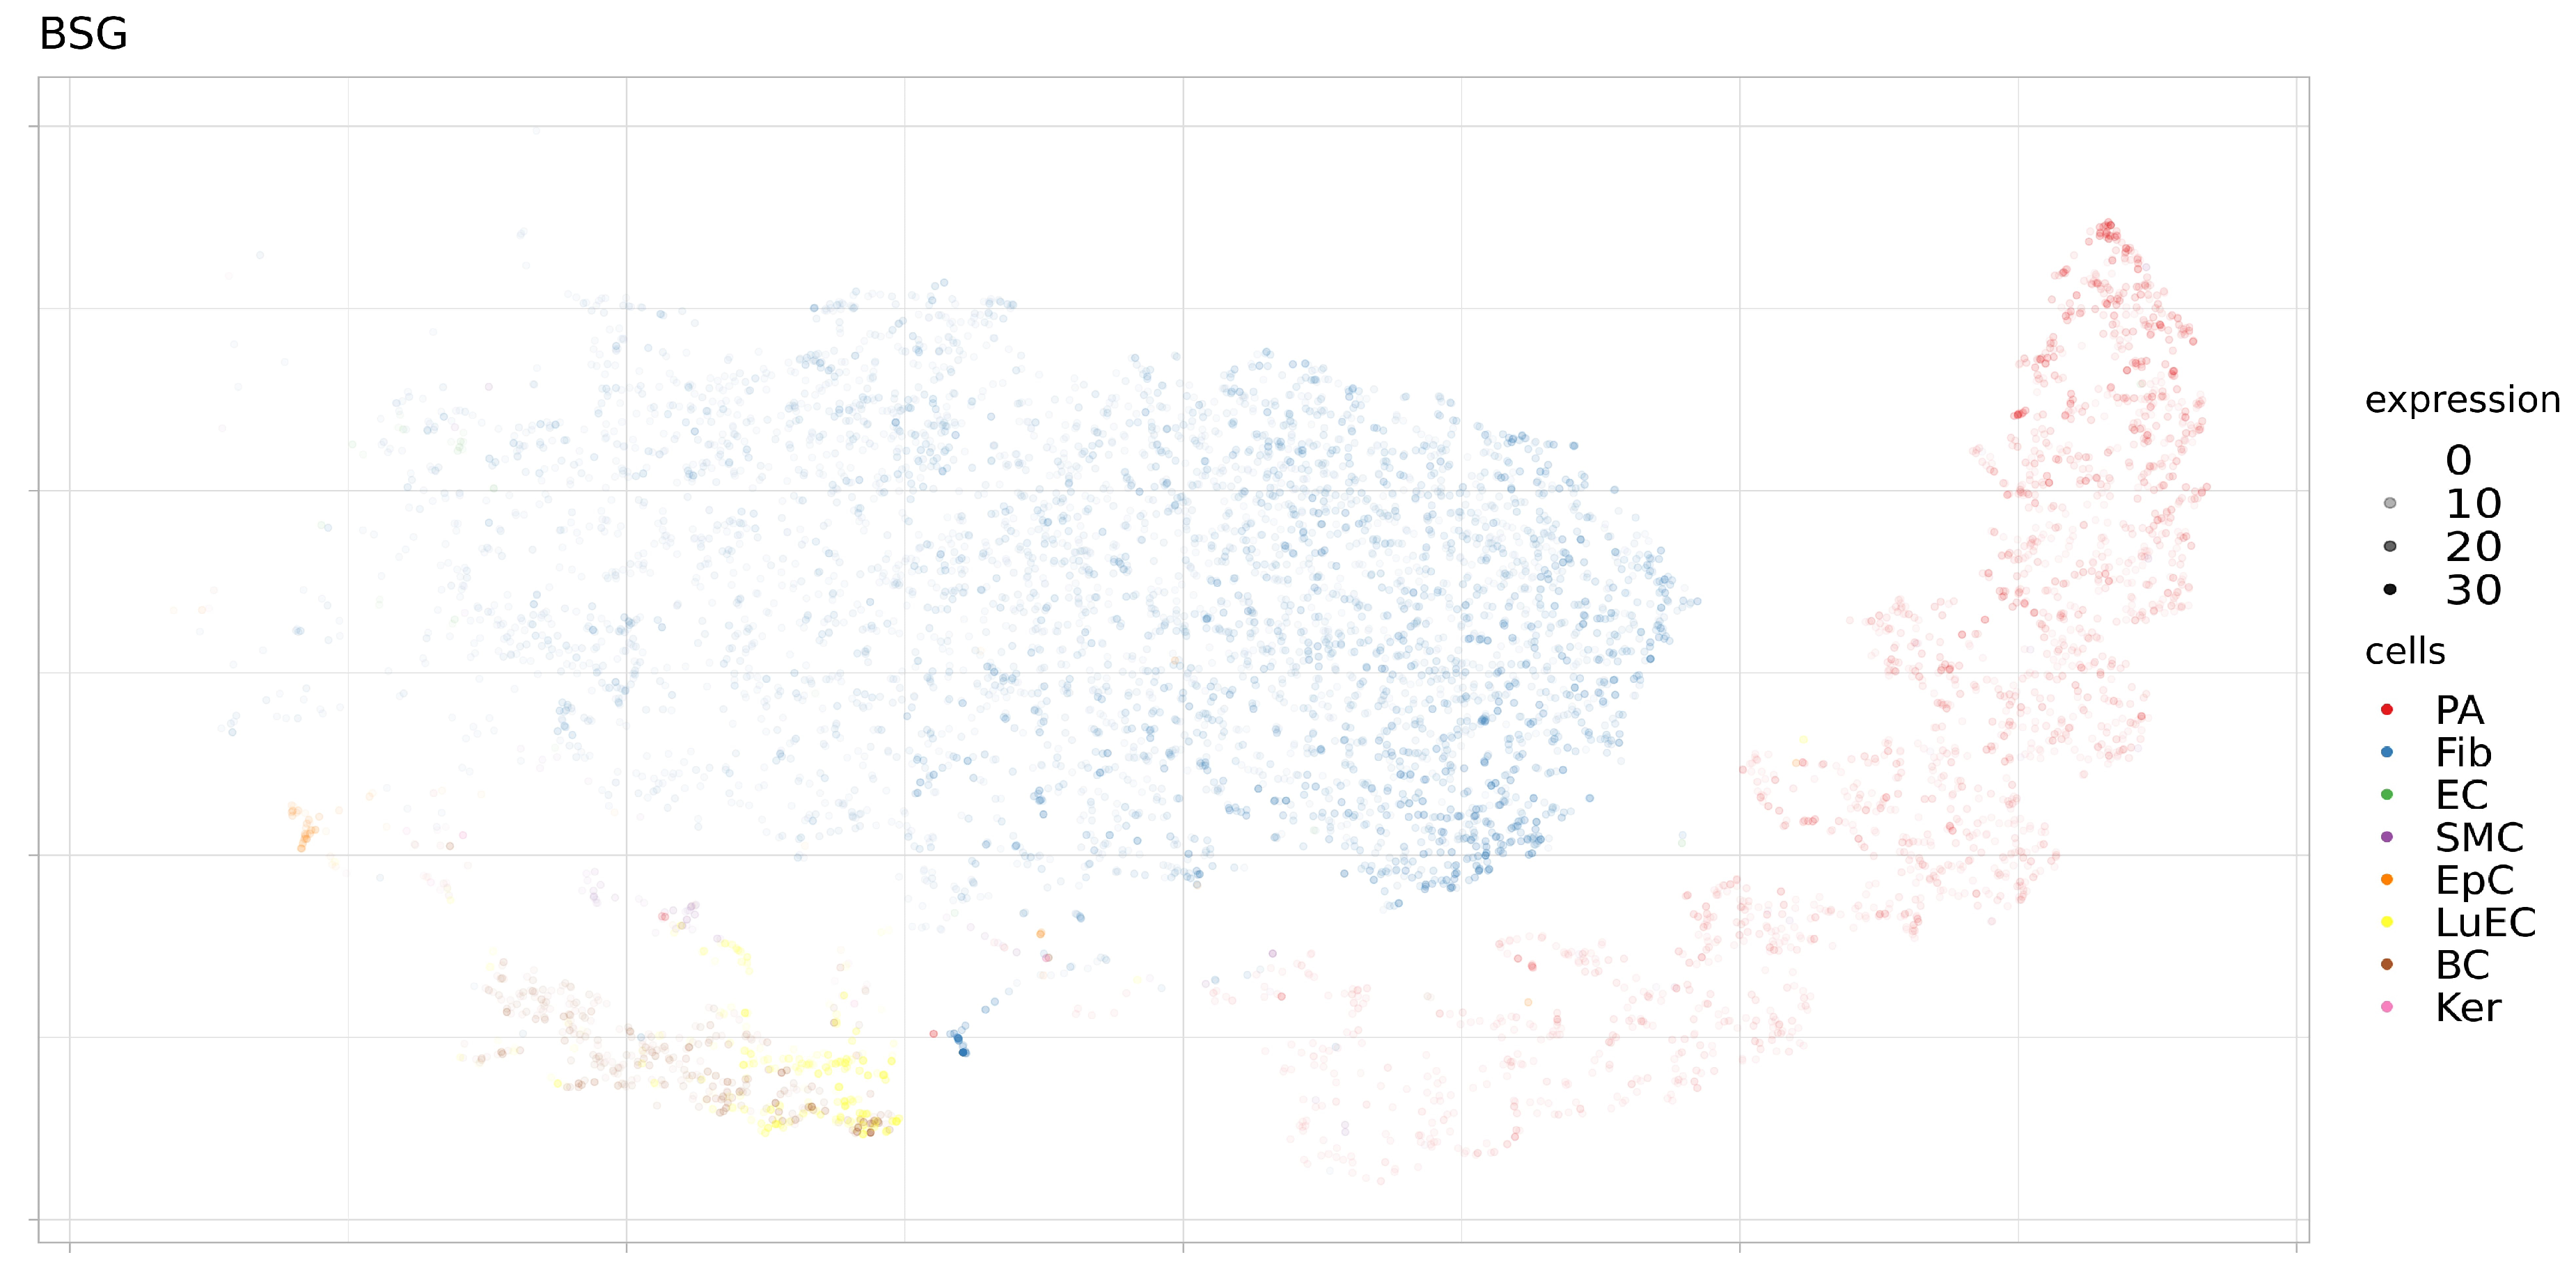
Figure 8.
Expression levels BSG in separate cells of proximal stromal lung (SRS2769051). PA, pulmonary alveolar type II cells; Fib, fibroblasts; EC, endothelial cells; SMC, smooth muscle cells; LuEC, luminal epithelial cells; BC, basal cells; Ker, keratinocytes. Color intensity indicates the level of expression in a single cell.
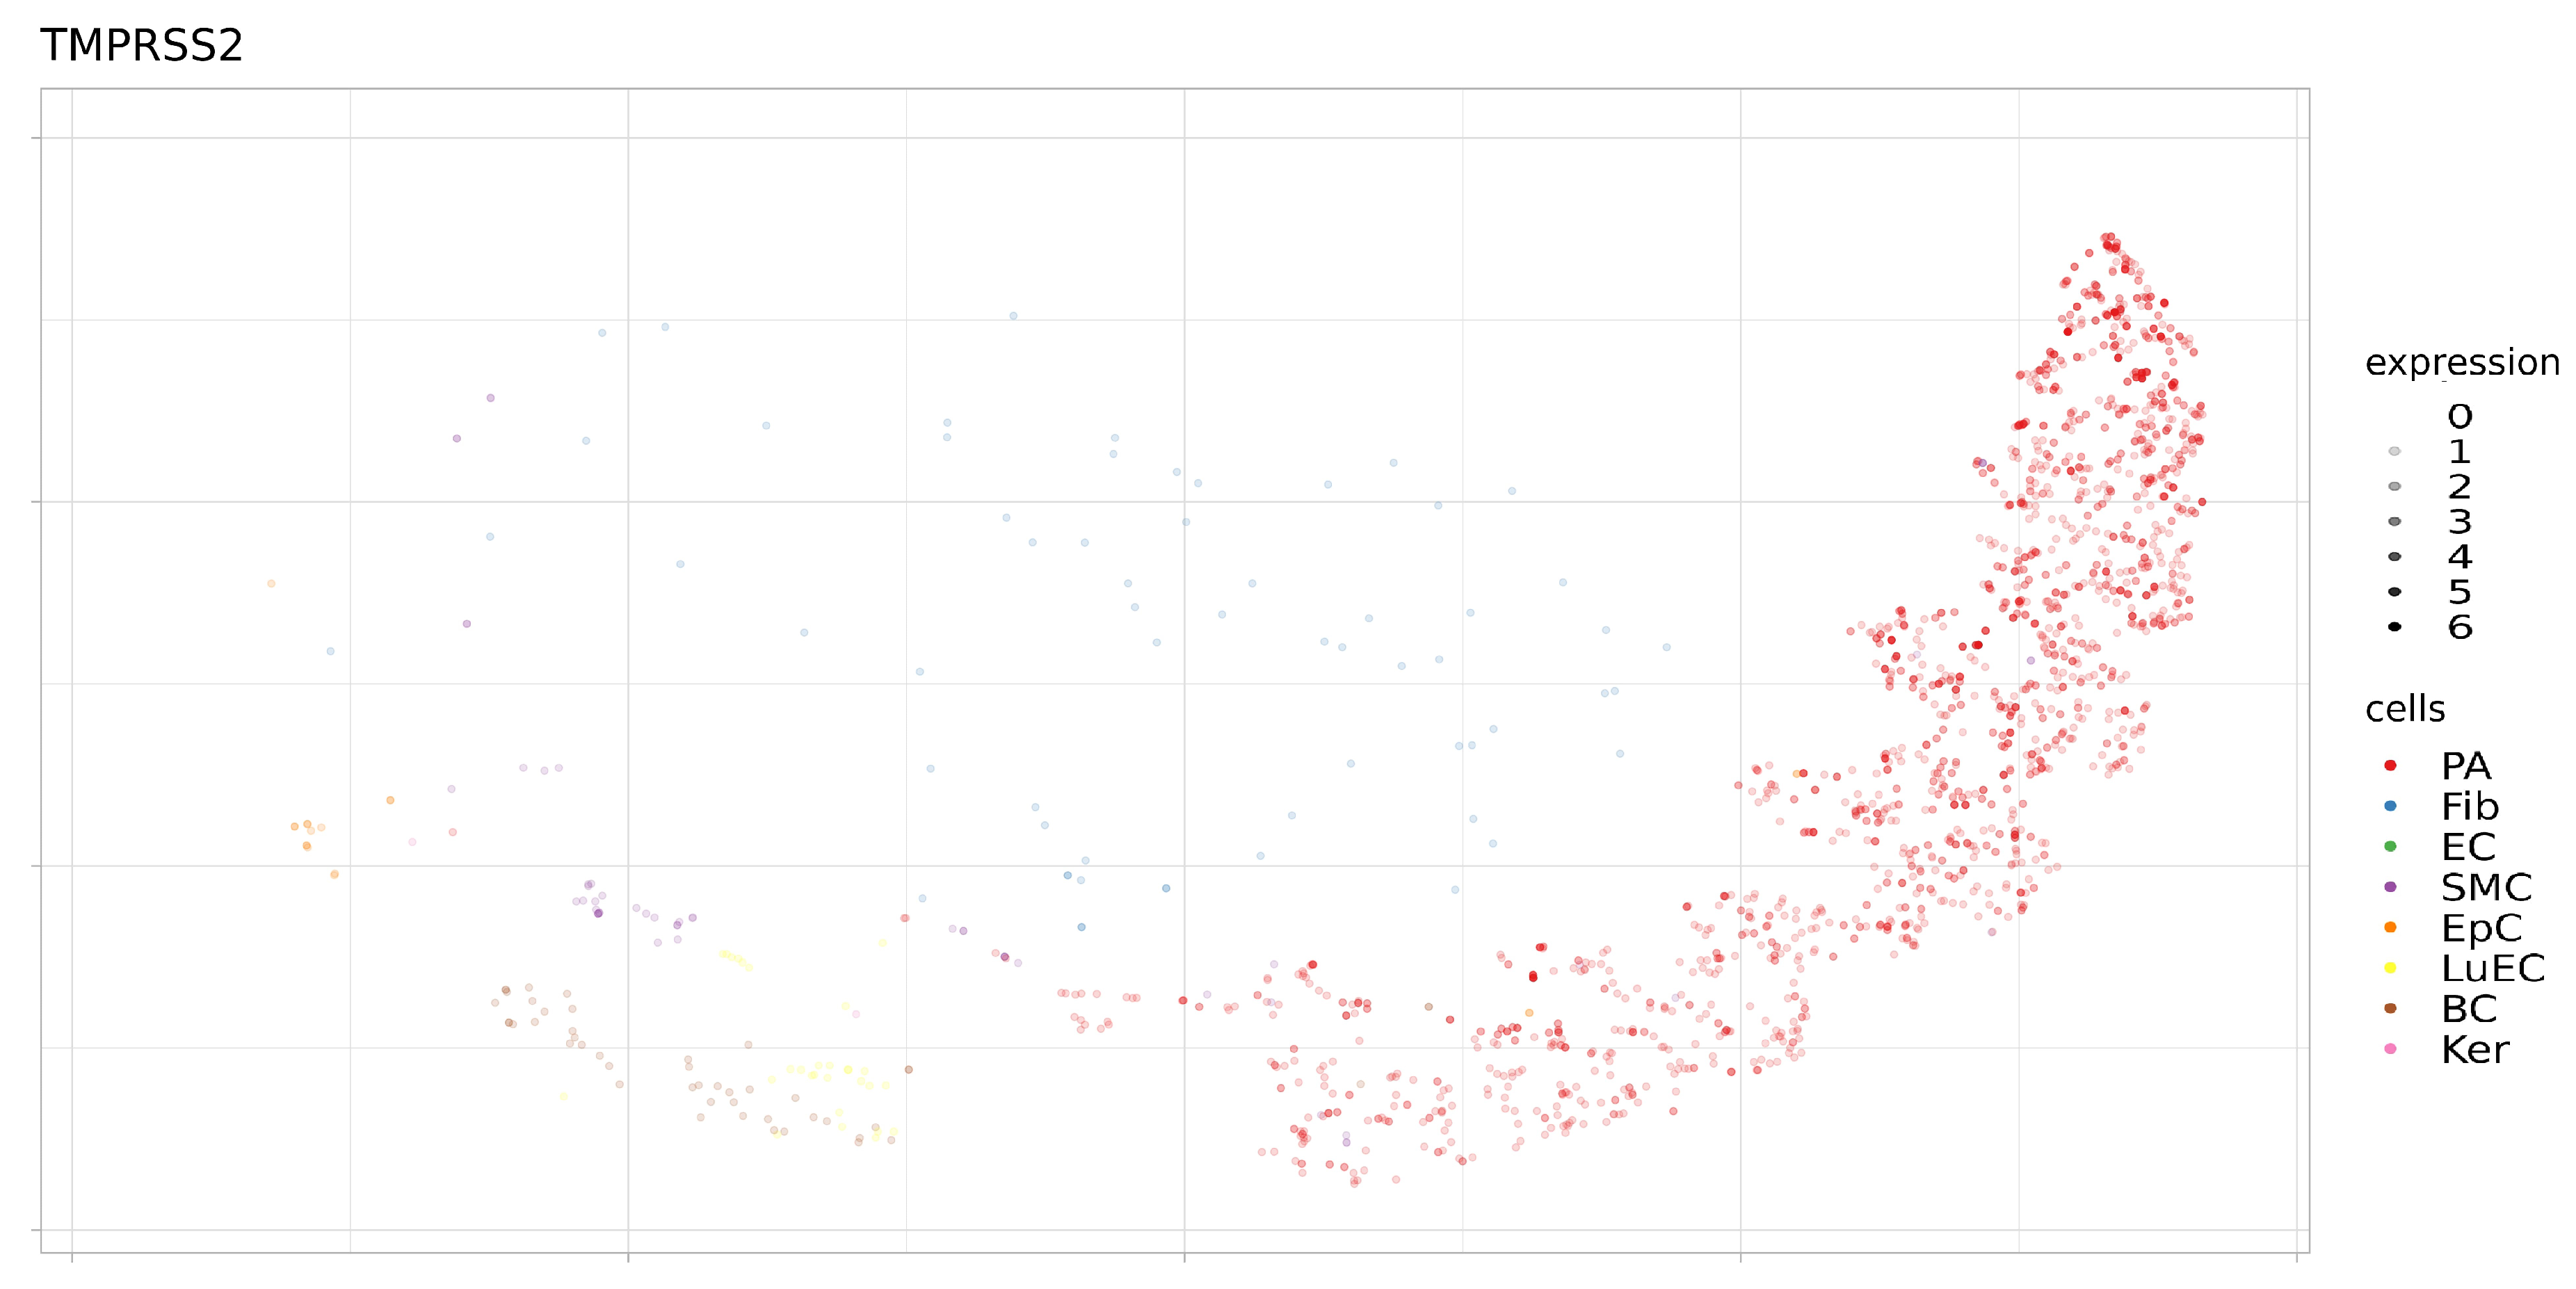
Figure 9.
Expression levels TMPRSS2 in separate cells of proximal stromal lung (SRS2769051). PA, pulmonary alveolar type II cells; Fib, fibroblasts; EC, endothelial cells; SMC, smooth muscle cells; LuEC, luminal epithelial cells; BC, basal cells; Ker, keratinocytes. Color intensity indicates the level of expression in a single cell.
Table 1.
Single nucleotide variant (SNV) and INDEL variant in the TMPRSS2 gene.
Table 1.
Single nucleotide variant (SNV) and INDEL variant in the TMPRSS2 gene.
| Variant Type | Maf > 0.01 | Maf < 0.01 |
|---|
| 3_prime_UTR_variant | 0 | 22 |
| 5_prime_UTR_variant | 0 | 5 |
| frameshift_variant | 0 | 17 |
| inframe_deletion | 0 | 1 |
| inframe_insertion | 0 | 2 |
| intron_variant | 13 | 409 |
| missense_variant | 2 | 332 |
| splice_acceptor_variant | 0 | 4 |
| splice_donor_variant | 0 | 5 |
| splice_region_variant | 0 | 54 |
| stop_gained | 0 | 13 |
| stop_lost | 0 | 1 |
| synonymous_variant | 5 | 140 |
Table 2.
Copy number variation (CNV) variants in the TMPRSS2 gene.
Table 2.
Copy number variation (CNV) variants in the TMPRSS2 gene.
| Region | N | Frequency % | Copy Number | Gene Name |
|---|
| Chr21:42857241-42863723 | 164 | 1.2195122 | 1 | TMPRSS2 |
Table 3.
Frequency of TMPRSS2 missense mutations in North Eurasian population. AZ General information about the region from individual populations was highlighted in bold.
Table 3.
Frequency of TMPRSS2 missense mutations in North Eurasian population. AZ General information about the region from individual populations was highlighted in bold.
| Population | N | rs148125094 | rs143597099 | rs12329760 | rs201093031 |
|---|
| Easten Europe | 419 | 0.0012 | 0.0012 | 0.2983 | 0.0000 |
| Bashkirs Burzyan | 29 | 0.0000 | 0.0000 | 0.1552 | 0.0000 |
| Bashkirs Perm | 15 | 0.0000 | 0.0000 | 0.3000 | 0.0000 |
| Bashkirs Salavat | 15 | 0.0000 | 0.0000 | 0.3667 | 0.0000 |
| Besermians | 16 | 0.0000 | 0.0000 | 0.1563 | 0.0000 |
| Chuvash | 26 | 0.0000 | 0.0000 | 0.3077 | 0.0000 |
| Karelians | 29 | 0.0172 | 0.0000 | 0.3966 | 0.0000 |
| Komi | 30 | 0.0000 | 0.0000 | 0.3333 | 0.0000 |
| Mari | 30 | 0.0000 | 0.0000 | 0.2500 | 0.0000 |
| Mordvins Erzya | 16 | 0.0000 | 0.0000 | 0.3125 | 0.0000 |
| Mordvins Moksha | 30 | 0.0000 | 0.0000 | 0.3000 | 0.0000 |
| Mordvins Shoksha | 14 | 0.0000 | 0.0000 | 0.3214 | 0.0000 |
| Russians | 33 | 0.0000 | 0.0000 | 0.3333 | 0.0000 |
| Tatars Kazan | 30 | 0.0000 | 0.0000 | 0.3000 | 0.0000 |
| Udmurts | 30 | 0.0000 | 0.0000 | 0.3000 | 0.0000 |
| Udmurts Balezino | 28 | 0.0000 | 0.0000 | 0.3214 | 0.0000 |
| Udmurts Sharkan | 18 | 0.0000 | 0.0000 | 0.2500 | 0.0000 |
| Veps | 30 | 0.0000 | 0.0167 | 0.3333 | 0.0000 |
| North Caucasus (excl. Dagestan) | 274 | 0.0018 | 0.0000 | 0.1989 | 0.0000 |
| Abkhaz | 30 | 0.0167 | 0.0000 | 0.3000 | 0.0000 |
| Adyghe | 10 | 0.0000 | 0.0000 | 0.1500 | 0.0000 |
| Balkars | 50 | 0.0000 | 0.0000 | 0.1800 | 0.0000 |
| Chechens | 27 | 0.0000 | 0.0000 | 0.2222 | 0.0000 |
| Cherkess | 30 | 0.0000 | 0.0000 | 0.2167 | 0.0000 |
| Ingush | 30 | 0.0000 | 0.0000 | 0.1500 | 0.0000 |
| Karachays | 22 | 0.0000 | 0.0000 | 0.2045 | 0.0000 |
| Mingrelians | 28 | 0.0000 | 0.0000 | 0.1607 | 0.0000 |
| North Ossetians | 30 | 0.0000 | 0.0000 | 0.1833 | 0.0000 |
| South Ossetians | 17 | 0.0000 | 0.0000 | 0.2059 | 0.0000 |
| Dagestan | 538 | 0.0000 | 0.0000 | 0.2309 | 0.0000 |
| Aghuls | 24 | 0.0000 | 0.0000 | 0.2292 | 0.0000 |
| Akhvakhs | 24 | 0.0000 | 0.0000 | 0.3125 | 0.0000 |
| Andis | 17 | 0.0000 | 0.0000 | 0.2353 | 0.0000 |
| Archins | 24 | 0.0000 | 0.0000 | 0.3333 | 0.0000 |
| Avars | 24 | 0.0000 | 0.0000 | 0.1875 | 0.0000 |
| Bagulals | 23 | 0.0000 | 0.0000 | 0.3261 | 0.0000 |
| Bezhtins | 22 | 0.0000 | 0.0000 | 0.2273 | 0.0000 |
| Botlikhs | 16 | 0.0000 | 0.0000 | 0.1250 | 0.0000 |
| Chamalals | 24 | 0.0000 | 0.0000 | 0.2083 | 0.0000 |
| Dargins | 28 | 0.0000 | 0.0000 | 0.2321 | 0.0000 |
| Ginukhs | 19 | 0.0000 | 0.0000 | 0.0000 | 0.0000 |
| Gunzibians | 17 | 0.0000 | 0.0000 | 0.0294 | 0.0000 |
| Karanogais | 19 | 0.0000 | 0.0000 | 0.2368 | 0.0000 |
| Karatins | 24 | 0.0000 | 0.0000 | 0.3333 | 0.0000 |
| Khvarshins | 15 | 0.0000 | 0.0000 | 0.1000 | 0.0000 |
| Kumyks | 37 | 0.0000 | 0.0000 | 0.2703 | 0.0000 |
| Laks | 24 | 0.0000 | 0.0000 | 0.3125 | 0.0000 |
| Lezgins | 28 | 0.0000 | 0.0000 | 0.2037 | 0.0000 |
| Nogais | 20 | 0.0000 | 0.0000 | 0.2750 | 0.0000 |
| Rutuls | 22 | 0.0000 | 0.0000 | 0.1818 | 0.0000 |
| Tabasarans | 21 | 0.0000 | 0.0000 | 0.2619 | 0.0000 |
| Tindins | 18 | 0.0000 | 0.0000 | 0.2222 | 0.0000 |
| Tsakhurs | 24 | 0.0000 | 0.0000 | 0.2292 | 0.0000 |
| Tsez | 24 | 0.0000 | 0.0000 | 0.2708 | 0.0000 |
| Central Asia | 128 | 0.0000 | 0.0000 | 0.3565 | 0.0000 |
| Dungans | 23 | 0.0000 | 0.0000 | 0.4130 | 0.0000 |
| Kazakh Junior Horde | 29 | 0.0000 | 0.0000 | 0.2931 | 0.0000 |
| Kazakh Great Horde | 26 | 0.0000 | 0.0000 | 0.4423 | 0.0000 |
| Kyrgyz | 28 | 0.0000 | 0.0000 | 0.3704 | 0.0000 |
| Uzbeks | 22 | 0.0000 | 0.0000 | 0.2619 | 0.0000 |
| Siberia | 404 | 0.0000 | 0.0000 | 0.3540 | 0.0013 |
| Altaians Maymalar | 24 | 0.0000 | 0.0000 | 0.3958 | 0.0000 |
| Altaians Kizhi | 25 | 0.0000 | 0.0000 | 0.3600 | 0.0000 |
| Buryats Aginskoe | 23 | 0.0000 | 0.0000 | 0.4130 | 0.0000 |
| Buryats Kurumkan | 28 | 0.0000 | 0.0000 | 0.3929 | 0.0000 |
| Chulyms | 22 | 0.0000 | 0.0000 | 0.3636 | 0.0000 |
| Evenks Yakutia | 28 | 0.0000 | 0.0000 | 0.2857 | 0.0000 |
| Evenks Zabaykalsky Krai | 25 | 0.0000 | 0.0000 | 0.3200 | 0.0000 |
| Kalmyks | 29 | 0.0000 | 0.0000 | 0.3103 | 0.0000 |
| Kets | 15 | 0.0000 | 0.0000 | 0.3333 | 0.0000 |
| Khakas Kachins | 26 | 0.0000 | 0.0000 | 0.4423 | 0.0000 |
| Khakas Sagays | 29 | 0.0000 | 0.0000 | 0.6379 | 0.0000 |
| Khanty Kazym | 30 | 0.0000 | 0.0000 | 0.1333 | 0.0000 |
| Khanty Russkinskie | 26 | 0.0000 | 0.0000 | 0.2500 | 0.0000 |
| Tomsk Tatas | 20 | 0.0000 | 0.0000 | 0.3250 | 0.0000 |
| Tuvans | 28 | 0.0000 | 0.0000 | 0.3036 | 0.0185 |
| Yakuts | 26 | 0.0000 | 0.0000 | 0.4038 | 0.0000 |
| North East Asia | 73 | 0.0000 | 0.0000 | 0.2671 | 0.0284 |
| Chukchi | 25 | 0.0000 | 0.0000 | 0.3000 | 0.0000 |
| Koryaks | 20 | 0.0000 | 0.0000 | 0.3500 | 0.0000 |
| Nivkhs | 13 | 0.0000 | 0.0000 | 0.1538 | 0.0769 |
| Udege | 15 | 0.0000 | 0.0000 | 0.2000 | 0.0714 |
Table 4.
Frequency of TMPRSS2 missense mutations in worldwide data (GnomAD). AZ General information about the region from individual populations was highlighted in bold.
Table 4.
Frequency of TMPRSS2 missense mutations in worldwide data (GnomAD). AZ General information about the region from individual populations was highlighted in bold.
| | rs148125094 | rs12329760 | rs201093031 |
|---|
| Population | N | Frequency | N | Frequency | N | Frequency |
| European | 77147 | 0.0014 | 76846 | 0.2549 | 77117 | 0.0000 |
| Finnish | 12560 | 0.0016 | 12544 | 0.3725 | 12561 | 0.0000 |
| Estonian | 2416 | 0.0060 | 2394 | 0.3074 | 2406 | 0.0000 |
| Southern European | 5805 | 0.0013 | 5778 | 0.1748 | 5802 | 0.0000 |
| North-western European | 25402 | 0.0012 | 25348 | 0.2212 | 25391 | 0.0000 |
| Other non-Finnish European | 16562 | 0.0012 | 16439 | 0.2286 | 16557 | 0.0000 |
| Swedish | 13067 | 0.0010 | 13013 | 0.2722 | 13066 | 0.0000 |
| Bulgarian | 1335 | 0.0007 | 1330 | 0.1970 | 1334 | 0.0000 |
| South Asian | 15308 | 0.0007 | 15298 | 0.2477 | 15303 | 0.0000 |
| Latino | 17718 | 0.0003 | 17705 | 0.1533 | 17697 | 0.0000 |
| African | 12480 | 0.0002 | 12448 | 0.2918 | 12480 | 0.0000 |
| Ashkenazi Jewish | 5185 | 0.0000 | 5163 | 0.1352 | 5179 | 0.0000 |
| East Asian | 9196 | 0.0000 | 9188 | 0.3810 | 9193 | 0.0024 |
| Japanese | 76 | 0.0000 | 76 | 0.4013 | 76 | 0.0000 |
| Korean | 1909 | 0.0000 | 1909 | 0.3675 | 1909 | 0.0018 |
| Other East Asian | 7211 | 0.0000 | 7203 | 0.3844 | 7208 | 0.0026 |
Table 5.
Expression quantitative trait locus (eQTL) altering expression level TMPRSS2.
Table 5.
Expression quantitative trait locus (eQTL) altering expression level TMPRSS2.
| | N SNP | Average Maf | Average Slope |
|---|
| down | 60 | 0.3722896 | −0.09795966 |
| up | 76 | 0.4537386 | 0.09709619 |
Table 6.
MicroRNA regulating the expression of TMPRSS2 and BSG genes and showed expression in immune and endothelial cells. According to FANTOM5.
Table 6.
MicroRNA regulating the expression of TMPRSS2 and BSG genes and showed expression in immune and endothelial cells. According to FANTOM5.
| miRNA | Cell Ontology |
|---|
| hsa-miR-4476 | B cell |
| hsa-miR-5187-3p | myeloid leukocyte |
| hsa-miR-5187-3p | hematopoietic cell |
| hsa-miR-7849-3p | endothelial cell |
| hsa-miR-7849-3p | blood vessel endothelial cell |
| hsa-miR-7849-3p | endothelial cell of vascular tree |
| hsa-miR-7849-3p | neutrophil |
Table 7.
Drugs that alter expression TMPRSS2.
Table 7.
Drugs that alter expression TMPRSS2.
| Drug | Drug Groups | Change | References |
|---|
| Acetaminophen | Approved | downregulated | 21420995 |
| Acyline | Investigational | downregulated | 17510436 |
| Stanolone | Illicit Investigational | downregulated | 12711008 |
| Stanolone | Illicit Investigational | upregulated | 20601956, 23708653 |
| Estradiol | Approved Investigational Vet Approved | downregulated | 24758408 |
| Estradiol | Approved Investigational Vet Approved | upregulated | 19619570 |
| Curcumin | Approved Experimental Investigational | downregulated | 18719366, 22258452 |
| Cyclosporine | Approved Investigational Vet Approved | downregulated | 20106945 |
| Calcitriol | Approved Nutraceutical | upregulated | 21592394, 26485663 |
| Entinostat | Investigational | upregulated | 26272509 |
| Ethinylestradiol | Approved | downregulated | 18936297 |
| Genistein | Investigational | downregulated | 15378649, 26865667 |
| Metribolone | Experimental | downregulated | 12711008 |
| Metribolone | Experimental | upregulated | 17010675, 21440447 |
| Resveratrol | Investigational | downregulated | 18586690 |
| Selenium | Approved Investigational Vet Approved | upregulated | 19244175 |
| Testosterone | Approved Investigational | upregulated | 21592394 |
| Tretinoin | Approved Investigational Nutraceutical | upregulated | 23830798 |
| Valproic acid | Approved Investigational | upregulated | 23179753, 24383497, 26272509 |
| Zoledronic acid | Approved | upregulated | 24714768 |
Table 8.
Drugs that alter expression BSG.
Table 8.
Drugs that alter expression BSG.
| Drug | Drug Groups | Change | References |
|---|
| Amiodarone | Approved Investigational | upregulated | 19774075 |
| Arsenic trioxide | Approved Investigational | downregulated | 23232515 |
| Estradiol | Approved Investigational Vet Approved | upregulated | 19167446 |
| Methotrexate | Approved | downregulated | 25339124 |
| Quercetin | Experimental Investigational | upregulated | 21632981 |
| Isotretinoin | Approved | downregulated | 20436886 |
| Silicon dioxide | Approved | downregulated | 25895662 |
| Valproic acid | Approved Investigational | downregulated | 23179753 |

 ,
, 


