Article

High Genetic Diversity despite Conserved Karyotype Organization in the Giant Trahiras from Genus Hoplias (Characiformes, Erythrinidae)

by
Francisco de M. C. Sassi
1,
Manolo F. Perez
1,
Vanessa Cristina S. Oliveira
1,
Geize A. Deon
1,
Fernando H. S. de Souza
1,
Pedro H. N. Ferreira
1,
Ezequiel A. de Oliveira
2,
Terumi Hatanaka
1,
Thomas Liehr
3,*,
Luiz A. C. Bertollo
1 and
Marcelo de B. Cioffi
1
1
Laboratório de Citogenética de Peixes, Departamento de Genética e Evolução, Universidade Federal de São Carlos, 13565-905 São Carlos, SP, Brazil
2
Secretaria de Estado de Educação de Mato Grosso—SEDUC-MT, 78049-909 Cuiabá, MT, Brazil
3
Institute of Human Genetics, University Hospital Jena, 07747 Jena, Germany
*
Author to whom correspondence should be addressed.
Submission received: 28 January 2021 / Revised: 5 February 2021 / Accepted: 5 February 2021 / Published: 10 February 2021
(This article belongs to the Special Issue Nucleotide Sequences and Genome Organization)

Abstract

:
In the fish genus Hoplias, two major general groups can be found, one of which is formed by the “common trahiras” (Hoplias malabaricus group) and the other by the “giant trahiras” (Hoplias lacerdae group, in addition to Hoplias aimara), which usually comprises specimens of larger body size. Previous investigations from the giant trahiras group recovered 2n = 50 meta/submetacentric chromosomes and no sex chromosome differentiation, indicating a probable conservative pattern for their karyotype organization. Here, we conducted comparative cytogenetic studies in six giant trahiras species, two of them for the first time. We employed standard and advanced molecular cytogenetics procedures, including comparative genomic hybridization (CGH), as well as genomic assessments of diversity levels and phylogenetic relationships among them. The results strongly suggest that the giant trahiras have a particular and differentiated evolutionary pathway inside the Hoplias genus. While these species share the same 2n and karyotypes, their congeneric species of the H. malabaricus group show a notable chromosomal diversity in number, morphology, and sex chromosome systems. However, at the same time, significant changes were characterized at their inner chromosomal level, as well as in their genetic diversity, highlighting their current relationships resulting from different evolutionary histories.

1. Introduction

The neotropical freshwater ichthyofauna encompasses more than 5200 species distributed from the southern United States to southern Argentina, in which the order Characiformes, with almost 2300 species, stands out as a notable representative of this biodiversity [1,2,3]. Erythrinidae is a characiform family with few species, but displays a large geographic distribution throughout South America [4]. Broad distributions, associated with gene flow restrictions, generally offer suitable conditions for the fixation of distinct evolutionary characteristics among distant populations. This condition is even more remarkable for freshwater fishes since their dispersal can be limited and often confined to isolated hydrographic systems [5]. Such a situation is particularly true for the Erythrinidae family, in which intra-specific chromosomal differentiation has been highlighted for several of its representatives [6,7]. A significant amount of cytogenetic data highlight the diversity displayed by populations of its three genera, including karyotypes with different diploid numbers (2n), chromosomal morphology, and sex chromosome systems, some of which are already well differentiated while others display an early stage of differentiation [6,7,8,9,10,11,12].
Despite such remarkable cytogenetic diversity, only 18 species are currently recognized for this family, distributed in three genera: Erythrinus (2), Hoplerythrinus (3), and Hoplias (13) [4,13,14]. This likely does not reflect the real taxonomic status of the Erythrinidae family, if we consider the chromosomal diversity observed within several of its species (revised in [15]). Particularly, two major general groups can be found in the genus Hoplias, the “common trahiras” (Hoplias malabaricus group), and the “giant trahiras” (Hoplias lacerdae group; [13]). For the first group, a considerable amount of cytogenetic data highlight the meaningful intra-specific diversity that occurs in the H. malabaricus nominal species. Indeed, seven major karyomorphs (i.e., exclusive and different karyotypes) have been identified until now [7,8,10,12,16], indicating a probable species complex and the need for a taxonomic review of this group.
Conversely, concerning the giant trahiras, five species are currently recognized in the Hoplias lacerdae group based on their differential meristic and morphological aspects, namely Hoplias australis, Hoplias brasiliensis, Hoplias curupira, Hoplias intermedius, and H. lacerdae [13]. This group presents the medial margins of the dentaries showing a somewhat parallel position and the absence of teeth in the basihyal, unlike what occurs in the H. malabaricus group [13]. Notably, and distinct to what is found in the H. malabaricus group, H. lacerdae species are characterized by a more stable karyotypic organization, both at the numerical and structural levels [17,18]. In the most recent assessment, three out of its five species (H. lacerdae, H. brasiliensis, and H. intermedius) were investigated [19]. All evaluated species showed 2n = 50 meta- and submetacentric chromosomes, with undifferentiated sex chromosome systems. Besides, there were similar distribution patterns for the C-positive heterochromatin and some interspecific differentiations were evidenced from the chromosomal mapping of repetitive DNA sequences [19]. Interestingly, another large trahira species, Hoplias aimara, for which the taxonomy has already been revised and validated [20], but not inserted into the H. lacerdae group due to its morphological features [13], also shares these karyotypic features [19,21].
In the present study, we conducted comparative cytogenetic studies in six giant trahira species, three of them examined for the first time, using conventional and advanced molecular cytogenetic methods. Then, we compared our cytogenetic results to those recovered with genotyping by high-throughput sequencing technology, to explore diversity at the chromosomal and genomic level. The resulting data allowed us to characterize their chromosomal evolutionary trends, highlighting their genomic relationships, and uncovering chromosome homologies and differences among them.

2. Materials and Methods

2.1. Individuals, Collection Sites, and Classical Cytogenetic Methods

We analyzed five species of the H. lacerdae group, namely Hoplias lacerdae, H. brasiliensis, H. intermedius, H. curupira, and H. australis, the former two for the first time. Another giant trahira, H. aimara, was also re-investigated. Figure 1A and Table 1 depict the Brazilian distribution of species and the number of individuals studied.
Mitotic chromosomes were obtained by the air-drying protocol [23] using kidney cells after in vivo colchicine treatment. The detection of C-positive heterochromatin (C-banding) followed [24] and the staining of Ag-NOR bands, [25]. In the latter, the formic acid plus gelatin solution was applied twice, and the glass slide was placed on a heating plate at 65 °C for about 3.50 min, or until the chromosomal spreads turned into a brown/caramel aspect.

2.2. Fish-Based Experiments

Probes for fluorescence in situ hybridization (FISH) were obtained from nuclear DNA previously cloned into plasmid vectors and propagated in competent cells of Escherichia coli DH5α (Invitrogen, San Diego, CA, USA). The 5S rDNA probe included 120 base pairs (bp) of the RNAr 5S codificant gene and 200 bp of a non-transcribed spacer (NTS), isolated according to [26]. The 18S rDNA probe contained a 1400 bp segment of the rRNA 18S gene, isolated according to [27]. Both probes were directly labeled with the Nick-Translation mix kit (Jena Bioscience, Jena, Germany). The 5S rDNA probe was labeled with Atto550-dUTP and the 18S rDNA one with AF488-dUTP, according to the manufacturer’s manual. Small repetitive sequences ((A)30, (CA)15, (GA)15, and (CAC)10) were directly labeled with Cy-3 during the synthesis, as described by [28]. The FISH experiments followed high stringency conditions, as related in [29].
Comparative genomic hybridization (CGH) experiments were performed using genomic DNA of all species analyzed on metaphase chromosomes of Hoplias intermedius as a reference. The female-derived gDNA of all species was extracted from liver tissue following [30]. In all assays, the gDNA of H. intermedius was directly labeled with AF488-dUTP (green fluorescence) using a Nick-translation-based labeling kit (Jena Bioscence, Jena, Germany), and the gDNA of H. aimara, H. australis, H. brasiliensis, H. lacerdae, and H. curupira was directly labeled with Atto550-dUTP (red fluorescence), also using the nick-translation labeling kit. The final hybridization mix contained 500 ng of H. intermedius gDNA plus 500 ng of gDNA from the other species. Blocking of repetitive sequences was achieved using 15 μg of C0t-1 female-derived DNA from each species [31] dissolved in 20 μL of hybridization buffer containing 50% formamide plus 2× saline-sodium citrate (SSC), in addition to 10% sodium dodecyl sulphate (SDS), 10% dextran sulphate, and Denhardt’s buffer (pH 7.0). The ratio of probe vs. C0t-1 was based on several other CGH experiments conducted in fish groups [16,32,33,34,35].
The 2n value, karyotype structure, and CGH results were confirmed by the analysis of at least 30 metaphase spreads per individual. Images were captured using an Olympus BX50 microscope (Olympus Corporation, Ishikawa, Japan), with a CoolSNAP camera and processed using Image-Pro Plus 4.1 software (Media Cybernetics, Silver Spring, MD, USA). Chromosomes were classified as metacentric (m), submetacentric (sm), subtelocentric (st), or acrocentric (a), according to [36], and were organized in the figures using Adobe Photoshop CC 2020.

2.3. DArTseq Genotyping and Genetic Diversity

To perform DNA sequencing, liver fragments from all samples presented in Table 2 were sent to Diversity Arrays Technology Pty Ltd. (Canberra, Australia). The DArTseq procedure consists of a complexity reduction method based on the use of a frequently cut enzyme (SphI), and a methylation-sensitive enzyme (PstI). Prepared libraries were then sequenced on an Illumina HiSeq2500 platform. Raw sequence data were analyzed in ipyrad v.0.9.59 for quality filtering and recovery of SNP (Single Nucleotide Polymorphism) genotypes. Specifically, sequences with less than 35 base pairs or with more than four low-quality bases (considering Q < 20) were discarded and sequencing adapters were trimmed. Then, the pipeline performed a de novo clustering and aligned the reads for each sample separately, retaining only clusters with six or more reads as a pre-locus. The obtained pre-loci for each sample were then clustered between all samples. Clusters present in all samples were classified as definitive loci and only unlinked markers were retained by selecting only the SNPs with less missing data from each locus. The resulting SNP matrix was exported and used in further analyses.
Genetic diversity within populations of each species was assessed using the R package dartR [37] by estimating allelic richness (AR), private alleles (PA), observed heterozygosity (HO), expected heterozygosity (HE), and the Shannon diversity index (S—according to [38]).

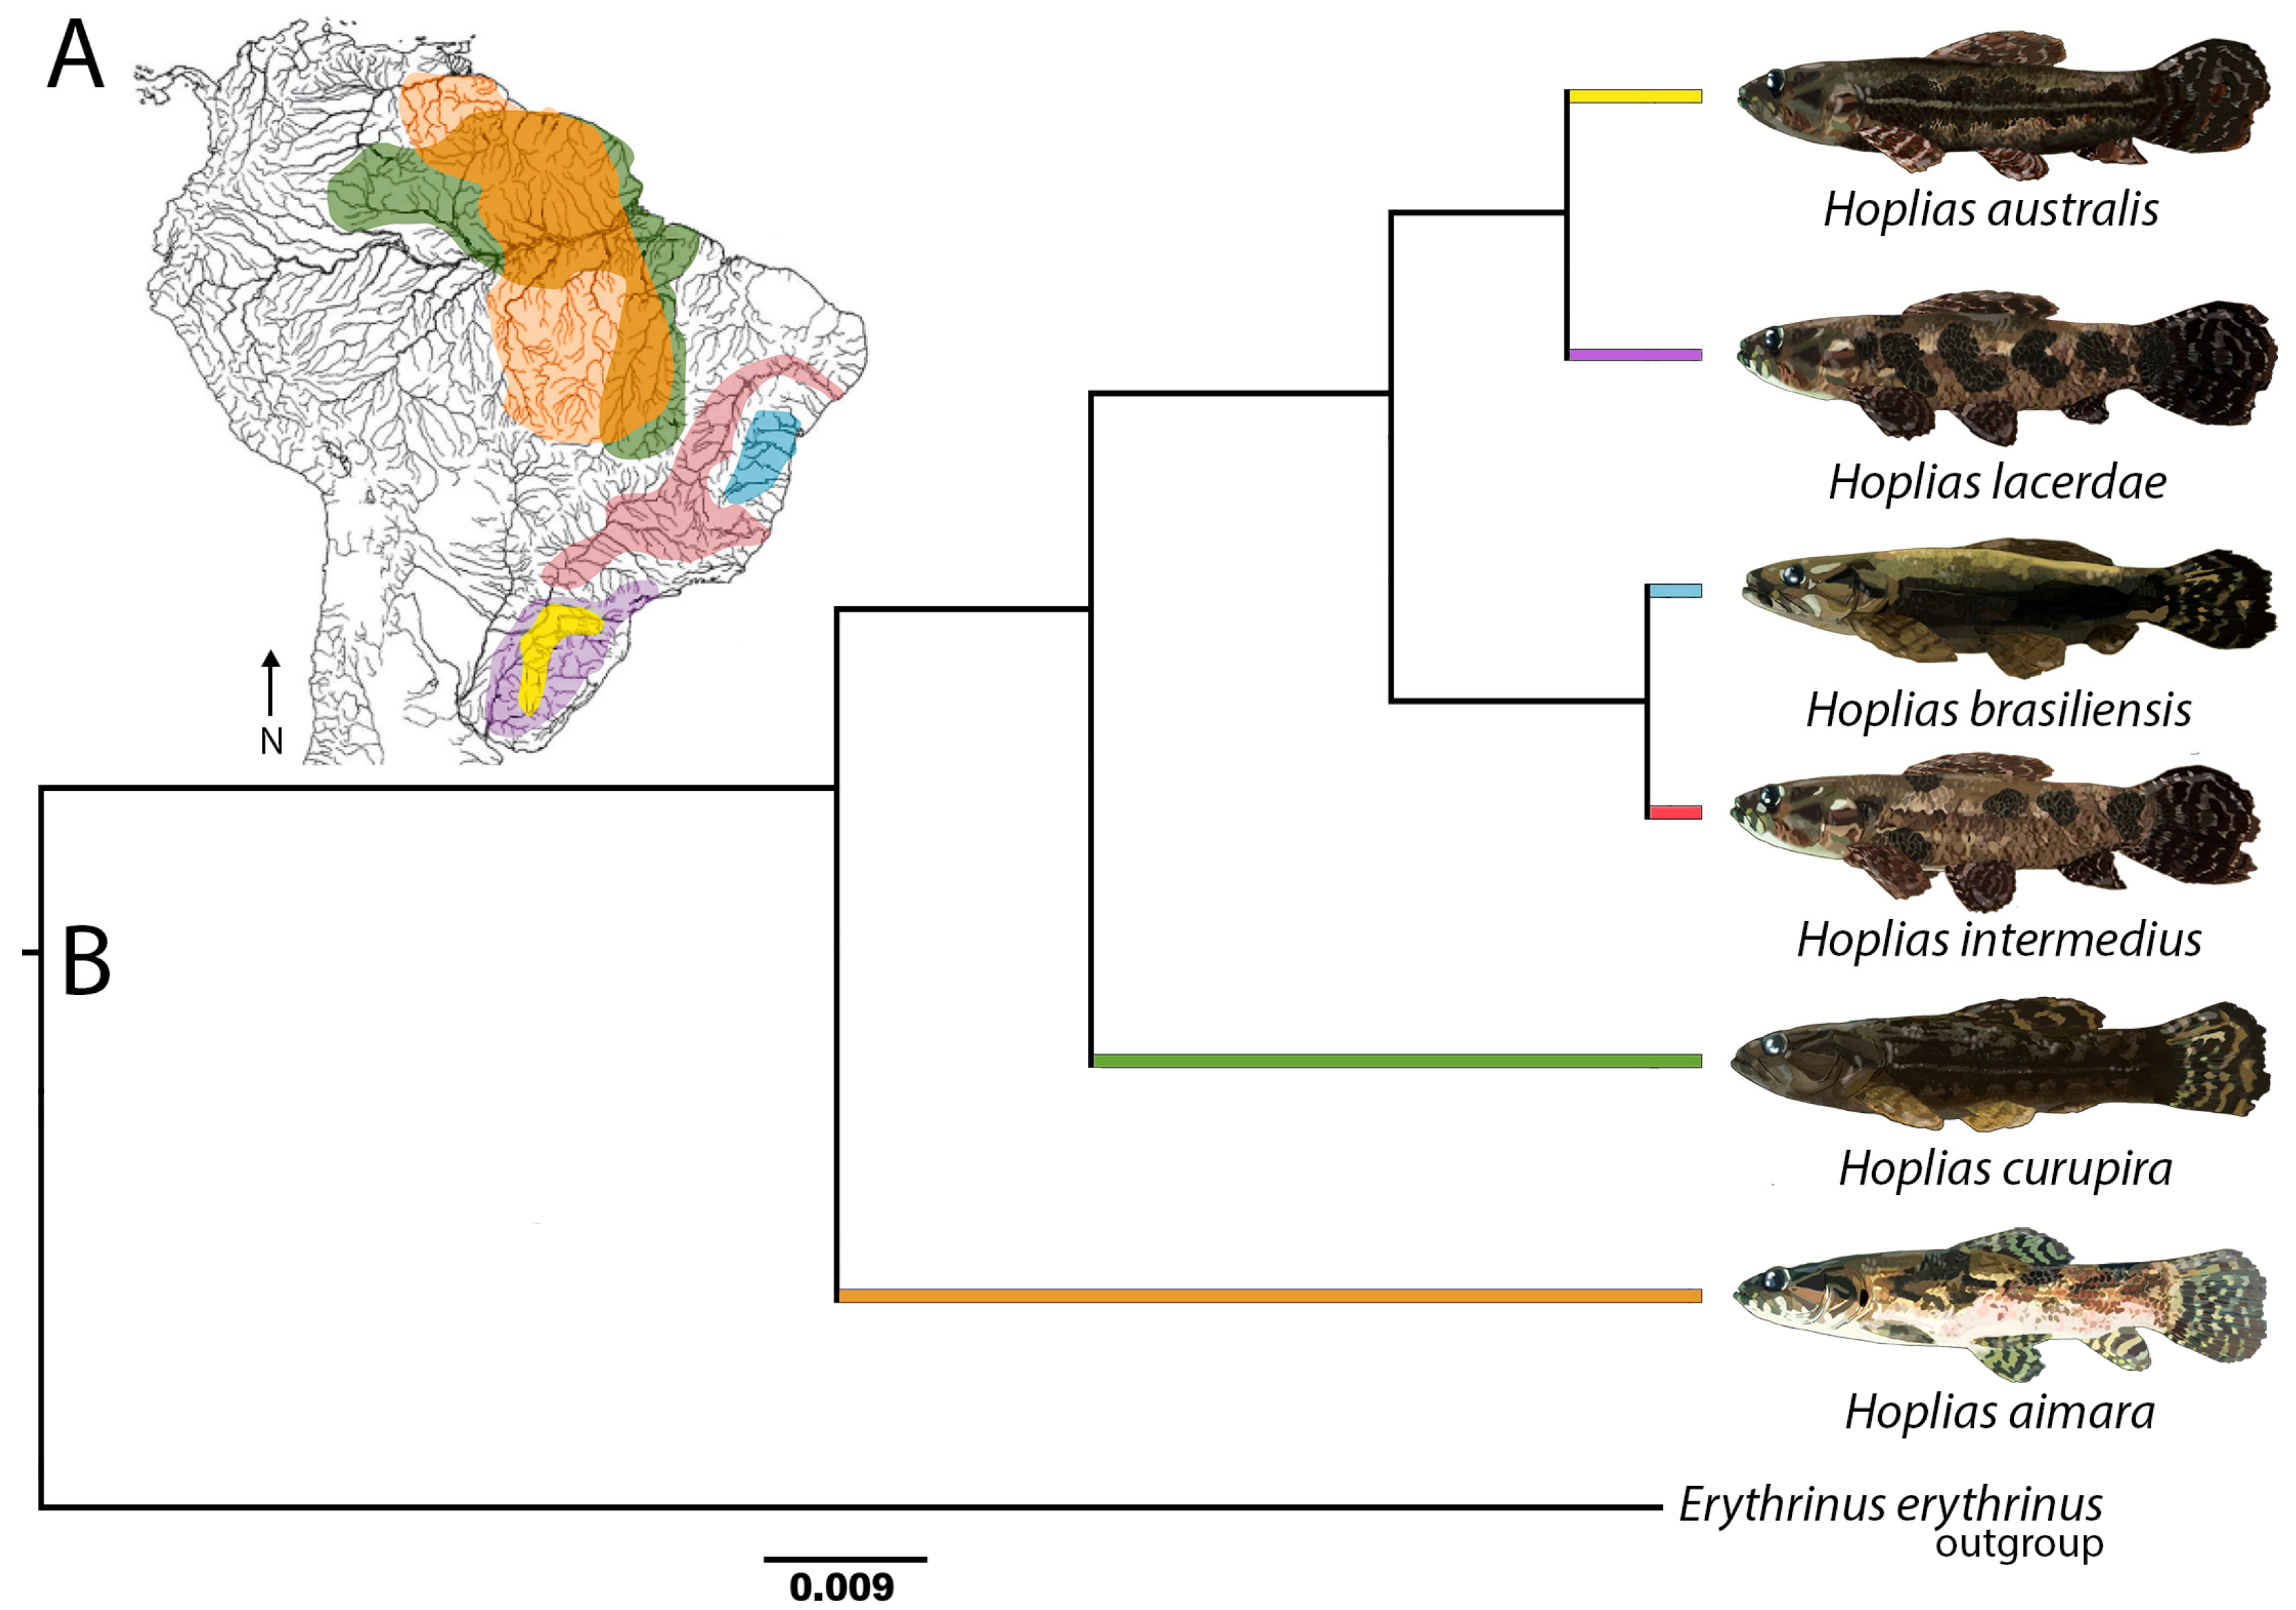
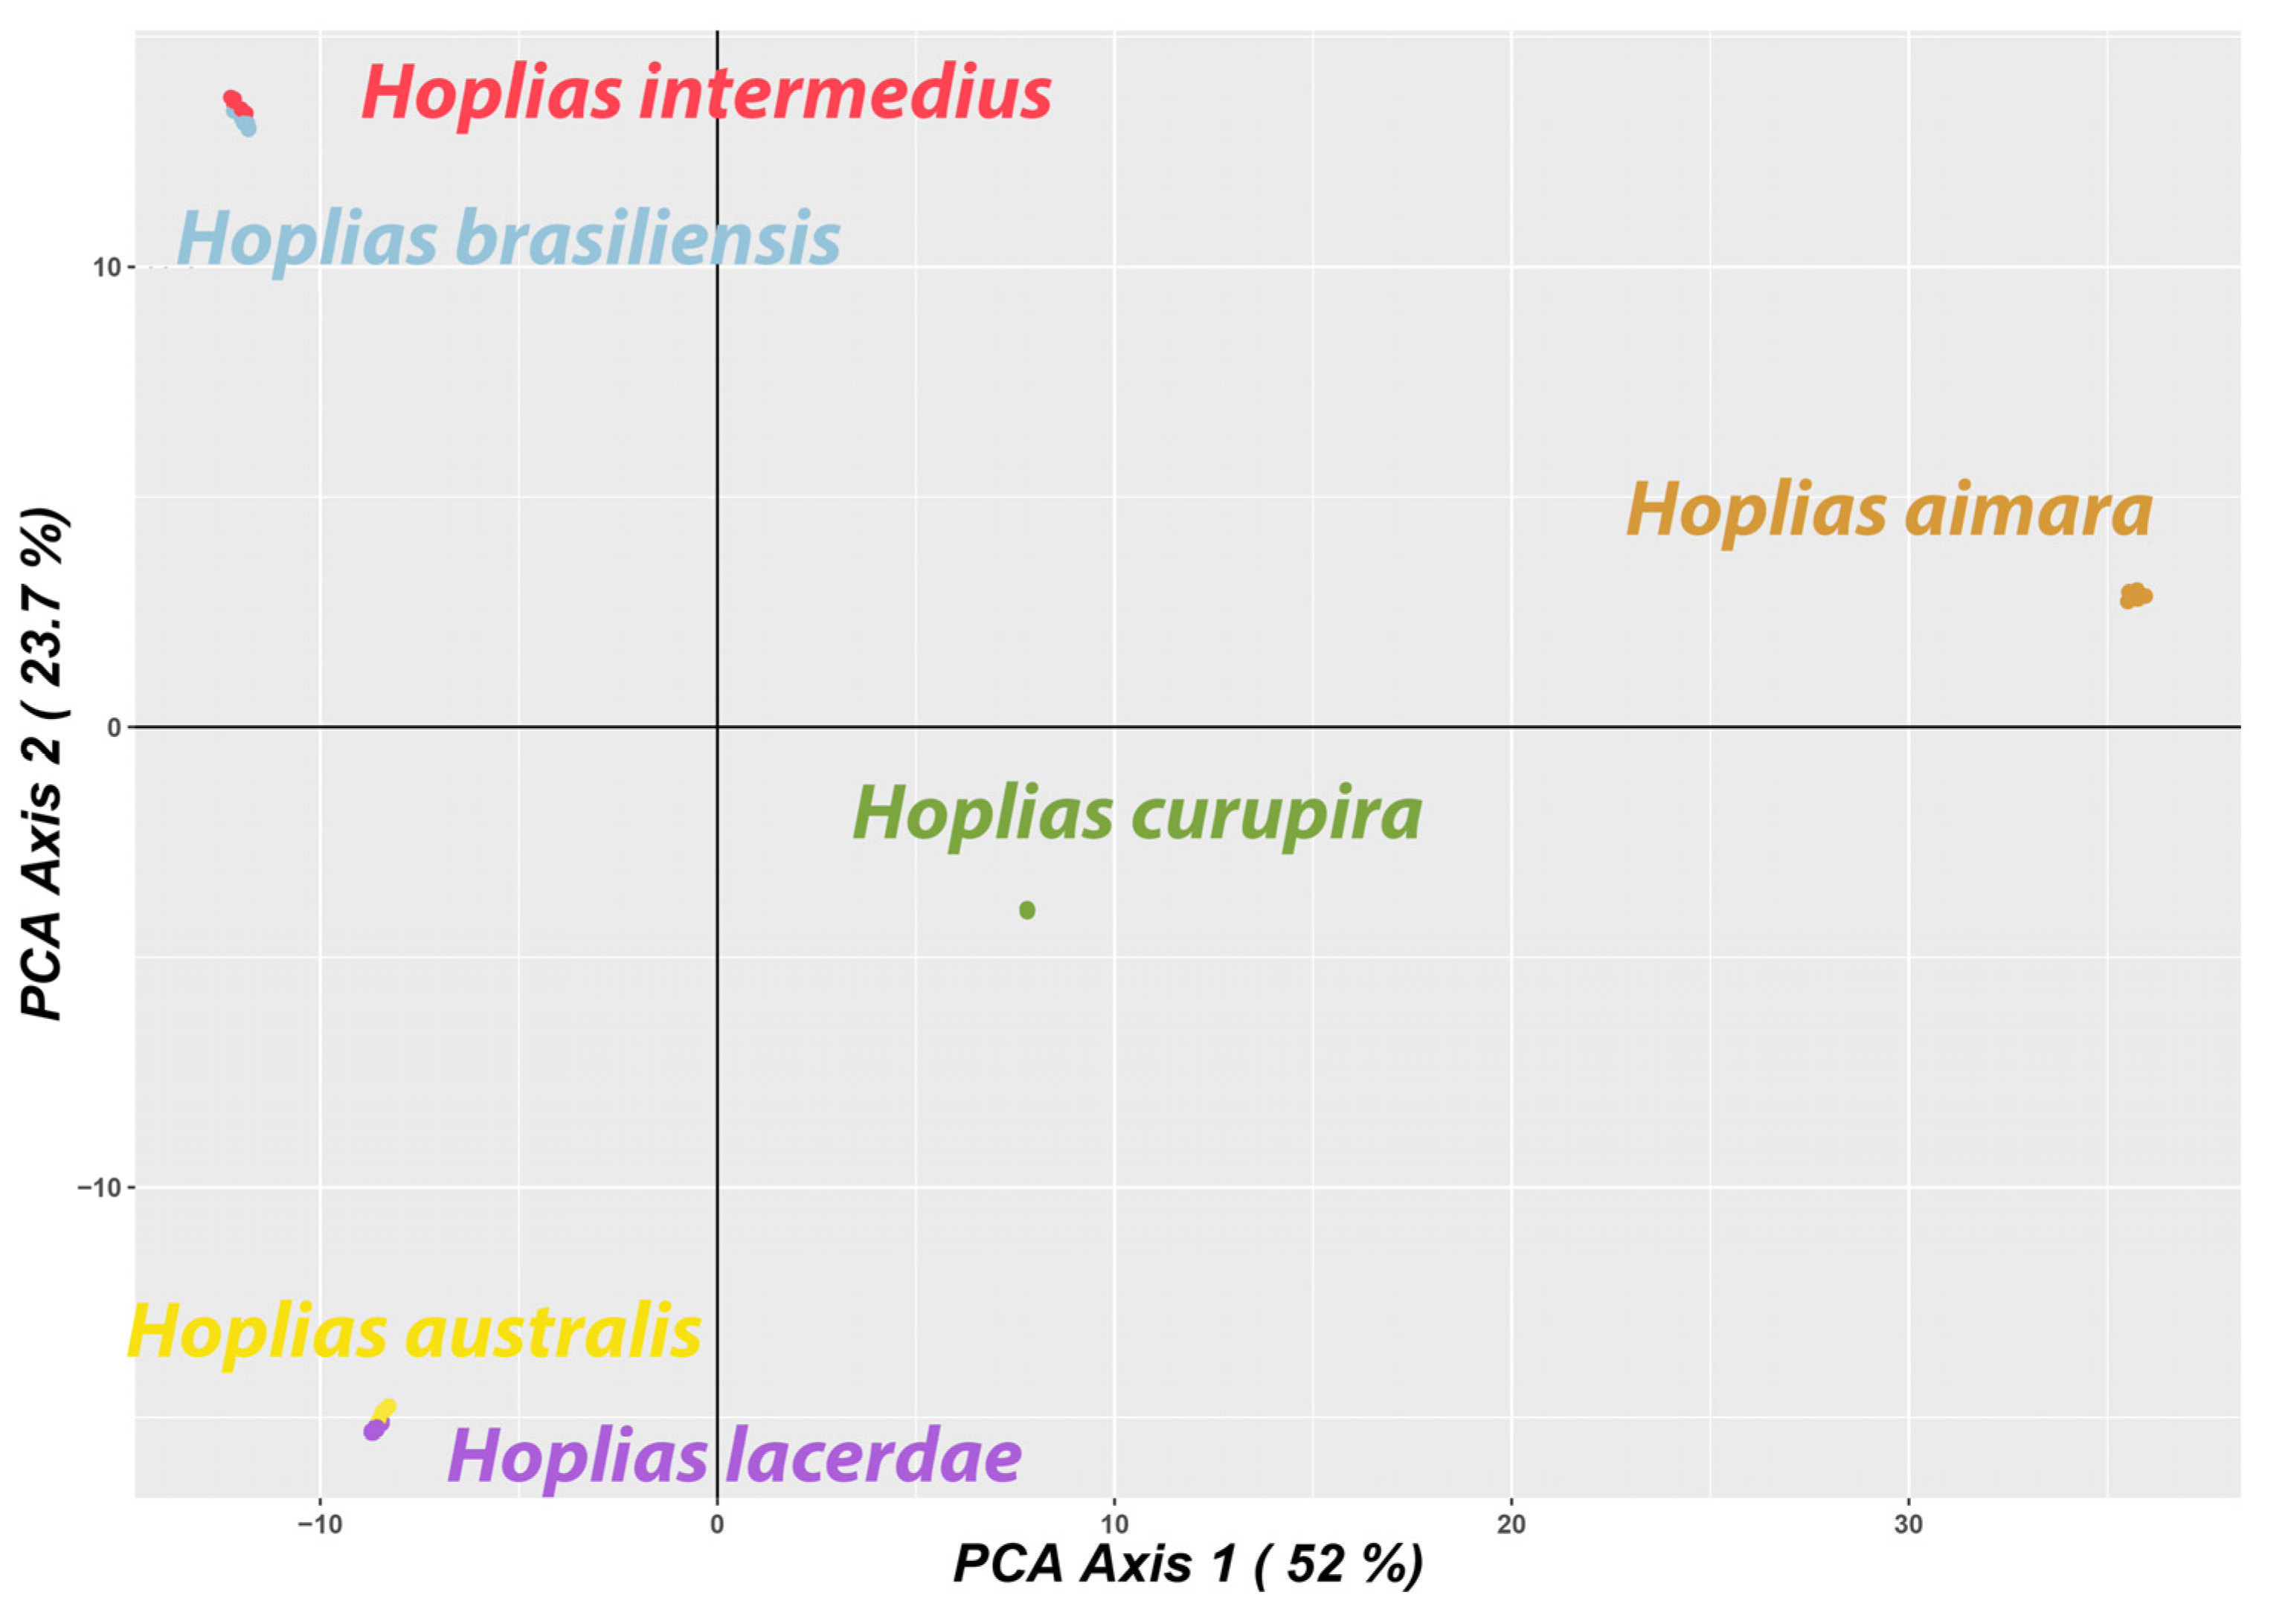
2.4. Genetic Relationships and Phylogenetic Estimation

We also used dartR to visualize the genetic diversity distribution among species with a principal coordinate analysis (PCoA). The phylogenetic relationships were estimated from the SNP matrix by inferring a species tree with the Bayesian software SNAPP v.1.5.1. [39], part of the BEAST v.2.6.3 package [40]. We performed two independent Markov chain Monte Carlo (MCMC) runs of 1 million generations, sampling every 500 generations, with settings and prior values following suggestions from [22]. Specifically, both relative mutation rates were not sampled and assumed to be 1, while the coalescent rate was set with an initial value of 200, and the distributions for populations theta values and lambda were left at the default values. Tracer v1.7.1 [41] was used to check convergence, and a maximum clade credibility tree based on common ancestor heights was generated after a 25% burn-in in TreeAnnotator. FigTree v1.4.3 was used to generate the consensus tree figure.

3. Results

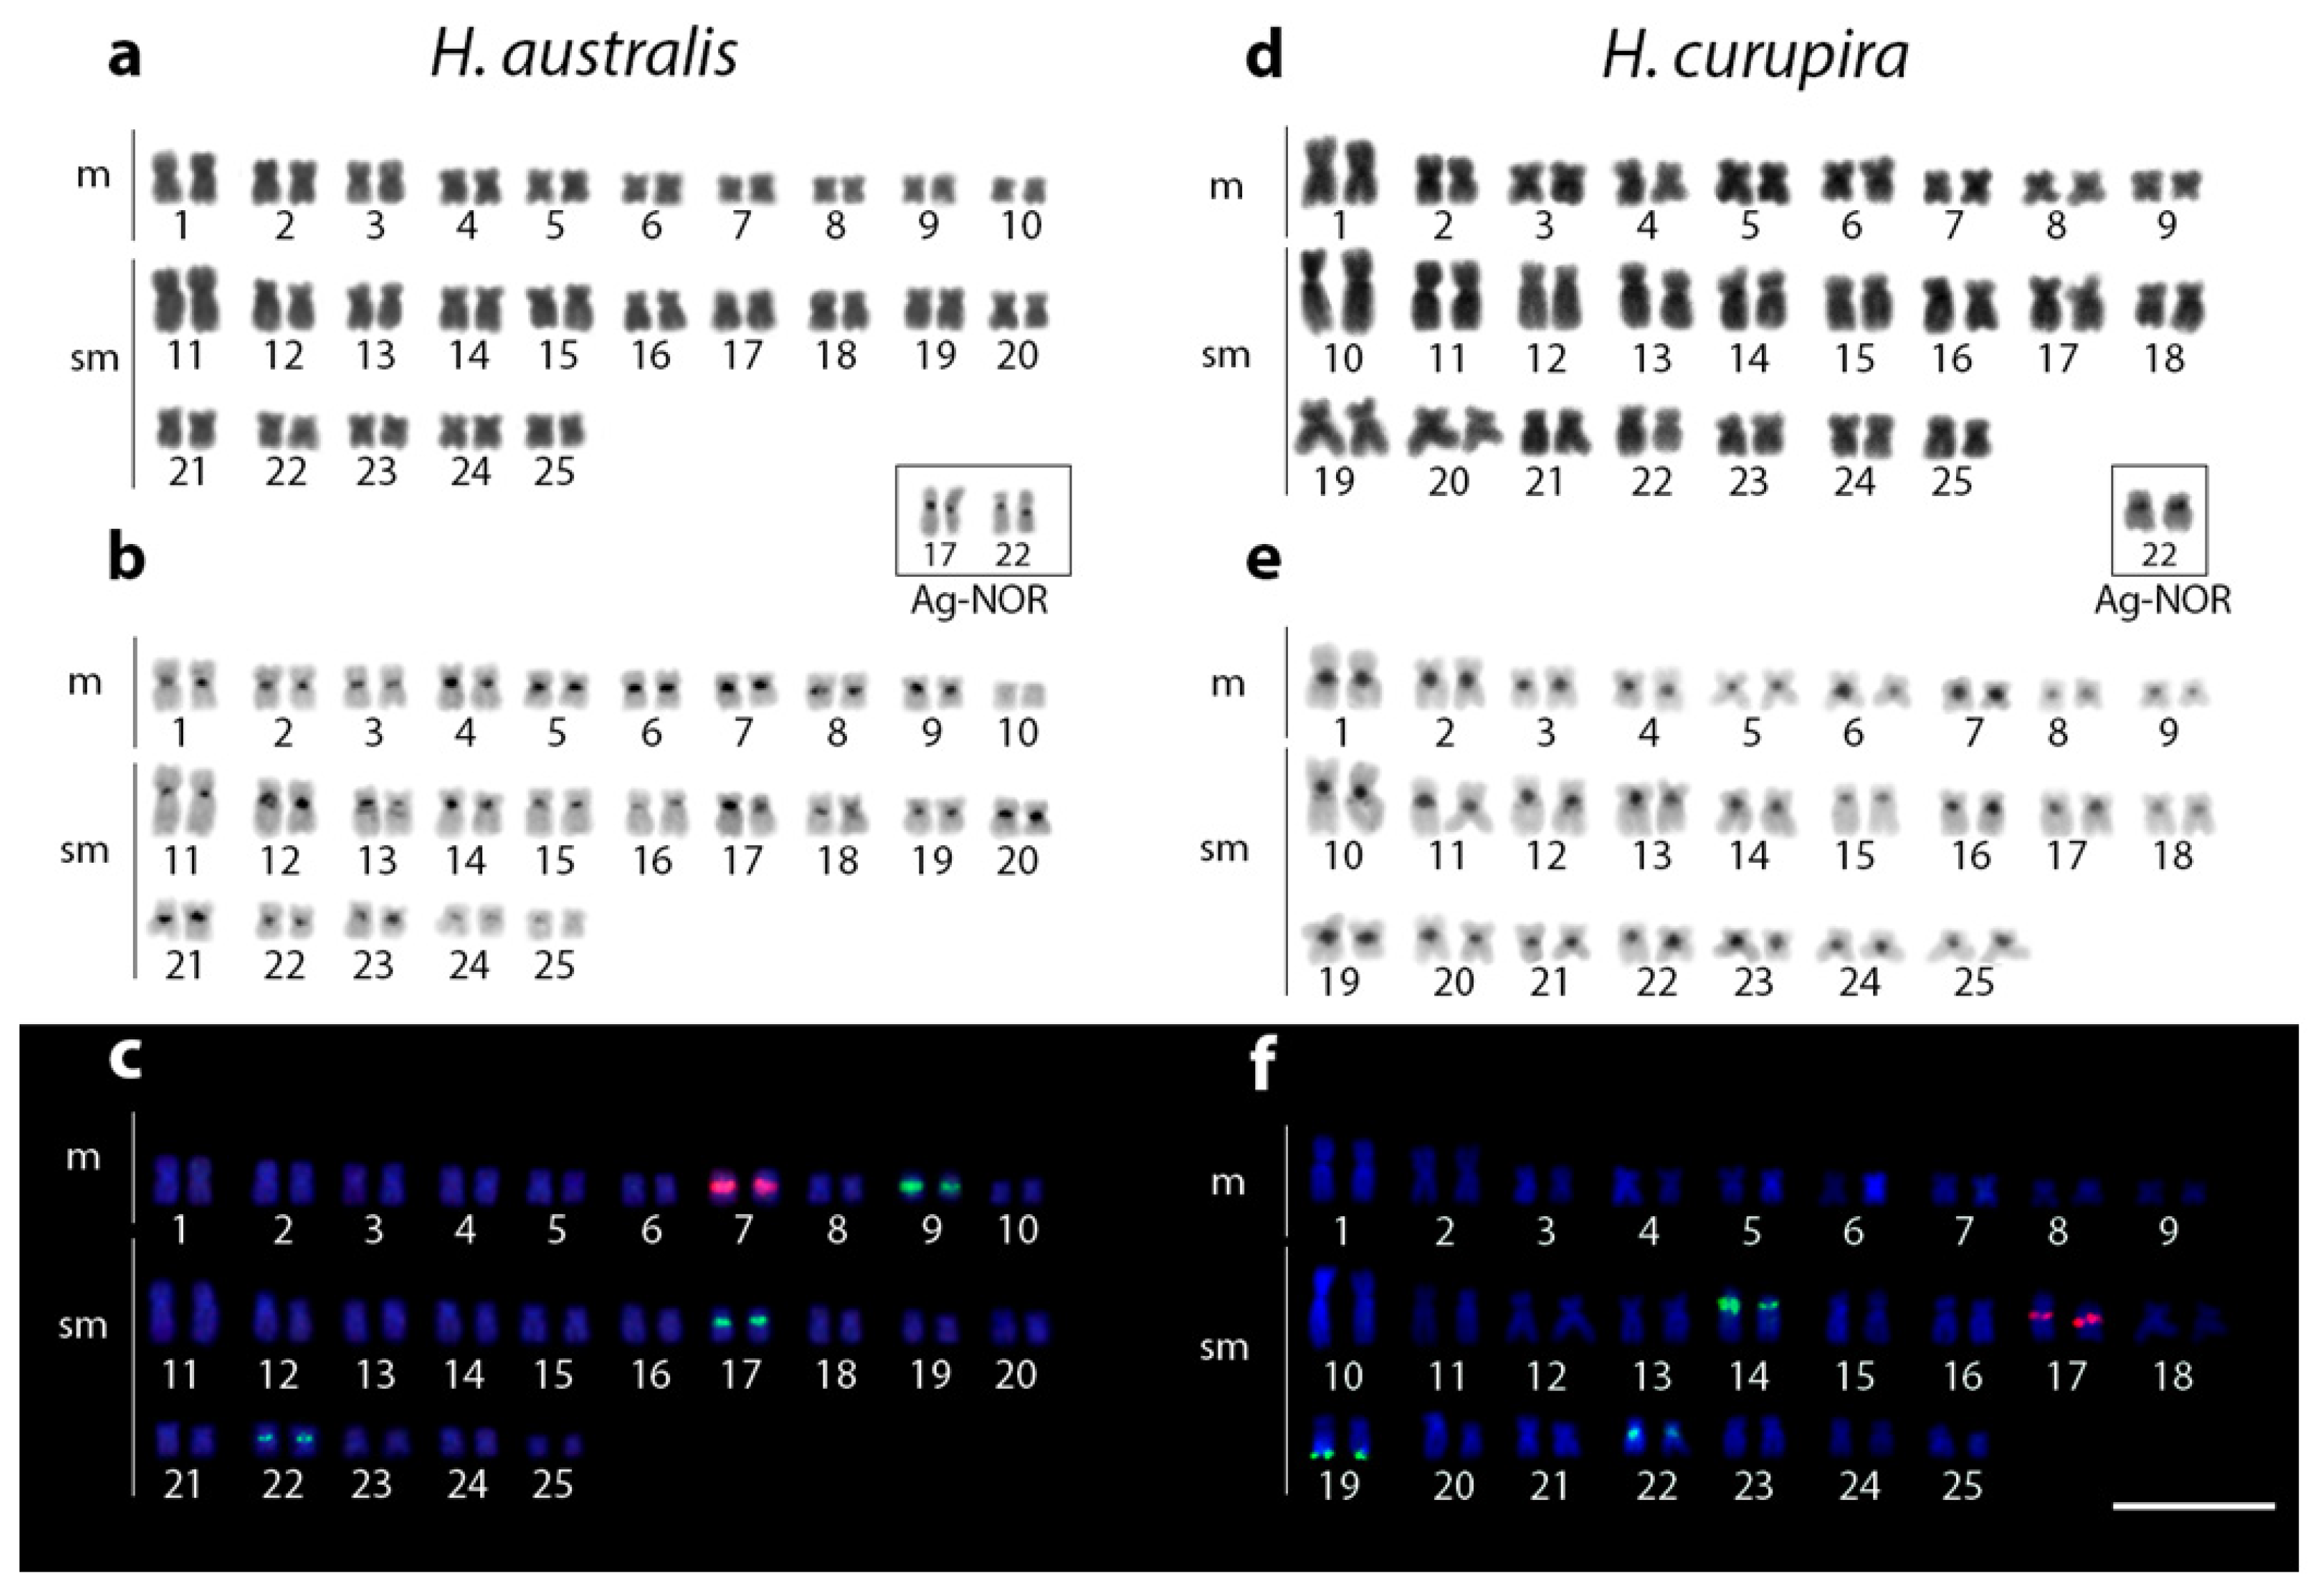
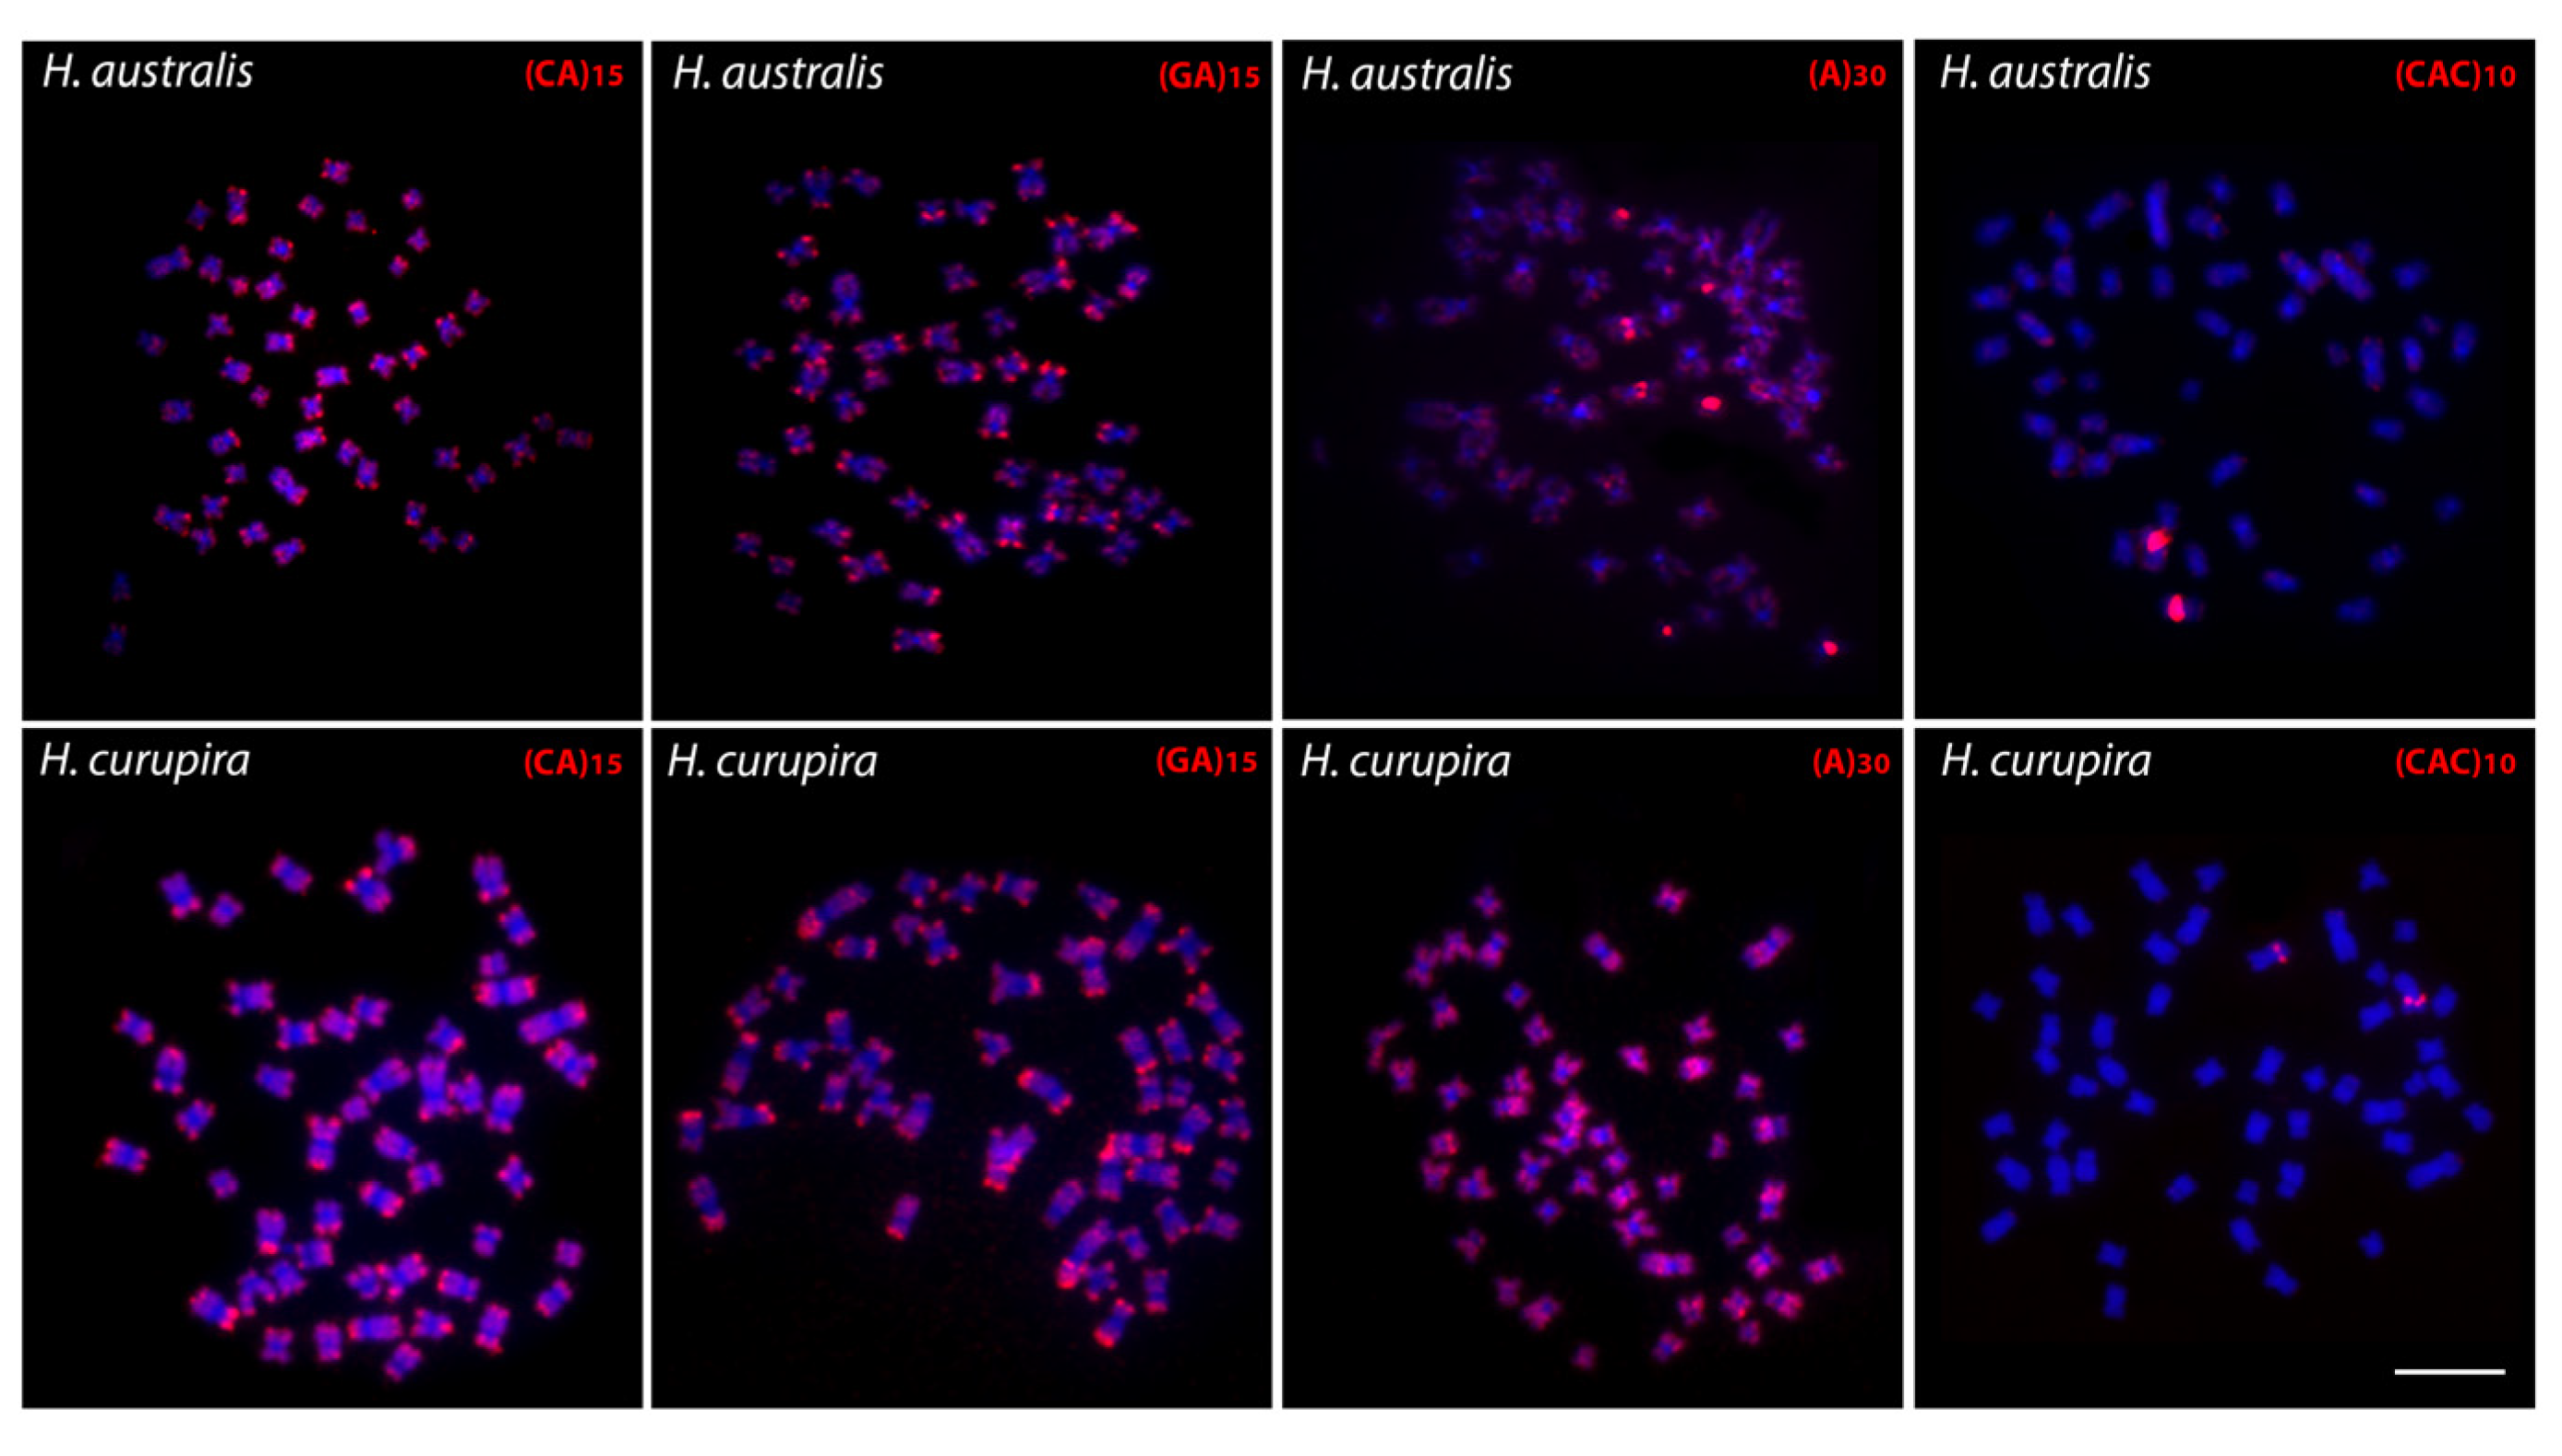
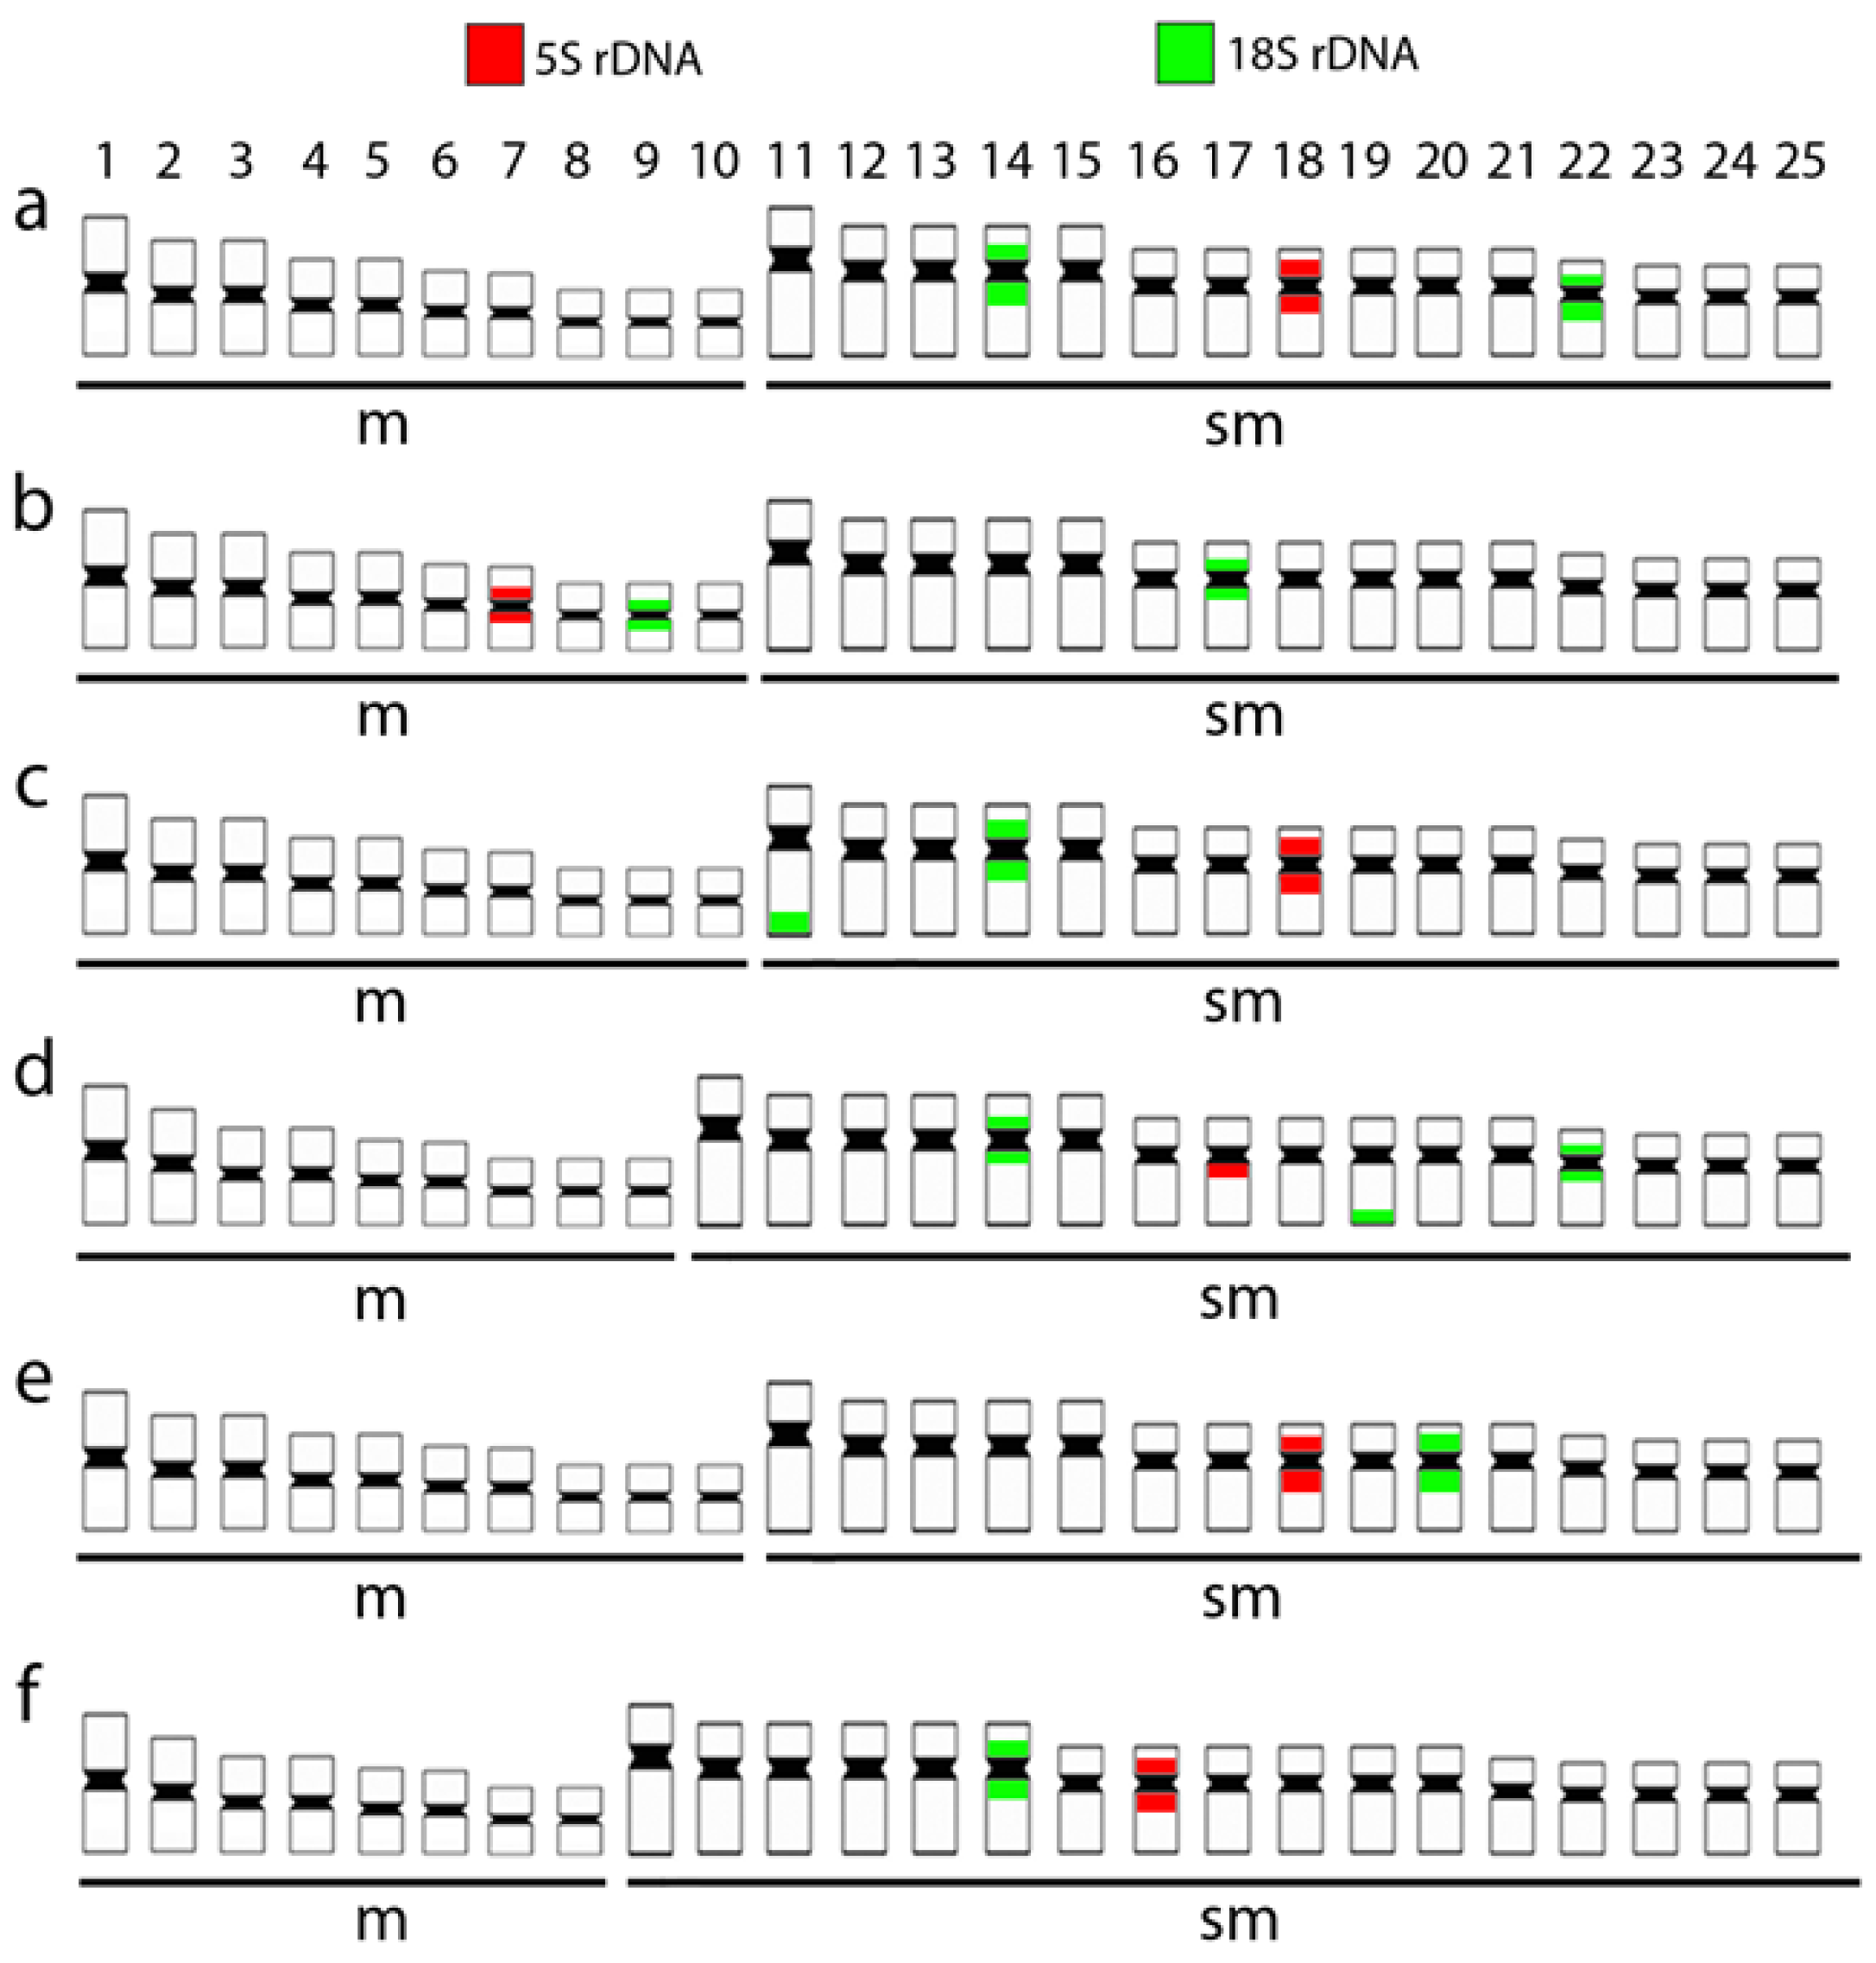
3.1. Karyotypes, C-Banding, and Chromosomal Mapping of Repetitive Sequences

Both H. australis and H. curupira, which were not previously cytogenetically assessed, have 2n = 50 metacentric/submetacentric chromosomes, but slightly differing in configuration, with karyotypes composed by 20 m + 30 sm and 18 m + 32 sm, respectively (Figure 2a,d). The C-positive heterochromatin also follows the same distribution pattern for both species, located in the pericentromeric region of all chromosomes (Figure 2b,e).
The mapping of ribosomal regions by FISH highlighted the same number of rDNA sites for both species, although distributed in different chromosomes in the karyotypes. Accordingly, H. australis and H. curupira present a single chromosome pair with pericentromeric 5S rDNA sequences, the 7th and the 17th ones, respectively. Similarly, the two species also present three chromosome pairs bearing 18S rDNA sequences, all of which are pericentromeric in H. australis (pairs 9, 17, and 22). In turn, in H. curupira, only two of these chromosomes contain sites with a pericentromeric location (pairs 14 and 22), while the other one has it positioned in the ends of the long arms (pair 19). However, only the 18S sequences located in the chromosomes 17 and 22 of H. australis and 22 of H. curupira matched with the argyrophilic nucleolar-organizing region (AgNOR) sites, thus indicating that they were the only ones with transcriptional activity in the preceding mitotic cycle (Figure 2c,f).
Both similar and divergent distribution patterns were also detected for microsatellite sequences between Hoplias australis and H. curupira (Figure 3). For (CA)15 and (GA)15 probes, both species present a strong hybridization pattern in the telomeric regions of all chromosomes, in addition to some other small pericentromeric and interstitial signals. However, probe (A)30 reveals a strong accumulation in the pericentromeric regions of some H. australis chromosomes, with the others showing weaker signals in their telomeric regions, in contrast to what occurred in H. curupira where the chromosomes are strongly marked in all extension, except in the pericentromeric regions. For the triplet (CAC)10, only a single chromosome pair was hybridized in both species, which coincides with the one carrying the 5S rDNA motif (i.e., pair 7 and 17 of H. australis and H. curupira, respectively).

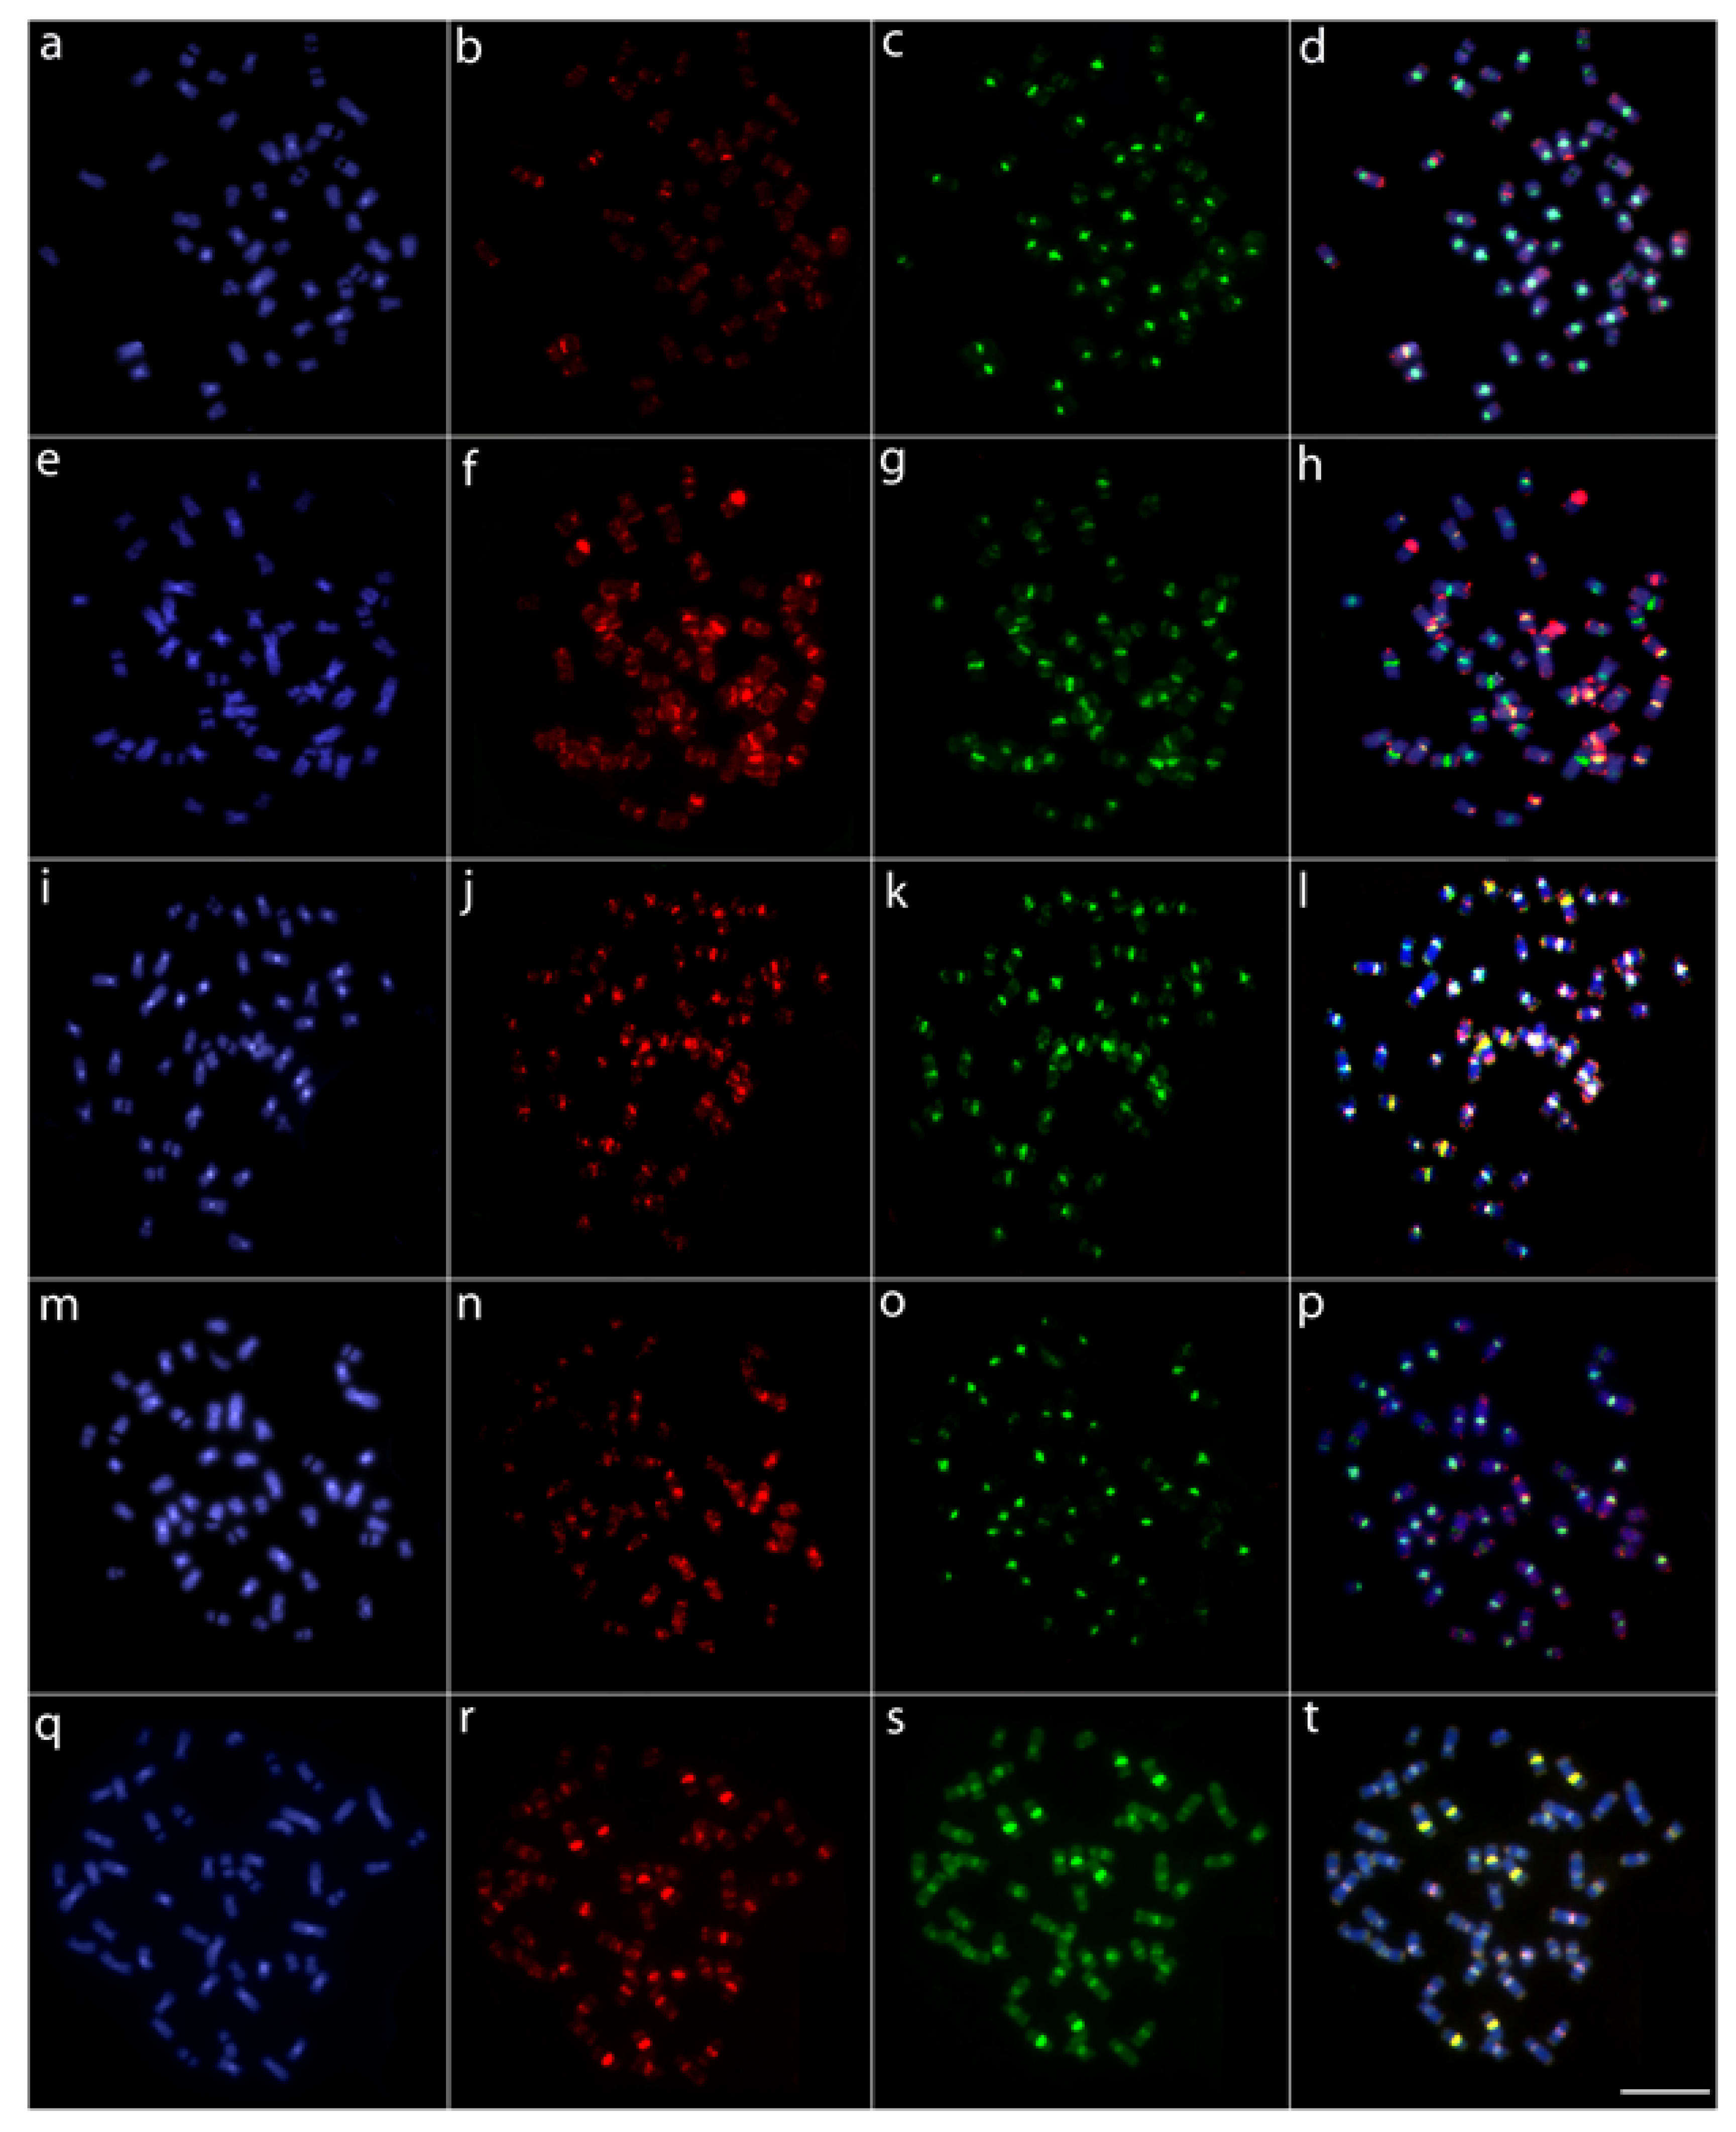
3.2. Comparative Genomic Hybridization (CGH)

The comparative genomic hybridization (CGH) experiments among the six giant trahiras showed that they exhibit divergent genomic patterns, with a high level of compartmentalization and the composition of repetitive sequences varying both in quantity and distribution. However, it was also evidenced that Hoplias australis and, especially, H. brasiliensis, present a greater number of shared regions with H. intermedius than the other three species (Figure 4).

3.3. Comparative Analyses Using Diversity Arrays Technology Sequencing Data

The DArTseq procedure generated approximately 2 million reads per sample. After filtering, the final dataset was composed of 1858 SNPs. Genetic diversity indexes indicated a high differentiation of Hoplias aimara and H. curupira, as they present a higher number of private alleles compared with the other giant trahiras. In turn, these two species also have the lowest diversity levels, as evidenced by the allelic richness, the heterozygosity (HO and HE), and the Shannon diversity, while H. australis and H. brasiliensis have the highest ones (Table 2). The PCoA summarized 52.0% of the total variation in the X-axis and 23.7% in the Y-axis. The results indicate that H. intermedius and H. brasiliensis are more closely related to each other, as are H. australis and H. lacerdae. In turn, H. curupira stands out as the most genetically distant species within the H. lacerdae group, while H. aimara was the most distant overall (Figure 5). The species tree generated in SNAPP showed this same relationship between species, with posterior probabilities equal to 1 in all nodes. (Figure 1B).

4. Discussion

Previous studies indicated that trahiras forming the Hoplias lacerdae group share a similar macro-karyotype pattern, with some differentiation among them concerning chromosome types and molecular cytogenetic markers. While H. lacerdae has 2n = 50 chromosomes (16m + 34sm), H. intermedius and H. brasiliensis have 2n = 50 (20m + 30sm) [19]. Here, for the first time, the two other remaining species recognized for this group, namely H. australis and H. curupira, were cytogenetically analyzed. Both also present 2n = 50 chromosomes, with slight differentiation between them in the karyotype composition, i.e., H. australis has 2n = 50 chromosomes (20m + 30sm) and H. curupira 2n = 50 (18m + 32sm). Thus, the evolutionary chromosomal trend in the H. lacerdae group remains retained (i.e., all species with 2n = 50 meta/submetacentric chromosomes). As the 2n number does not differ among species but only the chromosomal morphology, it is likely that rearrangements that modify the centromere position, such as pericentric inversions or centromere reposition, are the main ones that have driven their chromosomal evolution. Such events can increase the linkage disequilibrium and, when adaptive alleles are included in the inverted regions, the fixation of the rearrangements in the population can be favored [42]. The preferential distribution of the C-positive heterochromatin in the pericentromeric regions, as observed in both H. australis and H. curupira, is also found in all other giant trahiras [19].
Species’ lifestyle can be a good indicator for understanding karyotype evolution. For the Hoplias genus, the largest chromosomal variation occurs in the H. malabaricus group that inhabits more lentic environments, while species of the H. lacerdae group prefer main river channels as habitat [21]. It is likely that such a condition, contrary to what occurs in lentic environments without large migratory events, may contribute to the maintenance of homogeneous karyotypes, without major macro-structural differences. Several migratory fish families usually show conserved karyotypes concerning the 2n number and chromosomal macrostructure [19,43,44]. Despite this, microstructural and genetic changes may act as significant evolutionary factors, creating probable post-zygotic barriers as documented, for example, in Centropomus species [45]. Instead, the conservative chromosomal macrostructure of the H. lacerdae group is not maintained in the level of internal chromosomal characteristics. This is evidenced by the differential distributions of the ribosomal DNA sites among species (Figure 6) and the repetitive DNA fraction, as indicated by their comparative genomic hybridization (CGH) analysis. Since repetitive DNA constitutes a highly dynamic fraction of the genome, it has active participation in the evolutionary process leading to significant differentiation, even among closely related species [46,47,48,49,50]. Such differences in the chromosomal mapping of repetitive sequences among the analyzed species were also observed at their genomic levels, with the detection of a high number of private alleles (Table 1), along with high support in all nodes of the species tree (Figure 1A).
The phylogeny reconstructed by [14] points to two groups of species in the H. lacerdae group, one of them composed of the northern Brazilian species and the other one containing south/southeast Brazil species. This division can be related to several geological events that shaped the distribution of the Brazilian river basins, such as the extinction of the Michicola Arch in Paleogene and the uplift of the Serra do Mar and mountains in central Brazil, supporting the separation of the northern basins from those of the southern region [51,52,53,54]. The proposition of [14] is also corroborated by our CGH, genomic, and phylogenetic results, since the genome of the southeastern species (H. intermedius) shares a greater number of repetitive DNAs with those of the northeastern (H. brasiliensis) and south (H. australis) species than with that of the north (H. curupira) species, as also with H. aimara. Accordingly, the comparative genetic diversity also highlights a higher level of differentiation for both H. curupira and H. aimara, which show the greatest number of private alleles and appear as a sister group of the clade containing all other species. Besides, our genetic data indicate that H. intermedius and H. brasiliensis are more closely related to each other in the same way that H. australis and H. lacerdae are. In turn, H. curupira, the northernmost species, is the most differentiated within the H. lacerdae group, with H. aimara being placed as a sister species of the entire H. lacerdae group.
Finally, some additional considerations deserve to be addressed concerning Hoplias aimara. Three groups of species were recognized by [55] in the genus Hoplias: the H. lacerdae group (revised by [13]), the H. malabaricus group (not yet revised), and the H. macrophthalmus group, which was revised by [20] and characterized as monotypic. It was found that H. aimara and H. macrophthalmus refer to the same taxon, with H. aimara being the priority in the denomination according to the Code of Zoological Nomenclature. This species is characterized by missing the accessory ectopterygoid bone, as well as by the occurrence of a characteristic dark oval spot on the opercular membrane [13,20]. Lastly, the data of [14] with DNA barcoding support the indication of H. aimara as also belonging to the H. lacerdae clade. In this respect, authors consider that “the diagnostic morphological characters of H. aimara would only apply at the species level” [14]. Chromosomal data show that H. aimara has the same karyotype macrostructure, 2n = 50 meta-submetacentric chromosomes, like all other species of the H. lacerdae group [19,21,present study], thus evidencing its closer relationship with the H. lacerdae group than with the H. malabaricus group. However, despite such proximity, our genetic data indicate that H. aimara is a sister clade to all species of the H. lacerdae group, highlighting that the conservative 2n = 50 m/sm chromosomes are shared characteristics that are being maintained for a long time in the evolutionary process of the genus Hoplias.

5. Conclusions

Chromosomal data of the giant trahiras (Hoplias australis, H. aimara, H. brasiliensis, H. curupira, H. intermedius, H. lacerdae) support the conservative status of their diploid number allied to a notable diversity in a genomic scale. The results allowed us to (i) track the evolutionary relationships inside the genus, (ii) describe two new karyotypes, and (iii) to describe the relationship of H. aimara and the H. lacerdae group. More studies are required to clarify the relationship of the giant and common trahiras.

Author Contributions

Conceptualization, F.d.M.C.S. and M.d.B.C.; Data curation, E.A.d.O.; Formal analysis, M.F.P., V.C.S.O., G.A.D., F.H.S.d.S., P.H.N.F., E.A.d.O., T.H., T.L., L.A.C.B., and M.d.B.C.; Funding acquisition, F.d.M.C.S. and M.d.B.C.; Investigation, F.d.M.C.S., M.F.P., E.A.d.O., T.L., L.A.C.B., and M.d.B.C.; Methodology, F.d.M.C.S., M.F.P., V.C.S.O., G.A.D., F.H.S.d.S., P.H.N.F., T.H., T.L., and M.d.B.C.; Project administration, M.d.B.C.; Software, M.F.P., F.H.S.d.S., and P.H.N.F.; Validation, F.d.M.C.S., V.C.S.O., G.A.D., F.H.S.d.S., P.H.N.F., T.H., and T.L.; Visualization, M.F.P., E.A.d.O., L.A.C.B., and M.d.B.C.; Writing—original draft, F.d.M.C.S.; Writing—review & editing, M.F.P., V.C.S.O., G.A.D., F.H.S.d.S., P.H.N.F., E.A.d.O., T.H., T.L., L.A.C.B., and M.d.B.C. All authors have read and agreed to the published version of the manuscript.

Funding

M.B.C. was supported by Conselho Nacional de Desenvolvimento Científico e Tecnológico (CNPq) 302449/2018-3), and by the Fundação de Amparo à Pesquisa do Estado de São Paulo (FAPESP) (Proc. No 2018/22033-1). L.A.C.B. was supported by the Fundação de Amparo à Pesquisa do Estado de São Paulo (FAPESP) (Proc. No. 2018/24235-0). F.M.C.S was supported by the Fundação de Amparo à Pesquisa do Estado de São Paulo (FAPESP) (Proc. No. 2020/02681-9). This study was financed in part by the Coordenação de Aperfeiçoamento de Pessoal de Nível Superior, Brasil (CAPES), Finance Code 001.

Institutional Review Board Statement

The study was conducted according to the guidelines of the Ethics Committee on Animal Experimentation of the Universidade Federal de São Carlos (Process number CEUA 1853260315). Collections were done under the authorization of the Chico Mendes Institute for Biodiversity Conservation (ICMBIO), System of Authorization and Information about Biodiversity (SISBIO-License No. 10538-3), and National System of Genetic Resource Management and Associated Traditional Knowledge (SISGEN-A96FF09).

Data Availability Statement

DarTSeq genotypes: dryad doi to be deposited upon acceptance.

Acknowledgments

The authors are grateful to Oswaldo Oyakawa for the taxonomic identification of fish here studied and to Vitor Augusto Rezende dos Santos, who produced the illustration of fishes that are present in Figure 1.

Conflicts of Interest

The authors declare no conflict of interest. The funders had no role in the design of the study; in the collection, analyses, or interpretation of data; in the writing of the manuscript; or in the decision to publish the results.

References

  1. Nelson, J.S.; Grande, T.C.; Wilson, M.V.H. Fishes of the World; John Wiley & Sons: Hoboken, NJ, USA, 2016; ISBN 111834233X. [Google Scholar]
  2. Reis, R.E.; Albert, J.S.; Di Dario, F.; Mincarone, M.M.; Petry, P.; Rocha, L.A. Fish Biodiversity and Conservation in South America. J. Fish Biol. 2016, 89, 12–47. [Google Scholar] [CrossRef] [PubMed] [Green Version]
  3. Fricke, R.; Eschmeyer, W.N.; van der Laan, R. Eschmeyer’s Catalog of Fishes: Genera, Species, References. Available online: http://researcharchive.calacademy.org/research/ichthyology/catalog/fishcatmain.asp (accessed on 12 February 2020).
  4. Oyakawa, O.T. Checklist of the Freshwater Fishes of South and Central America; EDIPUCRS: Porto Alegre, Brazil, 2003; pp. 238–240. [Google Scholar]
  5. Manel, S.; Guerin, P.-E.; Mouillot, D.; Blanchet, S.; Velez, L.; Albouy, C.; Pellissier, L. Global Determinants of Freshwater and Marine Fish Genetic Diversity. Nat. Commun. 2020, 11, 692. [Google Scholar] [CrossRef] [Green Version]
  6. Bertollo, L.A.C.; Born, G.G.; Dergam, J.A.; Fenocchio, A.S.; Moreira-Filho, O. A Biodiversity Approach in the Neotropical Erythrinidae Fish, Hoplias malabaricus. Karyotypic Survey, Geographic Distribution of Cytotypes and Cytotaxonomic Considerations. Chromosome Res. 2000, 8, 603–613. [Google Scholar] [CrossRef]
  7. De Bello Cioffi, M.; Franco, W.; Ferreira, R.; Bertollo, L.A.C. Chromosomes as tools for discovering Biodiversity—The case of Erythrinidae fish family. In Recent Trends Cytogenet Studies Methodol Appl; Tirunilai, P., Ed.; InTech: Rijeka, Croatia, 2012; pp. 125–146. ISBN 978-953-51-0178-9. [Google Scholar]
  8. Bertollo, L.A.C. Chromosome Evolution in the Neotropical Erythrinidae Fish Family: An Overview. In Fish Cytogenetics; Pisano, E., Ozouf-Costaz, C., Foresti, F., Kapoor, B.G., Eds.; CRC Press: Enfield, NH, USA, 2007; pp. 195–211. ISBN 9781578083305. [Google Scholar]
  9. De Bello Cioffi, M.; Bertollo, L.A.C. Initial Steps in XY Chromosome Differentiation in Hoplias malabaricus and the Origin of an X1X2Y Sex Chromosome System in This Fish Group. Heredity (Edinburgh) 2010. [Google Scholar] [CrossRef] [Green Version]
  10. De Bello Cioffi, M.; Yano, C.F.; Sember, A.; Bertollo, L.A.C. Chromosomal Evolution in Lower Vertebrates: Sex Chromosomes in Neotropical Fishes. Genes (Basel) 2017, 8, 258. [Google Scholar] [CrossRef] [PubMed]
  11. Martinez, J.F.; Lui, R.L.; Traldi, J.B.; Blanco, D.R.; Moreira-Filho, O. Comparative Cytogenetics of Hoplerythrinus unitaeniatus (Agassiz, 1829) (Characiformes, Erythrinidae) Species Complex from Different Brazilian Hydrographic Basins. Cytogenet. Genome Res. 2016, 149, 191–200. [Google Scholar] [CrossRef]
  12. Sember, A.; Bertollo, L.A.C.; Ráb, P.; Yano, C.F.; Hatanaka, T.; de Oliveira, E.A.; de Bello Cioffi, M. Sex Chromosome Evolution and Genomic Divergence in the Fish Hoplias malabaricus (Characiformes, Erythrinidae). Front. Genet. 2018, 9, 1–12. [Google Scholar] [CrossRef]
  13. Oyakawa, O.T.; Mattox, M.T. Revision of the Neotropical Trahiras of the Hoplias lacerdae Species-Group (Ostariophysi: Characiformes: Erythrinidae) with Descriptions of Two New Species. Neotrop. Ichthyol. 2009, 7. [Google Scholar] [CrossRef]
  14. Cardoso, Y.P.; Rosso, J.J.; Mabragaña, E.; González-Castro, M.; Delpiani, M.; Avigliano, E.; Bogan, S.; Covain, R.; Schenone, N.F.; Díaz de Astarloa, J.M. A Continental-Wide Molecular Approach Unraveling MtDNA Diversity and Geographic Distribution of the Neotropical Genus Hoplias. PLoS ONE 2018, 13, e0202024. [Google Scholar] [CrossRef] [Green Version]
  15. De Bello Cioffi, M.; Kejnovsky, E.; Bertollo, L.A.C. The Chromosomal Distribution of Microsatellite Repeats in the Genome of the Wolf Fish Hoplias malabaricus, Focusing on the Sex Chromosomes. Cytogenet. Genome Res. 2011, 132, 289–296. [Google Scholar] [CrossRef] [PubMed]
  16. De Oliveira, E.A.; Sember, A.; Bertollo, L.A.C.; Yano, C.F.; Ezaz, T.; Moreira-Filho, O.; Hatanaka, T.; Trifonov, V.; Liehr, T.; Al-Rikabi, A.B.H.; et al. Tracking the Evolutionary Pathway of Sex Chromosomes among Fishes: Characterizing the Unique XX/XY1Y2 System in Hoplias malabaricus (Teleostei, Characiformes). Chromosoma 2018, 127, 115–128. [Google Scholar] [CrossRef] [PubMed]
  17. Bertollo, L.A.C.; Takahashi, C.; Moreira-Filho, O. Cytotaxonomic Considerations on Hoplias lacerdae (Pisces, Erythrinidae). Braz. J. Genet. 1978, 1, 103–120. [Google Scholar]
  18. Morelli, S.; Vicari, M.R.; Bertollo, L.A.C. Evolutionary Cytogenetics of the Hoplias lacerdae, Miranda Ribeiro, 1908 Group. A Particular Pathway Concerning the Other Erythrinidae Fish. Braz. J. Biol. 2007, 67. [Google Scholar] [CrossRef] [PubMed] [Green Version]
  19. De Oliveira, E.A.; Bertollo, L.A.C.; Yano, C.F.; Liehr, T.; De Bello Cioffi, M. Comparative Cytogenetics in the Genus Hoplias (Characiformes, Erythrinidae) Highlights Contrasting Karyotype Evolution among Congeneric Species. Mol. Cytogenet. 2015, 8. [Google Scholar] [CrossRef] [Green Version]
  20. Mattox, G.T.; Toledo-Piza, M.; Oyakawa, O.T. Taxonomic Study of Hoplias aimara (Valenciennes, 1846) and Hoplias macrophthalmus (Pellegrin, 1907) (Ostariophysi, Characiformes, Erythrinidae). Copeia 2006. [Google Scholar] [CrossRef]
  21. Blanco, D.R.; Lui, R.L.; Vicari, M.R.; Bertollo, L.A.C.; Moreira-Filho, O. Comparative Cytogenetics of Giant Trahiras Hoplias aimara and H. intermedius (Characiformes, Erythrinidae): Chromosomal Characteristics of Minor and Major Ribosomal DNA and Cross-Species Repetitive Centromeric Sequences Mapping Differ among Morphologicall. Cytogenet. Genome Res. 2011, 900, 71–78. [Google Scholar] [CrossRef] [PubMed]
  22. Leaché, A.D.; Bouckaert, R.R. Species Trees and Species Delimitation with SNAPP: A Tutorial and Worked Example. In Proceedings of the Workshop on Population and Speciation Genomics, Český Krumlov, Czech Republic, 21 January–3 February 2018. [Google Scholar]
  23. Bertollo, L.A.C.; De Bello Cioffi, M. Moreira-Filho, O. Direct chromosome preparation from Freshwater Teleost Fishes. In Fish Cytogenetic Techniques (Chondrichthyans and Teleosts); Ozouf-Costaz, C., Pisano, E., Foresti, F., Almeida Toledo, L.F., Eds.; CRC Press: Enfield, CT, USA, 2015; pp. 21–26. [Google Scholar]
  24. Sumner, A.T. A Simple Technique for Demonstrating Centromeric Heterochromatin. Exp. Cell Res. 1972, 75, 304–306. [Google Scholar] [CrossRef]
  25. Howell, W.M.; Black, D.A. Controlled Silver-Staining of Nucleolus Organizer Regions with a Protective Colloidal Developer: A 1-Step Method. Experientia 1980, 36, 1014–1015. [Google Scholar] [CrossRef]
  26. Pendás, A.M.; Móran, P.; Freije, J.P.; Garcia-Vásquez, E. Chromosomal Location and Nucleotide Sequence of Two Tandem Repeats of the Atlantic Salmon 5S RDNA. Cytogenet. Cell Genet. 1994, 67. [Google Scholar] [CrossRef]
  27. De Bello Cioffi, M.; Martins, C.; Centofante, L.; Jacobina, U.P.; Bertollo, L.A.C. Chromosomal Variability among Allopatric Populations of Erythrinidae Fish Hoplias malabaricus: Mapping of Three Classes of Repetitive DNAs. Cytogenet. Genome Res. 2009, 132–141. [Google Scholar] [CrossRef]
  28. Kubat, Z.; Hobza, R.; Vyskot, B.; Kejnovsky, E. Microsatellite Accumulation in the Y Chromosome of Silene Latifolia. Genome 2008, 51, 350–356. [Google Scholar] [CrossRef] [Green Version]
  29. Yano, C.F.; Bertollo, L.A.C.; De Bello Cioffi, M. Fish-FISH: Molecular cytogenetics in fish species. In Fluorescence In Situ Hybridization (FISH)—Application Guide; Liehr, T., Ed.; Springer: Berlin, Germany, 2017; pp. 429–444. [Google Scholar]
  30. Sambrook, J.; Russell, D.W. Molecular Cloning: A Laboratory Manual, 854; Cold Spring Harbor Laboratory Press: New York, NY, USA, 2001. [Google Scholar]
  31. Zwick, M.S.; Hanson, R.E.; Mcknight, T.D.; Islam-Faridi, M.H.; Stelly, D.M.; Wing, R.A.; Price, H.J. A Rapid Procedure for the Isolation of C 0 T-1 DNA from Plants. Genome 1997, 40, 138–142. [Google Scholar] [CrossRef] [PubMed] [Green Version]
  32. Symonová, R.; Sember, A.; Majtánová, Z.; Ráb, P. Characterization of fish genome by GISH and CGH. In Fish Cytogenetic Techniques. Ray-Fin Fishes and Chondrichthyans; Ozouf-Costaz, C., Pisano, E., Foresti, F., de Almeida-Toledo, L.F., Eds.; CCR Press: Boca Raton, FL, USA, 2015; pp. 118–131. [Google Scholar]
  33. De Moraes, R.L.R.; Sember, A.; Bertollo, L.A.; De Oliveira, E.A.; Rab, P.; Hatanaka, T.; Marinho, M.M.; Liehr, T.; Al-Rikabi, A.B.H.; Feldberg, E.; et al. Comparative Cytogenetics and Neo-Y Formation in Small-Sized Fish Species of the Genus Pyrrhulina (Characiformes, Lebiasinidae). Front. Genet. 2019, 10, 1–13. [Google Scholar] [CrossRef] [Green Version]
  34. De Menezes Cavalcante Sassi, F.; De Oliveira, E.A.; Bertollo, L.A.C.; Nirchio, M.; Hatanaka, T.; Ferreira Marinho, M.M.; Moreira-Filho, O.; Aroutiounian, R.; Liehr, T.; Al-Rikabi, A.B.H.; et al. Chromosomal Evolution and Evolutionary Relationships of Lebiasina Species (Characiformes, Lebiasinidae). Int. J. Mol. Sci. 2019, 20, 2944. [Google Scholar] [CrossRef] [Green Version]
  35. De Menezes Cavalcante Sassi, F.; Hatanaka, T.; De Moraes, R.L.R.; Toma, G.A.; De Oliveira, E.A.; Liehr, T.; Rab, P.; Bertollo, L.A.C.; Viana, P.F.; Feldberg, E.; et al. An Insight into the Chromosomal Evolution of Lebiasinidae (Teleostei, Characiformes). Genes (Basel) 2020, 11, 365. [Google Scholar]
  36. Levan, A.; Fredga, K.; Sandberg, A.A. Nomenclature for Centromeric Position on Chromosomes. Hereditas 1964, 52, 201–220. [Google Scholar] [CrossRef]
  37. Gruber, B.; Unmack, P.J.; Berry, O.F.; Georges, A. Dartr: An r Package to Facilitate Analysis of SNP Data Generated from Reduced Representation Genome Sequencing. Mol. Ecol. Resour. 2018, 18, 691–699. [Google Scholar] [CrossRef] [PubMed]
  38. Sherwin, W.B.; Chao, A.; Jost, L.; Smouse, P.E. Information Theory Broadens the Spectrum of Molecular Ecology and Evolution. Trends Ecol. Evol. 2017, 32, 948–963. [Google Scholar] [CrossRef] [PubMed]
  39. Bryant, D.; Bouckaert, R.; Felsenstein, J.; Rosenberg, N.A.; RoyChoudhury, A. Inferring Species Trees Directly from Biallelic Genetic Markers: Bypassing Gene Trees in a Full Coalescent Analysis. Mol. Biol. Evol. 2012, 29, 1917–1932. [Google Scholar] [CrossRef] [Green Version]
  40. Bouckaert, R.; Vaughan, T.G.; Barido-Sottani, J.; Duchêne, S.; Fourment, M.; Gavryushkina, A.; Heled, J.; Jones, G.; Kühnert, D.; De Maio, N.; et al. BEAST 2.5: An Advanced Software Platform for Bayesian Evolutionary Analysis. PLoS Comput. Biol. 2019, 15, e1006650. [Google Scholar] [CrossRef] [Green Version]
  41. Rambaut, A.; Drummond, A.J.; Xie, D.; Baele, G.; Suchard, M.A. Posterior Summarization in Bayesian Phylogenetics Using Tracer 1.7. Syst. Biol. 2018, 67, 901–904. [Google Scholar] [CrossRef] [Green Version]
  42. Kirkpatrick, M.; Barton, N. Chromosome Inversions, Local Adaptation and Speciation. Genetics 2006, 173, 419–434. [Google Scholar] [CrossRef] [PubMed] [Green Version]
  43. Bertollo, L.A.C.; Moreira-Filho, O.; Galetti, P.M., Jr. Cytogenetics and Taxonomy: Consideration Based on Chromosome Studies of Freshwater Fish. J. Fish Biol. 1986, 28. [Google Scholar] [CrossRef]
  44. Oliveira, C.; Almeida-Toledo, L.F.; Foresti, F.; Britski, H.; Toledo-Filho, S.A. Chromosome Formulae of Neotropical Freshwater Fishes. Braz. J. Genet. 1988, 11, 577–624. [Google Scholar]
  45. Borges, A.T.; De Bello Cioffi, M.; Bertollo, L.A.C.; Soares, R.X.; Costa, G.W.W.F.; Molina, W.F. Paracentric Inversions Differentiate the Conservative Karyotypes in Two Centropomus Species (Teleostei: Centropomidae). Cytogenet. Genome Res. 2019, 157, 239–248. [Google Scholar] [CrossRef] [PubMed]
  46. Biémont, C.; Vieira, C. Junk DNA as an Evolutionary Force. Nature 2006, 443, 521–524. [Google Scholar] [CrossRef]
  47. Raskina, O.; Barber, J.C.; Nevo, E.; Belyayev, A. Repetitive DNA and Chromosomal Rearrangements: Speciation Related Events in Plant Genomes. Cytogenet. Genome Res. 2008, 120. [Google Scholar] [CrossRef] [PubMed]
  48. De Bello Cioffi, M.; Bertollo, L.A.C. Chromosomal distribution and evolution of repetitive DNAs in fish. In Repetitive DNA; Garrido-Ramos, M.A., Ed.; Karger: Basel, Switzerland, 2012; pp. 197–221. ISBN 9783318021509. [Google Scholar]
  49. Sochorová, J.; Garcia, S.; Gálvez, F.; Symonová, R.; Kovařík, A. Evolutionary Trends in Animal Ribosomal DNA Loci: Introduction to a New Online Database. Chromosoma 2018, 127, 141–150. [Google Scholar] [CrossRef] [PubMed] [Green Version]
  50. Symonová, R. Integrative RDNAomics—Importance of the Oldest Repetitive Fraction of the Eukaryote Genome. Genes (Basel) 2019, 10, 345. [Google Scholar] [CrossRef] [Green Version]
  51. Rosa, R.S. Diversidade e Conservação Dos Peixes Da Caatinga. Biodiversidade Da Caatinga Áreas E Ações Prioritárias Para A Conservaҫão 2004, 1, 149–161. [Google Scholar]
  52. Ribeiro, A.C. Tectonic History and the Biogeography of the Freshwater Fishes from the Coastal Drainages of Eastern Brazil: An Example of Faunal Evolution Associated with a Divergent Continental Margin. Neotrop. Ichthyol. 2006, 4, 225–246. [Google Scholar] [CrossRef]
  53. Tagliacollo, V.A.; Roxo, F.F.; Duke-Sylvester, S.M.; Oliveira, C.; Albert, J.S. Biogeographical Signature of River Capture Events in Amazonian Lowlands. J. Biogeogr. 2015, 42, 2349–2362. [Google Scholar] [CrossRef]
  54. Abreu, J.M.S.; Saraiva, A.C.S.; Albert, J.S.; Piorski, N.M. Paleogeographic Influences on Freshwater Fish Distributions in Northeastern Brazil. J. S. Am. Earth Sci. 2020, 102, 102692. [Google Scholar] [CrossRef]
  55. Oyakawa, O.T. Revisao Sistematica Das Especies Do Genero Hoplias (Grupo Lacerdae) Da Amazonia Brasileira e Regiao Leste Do Brasil (Teleostei, Erythrinidae). Master’s Thesis, University De São Paulo, São Paolo, Brazil, 1990. [Google Scholar]
Figure 1. Phylogenetic relationships of giant trahiras and their distribution in South America. (A)—Distribution map of giant Hoplias species (H. lacerdae group + H. aimara), according to data from [20] and [13]. Each color represents one species, as follows: yellow, Hoplias australis; purple, H. lacerdae; blue, H. brasiliensis; red, H. intermedius; green, H. curupira; orange, H. aimara. (B)—Species tree recovered with SNAPP [22], based on DArTseq data, using an Erythtrinus erythrinus specimen as outgroup. The color scheme at the tree terminal branches follows the same used in the map. Fish species were illustrated by Vitor Augusto Rezende dos Santos using Adobe Photoshop CC 2020 and Adobe Illustrator CC 2020.
Genes 12 00252 g001
Figure 2. Karyotypes of Hoplias australis (ac) and H. curupira (df) organized from Giemsa-stained (a,d) and C-banded (b),(e) chromosomes. Dual-color fluorescence in situ hybridization (FISH) karyotypes with 5S (red) and 18S (green) rDNA probes are also shown for both species (c) and (f), respectively, with chromosomes counterstained with DAPI (blue). Scale bar = 5 μm.
Genes 12 00252 g002
Figure 3. Microsatellite sequences (red) mapped against chromosomes of Hoplias australis and H. curupira. Chromosomes were counterstained with DAPI (blue). Scale bar = 5 μm.
Genes 12 00252 g003
Figure 4. Comparative genomic hybridization using the gDNA of the five Hoplias species against the chromosomal background of H. intermedius. The first column (a,e,i,m,q): DAPI images (blue); second column (b,f,j,n,r): hybridization patterns using gDNA probe from H. intermedius; third column (c,g,k,o,s): hybridization patterns using gDNA probes from H. aimara, H. australis, H. brasiliensis, H. curupira, and H. lacerdae, respectively; fourth column (d,h,l,p,t): merged images of both genomic probes and DAPI staining depicting the shared regions in yellow. Scale bar = 5 μm.
Genes 12 00252 g004
Figure 5. Principal coordinate analysis of giant trahiras. The color scheme for each species follows the same used in Figure 1.
Genes 12 00252 g005
Figure 6. Representative idiograms of (a) Hoplias aimara; (b) H. australis; (c) H. brasiliensis; (d) H. curupira; (e) H. intermedius; and (f) H. lacerdae highlighting the distribution of 18S (green) and 5S (red) rDNA sequences on the chromosomes.
Genes 12 00252 g006
Table 1. Species, sampling localities, and the number of specimens analyzed with cytogenetics. (PA, SC, MT, MG, and BA = the Pará, Santa Catarina, Mato Grosso, Minas Gerais, and Bahia Brazilian states, respectively).
SpeciesLocalityN
Hoplias australisJacutinga river, Arabutã—SC (27°10′11.1″ S 52°05′08.1″ W)07♀, 04♂
H. curupiraParauapebas river, Canaã dos Carajás—PA (6°30′06.5″ S 50°02′35.3″ W)05♀, 03♂
H. aimaraXingu river, Querência—MT (12°35’10.1″ S 52°56’35.6″ W)01♀, 03♂
H. intermediusCipó river, Santana de Pirapama—MG (18°53’52.5″ S 43°52’58.7″ W)04♀, 04♂
H. brasiliensisParaguaçu river, Itaberaba—BA (12°44’56.8″ S 40°12’16.0″ W)02♀, 08♂
H. lacerdaeJuquiá river, Registro—SP (24°24’01.6″ S 47°49’46.8″ W)06♀, 02♂
Table 2. Comparative genetic diversity levels among Hoplias aimara and Hoplias lacerdae species groups. N, number of samples; AR, allelic richness; PA, private alleles; HO, observed heterozygosity; HE, expected heterozygosity; S, Shannon diversity.
SpeciesNARPAHOHES
H. curupira31.0066520.0030.0021.004
H. australis61.0482700.0160.0141.030
H. aimara31.00515120.0030.0021.004
H. intermedius61.024640.0090.0091.018
H. brasiliensis61.0491300.0170.0151.031
H. lacerdae51.0111840.0050.0041.008
Publisher’s Note: MDPI stays neutral with regard to jurisdictional claims in published maps and institutional affiliations.

