
A Resource for the Network Representation of Cell Perturbations Caused by SARS-CoV-2 Infection

 , , , , , , , , , and
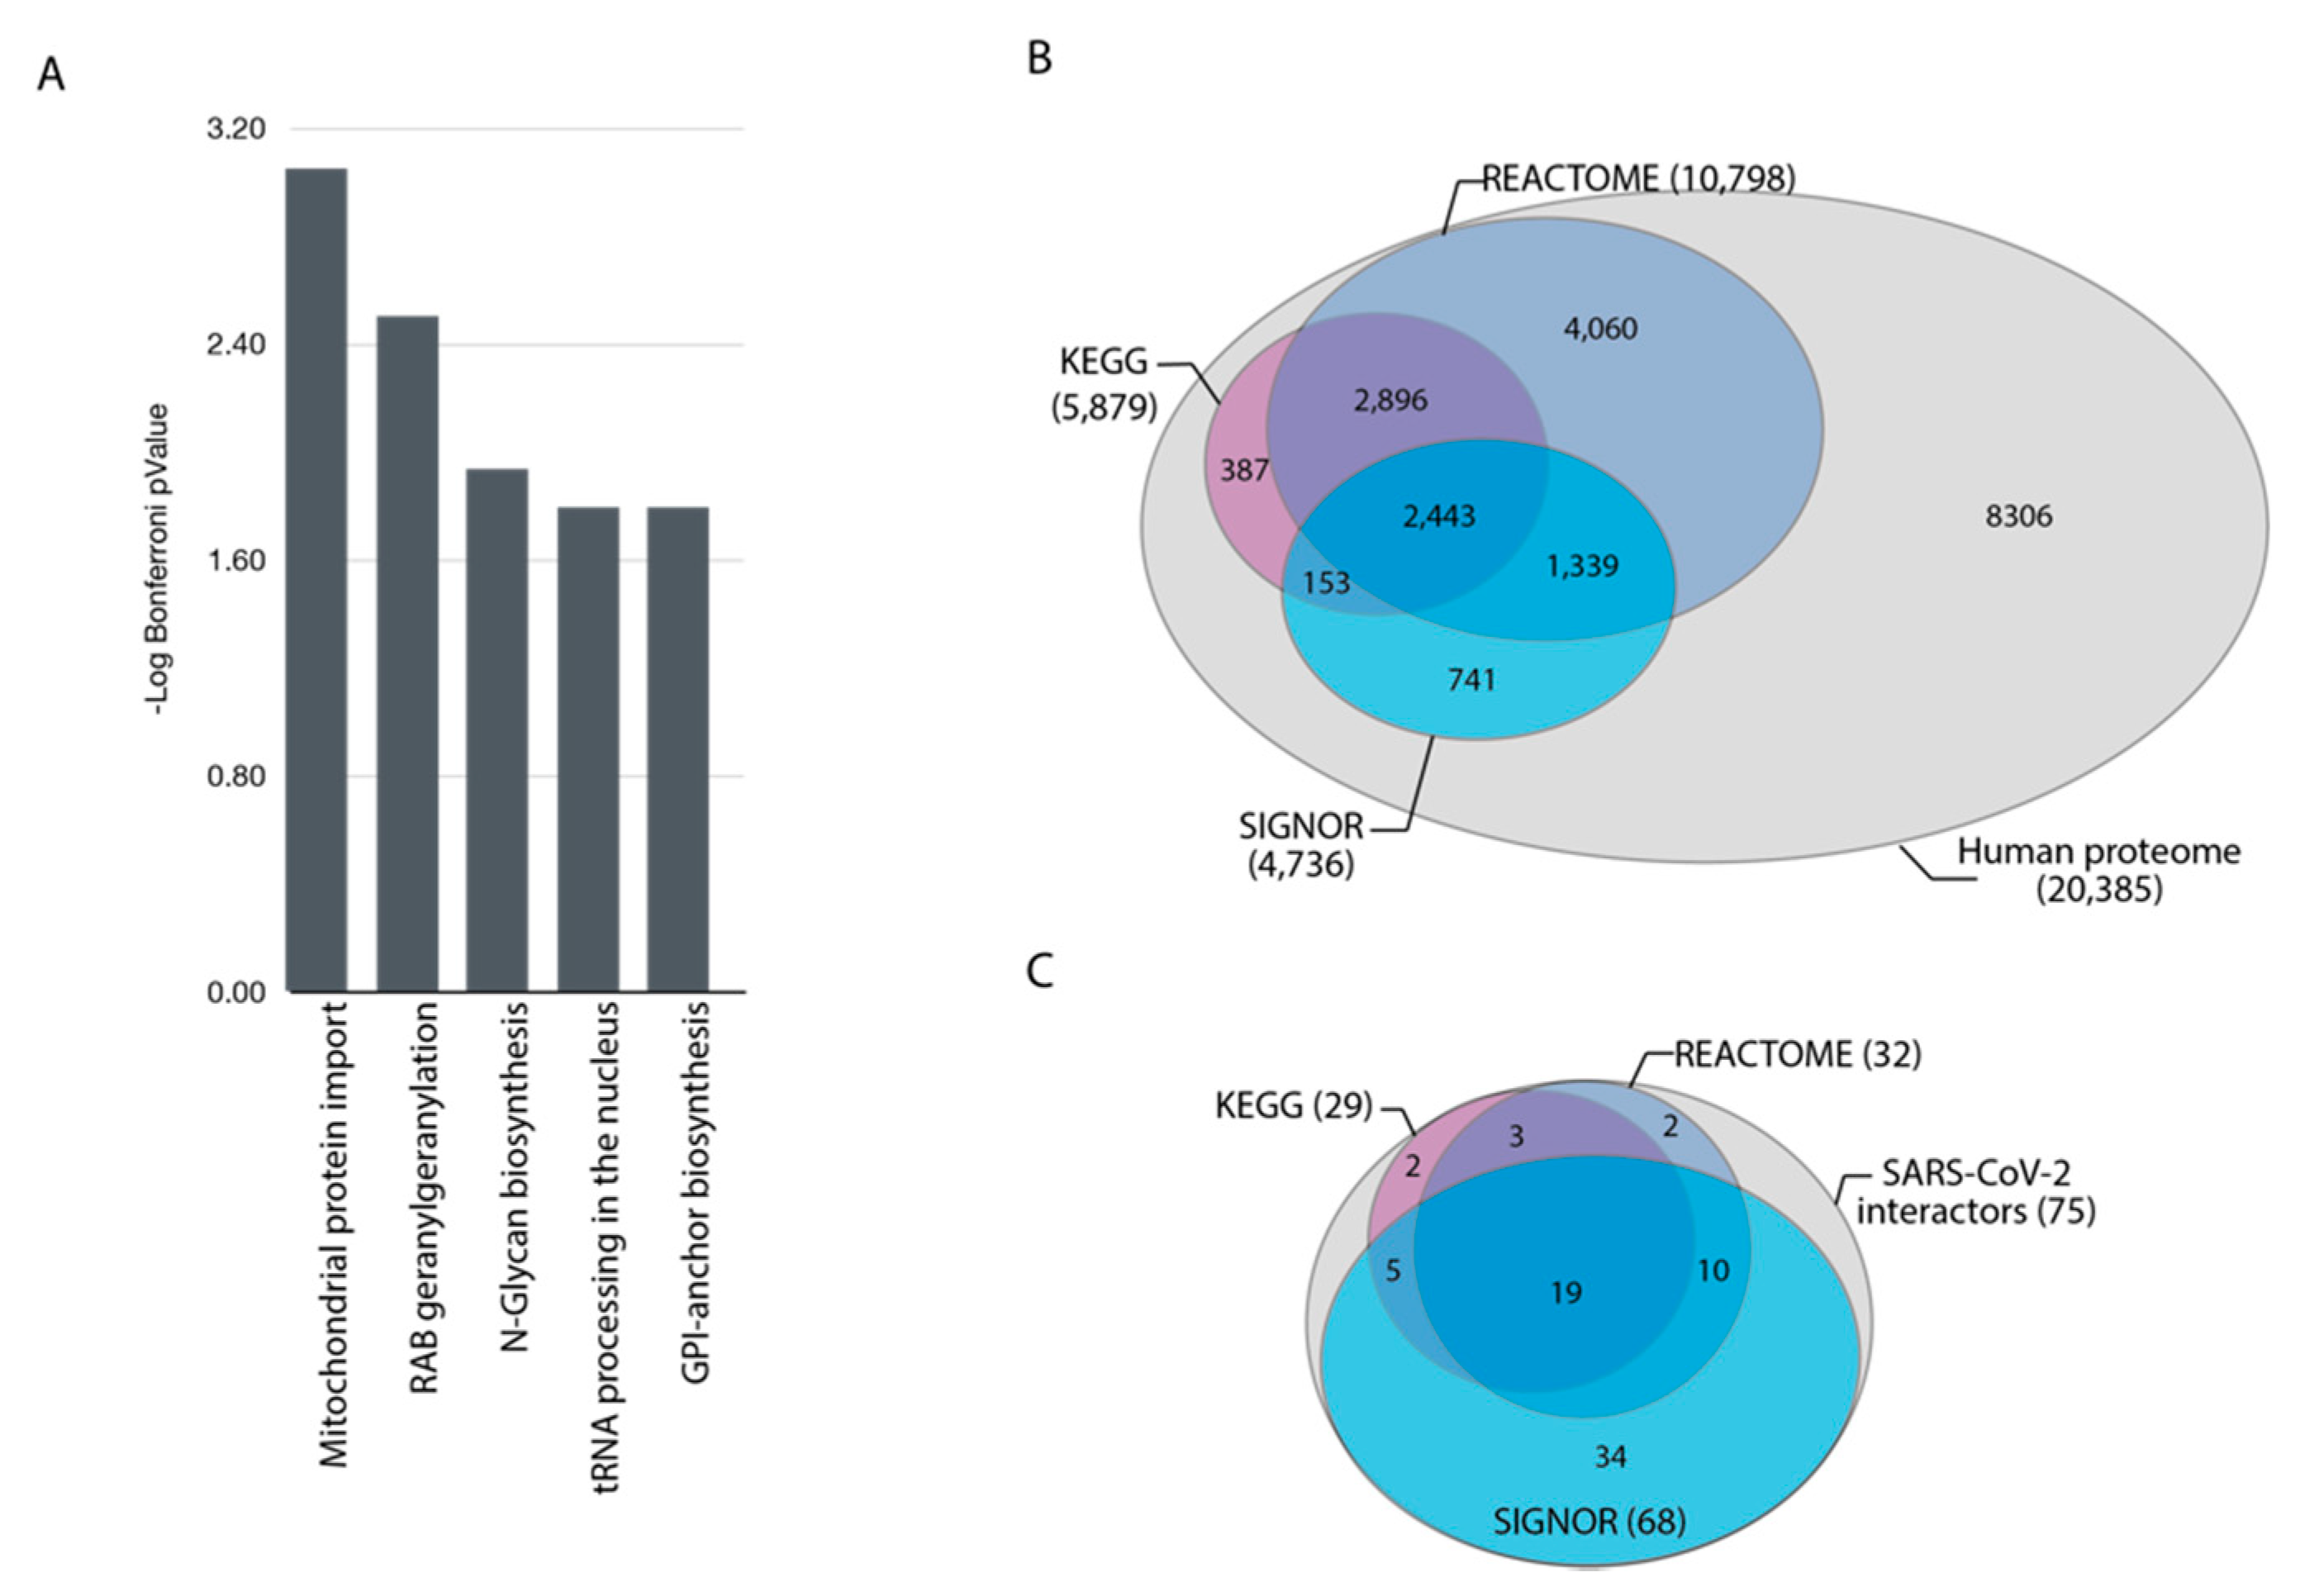
Abstract
:1. Introduction
2. Materials and Methods
2.1. Curation of the SARS-CoV-2-Related Causal Interaction
2.2. Estimating the Functional Proximity of a Protein to a Pathway
- (1)
- We search the cell causal interactome for paths of four steps, or less, linking the query protein and each protein in the pathway-list;
- (2)
- We select, for each protein in the pathway, the path with the shortest distance D;
- (3)
- If a query protein is connected to more than one protein in the pathway, we use an analogy with a parallel resistor and define the proximity P as the reciprocal of the sum of the reciprocals of the distances (Dn) of each path linking the query protein to proteins in the pathway (Figure S1C).
3. Results
3.1. Pathway Overrepresentation Analysis of the SARS-CoV-2 Interactome
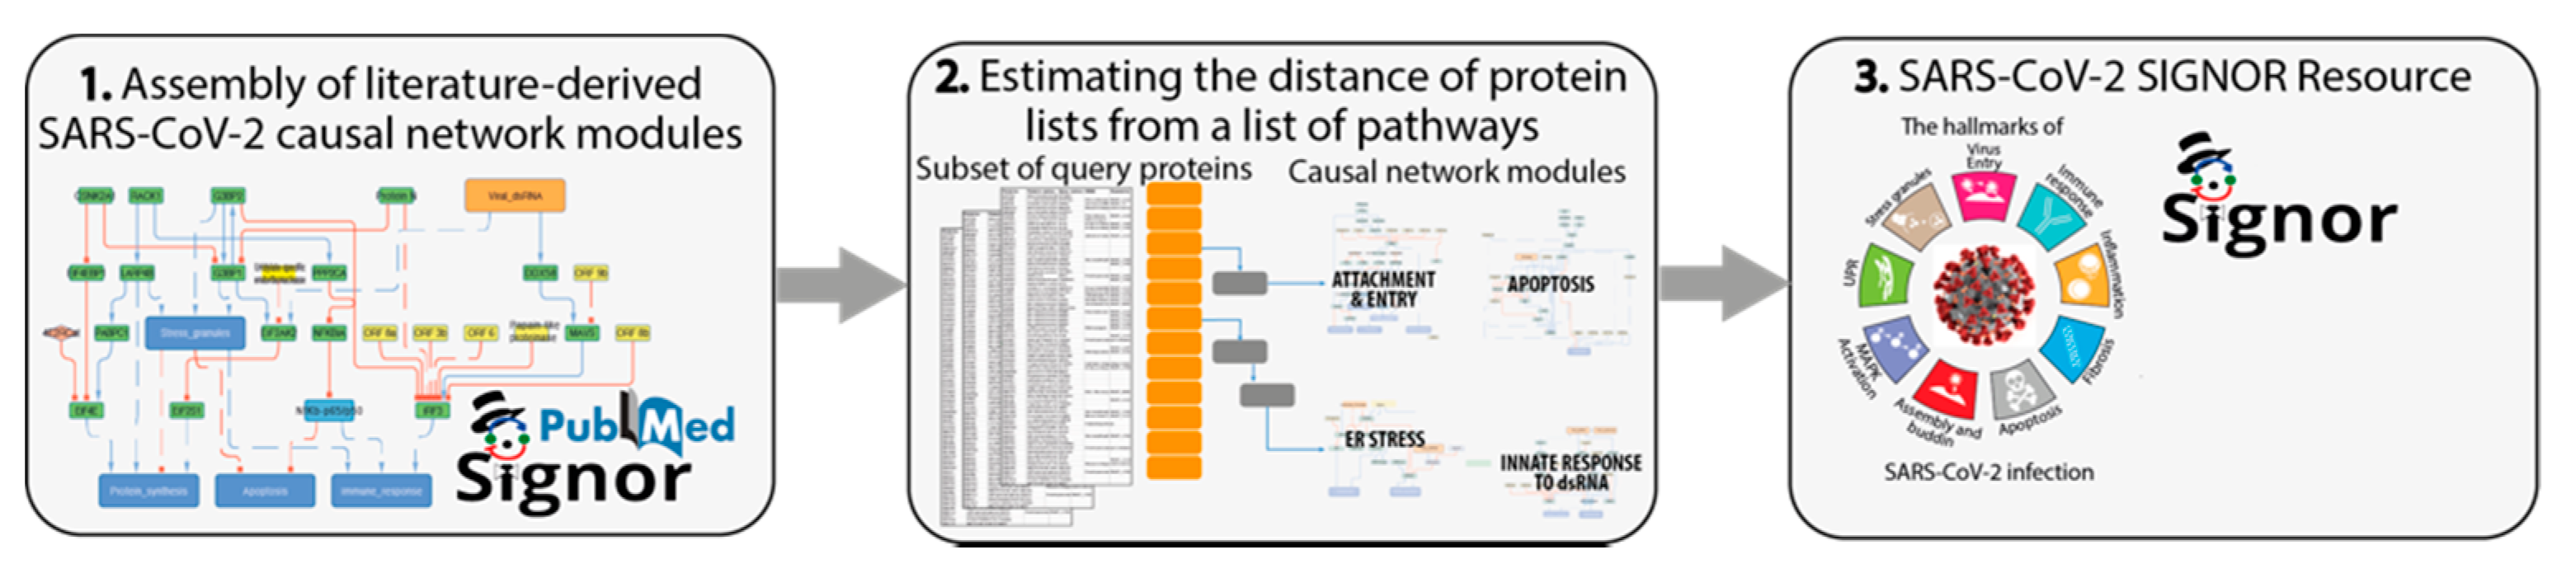
3.2. A Causal-Network Based Strategy
- Identify SARS-CoV-2 modulated pathways by mining the scientific literature. Capture reports that are relevant to shed light on the biology of SARS-CoV-2 infection and organize the information in network modules (pathways), according to the affected cellular phenotypes.
- Interpret the results of large-scale proteome-wide experiments by using graph algorithms to estimate the distance of a subset of query proteins from a list of pathways. This step enables us to evaluate which cellular functional modules are likely to be affected by each viral protein.
- Develop a freely-accessible web resource to offer users the possibility to explore the mechanisms underlying SARS-CoV-2 infection and the supporting experimental evidence.
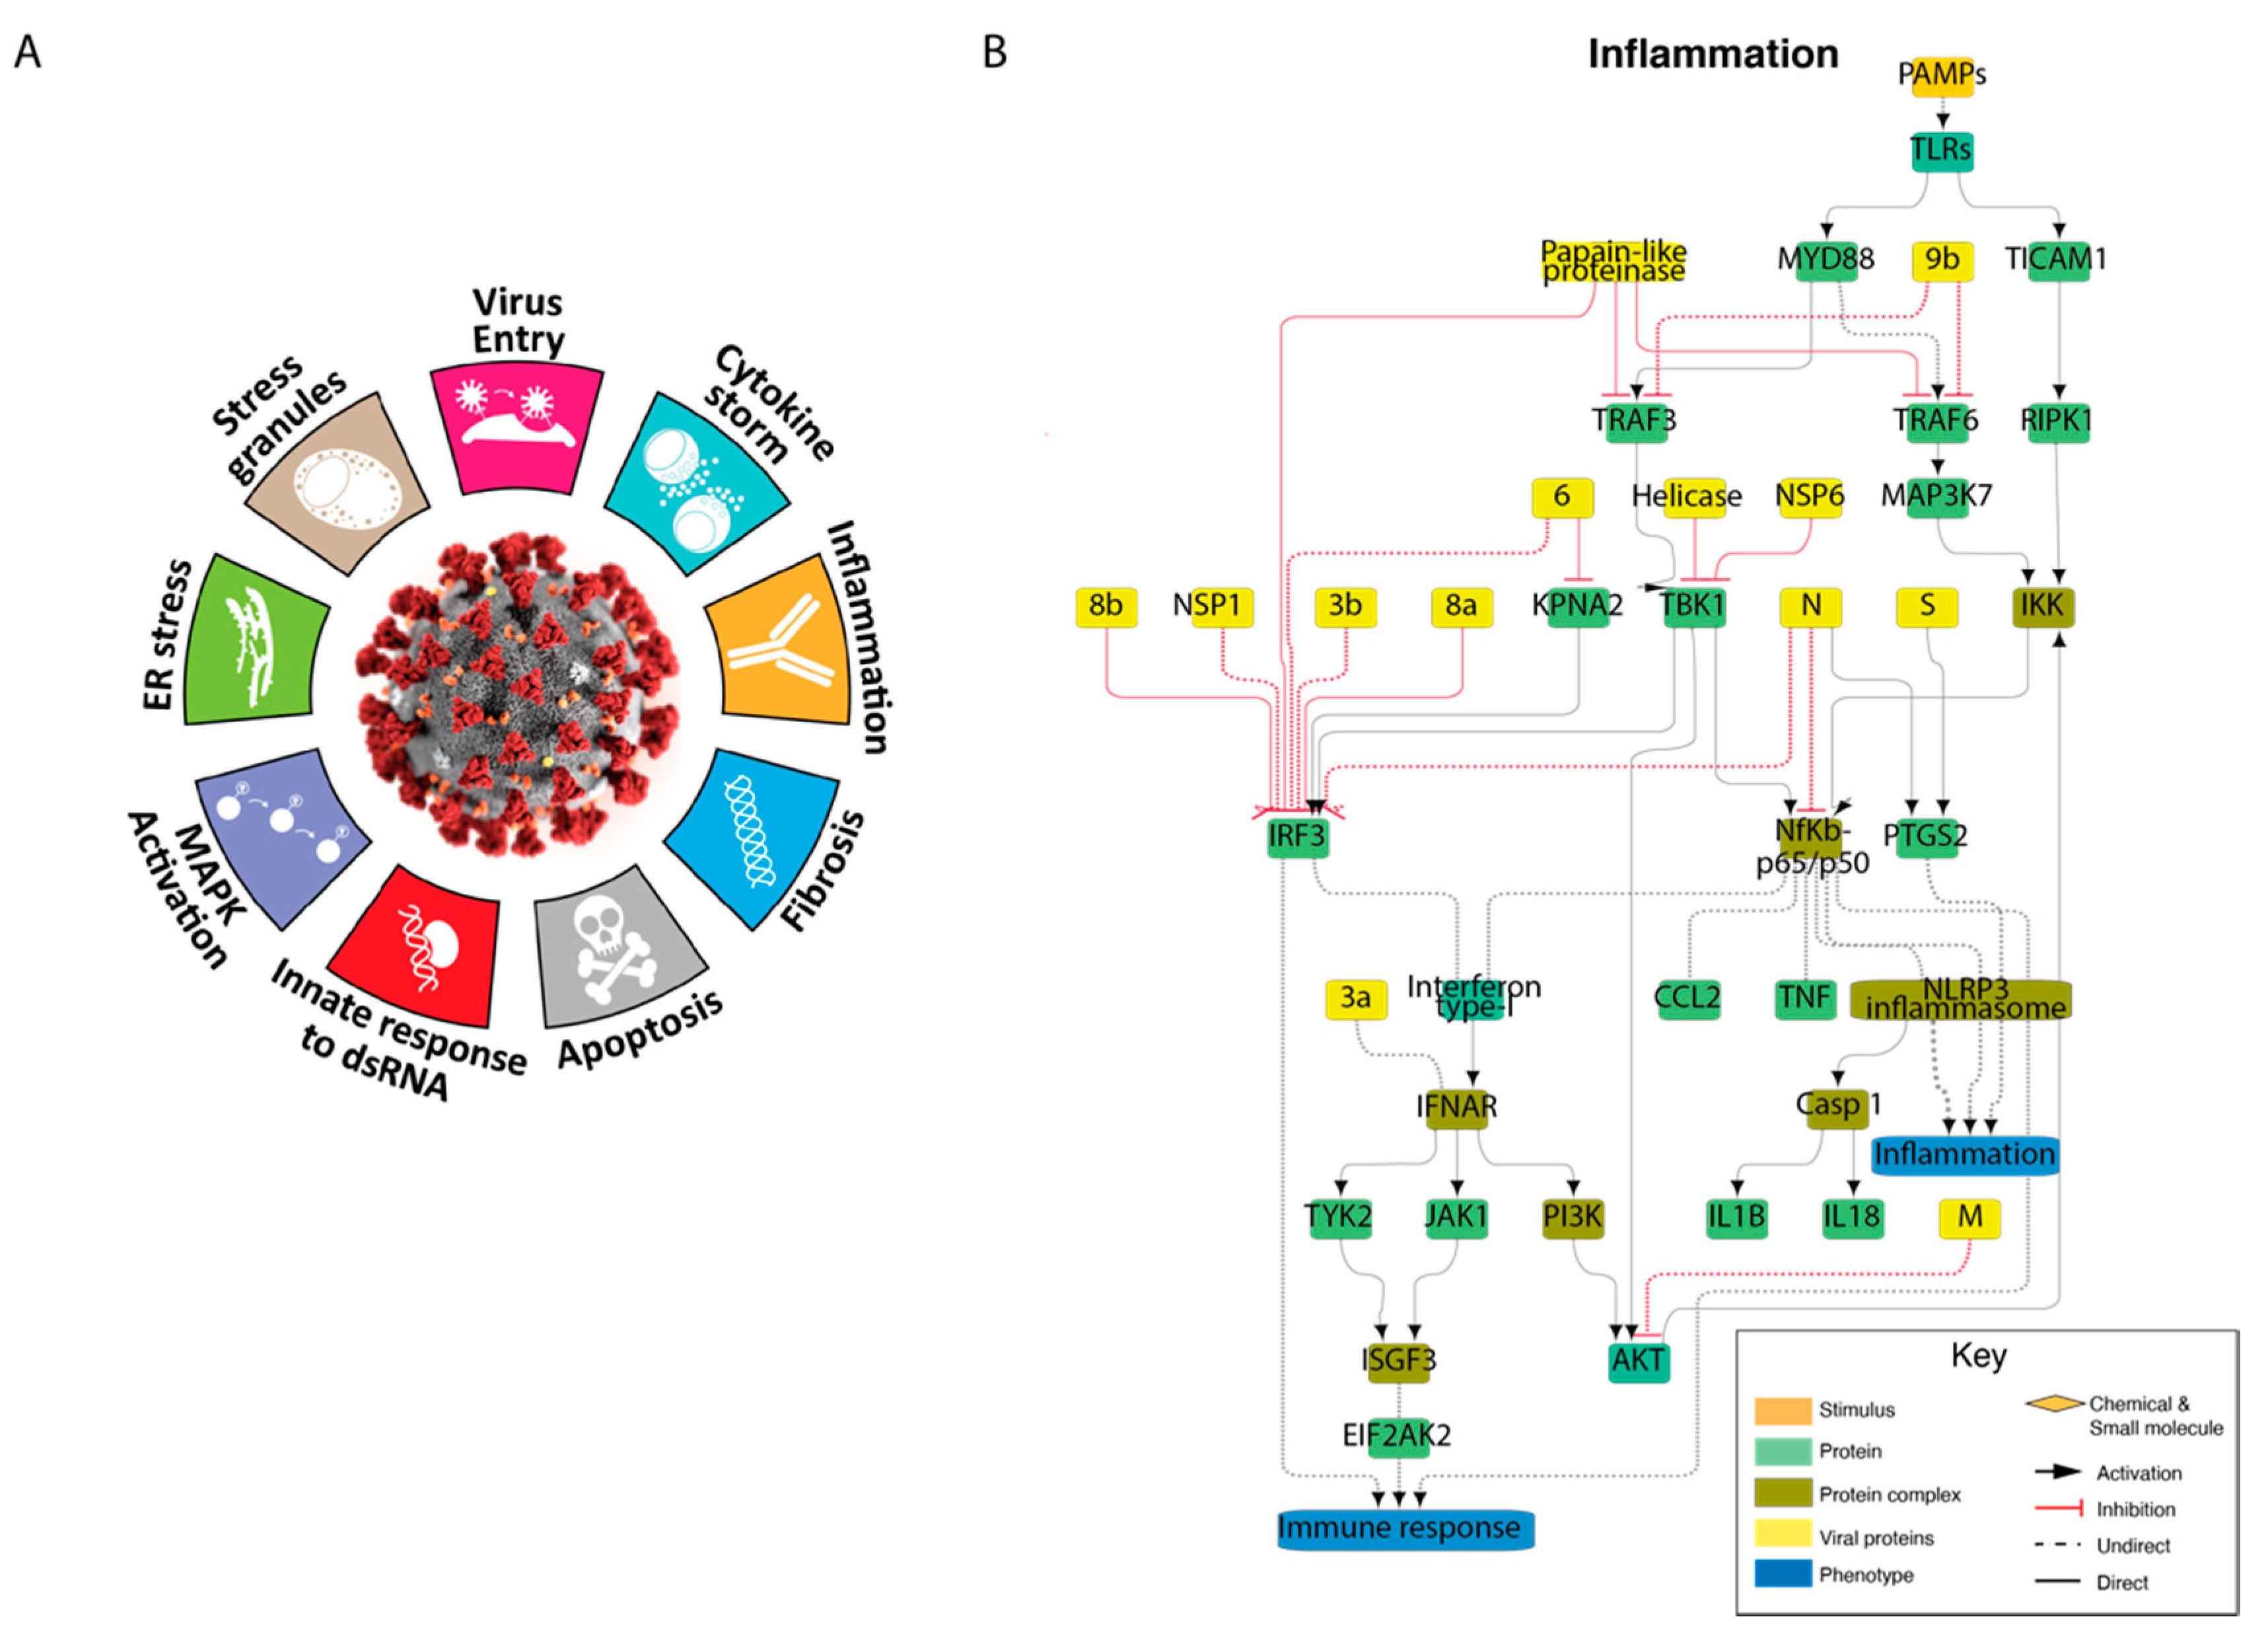
3.3. Cellular Pathways Perturbed by SARS-CoV-2 Infection: The COVID-19 Hallmark Phenotypes
3.4. Defining the Functional Distance of a Query Protein from a Pathway
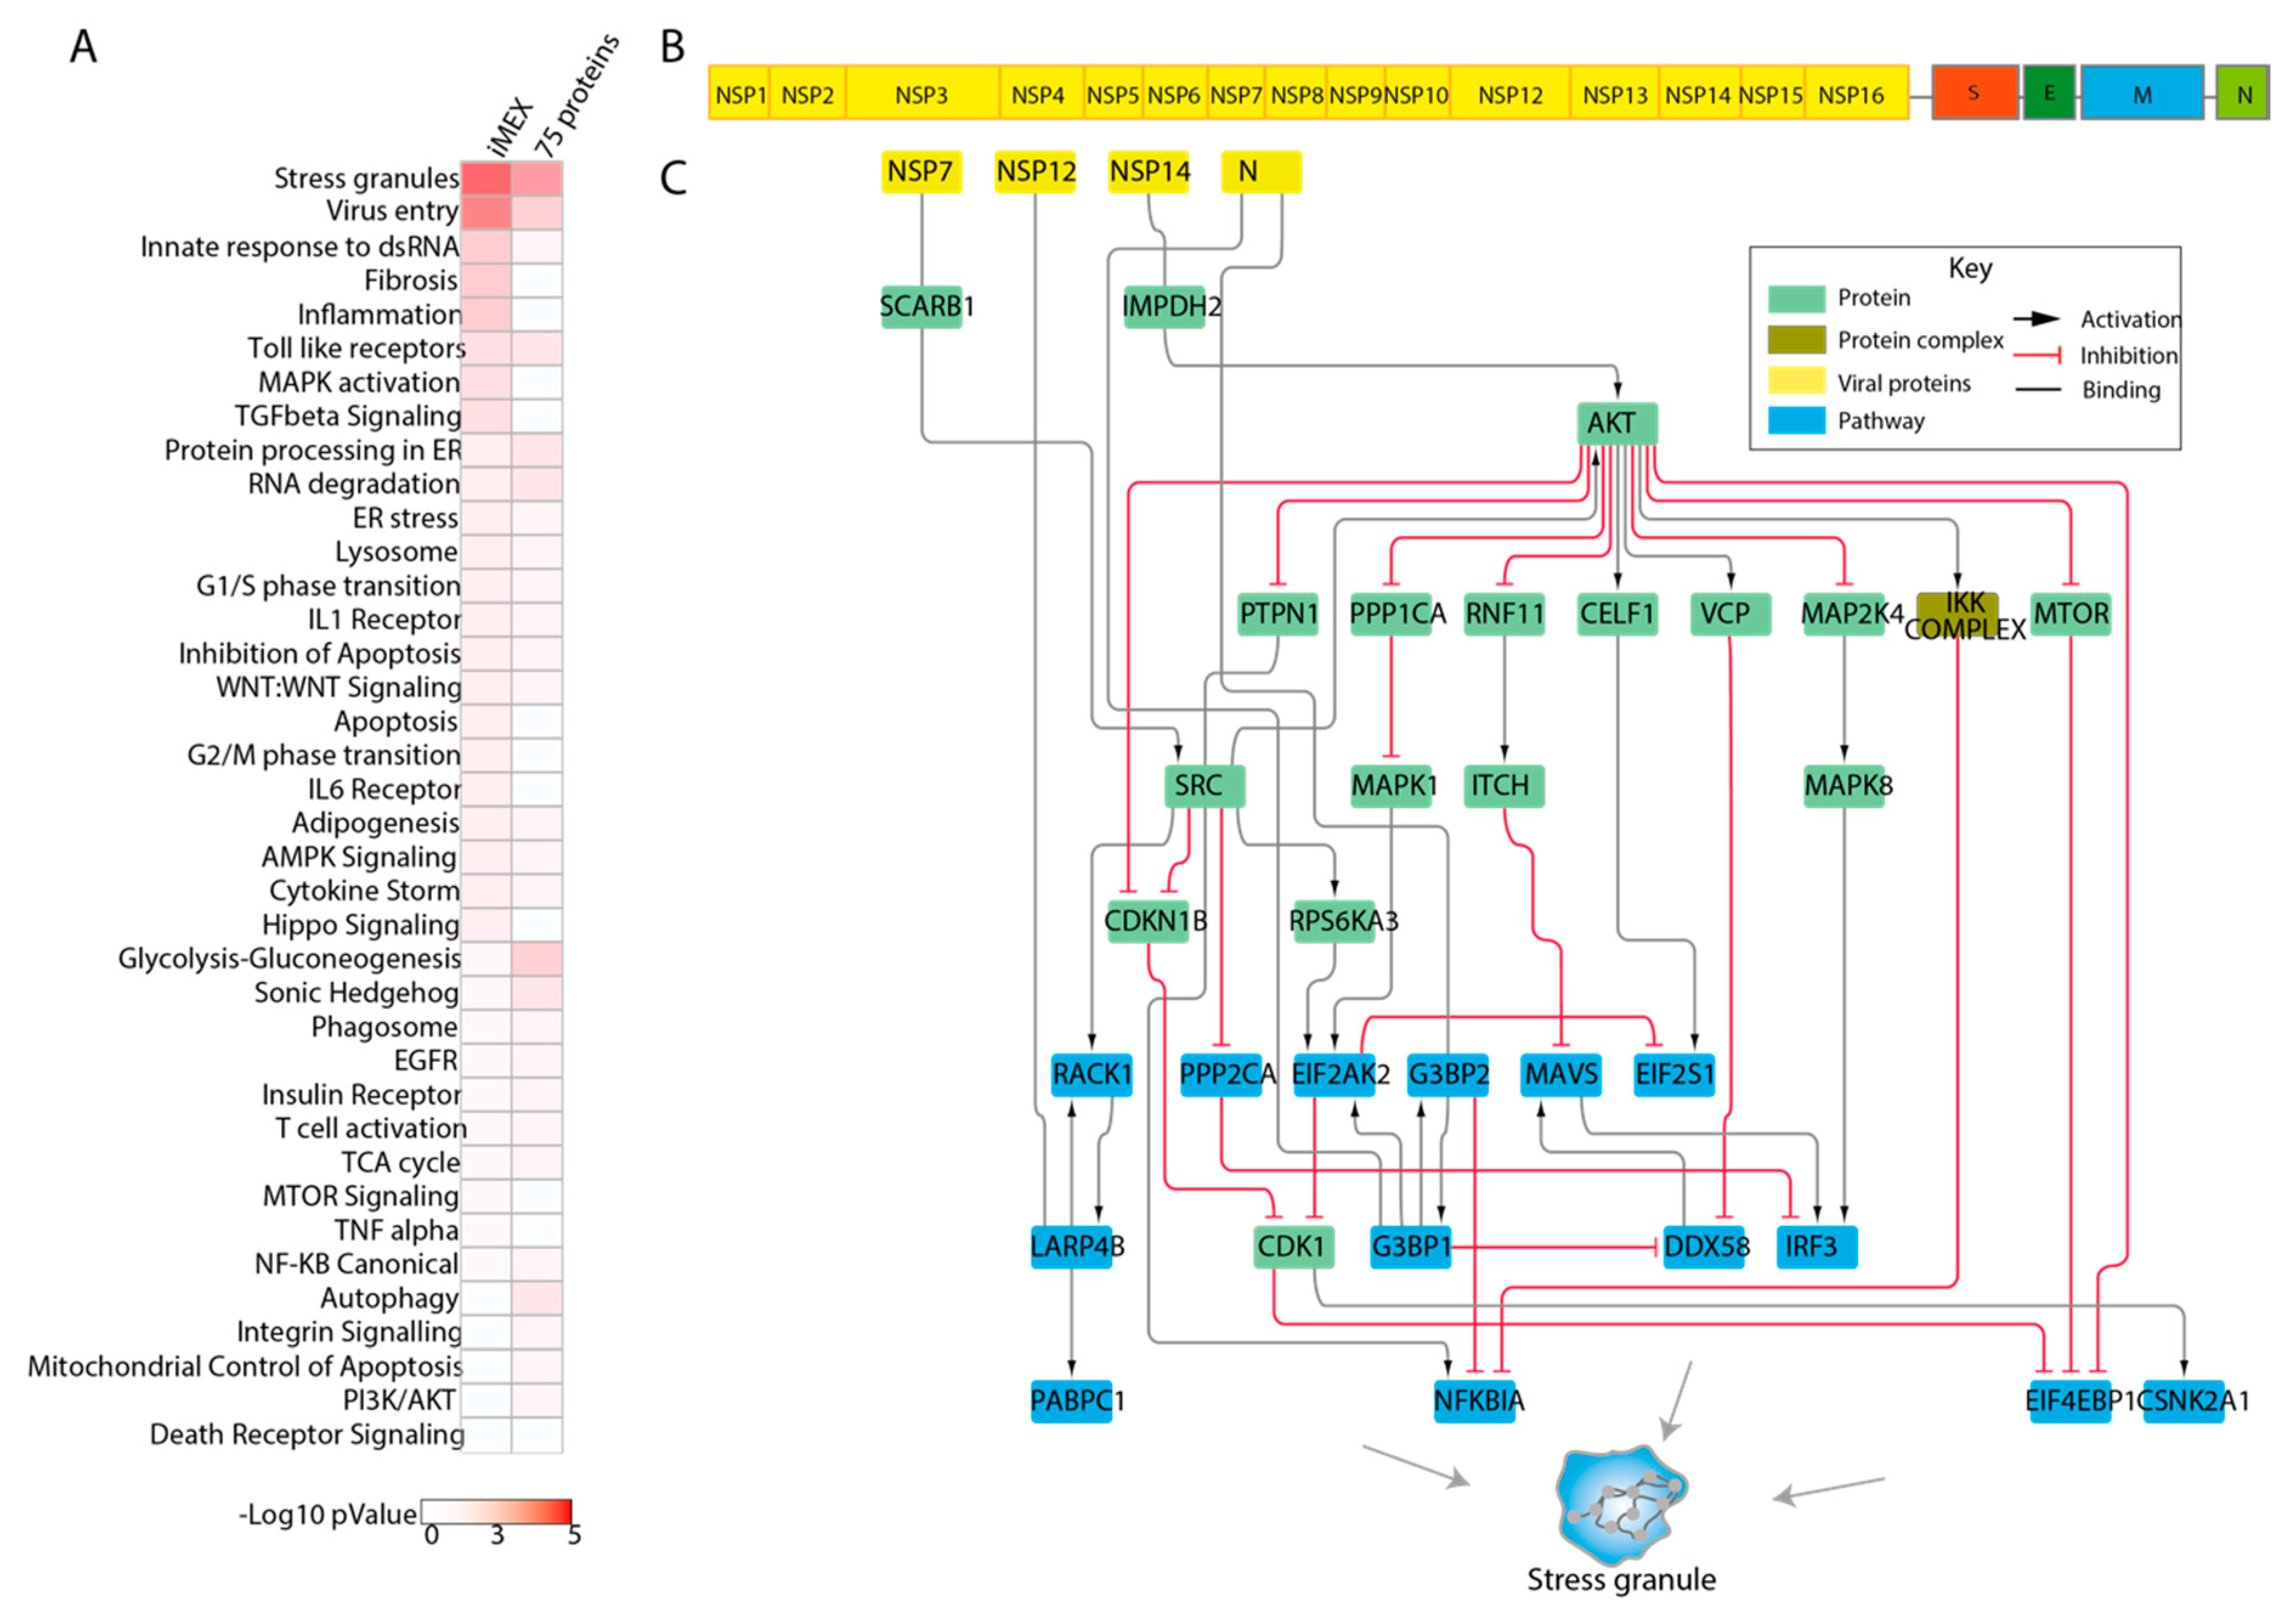
3.5. Genes Modulating Autophagy: A Test Case
3.6. Exploring the Function of SARS-CoV2 Interacting Proteins
4. Discussion
5. Conclusions
Supplementary Materials
Author Contributions
Funding
Institutional Review Board Statement
Informed Consent Statement
Conflicts of Interest
References
- Meckiff, B.J.; Ramirez-Suastegui, C.; Fajardo, V.; Chee, S.J.; Kusnadi, A.; Simon, H.; Grifoni, A.; Pelosi, E.; Weiskopf, D.; Sette, A.; et al. Single-Cell Transcriptomic Analysis of SARS-CoV-2 Reactive CD4 (+) T Cells. SSRN 2020. [Google Scholar] [CrossRef] [PubMed]
- Bojkova, D.; Klann, K.; Koch, B.; Widera, M.; Krause, D.; Ciesek, S.; Cinatl, J.; Munch, C. Proteomics of SARS-CoV-2-infected host cells reveals therapy targets. Nature 2020, 583, 469–472. [Google Scholar] [CrossRef] [PubMed]
- Gordon, D.E.; Jang, G.M.; Bouhaddou, M.; Xu, J.; Obernier, K.; White, K.M.; O’Meara, M.J.; Rezelj, V.V.; Guo, J.Z.; Swaney, D.L.; et al. A SARS-CoV-2 protein interaction map reveals targets for drug repurposing. Nature 2020, 583, 459–468. [Google Scholar] [CrossRef]
- Li, J.; Guo, M.; Tian, X.; Wang, X.; Yang, X.; Wu, P.; Liu, C.; Xiao, Z.; Qu, Y.; Yin, Y.; et al. Virus-Host Interactome and Proteomic Survey Reveal Potential Virulence Factors Influencing SARS-CoV-2 Pathogenesis. Med (NY) 2020, 2, 99–112.e7. [Google Scholar] [CrossRef]
- Stukalov, A.; Girault, V.; Grass, V.; Bergant, V.; Karayel, O.; Urban, C.; Haas, D.A.; Huang, Y.; Oubraham, L.; Wang, A.; et al. Multi-level proteomics reveals host-perturbation strategies of SARS-CoV-2 and SARS-CoV. bioRxiv 2020. [Google Scholar] [CrossRef]
- Subramanian, A.; Tamayo, P.; Mootha, V.K.; Mukherjee, S.; Ebert, B.L.; Gillette, M.A.; Paulovich, A.; Pomeroy, S.L.; Golub, T.R.; Lander, E.S.; et al. Gene set enrichment analysis: A knowledge-based approach for interpreting genome-wide expression profiles. Proc. Natl. Acad. Sci. USA 2005, 102, 15545–15550. [Google Scholar] [CrossRef] [Green Version]
- Khatri, P.; Sirota, M.; Butte, A.J. Ten Years of Pathway Analysis: Current Approaches and Outstanding Challenges. PLoS Comput. Biol. 2012, 8, e1002375. [Google Scholar] [CrossRef]
- Treveil, A.; Bohar, B.; Sudhakar, P.; Gul, L.; Csabai, L.; Olbei, M.; Poletti, M.; Madgwick, M.; Andrighetti, T.; Hautefort, I.; et al. ViralLink: An integrated workflow to investigate the effect of SARS-CoV-2 on intracellular signalling and regulatory pathways. PLoS Comput. Biol. 2021, 17, e1008685. [Google Scholar] [CrossRef]
- Agapito, G.; Pastrello, C.; Guzzi, P.H.; Jurisica, I.; Cannataro, M. BioPAX-Parser: Parsing and enrichment analysis of BioPAX pathways. Bioinformatics 2020, 36, 4377–4378. [Google Scholar] [CrossRef]
- Rubanova, N.; Pinna, G.; Kropp, J.; Campalans, A.; Radicella, J.P.; Polesskaya, A.; Harel-Bellan, A.; Morozova, N. MasterPATH: Network analysis of functional genomics screening data. BMC Genom. 2020, 21, 1–12. [Google Scholar] [CrossRef]
- Licata, L.; Surdo, P.L.; Iannuccelli, M.; Palma, A.; Micarelli, E.; Perfetto, L.; Peluso, D.; Calderone, A.; Castagnoli, L.; Cesareni, G. SIGNOR 2.0, the SIGnaling Network Open Resource 2.0: 2019 update. Nucleic Acids Res. 2019, 48, D504–D510. [Google Scholar] [CrossRef] [PubMed]
- Battagello, D.S.; Dragunas, G.; Klein, M.O.; Ayub, A.L.P.; Velloso, F.J.; Correa, R.G. Unpuzzling COVID-19: Tissue-related signaling pathways associated with SARS-CoV-2 infection and transmission. Clin. Sci. (Lond.) 2020, 134, 2137–2160. [Google Scholar] [CrossRef]
- Hussman, J.P. Cellular and Molecular Pathways of COVID-19 and Potential Points of Therapeutic Intervention. Front. Pharmacol. 2020, 11, 1169. [Google Scholar] [CrossRef] [PubMed]
- Fung, T.S.; Liu, D.X. Human Coronavirus: Host-Pathogen Interaction. Annu. Rev. Microbiol. 2019, 73, 529–557. [Google Scholar] [CrossRef] [Green Version]
- Hagberg, A.A.; Swart, P. Exploring network structure, dynamics, and function using Network. In Proceedings of the 7th Python in Science Conference, Pasadena, CA, USA, 19–24 August 2008; Available online: http://conference.scipy.org/proceedings/SciPy2008/paper_2/ (accessed on 25 February 2021).
- Mlecnik, B.; Galon, J.; Bindea, G. Automated exploration of gene ontology term and pathway networks with ClueGO-REST. Bioinformatics 2019, 35, 3864–3866. [Google Scholar] [CrossRef] [PubMed]
- Shenoy, S. Coronavirus (Covid-19) sepsis: Revisiting mitochondrial dysfunction in pathogenesis, aging, inflammation, and mortality. Inflamm. Res. 2020, 69, 1–9. [Google Scholar] [CrossRef]
- Goud, P.T.; Bai, D.; Abu-Soud, H.M. A Multiple-Hit Hypothesis Involving Reactive Oxygen Species and Myeloperoxidase Ex-plains Clinical Deterioration and Fatality in COVID-19. Int. J. Biol. Sci. 2021, 17, 62–72. [Google Scholar] [CrossRef]
- Ellison-Hughes, G.M.; Colley, L.; O’Brien, K.A.; Roberts, K.A.; Agbaedeng, T.A.; Ross, M.D. The Role of MSC Therapy in At-tenuating the Damaging Effects of the Cytokine Storm Induced by COVID-19 on the Heart and Cardiovascular System. Front. Cardiovasc. Med. 2020, 7, 602183. [Google Scholar] [CrossRef] [PubMed]
- Saleh, J.; Peyssonnaux, C.; Singh, K.K.; Edeas, M. Mitochondria and microbiota dysfunction in COVID-19 pathogenesis. Mitochondrion 2020, 54, 1–7. [Google Scholar] [CrossRef]
- Jassal, B.; Matthews, L.; Viteri, G.; Gong, C.; Lorente, P.; Fabregat, A.; Sidiropoulos, K.; Cook, J.; Gillespie, M.; Haw, R.; et al. The reactome pathway knowledgebase. Nucleic Acids Res. 2020, 48, D498–D503. [Google Scholar] [CrossRef]
- Kanehisa, M.; Furumichi, M.; Sato, Y.; Ishiguro-Watanabe, M.; Tanabe, M. KEGG: Integrating viruses and cellular organisms. Nucleic Acids Res. 2021, 49, D545–D551. [Google Scholar] [CrossRef]
- Hanahan, D.; Weinberg, R.A. Hallmarks of Cancer: The Next Generation. Cell 2011, 144, 646–674. [Google Scholar] [CrossRef] [Green Version]
- Moosa, M.M.; Banerjee, P.R. Subversion of host stress granules by coronaviruses: Potential roles of pi-rich disordered domains of viral nucleocapsids. J. Med. Virol. 2020, 92, 2891–2893. [Google Scholar] [CrossRef] [PubMed]
- Miller, K.; McGrath, M.E.; Hu, Z.; Ariannejad, S.; Weston, S.; Frieman, M.; Jackson, W.T. Coronavirus interactions with the cellular autophagy machinery. Autophagy 2020, 16, 2131–2139. [Google Scholar] [CrossRef] [PubMed]
- Luo, L.; Li, Z.; Zhao, T.; Ju, X.; Ma, P.; Jin, B.; Zhou, Y.; He, S.; Huang, J.; Xu, X.; et al. SARS-CoV-2 nucleocapsid protein phase sepa-rates with G3BPs to disassemble stress granules and facilitate viral production. Sci. Bull. (Beijing) 2021, in press. [Google Scholar] [CrossRef] [PubMed]
- Codo, A.C.; DaVanzo, G.G.; Monteiro, L.B.; Souza, G.; Muraro, S.; Carregari, V.; Biagi, C.; Crunfli, F.; Restrepo, J.; Vendramini, P.; et al. Elevated Glucose Levels Favor Sars-Cov-2 Infection and Monocyte Response Through a Hif-1α/Glycolysis Dependent Axis. Cell Metab. 2020, 32, 437–446.e5. [Google Scholar] [CrossRef]
- Unal, M.A.; Bitirim, C.V.; Summak, G.Y.; Bereketoglu, S.; Zeytin, I.C.; BesbInar, O.; Gurcan, C.; Aydos, D.; Goksoy, E.; Kocakaya, E.; et al. Ribavirin shows antiviral activity against SARS-CoV-2 and downregulates the activity of TMPRSS2 and the expres-sion of ACE2 In Vitro. Can. J. Physiol. Pharmacol. 2021. [Google Scholar] [CrossRef] [PubMed]
- Saijo, M.; Morikawa, S.; Fukushi, S.; Mizutani, T.; Hasegawa, H.; Nagata, N.; Iwata, N.; Kurane, I. Inhibitory effect of mizo-ribine and ribavirin on the replication of severe acute respiratory syndrome (SARS)-associated coronavirus. Antiviral. Res. 2005, 66, 159–163. [Google Scholar] [CrossRef]
- Baggen, J.; Persoons, L.; Vanstreels, E.; Jansen, S.; van Looveren, D.; Boeckx, B.; Geudens, V.; de Man, J.; Jochmans, D.; Wau-ters, J.; et al. Genome-wide CRISPR screening identifies TMEM106B as a proviral host factor for SARS-CoV-2. Nat. Genet. 2021. [Google Scholar] [CrossRef]
- Daniloski, Z.; Jordan, T.X.; Wessels, H.H.; Hoagland, D.A.; Kasela, S.; Legut, M.; Maniatis, S.; Mimitou, E.P.; Lu, L.; Geller, E.; et al. Identification of Required Host Factors for SARS-CoV-2 Infection in Human Cells. Cell 2021, 184, 92–105.e16. [Google Scholar] [CrossRef]
- Wang, R.; Simoneau, C.R.; Kulsuptrakul, J.; Bouhaddou, M.; Travisano, K.A.; Hayashi, J.M.; Carlson-Stevermer, J.; Zengel, J.R.; Richards, C.M.; Fozouni, P.; et al. Genetic Screens Identify Host Factors for SARS-CoV-2 and Common Cold Coronaviruses. Cell 2021, 184, 106–119.e14. [Google Scholar] [CrossRef] [PubMed]
- Perfetto, L.; Pastrello, C.; Del-Toro, N.; Duesbury, M.; Iannuccelli, M.; Kotlyar, M.; Licata, L.; Meldal, B.; Panneerselvam, K.; Panni, S.; et al. The IMEx coronavirus interactome: An evolving map of Coronaviridae–host molecular interactions. Database 2020, 2020. [Google Scholar] [CrossRef] [PubMed]
- Ostaszewski, M.; Niarakis, A.; Mazein, A.; Kuperstein, I.; Phair, R.; Orta-Resendiz, A.; Singh, V.; Aghamiri, S.S.; Acencio, M.L.; Glaab, E.; et al. COVID-19 Disease Map, a computational knowledge repository of SARS-CoV-2 virus-host interaction mechanisms. bioRxiv 2020. [Google Scholar] [CrossRef]
- Sacco, F.; Perfetto, L.; Cesareni, G. Combining Phosphoproteomics Datasets and Literature Information to Reveal the Functional Connections in a Cell Phosphorylation Network. Proteomics 2018, 18, e1700311. [Google Scholar] [CrossRef] [PubMed]


Publisher’s Note: MDPI stays neutral with regard to jurisdictional claims in published maps and institutional affiliations. |
© 2021 by the authors. Licensee MDPI, Basel, Switzerland. This article is an open access article distributed under the terms and conditions of the Creative Commons Attribution (CC BY) license (http://creativecommons.org/licenses/by/4.0/).
Share and Cite
Perfetto, L.; Micarelli, E.; Iannuccelli, M.; Lo Surdo, P.; Giuliani, G.; Latini, S.; Pugliese, G.M.; Massacci, G.; Vumbaca, S.; Riccio, F.; et al. A Resource for the Network Representation of Cell Perturbations Caused by SARS-CoV-2 Infection. Genes 2021, 12, 450. https://0-doi-org.brum.beds.ac.uk/10.3390/genes12030450
Perfetto L, Micarelli E, Iannuccelli M, Lo Surdo P, Giuliani G, Latini S, Pugliese GM, Massacci G, Vumbaca S, Riccio F, et al. A Resource for the Network Representation of Cell Perturbations Caused by SARS-CoV-2 Infection. Genes. 2021; 12(3):450. https://0-doi-org.brum.beds.ac.uk/10.3390/genes12030450
Chicago/Turabian StylePerfetto, Livia, Elisa Micarelli, Marta Iannuccelli, Prisca Lo Surdo, Giulio Giuliani, Sara Latini, Giusj Monia Pugliese, Giorgia Massacci, Simone Vumbaca, Federica Riccio, and et al. 2021. "A Resource for the Network Representation of Cell Perturbations Caused by SARS-CoV-2 Infection" Genes 12, no. 3: 450. https://0-doi-org.brum.beds.ac.uk/10.3390/genes12030450